Abstract
A scientifically systematic credit evaluation system serves as a crucial safeguard mechanism for maintaining a healthy business environment in the construction market, effectively regulating industry entities’ behaviors and promoting ecosystem optimization. Current credit risk assessment relies excessively on financial data, neglecting the importance of corporate operational conditions. This study focuses on constructing a credit risk assessment model for construction general contractors. Innovatively incorporating both short-term financial status and long-term operational development factors, the research integrates grey relational analysis with a two-dimensional cloud model to establish a comprehensive credit risk assessment system featuring visualization of evaluation results. The methodology involves three key steps: (1) establishing a dual-dimensional credit risk indicator system covering financial and operational aspects; (2) determining risk factor weights through grey relational analysis and generating three-dimensional cloud diagrams using reverse cloud generators; (3) visualizing corporate credit risk levels through cloud mapping. Empirical analysis of representative Contractor A, utilizing Wind Financial Database data and field research, demonstrates the model’s significant advantages in critical risk factor identification and comprehensive credit risk assessment.
1. Introduction
Corporate default represents a relatively common market phenomenon. The associated contagion of credit risk within interconnected enterprise networks can trigger a domino effect, potentially precipitating credit risk incidents across multiple correlated entities [1]. Moreover, the systemic and complex impacts stemming from default events, amplified by the deep involvement of financial institutions, such as banks, may elevate the proliferation of credit risk contagion, ultimately engendering severe socioeconomic repercussions [2].
The construction industry, as a critical pillar industry in the global economy, has its credit risk management mechanisms directly influencing regional economic development outcomes. The World Bank 2023 Report indicates that annual losses in global engineering contracting markets due to credit defaults amount to $218 billion, with 67% of these losses originating from deficiencies in contractors’ contractual performance capabilities [3]. Furthermore, Stand & Poor’s (S&P) Global Ratings forecasts that while the overall credit quality of the construction industry will remain stable in 2025, the primary risk concentration lies with entities in the ‘B’-rated category. The agency also anticipates a weakening of the sector’s credit quality in 2025.Concurrently, governments and international organizations are intensifying their support for credit management within the construction sector [4]. For instance, construction industry regulatory authorities across Chinese provinces and municipalities have progressively introduced relevant credit management policies in recent years. These measures aim to foster a healthy business environment and provide institutional safeguards for the sustainable development of the industry. Against this backdrop, establishing a scientifically sound credit assessment system for construction contractors has emerged as a crucial scientific challenge requiring urgent resolution in both construction engineering and credit management disciplines.
As core participants in construction activities, the contractual performance of construction contractors fundamentally determines the final delivery quality of project outcomes. Research by the International Federation of Consulting Engineers (FIDIC) demonstrates that each downgrade in contractor credit ratings increases the probability of project delays by 41% and elevates quality incident rates by 29%. However, existing credit assessment models exhibit significant limitations in construction applications. Their analytical frameworks predominantly rely on financial indicators to evaluate contractors’ solvency, failing to adequately incorporate the dynamic nature of construction markets and the decisive impact of operational management on credit worthiness. For instance, should a construction contractor demonstrate operational negligence after project award, it may trigger quality defects and schedule overruns. Such failures can subsequently lead to contractual default, ultimately impairing the firm’s credit standing. Nevertheless, these operational-triggered credit risk events often remain undetected and unevaluated within prevailing credit rating systems, resulting in distorted assessment outcomes.
To address these challenges, this study proposes an innovative credit assessment paradigm integrating traditional credit evaluation frameworks with construction-specific considerations. By accounting for enterprises’ short-term financial attributes and medium-to-long-term operational dynamics, this study reconstructed a credit assessment system encompassing financial and operational dimensions. This framework further incorporates two-dimensional cloud modeling and grey correlation analysis, enabling three-dimensional visualization techniques for credit risk profiling and precise tracking and identification of critical risk factors.
2. Literature Review
2.1. Research on Credit Risk Assessment Models
Discriminant Analysis was initially pioneered by Fisher [5]. Subsequently, this methodology has been continuously applied to the development of evaluation models across diverse disciplines. By 1974, discriminant analysis had gradually been applied to credit risk assessment, including linear discriminant analysis (LDA) and multivariate discriminant analysis (MDA). These methods focus on selecting financial indicators that capture critical credit information to build discriminant models, aiming to identify optimal linear combinations for classifying creditworthiness. Notably, Durand [6] employed this approach to study non-performing loans, and it remains a key tool for institutions like S&P and Moody’s. Subsequently, Beaver [7] introduced an innovative model combining univariate analysis of corporate bankruptcy with financial ratios to establish borrower default criteria. Much subsequent research expanded on this foundation. For example, Altman [8] developed the Z-Score model using MDA for comprehensive credit risk evaluation. Serrano-Cinca [9] applied partial least squares discriminant analysis to predict credit risk in U.S. banks. While discriminant analysis offers simplicity, low cost, and reasonable effectiveness, its limitations—such as requiring linear relationships between variables and normal distribution assumptions—restrict its practical utility.
Another traditional statistical method, logistic regression, is widely used in financial institutions. Unlike discriminant analysis, it does not require normal distribution assumptions and offers stable performance. Berkson [10] first proposed logistic regression in the 1940s, and later studies extensively applied it to predict corporate default probabilities, with comparative research confirming its superiority over alternatives [11]. However, despite its interpretability and stability, logistic regression lags behind machine learning models like random forests and support vector machines (SVMs) in accuracy, particularly with high-dimensional data.
Common machine learning models, including random forests, SVMs, and ensemble methods, address many limitations of statistical approaches. SVMs excel in handling high-dimensional, small-sample data, and their introduction to financial research sparked significant interest. Ghodselahi et al. demonstrated SVMs’ strong predictive performance using German credit data, though noting their computational complexity. Chuang [12] enhanced classification accuracy by integrating ant colony optimization with SVMs, while Akkoc [13] developed a three-stage hybrid model using adaptive neuro-fuzzy inference systems.
Non-parametric models like decision trees, clustering algorithms, and Bayesian networks have also achieved notable results. Orlovs [14] highlighted the maturity of clustering methods in credit risk assessment, and Guestrin [15] demonstrated the superiority of XGBoost in ensemble learning. A. Aatsiou [16] applied genetic algorithms, and Weber [17] validated Bayesian networks for corporate credit risk prediction.
2.2. Research on Credit Risk Factors
Credit risk characteristics describe and assess the credit attributes of entities while analyzing the implicit credit information underlying risks, thereby comprehensively profiling the credit portrait of research subjects. Effective mining of credit risk factors enables financial institutions to accurately determine the default status of client entities, which simultaneously serves as the criterion for evaluating the success of risk factor mining. Consequently, to enhance the accuracy of credit risk assessment models, research on analyzing and extracting credit risk characteristics has emerged successively.
Amidst the rapid advancement of big data technology, data dimensionality and massive datasets have witnessed explosive growth across research domains. Quantitative research on credit risk represents a current focal point. However, unlike traditional small-sample data features, feature selection for credit risk in the information era faces challenges of explosive data dimensionality and massive data volume. In scenarios involving tens of thousands of data points, issues such as high dimensionality, poor data quality, and noise significantly increase computational costs for classification algorithms. Selecting relevant features for target problems from numerous redundant characteristics has thus become an urgent challenge, giving rise to feature selection methods. Common approaches employ search strategies and evaluation criteria to select feature subsets, eliminating weakly correlated redundant features. This establishes a solid foundation for preliminary risk assessment modeling while enhancing model applicability and interpretability.
From a quantification perspective, feature selection methods fall into qualitative and quantitative categories. Qualitative credit risk feature selection relies on domain expertise, with prevalent frameworks including the 5C, 5P, and 5W methods—the 5C approach being most widely adopted. Despite its longstanding academic application, efficiency, and versatility, qualitative methods increasingly fail to meet modern corporate credit research demands as big data proliferates, yielding diverse and complex credit characteristics. Addressing this gap, quantitative credit risk feature selection methods have gained prominence.
Lu [18] et al. employed text analysis to extract information from corporate news reports, effectively identifying credit default risk factors of target enterprises. Their findings demonstrate that this approach enhances the accuracy of credit risk assessments. Similarly, Cathcart et al. [19] collected nearly 10 years of news coverage of target firms and applied a dictionary-based approach to identify and extract credit-relevant information for corporate risk analysis. Their research confirms that this methodology positively contributes to accurate credit risk evaluation. Kabir [20] et al. developed a neural network-based predictive method that accounts for inter-feature correlations among credit risk characteristics, achieving optimal prediction accuracy through the selection of highly relevant credit risk factors. Concurrently, Bermejo [21] constructed a model employing Naïve Bayes to significantly enhance the efficiency of credit risk feature selection. Khoshgoftaar et al. [22] conducted preliminary screening of credit risk features and subsequently employed support vector machine (SVM) classification to categorize, identify, and extract features demonstrating superior predictive performance. This process ultimately established a risk indicator framework tailored for credit risk assessment. Concurrently, Julio et al. [23] proposed a profit-centric corporate credit risk evaluation framework, implementing penalty-based feature selection strategies to substantially improve the efficiency of credit risk analysis. Stjepan [24] employed a genetic algorithm (GA) to search for and optimize the optimal credit risk feature subset, subsequently constructing a neural network model leveraging this foundation to achieve precise credit risk prediction.
2.3. Survey of Literature
In summary, academic research on credit risk assessment for general contracting construction enterprises is progressively transitioning from qualitative analysis to quantitative analysis based on big data. Concurrently, quantitative methodologies have evolved from initial reliance on traditional statistical data analysis towards the current paradigm utilizing artificial intelligence algorithms—such as machine learning and deep learning—to process high-dimensional, complex data within a big data context. The key points are as follows:
(1) Credit Risk Characteristics: Academic discourse on corporate credit primarily centers on solvency. Consequently, research on credit risk characteristics in construction enterprises focuses heavily on financial indicators, with insufficient attention paid to non-financial indicators. Furthermore, existing studies on non-financial indicators predominantly rely on qualitative expert evaluations, lacking objective data collection and processing methods. This results in significant subjectivity within current credit evaluation systems.
(2) Credit Risk Assessment Models: Research and practice in credit risk assessment models for construction enterprises have undergone a distinct evolution: starting from rudimentary methods dependent on expert judgment and traditional statistics; progressing to industry analysis based on financial mathematical models; advancing to the application of AI algorithms leveraging big data; and culminating in the current use of sophisticated mathematical models like deep learning and reinforcement learning. However, in today’s era of data explosion, the performance of single models struggles to meet the demands of increasingly complex market dynamics and inter-firm relationships, which drive dynamic credit risk fluctuations. This often leads to the practical dilemma of balancing model stability against predictive accuracy. Therefore, current academic research prioritizes refining single models to enhance prediction precision while ensuring stability. This focus has spurred the emergence of integrated reinforcement learning and deep learning models, aimed at boosting model performance and generalization capability. Additionally, the inherent issue of class imbalance in indicator data must be addressed when building these models. Consequently, exploring model architectures capable of handling high-dimensional data while effectively tackling its complexity and imbalance has become a critical research direction in credit risk assessment modeling.
In light of the above, this study builds upon traditional financial indicators by incorporating influential non-financial indicators. It conducts an in-depth analysis of the credit risk status of construction enterprises from both financial and operational dimensions. For model development, aiming to ensure model accuracy while aligning with the dual-dimensional (financial and operational) credit indicator framework proposed in this research, we adopt a hybrid approach integrating Grey Relational Analysis (GRA) and a Two-Dimensional Cloud Model. This methodology forms the foundation for constructing the credit risk assessment model framework for construction enterprises.
3. Research Methodology
3.1. Credit Risk Evaluation Indicator System
The construction industry exhibits typical characteristics including capital-intensive operations, strong policy sensitivity, and complex industrial chain coordination, which make corporate financial stability and operational efficiency dual pillars against market fluctuations. Regarding credit risk evaluation system construction, the “Dual-Dimensional Analysis Method” proposed by international authoritative rating agencies Standard & Poor’s (S&P Global Ratings) and Moody’s has established an industry benchmark. This method quantifies short-term solvency through financial indicators while combining operational indicators to predict strategic sustainability, effectively establishing a credit risk evaluation mechanism for construction enterprises.
Building upon systematic review of domestic and international credit risk assessment literature [25,26,27,28,29,30,31,32,33,34], this study innovatively introduces two-dimensional cloud model technology. This model achieves dynamic coupling analysis of financial and operational risk indicators through membership degree functions, overcoming limitations of traditional static evaluations. Compared with conventional risk rating frameworks, the financial dimension enables real-time reflection of corporate liquidity risks, while the operational dimension focuses on policy adaptability and supply chain coordination elements, emphasizing medium-to-long-term development resilience. This integrated evaluation framework combining actual financial conditions with medium-to-long-term developmental impacts provides construction contractors with a credit risk diagnostic tool featuring both timeliness and foresight. The risk indicators are shown in the following Table 1.

Table 1.
Credit Risk Factors of Construction Contracting Enterprises.
3.2. Credit Risk Assessment Framework
The traditional credit risk assessment research primarily focuses on corporate financial status as the core element, delving into aspects such as the enterprise’s market debt repayment capacity, while lacking in-depth analysis of corporate operational capabilities. This study addresses credit management issues in the construction industry, specifically targeting construction contractors the core contractual entities in construction projects as the primary research subjects. Innovatively analyzing credit risk characteristic elements from both financial and operational dimensions, this study established an evaluation system by integrating grey relational analysis with a two-dimensional cloud model. This approach effectively combines dual-dimensional risk characteristics with model features, achieving three-dimensional visualization of contractors credit risk status. The technical roadmap of this research is as follows.
(1) Construction of credit risk standard cloud map: The standard cloud is constructed based on established evaluation criteria and corresponding digital characteristics. The evaluation criteria require risk level classification from both financial risk and operational risk dimensions, which are characterized by linguistic descriptions and corresponding quantized segmented scores. The ALARP risk criterion is applied to determine the comprehensive risk level. Currently, credit risk is divided into five levels: high risk, relatively high risk, moderate risk, relatively low risk, and low risk, corresponding to quantized segmented scores [0–10]. To reduce the subjectivity of manual risk level classification, the boundary values of the quantized interval [,] are defined such that their membership degrees belong equally to two adjacent risk levels, as shown in Equation (1). Consequently, . In this context, ‘Acceptable Risk’ is defined as the maximum level of risk that can be tolerated without compromising the objectives; the ‘ALARP Zone (As Low As Reasonably Practicable)’ refers to the risk region between the acceptable and unacceptable zones, where risks can and should be managed and controlled through appropriate measures to prevent escalation; and ‘Unacceptable Risk’ denotes risk levels exceeding the acceptable range, necessitating urgent measures for reduction or elimination. Using Equation (2), the digital characteristics of the standard cloud are calculated (see Table 2). Based on Table 2 and Table 3, the standard clouds are generated as illustrated in Figure 1, Figure 2, Figure 3 and Figure 4.
where and are the minimum and maximum values of the quantized score interval for risk level n; k is the fuzzy coefficient, typically set to 0.1.
Table 2.
Risk Level Classification and Cloud Digital Characteristics.
Table 3.
Comprehensive risk evaluation matrix.
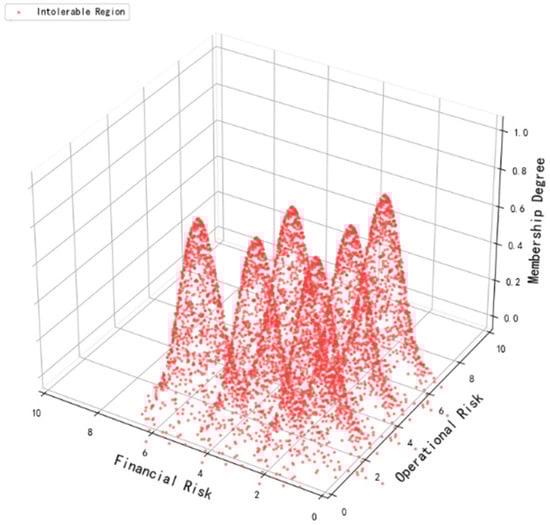
Figure 1.
Unacceptable Zone Cloud Diagram.
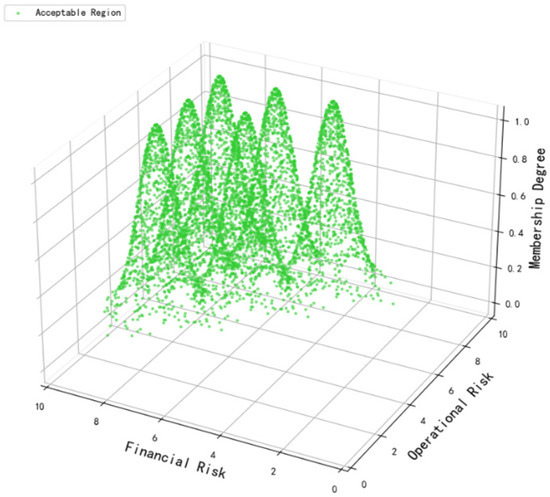
Figure 2.
Acceptable Zone Cloud Diagram.
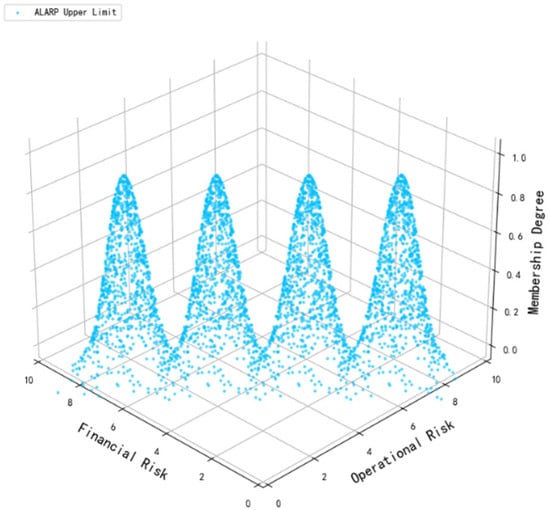
Figure 3.
ALARP Lower Limit Cloud Diagram.
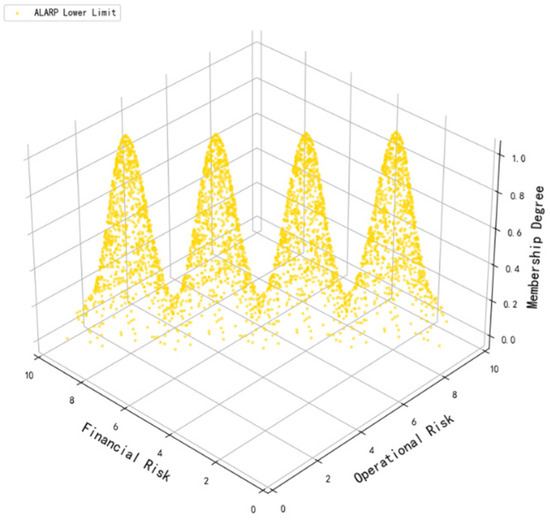
Figure 4.
ALARP Upper Limit Cloud Diagram.
(2) Construction enterprise credit risk assessment: Based on the evaluation data from two dimensions, the backward cloud generator is utilized to calculate the digital characteristics of both dimensions (, , , , , ) for plotting the evaluation cloud map. The digital characteristics of the evaluation cloud are calculated via Formula (3).
After obtaining the evaluation cloud, the final assessment result can be determined through the maximum membership principle by calculating the similarity degree between the evaluation cloud and the standard clouds. The similarity calculation process is described in Formulas (4) to (5). Here, (, ) represents the normal random numbers of a cloud droplet in the evaluation cloud. These values are computed with the cloud digital characteristics of different standard clouds to derive similarity degrees with each standard cloud, thereby determining the enterprise’s credit risk status.
Credit risk assessment is conducted based on Table 2 and the indicator system. By applying Equations (3)–(5) and the maximum membership degree principle, the risk levels of each credit risk indicator, as well as the financial and operational dimensions, can be calculated and determined. Subsequently, the region where the credit risk cloud resides is identified through reference to Table 3.
3.3. Grey Relational Analysis
Grey Relational Analysis (GRA) is a method for studying the interrelationships among multiple factors. It calculates the similarities and differences between factors, representing the correlation between two elements using numerical values within [0, 1] [35], where the value exhibits a directly proportional relationship with correlation strength, thereby identifying the primary influencing factors in a system. In credit risk assessment, this method analyzes the correlations and weights among credit risk factors of construction enterprises, providing mathematical foundations for risk management and control [36]. The calculation steps are as follows:
(1) Determination of Reference Sequence and Comparison Sequence
Suppose there are m factors in a system, each with n observed values. The reference sequence is defined as:
The comparison sequences are determined as: .
(2) Data Preprocessing of Sequences
Initialization processing is performed to eliminate dimensional influences among factors in the reference sequence and comparison sequences. The formula is defined as:
(3) Calculation of Relational Coefficients
Relational coefficients quantify the degree of association between the reference sequence and comparison sequences at each time point, calculated by:
where ρ denotes the distinguishing coefficient, typically set as 0.5.
(4) Calculation of Grey Relational Grade
The correlation degree between comparison sequences and the reference sequence is obtained by calculating the grey relational grade [37]. The formula is expressed as:
The calculated relational grades between each factor and the target risk facilitate identification of their influence magnitudes on the target risk, thereby yielding factor weights [38].
3.4. Two-Dimensional Cloud Model
The two-dimensional cloud model is constructed by adding an additional dimension to the one-dimensional cloud model, which can be understood as the integration of two one-dimensional cloud models [39]. Building upon the one-dimensional cloud model’s capability to handle mutual transformation between qualitative and quantitative analyses, the two-dimensional cloud model primarily serves to analyze problems under dual-factor interactions [40]. Similarly, the construction of the two-dimensional cloud model mainly relies on forward and backward cloud generators [41]. By employing the forward cloud generator, a specified number of cloud drops can be generated to produce three-dimensional cloud visualization.
The main implementation steps of the two-dimensional cloud model forward generator are as follows:
(1) Determine the corresponding quantitative ranges based on the qualitative concepts of two factors, generating expectation values , entropy , and hyper entropy .
(2) Generate random numbers within the corresponding quantitative ranges.
(3) Calculate the membership degree [42].
(4) Take as a cloud droplet, and repeat the above steps to form n cloud droplets for constructing the cloud map.
4. Case Study
This study utilizes the Wind database and incorporates field research to collect empirical data, selecting China’s listed construction enterprise A as the research subject. Grey Relational Analysis (GRA) and a two-dimensional cloud model were employed to comprehensively assess its credit risk levels for 2023–2024. Based on credit information disclosed in the database, empirical analysis was conducted using the constructed credit risk assessment framework. The final credit risk assessment results are shown in Figure 5, demonstrating a high degree of consistency between the model’s output and the objective credit ratings, which verifies the effectiveness of this method. Concurrently, key risk factor cloud diagrams (Figure 6) were generated to visualize core enterprise credit risks through cloud digital characteristics such as Expectation (Ex) and Dispersion (Di). Quantitative analysis leveraging cloud model parameters provides a foundation for formulating targeted risk management measures (Table 4).
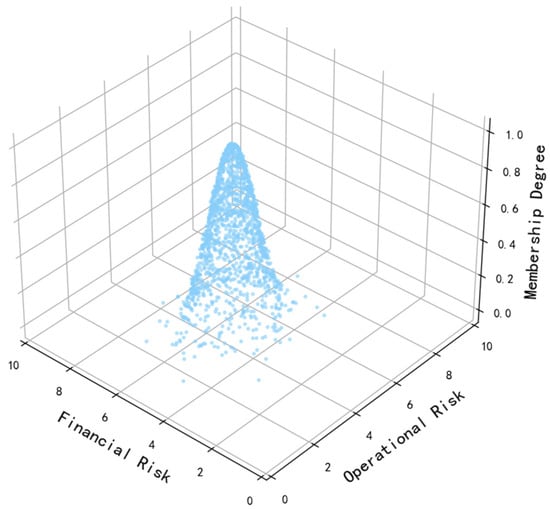
Figure 5.
Credit Risk Cloud Diagram.
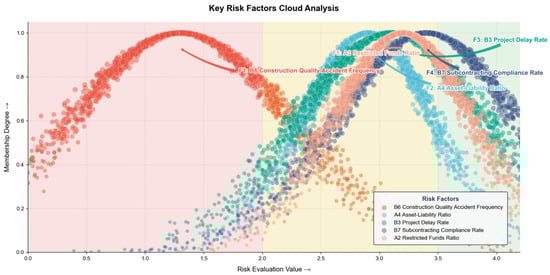
Figure 6.
Critical Risk Factors Cloud Diagram.
Table 4.
Credit Risk Weight Table.
In conclusion, utilizing the backward cloud generator algorithm, this study derived the cloud digital characteristics for both financial and operational dimensions of the enterprise, and the information is shown in Table 5 as well. The resultant cloud digital characteristics for credit risk evaluation are quantified as (5.30, 4.50, 0.67, 0.83, 0.043, 0.058). These parameters were subsequently input into the forward cloud generator of a two-dimensional cloud model, yielding the evaluation cloud diagram presented in Figure 5.
Table 5.
Cloud Digital Characteristics of Credit Risk Factors.
Leveraging the cloud digital characteristics of risk factors presented in Table 4, distinct credit risk states can be classified. By integrating indicator weights and correlations derived from grey relational analysis, critical risk factors influencing the creditworthiness of construction contractors are systematically identified. Targeted mitigation measures are consequently proposed to disrupt risk transmission mechanisms. Through backward cloud generator computations, risk factor cloud diagrams were generated, with factors A2, A4, B3, B4, B6, and B7 identified as high-risk or above thresholds. The resultant critical risk cloud visualization is depicted in Figure 6.
To ensure the validity of the model results, a comparative analysis was conducted between the credit risk assessment results obtained from the two-dimensional cloud model and those from three traditional risk assessment methods—the Analytic Hierarchy Process (AHP), Fuzzy Comprehensive Evaluation (FCE), and Entropy Weight Method (EWM). The results are presented in Table 6. The results indicate that the two-dimensional cloud model yields the best credit risk assessment outcomes.
Table 6.
Results of Model Consistency Index.
In summary, applying this research model to assess the credit risk status of Construction Enterprise A for the year 2024 reveals that its credit risk status in both financial and operational dimensions is at a “General Risk” level, with the comprehensive risk falling within the ALARP (As Low As Reasonably Practicable) zone. Due to the market characteristics of construction enterprises centered around construction project activities, they are often subject to the interconnected constraints of key factors. To prevent further deterioration of their credit status, it is necessary to optimize their operational frameworks and financial conditions. Analysis through the model identifies that during the 2023–2024 period, the primary factors causing fluctuations in this enterprise’s credit risk level were: A2 Restricted Funds Ratio, A4 Asset–Liability Ratio, B3 Project Overdue Rate, B6 Engineering Quality Accident Frequency, and B7 Engineering Subcontracting Compliance Rate. In response to these factors, this study will propose corresponding risk control measures.
5. Discussion
This study analyzes the credit risk characteristics of construction contractor enterprises from financial and operational dimensions, and constructs a credit risk assessment framework by integrating grey relational analysis with a two-dimensional cloud model. Utilizing credit data of China Construction Enterprise A extracted from the Wind database, the model’s validity was verified. The analysis identified A2, A4, B3, B6, and B7 as critical risk factors contributing to the decline in Enterprise A’s credit rating from 2023 to 2024. To maintain corporate creditworthiness, the following risk control measures are proposed:
- (1)
- A2 proportion of restricted funds: As a crucial indicator measuring solvency and liquidity, excessive restricted funds increase contractors’ working capital pressure and financing costs, thereby impairing credit stability. Proposed control measures include:
- ①
- Bank guarantee substitution: Replace high cash deposits with bank guarantees to enhance liquidity, while strengthening accounts receivable management to accelerate fund recovery. In accordance with the Notice on Regulating Guarantee Funds in the Construction Sector issued by China’s State Council, construction enterprises may substitute performance and bid bonds with bank guarantees to optimize capital fluidity. Concurrently, enterprises should refine quantity measurement and settlement procedures, rejecting contract clauses stipulating “final amounts subject to audit.”
- ②
- Financing channel diversification: Mitigate over-reliance on restricted funds through credit instruments, bank credit lines, government grants, and supply chain finance. For instance, large contractors may utilize bank credit loans given their asset scale and credibility, while SMEs could leverage supply chain financing backed by core enterprise credit. Credit insurance and factoring services are recommended to transfer accounts receivable risks.
- ③
- Internal monitoring mechanism: Establish early-warning thresholds for restricted funds to track fluctuations. Negotiate flexible terms with financial institutions to release portions of restricted funds upon achieving project milestones. Regular stress testing should simulate capital chain resilience under varying market conditions, enabling preemptive risk control.
- (2)
- Excessive asset–liability ratios in construction contractor enterprises tend to narrow financing channels, further intensifying capital pressure and thereby negatively impacting corporate creditworthiness. For bond-issuing construction contractors, financial metrics such as asset–liability ratios typically have predefined threshold requirements. Excessively high ratios may trigger bond covenant thresholds, compromising market credibility. To safeguard credit profiles, this study proposes asset structure optimization measures:
- ①
- Convert short-term accounts payable into renewable corporate bonds to achieve phased debt repayment, controlling short-term asset–liability ratios while reducing repayment pressure;
- ②
- Introduce external investments through capital increase and share expansion to repay high-interest short-term debts, preventing abrupt breaches of critical asset–liability thresholds;
- ③
- Expedite the resale of underutilized construction equipment at project sites to alleviate capital pressure. Additionally, enterprises should implement real-time monitoring of asset–liability ratios with warning thresholds to avoid delayed responses that directly impair credit standing.
- (3)
- B3 project overdue rate, serving as a critical indicator reflecting construction contractors’ market contract fulfillment capability, demonstrates significant impacts on corporate reputation and market competitiveness. Research indicates that most project owners specify in contract terms that exceeding predetermined thresholds for project delays will trigger default compensation clauses. Given that construction contractors’ market operations primarily revolve around engineering projects, elevated project overdue rates would diminish corporate credibility, generate negative perceptions in bidding markets, and reduce contract-winning probabilities. This study recommends that construction contractors establish enterprise-level project portfolio schedule management systems, implementing multi-tiered schedule control mechanisms through Building Information Modeling (BIM) technology integration. Strategic allocation of flexible buffer zones should be incorporated within master schedules, complemented by performance-based reward/penalty mechanisms for schedule compliance. Concurrently, extreme weather early warning systems and engineering insurance frameworks should be institutionalized. These multidimensional management approaches collectively safeguard project schedules, thereby preventing contractual non-performance incidents from deteriorating corporate credit profiles.
- (4)
- B6 engineering quality incident frequency has been designated as a critical assessment criterion in credit scoring systems for construction contractors across China’s provincial and municipal jurisdictions. Enterprises experiencing quality defects or safety incidents face administrative penalties from local government authorities, while financial institutions typically impose elevated financing costs—including demands for additional collateral or suspension of credit facilities—upon identifying such incident records in regulatory databases. Concurrent deterioration of market trustworthiness severely impedes normal business operations. This study advocates a systematic integration of technological and managerial interventions for effective credit risk governance: By deploying IoT sensors in high-risk construction phases (e.g., concrete pouring and steel structure welding) to enable real-time monitoring of critical quality/safety parameters, contractors can achieve source control of potential incidents; through the establishment of comprehensive quality documentation systems during project implementation, enterprises ensure full-process tracking and archival recording of quality control outcomes; the adoption of unannounced inspection protocols facilitates randomized quality audits on suppliers/subcontractors, complemented by blacklist mechanisms to terminate partnerships with non-compliant collaborators. These integrated measures collectively reduce quality/safety incident probabilities, thereby preventing regulatory blacklisting while enhancing bidding competitiveness through demonstrated operational reliability. This dual-strategy approach ultimately safeguards corporate reputation and consolidates long-term creditworthiness through sustained high-quality project delivery.
- (5)
- B7 engineering subcontracting compliance rate significantly influences construction contractors’ market operations. Given the industry’s prevalent practice of subcontracting, non-compliant behaviors such as illegal contract transfers and qualification lending will trigger administrative case investigations and directly reduce corporate scores in provincial/municipal credit evaluation systems, potentially leading to bidding qualification restrictions in severe cases. This study proposes comprehensive solutions: Construction contractors should establish a lifecycle management system covering subcontractor qualification screening, performance monitoring, and exit mechanisms, which interfaces with the Ministry of Housing’s “Four Databases One Platform” system to verify subcontractor credentials in real-time while implementing a blacklist/redlist mechanism—permanently banning and publicly disclosing subcontractors engaged in illegal transfers or qualification lending. Concurrently, contractors should conduct dynamic performance evaluations assessing subcontractors’ schedule adherence, safety compliance, and quality control through periodic reviews, enforcing progressive disciplinary measures including formal warnings, partnership termination, and increased performance bonds for underperforming entities. These integrated controls enhance subcontracting compliance, thereby preventing regulatory penalties while maintaining bidding eligibility and reinforcing corporate credibility through standardized supply chain management practices.
6. Conclusions
This study focuses on constructing a credit risk assessment framework for construction contractor enterprises. By integrating financial and operational dual-dimensional credit risk factors, combined with the ALARP risk acceptability criterion, grey relational analysis, and a two-dimensional cloud model, this study developed a credit evaluation model that balances short-term financial health and medium-to-long-term development potential, while achieving three-dimensional visualization of corporate credit status.
The research innovatively proposes a two-dimensional cloud-based credit risk assessment model incorporating financial and operational dimensions. Utilizing public databases including Wind Database and the Ministry of Housing’s “Four Libraries and One Platform” system, supplemented by field investigations, this study conducted a case study of Construction Contractor A. Key findings include: (1) through systematic literature review, this study identified eight core credit risk factors each in financial and operational dimensions; (2) the model classified Contractor A’s credit risk levels as “Acceptable Zone” and “ALARP Zone” during 2023–2024; (3) the identified critical risk factors (A2 Restricted Capital Ratio, A4 Asset–Liability Ratio, B3 Project Overdue Rate, B6 Engineering Quality Incident Frequency, B7 Subcontracting Compliance Rate) are consistent with the actual situation of the enterprise, further validating the effectiveness of the model.
The established two-dimensional cloud assessment framework innovatively integrates traditional financial analysis with construction industry-specific operational characteristics and strategic development considerations, forming a tripartite evaluation system encompassing financial health, industry specificity, and strategic growth. This provides multidimensional perspectives for credit risk management decision-making.
The current research primarily faces two key limitations: (1) the enhancement of full-quantitative analysis of credit risk and the intelligence level of models poses significant challenges, as existing methods struggle to achieve comprehensive quantitative capture of risk factors and dynamic intelligent optimization of models; (2) integrated and correlational research on credit risk factors remains relatively underdeveloped, with a lack of cross-dimensional, multi-factor integrated studies, which consequently limits the comprehensiveness and accuracy of credit risk research. Future research should focus on developing dynamic credit risk assessment platforms with real-time risk perception capabilities for construction contractors, while establishing multidimensional credit risk factor databases to enable intelligent control and dynamic tracking of corporate credit risks.
Author Contributions
Conceptualization and formal analysis, Z.L. and J.F.; methodology and investigation, Z.L. and H.Y.; data curation, H.Z. and W.X.; software, resources and validation, L.Z.; writing—original draft preparation, L.Z.; writing—review and editing, H.Y., Z.L., H.Z. and W.X.; supervision and project administration, J.F. All authors have read and agreed to the published version of the manuscript.
Funding
This research was funded by Wuhan Municipal Bureau of Natural Resources and Urban Rural Development, grant number 202203.
Data Availability Statement
The relevant data of this study are included in the paper, and further data requests can be directed to the corresponding author via email.
Conflicts of Interest
The authors declare no conflicts of interest.
Abbreviations
| ROE | Return on Equity |
| MDA | Multivariate discriminant analysis |
| LDA | Linear discriminant analysis |
| SVM | Support vector machine |
| GA | Genetic algorithm |
| GRA | Grey Relational Analysis |
| ALARP | As Low As Reasonably Practicable |
| BIM | Building Information Modeling |
References
- Chen, T.; Yang, Q.; Wang, Y.; Wang, S. Double-Layer Network Model of Bank-Enterprise Counterparty Credit Risk Contagion. Complexity 2020, 2020, 3690848. [Google Scholar] [CrossRef]
- Han, Z.; Wang, Z. Digitalization and supply chain finance risk: Evidence from listed firms in the construction industry. Financ. Res. Lett. 2025, 74, 106726. [Google Scholar] [CrossRef]
- Chen, Z.-S.; Zhou, J.; Zhu, C.-Y.; Wang, Z.-J.; Xiong, S.-H.; Rodríguez, R.M.; Martínez, L. Prioritizing real estate enterprises based on credit risk assessment: An integrated multi-criteria group decision support framework. Financ. Innov. 2023, 9, 120. [Google Scholar] [CrossRef]
- Lin, Y.H.; Zheng, R.; Wu, F.; Zeng, N.; Li, J.; Tao, X. Blockchain-driven framework for financing credit in small and medium-sized real estate enterprises. J. Enterp. Inf. Manag. 2024, 37, 201–229. [Google Scholar] [CrossRef]
- Mardia, K.V. Fisher’s pioneering work on discriminant analysis and its impact on Artificial Intelligence. J. Multivar. Anal. 2024, 203, 105341. [Google Scholar] [CrossRef]
- Grobben, M. Risk elements in consumer instalment financing. J. Political Econ. 1943, 51, 185–186. [Google Scholar] [CrossRef]
- Beaver, W.H. Financial ratios as predictors of failure. J. Account. Res. 1966, 4, 71–111. [Google Scholar] [CrossRef]
- Altman, E. The Prediction of Corporate Bankruptcy: A Discriminant Analysis. Ph.D. Thesis, University of California, Los Angeles, CA, USA, 1967. [Google Scholar]
- Serrano-Cinca, C.; Gutierrez-Nieto, B. Partial Least Square Discriminant Analysis for bankruptcy prediction. Decis. Support Syst. 2013, 54, 1245–1255. [Google Scholar] [CrossRef]
- Berkson, J. Application of the logistic function to bio-assay. J. Am. Stat. Assoc. 1944, 39, 357–365. [Google Scholar]
- Yeh, I.; Lien, C. The comparisons of data mining techniques for the predictive accuracy of probability of default of credit card clients. Expert Syst. Appl. 2009, 36, 2473–2480. [Google Scholar] [CrossRef]
- Chuang, C. Application of hybrid case-based reasoning for enhanced performance in bankruptcy prediction. Inf. Sci. 2013, 236, 174–185. [Google Scholar] [CrossRef]
- Akkoc, S. An empirical comparison of conventional techniques, neural networks and the three stage hybrid Adaptive Neuro Fuzzy Inference System (ANFIS) model for credit scoring analysis: The case of Turkish credit card data. Eur. J. Oper. Res. 2012, 222, 168–178. [Google Scholar] [CrossRef]
- Orlovs, A.; Braslins, G. Cluster impact on company creditworthiness: Case of latvia. Econ. Manag. 2013, 18, 68–76. [Google Scholar] [CrossRef][Green Version]
- Chen, T.; Guestrin, C.; Assoc, C.M. XGBoost: A Scalable Tree Boosting System. In Proceedings of the KDD’16: Proceedings of the 22nd ACM SIGKDD International Conference on Knowledge Discovery and Data Mining, New York, NY, USA, 13–17 August 2016; pp. 785–794. [Google Scholar][Green Version]
- Ong, C.S.; Huang, J.J.; Tzeng, G.H. Building credit scoring models using genetic programming. Expert Syst. Appl. 2005, 29, 41–47. [Google Scholar] [CrossRef]
- Weber, P.; Medina-Oliva, G.; Simon, C.; Iung, B. Overview on Bayesian networks applications for dependability, risk analysis and maintenance areas. Eng. Appl. Artif. Intell. 2012, 25, 671–682. [Google Scholar] [CrossRef]
- Lu, Y.C.; Shen, C.H.; Wei, Y.C. Revisiting Early Warning Signals of Corporate Credit Default Using Linguistic Analysis. Pac.-Basin Financ. J. 2013, 9, 1–21. [Google Scholar] [CrossRef]
- Cathcart, L.; Gotthelf, N.M.; Uhl, M.; Shi, Y. News sentiment and sovereign credit risk. Eur. Financ. Manag. 2020, 26, 261–287. [Google Scholar] [CrossRef]
- Kabir, M.M.; Islam, M.M.; Murase, K. A new wrapper feature selection approach using neural network. Neurocomputing 2010, 73, 3273–3283. [Google Scholar] [CrossRef]
- Bermejo, P.; Gamez, J.A.; Puerta, J.M. Speeding up incremental wrapper feature subset selection with Naive Bayes classifier. Knowl.-Based Syst. 2014, 55, 140–147. [Google Scholar] [CrossRef]
- Khoshgoftaar, T.M.; Gao, K.; Seliya, N. Attribute Selection and Imbalanced Data: Problems in Software Defect Prediction. In Proceedings of the 2010 22nd IEEE International Conference on Tools with Artificial Intelligence, Arras, France, 27–29 October 2010; Gregoire, E., Gregoire, E., Eds.; Volume 1. [Google Scholar]
- Lopez, J.; Maldonado, S. Profit-based credit scoring based on robust optimization and feature selection. Inf. Sci. 2019, 500, 190–202. [Google Scholar] [CrossRef]
- Oreski, S.; Oreski, G. Genetic algorithm-based heuristic for feature selection in credit risk assessment. Expert Syst. Appl. 2014, 41, 2052–2064. [Google Scholar] [CrossRef]
- Zhang, X.; Ma, Y.; Wang, M. An attention-based Logistic-CNN-BiLSTM hybrid neural network for credit risk prediction of listed real estate enterprises. Expert Syst. 2024, 41, e13299. [Google Scholar] [CrossRef]
- Chen, R.; Yu, J.; Jin, C.; Chen, X.; Yang, L.; Zhang, S. Political connection and credit risk of real estate enterprises: Evidence from stock market. Humanit. Soc. Sci. Commun. 2024, 11, 174. [Google Scholar] [CrossRef]
- Monfort, A.; Pegoraro, F.; Renne, J.P.; Roussellet, G. Affine Modeling of Credit Risk, Pricing of Credit Events, and Contagion. Manag. Sci. 2021, 67, 3674–3693. [Google Scholar] [CrossRef]
- Dai, H.; Dong, X.; Xue, F. Corporate credit risk and bond yield spreads: Market reactions to the spreads. Financ. Res. Lett. 2024, 67, 105933. [Google Scholar] [CrossRef]
- Bhattacharya, M.; Inekwe, J.N.; Valenzuela, M.R. Credit risk and financial integration: An application of network analysis. Int. Rev. Financ. Anal. 2020, 72, 101588. [Google Scholar] [CrossRef]
- Zhou, M. Credit Risk Assessment Modeling Method Based on Fuzzy Integral and SVM. Mob. Inf. Syst. 2022, 2022, 3950210. [Google Scholar] [CrossRef]
- Fan, B.; Qin, J. Design and Implementation of an Enterprise Credit Risk Assessment Model Based on Improved Fuzzy Neural Network. Appl. Artif. Intell. 2023, 37, 2181517. [Google Scholar] [CrossRef]
- Liu, J.; Liu, S.; Li, J.; Li, J. Financial credit risk assessment of online supply chain in construction industry with a hybrid model chain. Int. J. Intell. Syst. 2022, 37, 8790–8813. [Google Scholar] [CrossRef]
- Illankoon, I.M.S.; Tam, V.W.; Le, K.N.; Shen, L. Key credit criteria among international green building rating tools. J. Clean. Prod. 2017, 164, 209–220. [Google Scholar] [CrossRef]
- Nicholas, J.; Holt, G.D.; Harris, P.T. Suppliers’ debt collection and contractor creditworthiness evaluation. Build. Res. Inf. 2000, 28, 268–279. [Google Scholar] [CrossRef]
- Meng, H.; Liu, G. Novel Method for Evaluating Three-Dimensional Surface Roughness Based on Grey Relational Analysis. J. Test. Eval. 2019, 47, 424–438. [Google Scholar] [CrossRef]
- Yang, L.; Xie, N. Evaluation of provincial integration degree of “internet plus industry” based on matrix grey relational analysis Case of China 2014–2016. Grey Syst.-Theory Appl. 2019, 9, 31–44. [Google Scholar] [CrossRef]
- Yan, X.; Luo, M.; Zhong, C. Evaluation of rural tourism development level based on entropy-weighted grey correlation analysis: The case of Jiangxi Province. Grey Syst.-Theory Appl. 2023, 13, 677–700. [Google Scholar] [CrossRef]
- Liao, H.; Fang, Z.; Zhang, Q.; Liu, X.; Wang, C.; Chen, D.; Qian, X. A study on the grey relational weighted evaluation model for the selection of leading industries in the airport economic zone. J. Grey Syst. 2024, 36, 45. [Google Scholar]
- Huang, Z.; Zhang, W.; Sun, H.; Pan, Q.; Zhang, J.; Li, Y. Risk uncertainty analysis in shield tunnel projects. Tunn. Undergr. Space Technol. 2023, 132, 104899. [Google Scholar] [CrossRef]
- Zhu, C.; Sun, S.; Chen, T.; Zhong, Q.; Liu, H.; Li, J.; He, D. Risk Assessment of Equipment Research Project Costs Based on FAHP-CRITIC Combined Weights for Two-Dimensional Cloud Model. Discret. Dyn. Nat. Soc. 2024, 2024, 6515118. [Google Scholar] [CrossRef]
- Zeng, F.; Li, J. Research on EU natural gas security and countermeasures based on two-dimensional cloud model. Energy 2024, 305, 132196. [Google Scholar] [CrossRef]
- Ma, B.; Cai, Y.; Zhang, H.; Fan, Y.; Wang, F.; Wang, P.; Lyu, Z.; Zhao, Z. Evaluating Construction Risks of Ultralarge Diameter Bored Pile in Deep Water Using Combination Weighting with Two-Dimensional Cloud Optimization. J. Constr. Eng. Manag. 2025, 151, 05025007. [Google Scholar] [CrossRef]
Disclaimer/Publisher’s Note: The statements, opinions and data contained in all publications are solely those of the individual author(s) and contributor(s) and not of MDPI and/or the editor(s). MDPI and/or the editor(s) disclaim responsibility for any injury to people or property resulting from any ideas, methods, instructions or products referred to in the content. |
© 2025 by the authors. Licensee MDPI, Basel, Switzerland. This article is an open access article distributed under the terms and conditions of the Creative Commons Attribution (CC BY) license (https://creativecommons.org/licenses/by/4.0/).