Abstract
Citywalk, a recently emerging form of leisure-oriented mobility, reflects increasing public interest in healthier lifestyles and more immersive urban experiences in Chinese metropolises. This study develops an integrative assessment framework combining Importance–Performance Analysis (IPA) and the Kano model to examine both functional and affective dimensions of pedestrian satisfaction. Based on a multidimensional assessment model that integrates 25 factors of pedestrian perception, large-scale surveys were conducted in Beijing, Shanghai, and Guangzhou, focusing on perceptions of spatial form, sensory atmosphere, accessibility, safety, and supporting facilities. A Satisfaction Scale (SS) and an Importance Scale (IS) were used to quantify responses, and the Kaiser–Meyer–Olkin (KMO) statistic indicated adequate sampling reliability. Results show that in Beijing and Shanghai, Biodiversity Visibility and Ecological Connection (LE5 = 3.706) and Street Furniture and Urban Amenity Integration (IN2 = 3.255) respectively rank first in terms of satisfaction, while Guangzhou showed highest satisfaction ratings with Pedestrian Infrastructure and Circulation Systems (IN3 = 3.206). It concludes that accessibility, safety, and route signage represent basic expectations whose absence substantially lowers satisfaction, and integration of cultural narratives were identified as effective design features associated with improved comfort and engagement. The framework and findings provide an empirical basis for analyzing pedestrian experience and identifying priorities for improving citywalk environments under different urban conditions.
1. Introduction
The contemporary phenomenon of “citywalk” has emerged as a significant area of urban studies scholarship, representing an evolution of pedestrian urbanism within post-digital society. Recent academic discourse conceptualizes citywalk as an embodied urban practice that enables alternative ways of experiencing, understanding, and producing urban space through slow, deliberate movement that counters accelerated urban rhythms [1]. Sheller and Urry’s new mobilities paradigm provides crucial theoretical grounding for understanding citywalk as embodied spatial practice that challenges conventional tourism and consumption patterns [2]. This builds upon earlier work by extending mobility studies into micro-scale urban exploration practices that emphasize serendipitous discovery over predetermined itineraries. Contemporary citywalk practices align with what Brenner and Schmid describe as “planetary urbanization,” where traditional urban–rural distinctions dissolve, creating new forms of spatial exploration [3]. The phenomenon reflects increasing demand for authentic urban experiences within “authentic city” discourse where walking becomes a means of accessing genuine urban culture beyond commodified tourist circuits [4].
The COVID-19 pandemic has notably expedited the adoption of citywalks as the populace sought secure outdoor activities within the limitations of urban areas. Honey Rosés et al. have documented that the restrictions imposed during the pandemic generated new demand for local urban exploration, thereby fundamentally transforming neighborhood-scale mobility patterns [5]. This is consistent with Carmona’s observations regarding urban resilience, in which walking activities offer adaptive solutions to urban disruptions [6]. Kärrholm et al. have analyzed that the citywalk during the pandemic era signify the “territorial appropriation” of urban space, where residents reclaim their neighborhoods through intensive pedestrian exploration [7]. This phenomenon exemplifies what Crawford, Chase, and Kaliski term as “everyday urbanism,” where ordinary walking practices serve as means for urban place-making [8].
The proliferation of citywalk activities is inextricably linked to social media platforms and digital mapping technologies. Hannam introduces key concepts on the transformation of mobility practices, including urban walking, in the context of global media and digital platforms [9]. This connects to Van Dijck et al.’s platform society analysis, where digital platforms reshape spatial practices through algorithmic mediation [10]. Leszczynski’s research on spatial media reveals how GPS-enabled applications create new forms of urban wayfinding that support spontaneous citywalk activities [11]. These technologies enable what Graham and Zook describe as “augmented urban exploration,” where digital layers enhance physical walking experiences through location-based information and social connectivity [12].
Citywalk activities constitute a notable contemporary urban phenomenon that integrates digital culture, spatial practice, and urban experience. The increasing academic focus on citywalk mirrors more extensive trends in urban studies towards comprehending embodied, experiential, and technologically mediated manifestations of urban life. The popularity of contemporary citywalk challenges conventional urban planning approaches by prioritizing experiential urban design over functional design. While the notion of walkability traditionally concerns the physical and functional qualities of the pedestrian environment, such as connectivity, safety, and accessibility, citywalk extends beyond these utilitarian parameters. It represents a cultural and experiential mode of urban engagement, foregrounding the affective, aesthetic, and social dimensions of walking. Rather than measuring the efficiency of movement, citywalk emphasizes embodied exploration, place-based storytelling, and sensory immersion, thus transforming walking into a performative and meaning–making urban practice. Carmona posits that the requirements of citywalk necessitate planners to contemplate “walkability” beyond transportation efficiency, integrating the aesthetic, social, and cultural aspects of pedestrian experience [13]. This phenomenon aligns with what Montgomery terms “happy city” planning, in which urban design places emphasis on subjective well-being and experiential richness [14]. This is related to the growing acknowledgement that successful urban environments must accommodate diverse forms of spatial practice, including spontaneous exploration and leisurely pedestrian mobility.
Diverse urban contexts present distinct manifestations of citywalks, which mirror local spatial arrangements and cultural practices. In Asian megacities, Kim have documented that citywalk culture places emphasis on the exploration of micro-neighborhoods, especially in densely populated urban areas with intricate pedestrian networks [15]. European cities utilize their historical urban cores to offer heritage-centered walking experiences [16]. North American cities are increasingly developing citywalk infrastructure through what Silva refers to as “pop-up urbanism,” establishing temporary pedestrian-friendly interventions that promote walking culture [17]. This reflects broader tendencies towards tactical urbanism, which facilitates citywalk activities through incremental spatial alterations.
Recent research on city walking in China has witnessed a multidisciplinary surge, examining the phenomenon from spatial, cultural, technological, and health perspectives. Foundational studies have mapped the regional characteristics and route patterns of “Citywalk,” revealing how local heritage and urban morphology shape pedestrian experience across different Chinese cities [18]. The cultural dimension has been extensively analyzed, tracing the evolution from authentic youth subculture to commodified media spectacle [19], while tourism research explores how citywalk practices reshape destination branding and urban identity formation [20]. Methodologically, the field is advancing through machine learning approaches that analyze social media interactions alongside built environment features to decode walking experiences in megacities like Shanghai [21]. The tourism industry has recognized citywalk’s potential for creating new leisure opportunities during “gap days,” highlighting its economic implications for urban destinations [22]. From a health perspective, systematic reviews and meta-analyses compare the psychological and physiological outcomes of city walks versus nature walks, providing evidence-based insights for urban planning and public health policies [23]. This convergence of spatial analysis, cultural studies, digital methodology, tourism research, and health sciences demonstrates the interdisciplinary maturation of urban walking research in China’s rapidly evolving urban contexts. To provide a clearer understanding of the theoretical foundations and previous research that inform this study, Table 1 summarizes key studies on urban walking and their respective impacts on the development of the citywalk phenomenon.

Table 1.
The key studies on urban walking and their respective impacts.
This paper comparatively examines the perception-based assessment of urban walking environments through the lens of the citywalk phenomenon in Chinese metropolitan contexts (Figure 1). It begins with a comprehensive review of the literature on pedestrian environmental quality and urban spatial perception, which provides the conceptual foundation for the study’s analytical framework. Building on relevant scholarships, the paper outlines the development of a multidimensional assessment model that integrates five dimensions and twenty-five factors of pedestrian perception, addressing spatial, architectural, infrastructural, landscape, and multisensory aspects. The methodological section introduces the data collection process, including survey questionnaires and walking interviews conducted in Beijing, Shanghai, and Guangzhou, followed by a detailed explanation of the combined Importance–Performance Analysis (IPA) and Kano model approach. The results section presents city-specific findings, highlighting the differing roles of heritage, spatial scale, infrastructure, and sensory qualities across the three cities. Subsequent discussion interprets these findings in light of urban design and policy implications, emphasizing the need for context-sensitive strategies rather than universal enhancement models. The paper concludes by summarizing theoretical contributions, methodological advances, and practical recommendations, while also identifying avenues for future research on experiential urban mobility and pedestrian-centered design.
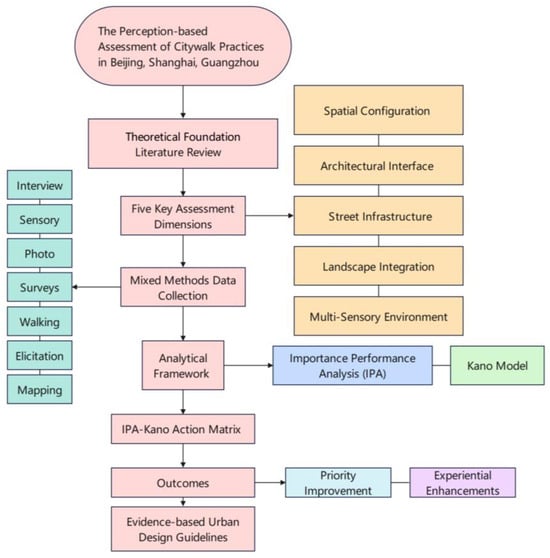
Figure 1.
Research Framework.
2. Materials and Methods
2.1. Database Selection
The literature retrieval process employed a multi-database search strategy targeting peer-reviewed scholarly articles, books, research monographs, and conference proceedings published between 2004–2024. The search focused on user perception studies of urban physical spatial design and pedestrian environmental experience, with the 20-year timeframe selected to capture both established theoretical frameworks and recent methodological developments. The database selection was structured around disciplinary coverage, methodological scope, and geographic distribution. Given that urban perception research intersects multiple fields including urban planning, environmental psychology, architecture, landscape architecture, and behavioral geography, a multi-tiered approach was implemented. Planning/Architecture Database and Avery Index to Architectural Periodicals were included to access design-oriented research employing alternative publication formats and methodological approaches. These databases provided coverage of practitioner-oriented research, design case studies, and spatial perception assessment methodologies that may be excluded from general multidisciplinary databases.
The article selection followed enhanced PRISMA guidelines through four sequential screening stages:
Stage 1—Initial Database Search (n = 847): Boolean search logic combined three keyword clusters: spatial perception terms (“user perception,” “environmental cognition,” “spatial experience,” “place attachment”), urban design descriptors (“urban design,” “streetscape,” “pedestrian environment,” “public space”), and measurement methodology indicators (“assessment,” “evaluation,” “measurement,” “framework”). This approach across all databases yielded 847 publications.
Stage 2—Title and Abstract Screening (n = 847 → n = 234): Inclusion criteria targeted direct relevance to user perception of urban physical design elements. Exclusions comprised transportation engineering studies prioritizing infrastructure efficiency over user experience, behavioral research lacking perceptual measurement components, and theoretical papers without empirical measurement frameworks.
Stage 3—Full-Text Eligibility Assessment (n = 234 → n = 127): Articles were evaluated for methodological rigor, inclusion of user perception measurement approaches, focus on physical spatial design elements, and relevance to pedestrian walking environments. Studies focusing exclusively on vehicular environments, indoor spaces, or virtual environments lacking direct applicability to urban outdoor pedestrian contexts were excluded.
Stage 4—Quality Assessment and Framework Relevance (n = 127 → n = 68): Final selection prioritized studies providing specific measurement frameworks, validated assessment methodologies, or comprehensive evaluation criteria for physical spatial design elements from user perspective, with additional emphasis on cross-cultural applicability.
2.2. Advanced Content Analysis and Synthesis Methodology
The construction of the assessment framework was carried out through a sequential analytical design that combined qualitative and quantitative approaches. Systematic qualitative content analysis was conducted using NVivo 12 software, supplemented by quantitative citation analysis and co-occurrence mapping with VOSviewer 1.6.17. The combined procedure enabled the identification, organization, and synthesis of key dimensions and factors related to user perception of urban physical spatial design, ultimately leading to the construction of a framework consisting of five dimensions and twenty-five factors.
The first step employed qualitative content analysis in NVivo 12. A hierarchical coding scheme was developed to categorize the selected literature into three primary domains: (1) physical spatial design elements, (2) user perception indicators, and (3) assessment methodologies. Through iterative open, axial, and selective coding, recurrent themes were identified and organized. Coding results revealed clusters of concepts that were then mapped into potential dimensions of analysis. The coding process served as the basis for distinguishing specific factors, ensuring that the framework was derived from recurring evidence in the reviewed studies rather than isolated cases. To further refine the thematic results, statistical clustering techniques were applied. Citation co-occurrence mapping with VOSviewer 1.6.17 was used to visualize connections between key terms and research themes. Factor analysis and multidimensional scaling were conducted to identify latent structures among the coded indicators. To establish the statistical foundation for these multivariate techniques, pairwise correlations between all coded variables were first computed using Pearson’s product–moment correlation coefficient. This correlation matrix served as the input for subsequent dimension reduction procedures and allowed for the quantitative assessment of inter-variable relationships that had been qualitatively identified through content coding. The correlation coefficient is formally defined as:
where ρ_{x,y} represents the Pearson correlation coefficient between variables X and Y, ranging from −1 (perfect negative correlation) to +1 (perfect positive correlation). E(X) and E(Y) denote the expected values (arithmetic means) of the two variables, calculated as shown in Equation (2). The standard deviations σ_x and σ_y, derived from Equation (3), normalize the covariance term to produce a dimensionless measure of association. Equation (4) defines the covariance cov(X,Y), which captures the joint variability of X and Y around their respective meanings.
These techniques allowed the grouping of related perception elements and spatial attributes into coherent dimensions. For example, studies linking streetscape configuration with perceived comfort and safety were statistically clustered together, supporting their classification under a single dimension. This procedure enabled the systematic consolidation of numerous individual indicators into a reduced set of broader categories.
The preliminary dimensions and factors were then examined for their applicability across different urban contexts. Literature representing diverse geographical settings was compared, with particular attention to studies conducted in Chinese metropolitan environments. This comparative step allowed the identification of indicators that appeared consistently across multiple contexts and highlighted factors that were more context specific. Special consideration was given to variations in urban density, design traditions, and pedestrian practices, which may influence the interpretation of spatial perception. The cross-cultural assessment was intended to examine the extent to which the framework elements could be applied across different settings. Finally, methodological triangulation was employed to consolidate results. Quantitative approaches (such as structured surveys and statistical perception measures), qualitative strategies (including interviews, observational studies, and phenomenological assessments), and mixed-methods designs were systematically reviewed.
2.3. Methodology for Chinese Metropolitan Contexts
In this study, the framework was implemented in Chinese metropolitan contexts, focusing on citywalk routes in Beijing, Shanghai, and Guangzhou. These cities were selected for their distinctive urban morphologies, architectural traditions, and contemporary development trajectories, which collectively provided representative contexts for examining the framework’s transferability and adaptability. The methodological design integrated standardized evaluation techniques with culturally adapted procedures to capture user perceptions in alignment with both universal analytical criteria and local spatial practices.
The empirical investigation employed a mixed-methods approach combining quantitative and qualitative data collection techniques. Quantitative assessment was conducted through structured questionnaires utilizing 5-point Likert scales, with each of the framework’s five dimensions and twenty-five factors operationalized into measurable items to enable statistical analysis and cross-case comparability (Appendix A and B). Semi-structured walking interviews were conducted in situ to capture real-time perceptions and reduce retrospective bias, while photo-elicitation techniques enabled participants to identify personally salient environmental features that might otherwise be overlooked.
Cultural narratives were another critical aspect woven throughout the methodology. These narratives, rooted in traditional Chinese urban design principles like axiality, enclosure, and courtyard-based morphology, were explored through the way participants interacted with the city. For instance, the historical and cultural significance of spatial arrangements, like how courtyards and axial paths frame movement, were observed to evoke distinct emotional responses and memories among participants, enriching their sensory experience. This aspect of cultural narrative was especially important in how respondents related personal stories or past experiences tied to specific locations along their walking routes. The cultural sensitivity was integrated throughout the data collection process to ensure that the framework’s application reflected both universal perceptual dimensions and locally specific urban practices. Sensory mapping exercises documented non-visual perceptual dimensions, including auditory, olfactory, tactile, and microclimatic experiences, with participants annotating route maps that were subsequently coded and analyzed systematically. In this context, the sensory atmosphere of the walking routes was central to understanding how environmental stimuli, such as the sounds of street vendors, the smells of local foods, or the tactile experience of pavement textures, shaped participants’ overall perceptions of the urban space.
2.4. IPA and Kano Model
To rigorously operationalize the perception-based assessment framework, this study designed and implemented a comprehensive, multi-city data collection effort coupled with a dual-model analytical strategy. Data were collected through the WeChat online platform, targeting individuals engaged in urban walking activities in Beijing (n = 200), Shanghai (n = 210), and Guangzhou (n = 211). In total, 621 valid responses were obtained. The sample encompassed a range of occupational categories, including students, employees (full-time or part-time), freelancers, retirees, and other specified groups. The dataset demonstrated a balanced gender distribution (approximately 52% female and 48% male) and a youth-dominant age structure. The age variable was divided into six groups: under 18, 18–25, 26–35, 36–45, 46–60, and above 60 years. Respondents aged 18–35 accounted for about 62% of the total sample, reflecting the demographic predominance of young adults as the primary participants in contemporary urban walking activities. The survey instrument was systematically derived from the five-dimensional, twenty-five-factor evaluation framework established in the preceding literature review and conceptual development. For each factor, respondents provided paired ratings on a five-point Likert scale: (1) the importance of the factor to their overall citywalk experience and (2) its performance as realized in the specific route environment. In parallel, each factor was assessed using functional and dysfunctional Kano model questions, allowing classification of attributes into must-be, one-dimensional, attractive, indifferent, or reverse types. This dual-layer questionnaire design ensured that both the salience of spatial attributes and their qualitative impact on satisfaction were captured in a consistent and analyzable manner.
The first analytical layer employed the Importance–Performance Analysis (IPA) model to diagnose the match—or mismatch—between user priorities and the actual quality of urban walking environments. Importance and performance scores for each factor were averaged and positioned within a two-dimensional matrix, generating the four canonical quadrants: “Keep Up the Good Work,” “Concentrate Here,” “Low Priority,” and “Possible Overkill.” The IPA results thus identify critical performance gaps, signaling which factors demand urgent design interventions and which are already functioning satisfactorily. By comparing quadrant allocations across Beijing, Shanghai, and Guangzhou, the study reveals both context-specific weaknesses (e.g., lighting continuity in certain routes) and shared systemic challenges (e.g., signage clarity across all three cities), thereby producing actionable intelligence for urban designers and policy makers. The second analytical layer applies to the Kano model to deepen understanding of how user satisfaction responds to changes in design attributes. Unlike IPA, which treats importance as linearly related to performance, the Kano model framework differentiates between factors that prevent dissatisfaction (must-be), those with a proportional satisfaction effect (one-dimensional), and those that can delight users when present (attractive). For each factor, satisfaction coefficients (CS+ and CS−) were calculated to quantify the positive gain if the attribute is provided and the negative penalty if it is absent. This step generates a behavioral expectation profile for each factor, allowing planners to distinguish, for instance, between baseline requirements that should never be neglected and experiential features that offer competitive differentiation for citywalk route design.
The real methodological strength lies in the integration of IPA and Kano model into a single decision-support framework (Figure 2). By overlaying Kano model categories onto IPA quadrants, the study produces an IPA-Kano model action matrix that guides resource allocation more strategically. A factor that appears in the “Concentrate Here” quadrant and is classified as “attractive” represents a high-leverage opportunity for creating exceptional user experiences through targeted design improvements. Conversely, a factor categorized as “must-be” but located in the “Low Priority” quadrant suggests that while it currently performs adequately, continuous monitoring is needed to prevent dissatisfaction. This integration transforms raw perception data into a hierarchically ranked, context-sensitive set of design recommendations, directly linked to their potential to raise satisfaction levels.
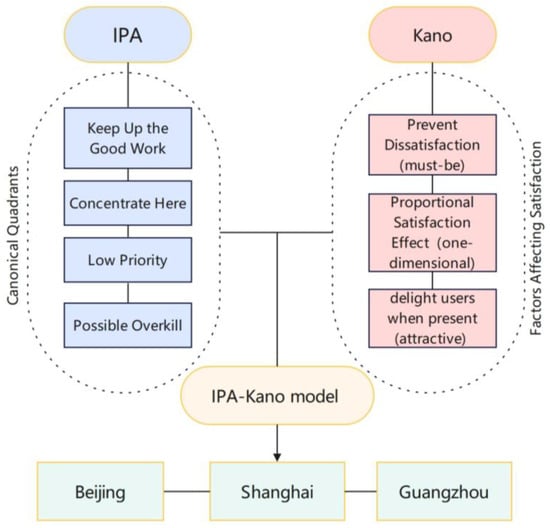
Figure 2.
The integration of IPA and Kano model.
3. Perception-Based Assessment Framework: Five Dimensions
Perception-based assessment factors identified from the literature:
Dimension 1: Spatial Configuration and Urban Morphological Quality
This dimension evaluates user perceptions of urban physical form, spatial relationships, and morphological characteristics that fundamentally influence citywalk experience quality, grounded in space syntax theory, urban morphology research, and environmental psychology [23,24,25] (Table 2).
Table 2.
Dimension 1 Assessment Factors.
Dimension 2: Architectural Interface and Building–Street Relationship Quality
This dimension captures user perceptions of architectural character, building–street interfaces, and facade elements that define the immediate pedestrian environment quality and street-level urban experience [34,35] (Table 3).
Table 3.
Dimension 2 Assessment Factors.
Dimension 3: Street Infrastructure and Pedestrian Facility Quality
This dimension evaluates user perceptions of street-level infrastructure, pedestrian amenities, and supportive facilities that enable comfortable and safe citywalk activities [24,43,44] (Table 4).
Table 4.
Dimension 3 Assessment Factors.
Dimension 4: Landscape Integration and Environmental Design Quality
This dimension captures user perceptions of natural elements, landscape design integration, and environmental quality within urban physical spaces supporting citywalk activities [52,53,54] (Table 5).
Table 5.
Dimension 4 Assessment Factors.
Dimension 5: Multi-Sensory Environment and Atmospheric Quality
This dimension evaluates user perceptions of comprehensive sensory environmental qualities, atmospheric characteristics, and experiential richness of urban physical spaces [65,66,67] (Table 6).
Table 6.
Dimension 5 Assessment Factors.
4. Citywalk Routes in Beijing, Shanghai, and Guangzhou
Xiaohongshu operates as a digital platform that aggregates user-generated content, including personal accounts, comments, and visual documentation, into a dataset distinguished by diversity, scale, and temporal immediacy. Through distributed knowledge and data production, individual users contribute localized urban experiences which, when aggregated, reveal discernible patterns of spatial perception and cultural evaluation. Engagement metrics such as likes, comments, and saves function as quantifiable indicators of user preference and cultural relevance, thereby enabling the systematic identification of collective attention within urban discourse and providing empirical evidence of how specific locations attain significance in contemporary spatial practices. The platform’s data architecture captures user interactions across temporal and geographical dimensions, generating a continuous record of evolving urban perceptions that reflects broader shifts in cultural attitudes toward urban space. In this sense, Xiaohongshu serves as a digital repository that documents the ongoing interplay between individual spatial experiences and collective urban consciousness across different metropolitan contexts, offering a robust methodological foundation for examining contemporary urban culture through digitally mediated spatial practices. Within this analytical framework, the present study employs Xiaohongshu as its primary data source. As of 10 May 2025, nine citywalk routes were systematically selected based on engagement metrics: specifically, the top three most-liked routes in each of Beijing, Shanghai, and Guangzhou. To enable more effective comparative analysis, routes of approximately equal length were further selected from among these cases. Together, these nine routes constitute representative case studies for the present study (Table 7).
Table 7.
Top Three Citywalk Routes Ranked by Likes in Beijing, Shanghai, and Guangzhou (as of 10 May 2025).
The top three Beijing citywalk routes ranked by likes foreground the city’s long-standing tension between imperial heritage and everyday neighborhood life. By emphasizing hutong culture, religious and educational heritage, and the traces of diplomatic history, these routes illustrate how digital users curate experiences of Beijing as both a historic capital and a living urban fabric (Figure 3, Figure 4 and Figure 5, Table 8, Table 9 and Table 10).

Figure 3.
Route 1, Beijing (Source: reproduced by Qiang Wang from Google Maps).
Table 8.
Route 1 (Beijing).
Table 8.
Route 1 (Beijing).
| Architectural Interface |  Gulou |  The buildings around the Drum Tower |  Guangfu Temple |  Letter Office of the Qing Dynasty Post |
| Infrastructure |  Yandai Xie Street |  Gulou East Street |  Nanluoguxiang |  Gulou Street |
| Landscape Environment |  Shichahai |  Shichahai |  Beihai Park |  Beihai Park |

Figure 4.
Route 2, Beijing (Source: reproduced by Qiang Wang from Google Maps).
Table 9.
Route 2 (Beijing).
Table 9.
Route 2 (Beijing).
| Architectural Interface |  Yonghegong |  Kong Miao |  Kong Miao |  Kong Miao |
| Infrastructure |  Wudaoying |  Wudaoying |  Wudaoying |  Wudaoying |
| Landscape Environment |  Guozijian |  Kong Miao |  Yonghegong |  Wudaoying |

Figure 5.
Route 3, Beijing (Source: reproduced by Qiang Wang from Google Maps).
Table 10.
Route 3 (Beijing).
Table 10.
Route 3 (Beijing).
| Architectural Interface |  China National Museum of the Judiciary |  North Yangmeizhu Xiejie |  Beijing Fun |  Beijing Fun |
| Infrastructure |  Beijing Fun |  Beijing Fun |  Beijing Fun |  Sanlihe Park |
| Landscape Environment |  Sanlihe Park |  Yangmeizhu Xiejie |  Beijing Fun |  Dongjiaominxiang |
The three most-liked Shanghai citywalk routes highlight the city’s layered modernity, juxtaposing colonial architecture and iconic skyline views with lifestyle-oriented spaces and contemporary cultural hubs. This digital mapping of Shanghai underscores the interplay between cosmopolitan identity, consumer culture, and evolving urban forms (Figure 6, Figure 7 and Figure 8, Table 11, Table 12 and Table 13).

Figure 6.
Route 4, Shanghai (Source: reproduced by Qiang Wang from Google Maps).
Table 11.
Route 4 (Shanghai).
Table 11.
Route 4 (Shanghai).
| Architectural Interface |  Wukang Building |  Jing’an Temple |  Moller Villa |  Huaihai Middle Road |
| Infrastructure |  Wukang Road |  Wukang Road |  Wukang Road |  Wukang Road |
| Landscape Environment |  Intersection of Taiyuan Road and Yongjia Road |  Wukang Road |  Huaihai Middle Road |  Huaihai Middle Road |

Figure 7.
Route 5, Shanghai (Source: reproduced by Qiang Wang from Google Maps).
Table 12.
Route 5 (Shanghai).
Table 12.
Route 5 (Shanghai).
| Architectural Interface |  Shanghai Post Museum |  Shamian Building |  Pudong Art Museum |  Carlowitz & Co. |
| Infrastructure |  Intersection of East Changzhi Road and Lvshun Road |  Intersection of East Changzhi Road and Lvshun Road |  Zhapu Road Bridge |  Shamian Building |
| Landscape Environment |  North Bund Riverside Green Space |  Intersection of East Changzhi Road and Lvshun Road |  Pudong Art Museum |  Carlowitz & Co. |

Figure 8.
Route 6, Shanghai (Source: reproduced by Qiang Wang from Google Maps).
Table 13.
Route 6 (Shanghai).
Table 13.
Route 6 (Shanghai).
| Architectural Interface |  Twin Villas |  TX Huaihai |  Paradox Museum |  Shanghai Conservatory of Music |
| Infrastructure |  Huaihai Middle Road |  Huaihai Middle Road |  Huaihai Middle Road |  Huaihai Middle Road |
| Landscape Environment |  Huaihai Middle Road |  Shanghai Conservatory of Music |  Huaihai Middle Road |  Huaihai Park |
In Guangzhou, the top three liked routes emphasize the integration of food culture, religious and ancestral sites, and landmark riverside landscapes. Together they reveal how user-generated itineraries frame Guangzhou not only as a historic treaty port but also as a dynamic urban space where heritage and modernity intersect (Figure 9, Figure 10 and Figure 11, Table 14, Table 15 and Table 16).

Figure 9.
Route 7, Guangzhou (Source: reproduced by Qiang Wang from Google Maps).
Table 14.
Route 7 (Guangzhou).
Table 14.
Route 7 (Guangzhou).
| Architectural Interface |  Xinhua Grand Hotel |  Sacred Heart Cathedral |  Dafo Temple |  Dongshankou |
| Infrastructure |  Dongshankou |  Beijing Road Pedestrian Street |  Beijing Road Pedestrian Street |  Beijing Road Pedestrian Street |
| Landscape Environment |  Beijing Road Pedestrian Street |  Sacred Heart Cathedral |  Huaihai Middle Road |  Dongshankou |

Figure 10.
Route 8, Guangzhou (Source: reproduced by Qiang Wang from Google Maps).
Table 15.
Route 8 (Guangzhou).
Table 15.
Route 8 (Guangzhou).
| Architectural Interface |  Nanfang Building |  Post Museum |  Aiqun Building |  Former Site of Guangdong Customs |
| Infrastructure |  Binjiang West Road |  Renmin Bridge |  Binjiang West Road |  Binjiang West Road |
| Landscape Environment |  Binjiang West Road |  Renmin Bridge |  Binjiang West Road |  Binjiang West Road |

Figure 11.
Route 9, Guangzhou (Source: reproduced by Qiang Wang from Google Maps).
Table 16.
Route 9 (Guangzhou).
Table 16.
Route 9 (Guangzhou).
| Architectural Interface |  Yongqingfang |  Shamian Island |  Yongqingfang |  Chen Clan Ancestral Hall |
| Infrastructure |  Xihua Road |  Yongqingfang |  Shamian Island |  Shamian Island |
| Landscape Environment |  Shamian Island |  Yongqingfang |  Liwan Lake |  Chen Clan Ancestral Hall |
5. Results
The study first assessed the reliability and validity of the measurement instruments to ensure the robustness of the empirical analysis. The Cronbach’s alpha values for the three cities ranged from 0.836 to 0.945, well above the commonly accepted threshold of 0.7, indicating good internal consistency across all dimensions. Additionally, KMO values exceeded 0.85, and Bartlett’s sphericity test results were significant (p < 0.001), confirming that the data were suitable for factor analysis. These results establish the methodological foundation for the subsequent comparative study (Table 17, Table 18, Table 19, Table 20, Table 21, Table 22, Table 23, Table 24 and Table 25).
Table 17.
Reliability Analysis (Beijing).
Table 18.
KMO and Bartlett’s Test Results for the Satisfaction Scale (Beijing).
Table 19.
KMO and Bartlett’s Test Results for the Importance Scale (Beijing).
Table 20.
Reliability Analysis (Shanghai).
Table 21.
KMO and Bartlett’s Test Results for the Satisfaction Scale (Shanghai).
Table 22.
KMO and Bartlett’s Test Results for the Importance Scale (Shanghai).
Table 23.
Reliability Analysis (Guangzhou).
Table 24.
KMO and Bartlett’s Test Results for the Satisfaction Scale (Guangzhou).
Table 25.
KMO and Bartlett’s Test Results for the Importance Scale (Guangzhou).
In terms of importance and performance comparison, the three cities exhibited different preference structures. In Beijing, respondents rated architectural interface elements with the highest importance, such as facade expressiveness (AI1 = 4.161), street-level vitality (AI2 = 4.147), and morphological complexity (SC5 = 4.071), with satisfaction ratings aligning closely with these priorities. In Shanghai, importance ratings were more moderate, with spatial elements such as scale relationships (SC2 = 3.293) and visual permeability (SC3 = 3.404) ranked lower. However, their correlation with satisfaction was strongest, indicating that Shanghai’s walking experience is particularly dependent on spatial scale and transparency. Guangzhou showed more compressed importance ratings, with architectural interface elements ranging between 3.2 and 3.3, but these dimensions were highly correlated with satisfaction, suggesting that although these elements were not prioritized, they significantly influenced overall experience when present (Table 26 and Table 27).
Table 26.
Importance Scale.
Table 27.
Satisfaction Scale.
The IPA quadrant analysis further revealed priority differences across the cities. In Beijing, most architectural and spatial configuration elements fell into Quadrant I (high importance, high performance), reflecting the city’s long-standing focus on heritage preservation and spatial design. However, certain infrastructure dimensions were placed in Quadrant II (high importance, low performance), signaling the need for improvements in aspects such as safety and wayfinding. Shanghai showed a more dispersed distribution, with scale relationships (SC2) and some infrastructure components in Quadrant II, highlighting areas in need of priority attention. Meanwhile, some multisensory experience dimensions were located in Quadrant IV (low importance, high performance), suggesting that resources might be over-invested in these areas. Guangzhou had a significant portion of its attributes in Quadrant III (low importance, low performance), particularly multisensory elements. Despite their lower priority, the strong correlation with satisfaction suggests latent potential for improvement if these elements are enhanced (Figure 12).
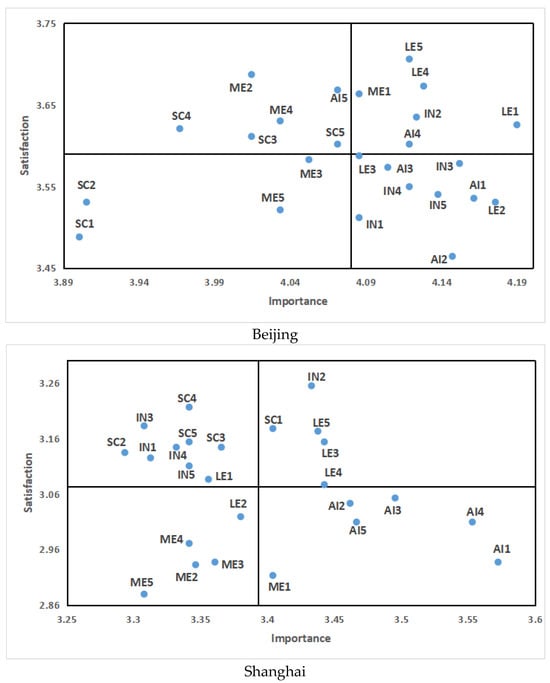
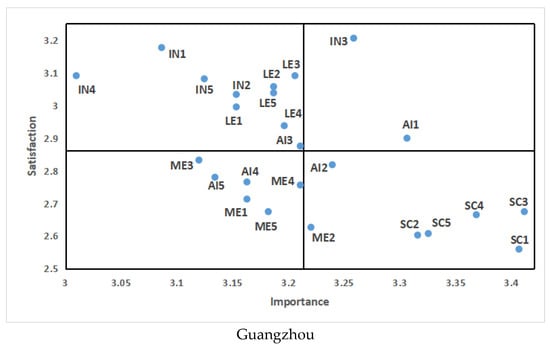
Figure 12.
Application of the IPA-Kano model Analysis Grid in Three Different Cities.
The Kano model further contextualized these quadrant classifications. In Beijing, architectural and spatial attributes were classified as basic needs, where their presence maintains baseline satisfaction. In Shanghai, spatial factors like scale relationships and visual permeability were identified as excitement factors, suggesting that improvements in these areas could lead to significant increases in satisfaction. In Guangzhou, multisensory elements also emerged as excitement factors, indicating that, although currently in low-priority quadrants, they hold considerable potential for enhancing overall user experience if improved. The research findings indicate that accessibility, safety, and distinct route signage represent fundamental expectations. The lack of these elements substantially diminishes satisfaction. Features such as cultural landmarks, design aesthetics, and sensory diversity serve as performance-enhancing factors that enhance the walking experience. Specifically, wayfinding systems and the integration of cultural narratives have been recognized as crucial interventions capable of improving both comfort and engagement.
6. Discussion
The comparative IPA–Kano model analysis of Beijing, Shanghai, and Guangzhou shows that pedestrian satisfaction is both city-specific and temporally dynamic. In Beijing, architectural and spatial attributes tend to function as baseline expectations, reflecting the influence of earlier heritage preservation and urban design efforts. This outcome is linked to Beijing’s long-standing role as the political and cultural capital, where large-scale preservation initiatives and institutionalized planning traditions have established relatively stable expectations of the built environment. The city’s urban development has consistently emphasized the integration of historical continuity with controlled modernization, resulting in a pedestrian infrastructure that prioritizes accessibility and architectural coherence as fundamental provisions. Consequently, residents perceive these attributes as given conditions, and satisfaction is less influenced by incremental improvements in physical form, reflecting a development philosophy centered on stability, continuity, and the safeguarding of cultural identity.
Shanghai illustrates how rapid development and densification make spatial legibility and permeability important drivers of satisfaction. As a city shaped by its position as a global financial hub, Shanghai’s urban trajectory has been marked by high-intensity land use, vertical expansion, and mixed-use clustering. These dynamics have generated highly complex pedestrian environments in which navigation, connectivity, and wayfinding play critical roles. Frequent transitions between elevated walkways, underground passages, and dense street grids amplify the importance of clear spatial organization and permeability. In this context, pedestrian satisfaction is closely tied to the ability to move efficiently and orient oneself within multilayered urban settings. The prominence of these factors reflects a development model oriented towards economic growth and spatial intensification, where the functionality of circulation networks and the legibility of urban space are essential for accommodating dense flows of people and activities.
Guangzhou, by contrast, highlights the potential role of multisensory dimensions, which are not yet prioritized but could enhance walking experiences if addressed. The city’s subtropical climate, rich cultural diversity, and layered historical development have created conditions where environmental qualities such as shade, sound, microclimate, and visual variety significantly shape everyday experience. Although infrastructural adequacy has been largely secured, the absence of systematic integration of these multisensory elements suggests that they remain an untapped dimension of urban design. The growing salience of these attributes in survey responses indicates that residents are beginning to value walking environments not only for their functional sufficiency but also for their experiential richness. This points to a developmental orientation where environmental comfort, cultural expression, and sensory engagement are emerging considerations in shaping pedestrian satisfaction.
The three cases illustrate how divergent historical trajectories and planning philosophies influence the relative importance of different attributes in shaping walking experiences. Beijing reflects a preservation-oriented model emphasizing stability and cultural continuity; Shanghai demonstrates the spatial consequences of densification and global competitiveness; and Guangzhou indicates a transition toward the experiential and sensory dimensions of everyday urban life. These differences highlight the need to interpret pedestrian satisfaction not merely as a reaction to physical conditions, but as an expression of deeper urban development logics embedded within each city’s institutional and cultural context.
From a policy and design perspective, the findings suggest differentiated strategies aligned with local development conditions. In Beijing, safeguarding basic pedestrian infrastructure and universal accessibility remains essential. Practical measures include systematic maintenance of primary walking corridors, continuous barrier-free paving, upgrades to lighting and resting facilities, and the adaptive reuse of historical alleys as pedestrian routes, accompanied by modest informational elements to convey local cultural context. In Shanghai, improving spatial permeability and legibility is critical in response to dense and multi-level circulation systems. Actions may involve establishing continuous at-grade pedestrian links between transit nodes and street-level destinations, improving wayfinding systems connecting elevated and underground networks, and activating ground-floor frontages through transparent façades and small public seating or plaza spaces. In Guangzhou, design interventions should prioritize climatic and sensory comfort. Relevant measures include providing shaded walkways, planting continuous tree canopies, introducing localized cooling and misting devices in high-heat areas, applying noise-absorbing pavement or vegetated buffers, and improving tactile guidance and adaptive lighting along pedestrian routes. These directions indicate the value of adaptive governance that is tailored to specific urban contexts and responsive to evolving public expectations. Such context-sensitive approaches may contribute to more effective pedestrian environment improvements across diverse Chinese urban settings.
Several limitations should be acknowledged when interpreting the findings of this study. First, the cross-sectional design constrains the ability to capture temporal dynamics, as it reflects participants’ perceptions only at a single point in time. Consequently, it may not fully represent the evolving expectations or seasonal variations that shape pedestrian experiences. Second, although this study focuses on three major cities, Beijing, Shanghai, and Guangzhou, these urban contexts, while diverse, may not be entirely representative of other regions in China or international contexts. This limited geographic scope may therefore restrict the generalizability of the findings to cities with different cultural, economic, or infrastructural characteristics. Third, despite efforts to achieve a balanced sample, potential selection bias cannot be entirely ruled out, as participants are more likely to be individuals who are actively engaged in or interested in city walking activities. Moreover, perceptual evaluations are inherently subjective and may be affected by situational factors such as mood, weather, or time of day, introducing possible perception bias. Fourth, while the study aligns with the principles of experiential research, it lacks direct observational or behavioral data to substantiate the relationship between perceived and actual walking behaviors, thereby reducing the robustness of causal inferences. Finally, the operationalization of multisensory attributes remains at an early stage of conceptual and methodological development, requiring further theoretical refinement and empirical validation. To advance this line of inquiry, future research could employ longitudinal or mixed methods designs to capture temporal variations, expand the sample to encompass a wider range of cities and demographic groups, and integrate interdisciplinary approaches such as spatial analytics, movement trajectory data, behavioral observation, and stakeholder engagement. Such efforts would strengthen the empirical foundation of perception-based findings and contribute to a more comprehensive understanding of how pedestrian environments balance conservation, functionality, and experiential quality across diverse urban contexts.
7. Conclusions
Analysis of the three case cities suggests that pedestrian satisfaction in Chinese urban contexts is shaped by the interaction of physical form, institutional arrangements, and cultural expectations. Findings demonstrate that accessibility, safety, and clear route signage constitute basic expectations whose absence significantly reduces satisfaction, while attributes such as cultural landmarks, design aesthetics, and sensory diversity function as performance enhancers that elevate the walking experience. Shaded rest areas, coherent wayfinding systems, and integration of cultural narratives were identified as key interventions with the potential to improve both comfort and engagement. This research advances urban studies by conceptualizing citywalk as not only a spatial practice but also an experiential phenomenon shaped by perception and affect.
The IPA–Kano model results indicate that Beijing, Shanghai, and Guangzhou occupy different positions within the satisfaction–expectation cycle: Beijing represents a stage of consolidation, where spatial and architectural attributes function primarily as baseline conditions; Shanghai reflects a stage of spatial adaptation, with permeability and scale emerging as significant drivers of satisfaction; and Guangzhou illustrates a stage of experiential exploration, in which multisensory dimensions hold potential to enhance walking experiences. These variations imply that urban walking environments operate as evolving socio-spatial systems in which the relative importance of attributes may shift over time. A uniform model is unlikely to address the distinct priorities of each city. Instead, strategies should balance the maintenance of baseline provisions with targeted interventions: in Beijing, reinforcing infrastructural and accessibility fundamentals; in Shanghai, improving spatial legibility and permeability; and in Guangzhou, testing multisensory measures as pilot projects. A “pilot–evaluation–scaling” framework, integrating both quantitative and qualitative assessment, offers one way to enable iterative, evidence-based policy adjustment.
Author Contributions
Conceptualization, Q.W.; methodology P.M.; software, Q.W.; formal analysis, Q.W. and Z.Z.; investigation, P.M.; resources, Q.W. and Z.Z.; data curation, Q.W.; writing—original draft preparation, Q.W.; writing review and editing, P.M. and Z.Z.; supervision, P.M.; funding acquisition, P.M. All authors have read and agreed to the published version of the manuscript.
Funding
This research was sponsored by Zhejiang Province Philosophy and Social Sciences Planning Project (grant number 25NDJCO13YB) and National Natural Science Foundation of China (grant number 52208079).
Institutional Review Board Statement
Not applicable.
Informed Consent Statement
The semi-structured interview in this research is not greater than the minimum risk and written informed consent is not required in the circumstances.
Data Availability Statement
The original contributions presented in this study are included in the article. Further inquiries can be directed to the corresponding author.
Conflicts of Interest
The authors declare no conflict of interest.
Appendix A. Questionnaire on the Evaluation of the Top 3 Most Popular City Walk Streets in Beijing/Shanghai/Guangzhou
Part I: Basic Information
Please provide the following background information. Your responses will remain strictly confidential and will be used for research purposes only.
- Gender
① Male
② Female
- 2.
- Age
① Under 18
② 18–25
③ 26–35
④ 36–45
⑤ 46–60
⑥ Above 60
- 3.
- Place of Residence
① Beijing
② Shanghai
③ Guangzhou
- 4.
- Occupation
① Student
② Employed (Full-time/Part-time)
③ Freelancer
④ Retired
⑤ Other: ____________
- 5.
- Overall Satisfaction with the Urban Walking Environment
Please indicate your level of satisfaction:
⑥ Very Dissatisfied
⑦ Dissatisfied
⑧ Neutral
⑨ Satisfied
⑩ Very Satisfied
Part II: Importance Scale
For each item, please indicate how important you consider the factor to be when evaluating the urban walking environment. Use the following scale:
5 = Extremely Important
4 = Very Important
3 = Moderately Important
2 = Slightly Important
1 = Not Important at All
Table A1.
Questionnaire on importance scale.
Table A1.
Questionnaire on importance scale.
| Dimension | Item | Not Important at All | Slightly Important | Moderately Important | Very Important | Extremely Important |
|---|---|---|---|---|---|---|
| Spatial Configuration and Urban Morphological Quality | Spatial Enclosure and Containment Quality | [ ] | [ ] | [ ] | [ ] | [ ] |
| Scale Relationships and Proportional Harmony | [ ] | [ ] | [ ] | [ ] | [ ] | |
| Visual Permeability and Spatial Transparency | [ ] | [ ] | [ ] | [ ] | [ ] | |
| Spatial Sequence and Rhythmic Progression | [ ] | [ ] | [ ] | [ ] | [ ] | |
| Morphological Complexity and Legibility Balance | [ ] | [ ] | [ ] | [ ] | [ ] | |
| Architectural Interface and Building–Street Relationship Quality | Facade Articulation and Architectural Detail Richness | [ ] | [ ] | [ ] | [ ] | [ ] |
| Ground Floor Activation and Street Interface Quality | [ ] | [ ] | [ ] | [ ] | [ ] | |
| Architectural Character Coherence and Identity Strength | [ ] | [ ] | [ ] | [ ] | [ ] | |
| Building Setback and Transition Zone Quality | [ ] | [ ] | [ ] | [ ] | [ ] | |
| Historic Preservation and Temporal Layer Integration | [ ] | [ ] | [ ] | [ ] | [ ] | |
| Street Infrastructure and Pedestrian Facility Quality | Walking Surface and Pavement Quality | [ ] | [ ] | [ ] | [ ] | [ ] |
| Street Furniture and Urban Amenity Integration | [ ] | [ ] | [ ] | [ ] | [ ] | |
| Pedestrian Infrastructure and Circulation Systems | [ ] | [ ] | [ ] | [ ] | [ ] | |
| Wayfinding and Information Support Systems | [ ] | [ ] | [ ] | [ ] | [ ] | |
| Safety and Security Infrastructure | [ ] | [ ] | [ ] | [ ] | [ ] | |
| Landscape Integration and Environmental Design Quality | Urban Vegetation and Green Infrastructure Integration | [ ] | [ ] | [ ] | [ ] | [ ] |
| Water Feature and Hydrological Element Quality | [ ] | [ ] | [ ] | [ ] | [ ] | |
| Microclimate and Environmental Comfort Provision | [ ] | [ ] | [ ] | [ ] | [ ] | |
| Natural-Built Environment Interface and Integration | [ ] | [ ] | [ ] | [ ] | [ ] | |
| Biodiversity Visibility and Ecological Connection | [ ] | [ ] | [ ] | [ ] | [ ] | |
| Multi-Sensory Environment and Atmospheric Quality | Light Quality and Illumination Environment | [ ] | [ ] | [ ] | [ ] | [ ] |
| Acoustic Environment and Soundscape Quality | [ ] | [ ] | [ ] | [ ] | [ ] | |
| Air Quality and Atmospheric Conditions | [ ] | [ ] | [ ] | [ ] | [ ] | |
| Material Texture and Tactile Environmental Richness | [ ] | [ ] | [ ] | [ ] | [ ] | |
| Overall Atmospheric Character and Place Identity | [ ] | [ ] | [ ] | [ ] | [ ] |
Part III: Satisfaction Scale
For each item, please indicate how satisfied you are with the urban walking environment. Use the following scale:
5 = Extremely Satisfied
4 = Very Satisfied
3 = Moderately Satisfied
2 = Slightly Satisfied
1 = Not Satisfied at All
Table A2.
Questionnaire on satisfaction scale.
Table A2.
Questionnaire on satisfaction scale.
| Dimension | Item | Not Satisfied at All | Slightly Satisfied | Moderately Important | Very Satisfied | Extremely Satisfied |
|---|---|---|---|---|---|---|
| Spatial Configuration and Urban Morphological Quality | Spatial Enclosure and Containment Quality | [ ] | [ ] | [ ] | [ ] | [ ] |
| Scale Relationships and Proportional Harmony | [ ] | [ ] | [ ] | [ ] | [ ] | |
| Visual Permeability and Spatial Transparency | [ ] | [ ] | [ ] | [ ] | [ ] | |
| Spatial Sequence and Rhythmic Progression | [ ] | [ ] | [ ] | [ ] | [ ] | |
| Morphological Complexity and Legibility Balance | [ ] | [ ] | [ ] | [ ] | [ ] | |
| Architectural Interface and Building–Street Relationship Quality | Facade Articulation and Architectural Detail Richness | [ ] | [ ] | [ ] | [ ] | [ ] |
| Ground Floor Activation and Street Interface Quality | [ ] | [ ] | [ ] | [ ] | [ ] | |
| Architectural Character Coherence and Identity Strength | [ ] | [ ] | [ ] | [ ] | [ ] | |
| Building Setback and Transition Zone Quality | [ ] | [ ] | [ ] | [ ] | [ ] | |
| Historic Preservation and Temporal Layer Integration | [ ] | [ ] | [ ] | [ ] | [ ] | |
| Street Infrastructure and Pedestrian Facility Quality | Walking Surface and Pavement Quality | [ ] | [ ] | [ ] | [ ] | [ ] |
| Street Furniture and Urban Amenity Integration | [ ] | [ ] | [ ] | [ ] | [ ] | |
| Pedestrian Infrastructure and Circulation Systems | [ ] | [ ] | [ ] | [ ] | [ ] | |
| Wayfinding and Information Support Systems | [ ] | [ ] | [ ] | [ ] | [ ] | |
| Safety and Security Infrastructure | [ ] | [ ] | [ ] | [ ] | [ ] | |
| Landscape Integration and Environmental Design Quality | Urban Vegetation and Green Infrastructure Integration | [ ] | [ ] | [ ] | [ ] | [ ] |
| Water Feature and Hydrological Element Quality | [ ] | [ ] | [ ] | [ ] | [ ] | |
| Microclimate and Environmental Comfort Provision | [ ] | [ ] | [ ] | [ ] | [ ] | |
| Natural-Built Environment Interface and Integration | [ ] | [ ] | [ ] | [ ] | [ ] | |
| Biodiversity Visibility and Ecological Connection | [ ] | [ ] | [ ] | [ ] | [ ] | |
| Multi-Sensory Environment and Atmospheric Quality | Light Quality and Illumination Environment | [ ] | [ ] | [ ] | [ ] | [ ] |
| Acoustic Environment and Soundscape Quality | [ ] | [ ] | [ ] | [ ] | [ ] | |
| Air Quality and Atmospheric Conditions | [ ] | [ ] | [ ] | [ ] | [ ] | |
| Material Texture and Tactile Environmental Richness | [ ] | [ ] | [ ] | [ ] | [ ] | |
| Overall Atmospheric Character and Place Identity | [ ] | [ ] | [ ] | [ ] | [ ] |
Appendix B. Statistical Results of the Questionnaire Survey in Beijing/Shanghai/Guangzhou
Table A3.
Beijing.
Table A3.
Beijing.
| Not Important at All | Slightly Important | Moderately Important | Very Important | Extremely Important | Not Satisfied at All | Slightly Satisfied | Moderately Important | Very Satisfied | Extremely Satisfied | |
|---|---|---|---|---|---|---|---|---|---|---|
| SC1 | 20 | 17 | 15 | 71 | 88 | 26 | 32 | 26 | 67 | 60 |
| SC2 | 18 | 20 | 15 | 69 | 89 | 24 | 25 | 40 | 59 | 63 |
| SC3 | 15 | 14 | 22 | 62 | 98 | 24 | 18 | 38 | 67 | 64 |
| SC4 | 15 | 19 | 19 | 63 | 95 | 23 | 17 | 38 | 72 | 61 |
| SC5 | 16 | 27 | 14 | 23 | 131 | 21 | 26 | 38 | 57 | 69 |
| AI1 | 13 | 9 | 21 | 56 | 112 | 37 | 15 | 23 | 70 | 66 |
| AI2 | 8 | 17 | 15 | 67 | 104 | 34 | 21 | 28 | 69 | 59 |
| AI3 | 15 | 16 | 13 | 55 | 112 | 38 | 16 | 23 | 55 | 79 |
| AI4 | 13 | 9 | 18 | 71 | 100 | 29 | 22 | 27 | 59 | 74 |
| AI5 | 14 | 15 | 18 | 59 | 105 | 30 | 16 | 31 | 51 | 83 |
| IN1 | 15 | 21 | 14 | 42 | 119 | 33 | 17 | 30 | 71 | 60 |
| IN2 | 22 | 14 | 11 | 33 | 131 | 31 | 15 | 31 | 57 | 77 |
| IN3 | 20 | 11 | 16 | 34 | 130 | 33 | 18 | 26 | 62 | 72 |
| IN4 | 23 | 10 | 13 | 38 | 127 | 32 | 18 | 26 | 72 | 63 |
| IN5 | 18 | 14 | 17 | 34 | 128 | 29 | 15 | 28 | 91 | 48 |
| LE1 | 11 | 17 | 19 | 38 | 126 | 21 | 26 | 26 | 76 | 62 |
| LE2 | 19 | 18 | 7 | 30 | 137 | 29 | 25 | 25 | 69 | 63 |
| LE3 | 9 | 22 | 16 | 59 | 105 | 24 | 21 | 32 | 75 | 59 |
| LE4 | 13 | 17 | 17 | 47 | 117 | 25 | 13 | 39 | 63 | 71 |
| LE5 | 18 | 10 | 20 | 44 | 119 | 23 | 19 | 33 | 58 | 78 |
| ME1 | 18 | 12 | 17 | 51 | 113 | 25 | 17 | 33 | 65 | 71 |
| ME2 | 15 | 17 | 16 | 65 | 98 | 23 | 16 | 37 | 63 | 72 |
| ME3 | 14 | 14 | 21 | 60 | 102 | 27 | 17 | 33 | 74 | 60 |
| ME4 | 16 | 16 | 18 | 56 | 105 | 26 | 9 | 42 | 74 | 60 |
| ME5 | 14 | 16 | 19 | 62 | 100 | 30 | 21 | 31 | 67 | 62 |
Table A4.
Shanghai.
Table A4.
Shanghai.
| Not Important at All | Slightly Important | Moderately Important | Very Important | Extremely Important | Not Satisfied at All | Slightly Satisfied | Moderately Important | Very Satisfied | Extremely Satisfied | |
|---|---|---|---|---|---|---|---|---|---|---|
| SC1 | 17 | 33 | 57 | 51 | 50 | 30 | 37 | 54 | 40 | 47 |
| SC2 | 29 | 22 | 63 | 47 | 47 | 28 | 42 | 50 | 50 | 38 |
| SC3 | 28 | 21 | 61 | 43 | 55 | 30 | 44 | 46 | 42 | 46 |
| SC4 | 29 | 24 | 54 | 49 | 52 | 26 | 46 | 45 | 39 | 52 |
| SC5 | 26 | 25 | 58 | 50 | 49 | 27 | 40 | 62 | 32 | 47 |
| AI1 | 25 | 23 | 41 | 46 | 73 | 40 | 42 | 51 | 41 | 34 |
| AI2 | 25 | 20 | 59 | 42 | 62 | 40 | 36 | 52 | 35 | 45 |
| AI3 | 26 | 20 | 49 | 51 | 62 | 34 | 49 | 43 | 36 | 46 |
| AI4 | 27 | 18 | 46 | 47 | 70 | 35 | 46 | 49 | 38 | 40 |
| AI5 | 23 | 25 | 47 | 58 | 55 | 39 | 42 | 44 | 44 | 39 |
| IN1 | 24 | 29 | 62 | 44 | 49 | 21 | 49 | 59 | 41 | 38 |
| IN2 | 26 | 22 | 50 | 56 | 54 | 29 | 38 | 46 | 41 | 54 |
| IN3 | 30 | 20 | 63 | 46 | 49 | 25 | 45 | 54 | 35 | 49 |
| IN4 | 26 | 26 | 55 | 55 | 46 | 35 | 34 | 52 | 40 | 47 |
| IN5 | 26 | 23 | 61 | 50 | 48 | 35 | 38 | 49 | 41 | 45 |
| LE1 | 30 | 22 | 48 | 60 | 48 | 41 | 28 | 50 | 50 | 39 |
| LE2 | 27 | 19 | 63 | 46 | 53 | 51 | 21 | 46 | 53 | 37 |
| LE3 | 14 | 34 | 53 | 60 | 47 | 44 | 23 | 45 | 49 | 47 |
| LE4 | 17 | 35 | 52 | 47 | 57 | 39 | 24 | 67 | 38 | 40 |
| LE5 | 21 | 28 | 47 | 63 | 49 | 42 | 25 | 47 | 43 | 51 |
| ME1 | 23 | 25 | 62 | 41 | 57 | 51 | 27 | 58 | 33 | 39 |
| ME2 | 20 | 29 | 64 | 49 | 46 | 54 | 22 | 48 | 52 | 32 |
| ME3 | 25 | 25 | 59 | 48 | 51 | 59 | 16 | 51 | 43 | 39 |
| ME4 | 25 | 29 | 53 | 52 | 49 | 52 | 28 | 49 | 32 | 47 |
| ME5 | 29 | 23 | 58 | 51 | 47 | 58 | 21 | 53 | 40 | 36 |
Table A5.
Guangzhou.
Table A5.
Guangzhou.
| Not Important at All | Slightly Important | Moderately Important | Very Important | Extremely Important | Not Satisfied at All | Slightly Satisfied | Moderately Important | Very Satisfied | Extremely Satisfied | |
|---|---|---|---|---|---|---|---|---|---|---|
| SC1 | 21 | 41 | 41 | 44 | 62 | 74 | 33 | 41 | 33 | 28 |
| SC2 | 33 | 29 | 43 | 47 | 57 | 69 | 35 | 40 | 40 | 25 |
| SC3 | 31 | 30 | 39 | 40 | 69 | 73 | 25 | 42 | 35 | 34 |
| SC4 | 33 | 27 | 41 | 46 | 62 | 79 | 19 | 38 | 39 | 34 |
| SC5 | 25 | 39 | 42 | 49 | 54 | 73 | 28 | 45 | 34 | 29 |
| AI1 | 31 | 36 | 35 | 52 | 55 | 32 | 64 | 42 | 35 | 36 |
| AI2 | 30 | 41 | 40 | 45 | 53 | 42 | 50 | 50 | 38 | 29 |
| AI3 | 28 | 39 | 46 | 53 | 43 | 35 | 53 | 51 | 43 | 27 |
| AI4 | 34 | 33 | 43 | 63 | 36 | 45 | 47 | 55 | 36 | 26 |
| AI5 | 38 | 33 | 43 | 53 | 42 | 36 | 56 | 61 | 30 | 26 |
| IN1 | 41 | 35 | 46 | 39 | 48 | 26 | 39 | 58 | 44 | 42 |
| IN2 | 37 | 31 | 49 | 47 | 45 | 44 | 37 | 44 | 36 | 48 |
| IN3 | 35 | 35 | 36 | 47 | 56 | 30 | 43 | 41 | 44 | 51 |
| IN4 | 44 | 30 | 52 | 46 | 37 | 32 | 40 | 56 | 39 | 42 |
| IN5 | 38 | 35 | 48 | 39 | 49 | 35 | 41 | 47 | 44 | 42 |
| LE1 | 30 | 37 | 50 | 55 | 37 | 41 | 37 | 59 | 26 | 46 |
| LE2 | 33 | 36 | 44 | 51 | 45 | 31 | 46 | 53 | 38 | 41 |
| LE3 | 42 | 27 | 41 | 44 | 55 | 40 | 34 | 47 | 43 | 45 |
| LE4 | 36 | 31 | 51 | 38 | 53 | 48 | 30 | 54 | 41 | 36 |
| LE5 | 33 | 34 | 49 | 47 | 46 | 30 | 47 | 49 | 51 | 32 |
| ME1 | 35 | 31 | 50 | 51 | 42 | 71 | 26 | 37 | 42 | 33 |
| ME2 | 30 | 37 | 49 | 43 | 50 | 73 | 27 | 44 | 35 | 30 |
| ME3 | 37 | 29 | 55 | 48 | 40 | 61 | 34 | 34 | 39 | 41 |
| ME4 | 37 | 28 | 45 | 52 | 47 | 66 | 30 | 36 | 43 | 34 |
| ME5 | 33 | 34 | 47 | 52 | 43 | 69 | 36 | 31 | 40 | 33 |
References
- Joseph-Lester, J.; Kahane, A.; King, S.; Leslie, E. Walking in Cities: Navigating Post-Pandemic Urban Environments; Taylor & Francis: Abingdon, UK, 2024; ISBN 9781040040089. [Google Scholar]
- Sheller, M.; Urry, J. Mobilizing the new mobilities paradigm. Appl. Mobilities 2016, 1, 10–25. [Google Scholar] [CrossRef]
- Brenner, N.; Schmid, C. Towards a new epistemology of the urban? City 2015, 19, 151–182. [Google Scholar] [CrossRef]
- Zukin, S. Naked City: The Death and Life of Authentic Urban Places; Oxford University Press: Oxford, UK, 2009; 294p. [Google Scholar]
- Honey-Rosés, J.; Anguelovski, I.; Chireh, V.K.; Daher, C.; van den Konijnendijk Bosch, C.; Litt, J.S.; Mawani, V.; McCall, M.K.; Orellana, A.; Oscilowicz, E.; et al. The impact of COVID-19 on public space: An early review of the emerging questions—Design, perceptions and inequities. Cities Health 2021, 5, S263–S279. [Google Scholar] [CrossRef]
- Carmona, M. Place value: Place quality and its impact on health, social, economic and environmental outcomes. J. Urban Des. 2019, 24, 1–48. [Google Scholar] [CrossRef]
- Kärrholm, M.; Johansson, M.; Lindelöw, D.; Ferreira, I.A. Interseriality and Different Sorts of Walking: Suggestions for a Relational Approach to Urban Walking. Mobilities 2017, 12, 20–35. [Google Scholar] [CrossRef]
- Crawford, M.; Chase, J.; Kaliski, J. Everyday Urbanism; Monacelli Press: New York, NY, USA, 1999; ISBN 9781580932011. [Google Scholar]
- Hannam, K.; Sheller, M.; Urry, J. Editorial: Mobilities, Immobilities and Moorings. Mobilities 2006, 1, 1–22. [Google Scholar] [CrossRef]
- van Dijck, J.; Poell, T.; de Waal, M. The Platform Society: Public Values in a Connective World; Oxford University Press: New York, NY, USA, 2018; ISBN 9780190889784. [Google Scholar]
- Leszczynski, A. Spatial media/tion. Prog. Hum. Geogr. 2015, 39, 729–751. [Google Scholar] [CrossRef]
- Graham, M.; Zook, M. Augmented Realities and Uneven Geographies: Exploring the Geolinguistic Contours of the Web. Environ. Plan. A 2013, 45, 77–99. [Google Scholar] [CrossRef]
- Carmona, M. Public Places Urban Spaces, 3rd ed.; Routledge: New York, NY, USA, 2021; ISBN 9781315158457. [Google Scholar]
- Montgomery, C. Happy City: Transforming Our Lives Through Urban Design; Penguin UK: London, UK, 2013. [Google Scholar]
- Kim, H.; Yang, S. Neighborhood Walking and Social Capital: The Correlation between Walking Experience and Individual Perception of Social Capital. Sustainability 2017, 9, 680. [Google Scholar] [CrossRef]
- Harper, T.L.; Yeh, A.G.O.; Costa, H.S.d.M. Dialogues in Urban and Regional Planning 3; Routledge: New York, NY, USA; London, UK, 2008; ISBN 0415776236. [Google Scholar]
- Silva, P. Tactical urbanism: Towards an evolutionary cities’ approach? Environ. Plan. B Plan. Des. 2016, 43, 1040–1051. [Google Scholar] [CrossRef]
- Jiru, J.; Long, Z. Citywalk in China: Analysis of regional and route characteristics. J. Asian Archit. Build. Eng. 2025, 24, 4136–4147. [Google Scholar] [CrossRef]
- Liu, B. The Cultural Definition and Reproduction Path of City Walk in China: From Youth Subculture to Media Spectacle. J. Educ. 2024, 45, 387–391. [Google Scholar] [CrossRef]
- Chen, Z.; Tan, K.J.; Liao, Z.; Tung, V.W.S. Walking the hidden city: The role of citywalk in shaping destination branding experience. Tour. Recreat. Res. 2024, 50, 1300–1315. [Google Scholar] [CrossRef]
- Chen, X.; Sun, Y.; Ibrahim, F.I.B.; Kamarazaly, M.A.B.; Abidin, S.N.B.Z.; Tang, S. Social media interaction and built environment effects on urban walking experience: A machine learning analysis of Shanghai Citywalk. PLoS ONE 2025, 20, e0320951. [Google Scholar] [CrossRef] [PubMed]
- Wu, D. City walk in a gap day: Potential and opportunities for tourism and leisure. Tour. Rev. 2024, 79, 1576–1581. [Google Scholar] [CrossRef]
- Chen, L.; Yan, R.; Hu, Y. City walk or nature walk? Evidence-based psychological and physiological outcomes-A systematic review and meta-analysis. Urban For. Urban Green. 2025, 106, 128726. [Google Scholar] [CrossRef]
- Ewing, R.; Handy, S. Measuring the Unmeasurable: Urban Design Qualities Related to Walkability. J. Urban Des. 2009, 14, 65–84. [Google Scholar] [CrossRef]
- Yang, C.; Lo, S.M.; Ma, R.; Fang, H. The effect of the perceptible built environment on pedestrians’ walking behaviors in commercial districts: Evidence from Hong Kong. Environ. Plan. B Urban Anal. City Sci. 2024, 51, 789–806. [Google Scholar] [CrossRef]
- Alexander, C.; Ishikawa, S.; Silverstein, M.; Jacobson, M.; Fiksdahl-King, I.; Angel, S. A Pattern Language: Towns, Buildings, Construction; Oxford University Press: Oxford, UK, 2020. [Google Scholar]
- Gehl, J. Cities for People; Island Press: Washington, DC, USA, 2011; ISBN 9781597265737/9781597265744/9781597269841. [Google Scholar]
- Kim, J.; Kim, S. Finding the Optimal D/H Ratio for an Enclosed Urban Square: Testing an Urban Design Principle Using Immersive Virtual Reality Simulation Techniques. Int. J. Environ. Res. Public Health 2019, 16, 865. [Google Scholar] [CrossRef]
- Alonso de Andrade, P.; Berghauser Pont, M.; Amorim, L. Development of a Measure of Permeability between Private and Public Space. Urban Sci. 2018, 2, 87. [Google Scholar] [CrossRef]
- Jin, X. A Review of Cityscape Research Based on Dynamic Visual Perception. Land 2023, 12, 1229. [Google Scholar] [CrossRef]
- Edensor, T. Walking in rhythms: Place, regulation, style and the flow of experience. Vis. Stud. 2010, 25, 69–79. [Google Scholar] [CrossRef]
- Florio, P.; Leduc, T.; Sutter, Y.; Brémond, R. Visual complexity of urban streetscapes: Human vs computer vision. Mach. Vis. Appl. 2024, 35, 7. [Google Scholar] [CrossRef]
- Boeing, G. Measuring the complexity of urban form and design. Urban Des. Int. 2018, 23, 281–292. [Google Scholar] [CrossRef]
- Saffarian, S.; Shen, Z.; Biljecki, F. Walkability and Colour Experience: Façade Colours and Pedestrian Walking Preferences on Urban Streets Subtitle. In Proceedings of the 24th ISUF 2017: City and Territory in the Globalization Age, Valencia, Spain, 27–29 September 2017. [Google Scholar]
- Qin, J.; Feng, Y.; Sheng, Y.; Huang, Y.; Zhang, F.; Zhang, K. Evaluation of Pedestrian-Perceived Comfort on Urban Streets Using Multi-Source Data: A Case Study in Nanjing, China. IJGI 2025, 14, 63. [Google Scholar] [CrossRef]
- Stamps, A.E. Mystery, complexity, legibility and coherence: A meta-analysis. J. Environ. Psychol. 2004, 24, 1–16. [Google Scholar] [CrossRef]
- Lindal, P.J.; Hartig, T. Architectural variation, building height, and the restorative quality of urban residential streetscapes. J. Environ. Psychol. 2013, 33, 26–36. [Google Scholar] [CrossRef]
- Gehl, J. Life Between Buildings: Using Public Space, 6th ed.; The Danish Architectural Press: København, Denmark, 2006; ISBN 8774073605. [Google Scholar]
- Dameria, C.; Fuad, A.H. Enhancing female pedestrians’ safety perceptions through the permeability of building frontages (case study: Blok M area). IOP Conf. Ser. Earth Environ. Sci. 2021, 673, 12040. [Google Scholar] [CrossRef]
- Talen, E.; Shah, S. Neighborhood Evaluation Using GIS. Environ. Behav. 2007, 39, 583–615. [Google Scholar] [CrossRef]
- Wang, X.; Zhu, L.; Li, J.; Zhang, N.; Tang, Y.; Sun, Y.; Wu, H.; Cheng, C. Architectural Continuity Assessment of Rural Settlement Houses: A Systematic Literature Review. Land 2023, 12, 1399. [Google Scholar] [CrossRef]
- Chen, D. How Visitors Perceive Heritage Value—A Quantitative Study on Visitors’ Perceived Value and Satisfaction of Architectural Heritage through SEM. Sustainability 2023, 15, 9002. [Google Scholar] [CrossRef]
- Pikora, T.; Giles-Corti, B.; Bull, F.; Jamrozik, K.; Donovan, R. Developing a framework for assessment of the environmental determinants of walking and cycling. Soc. Sci. Med. 2003, 56, 1693–1703. [Google Scholar] [CrossRef]
- Saelens, B.E.; Sallis, J.F.; Frank, L.D. Environmental Correlates of Walking and Cycling: Findings From the Transportation, Urban Design, and Planning Literatures. Ann. Behav. Med. 2003, 25, 80–91. [Google Scholar] [CrossRef] [PubMed]
- Burton, E.; Mitchell, L. Inclusive Urban Design: Streets For Life; Routledge: London, UK, 2006; ISBN 9780080456454. [Google Scholar]
- Mehta, V. The Street: A Quintessential Social Public Space; Routledge: London, UK; New York, NY, USA, 2013; ISBN 9780415527101. [Google Scholar]
- Southworth, M. Streets and the Shaping of Towns and Cities; Island Press: Washington, DC, USA, 2003; ISBN 978-1559639163. [Google Scholar]
- Loukaitou-Sideris, A. Is it Safe to Walk? 1 Neighborhood Safety and Security Considerations and Their Effects on Walking. J. Plan. Lit. 2006, 20, 219–232. [Google Scholar] [CrossRef]
- Liu, M.; Zhang, B.; Luo, T.; Liu, Y.; Portnov, B.A.; Trop, T.; Jiao, W.; Liu, H.; Li, Y.; Liu, Q. Evaluating Street Lighting Quality in Residential Areas by Combining Remote Sensing Tools and a Survey on Pedestrians’ Perceptions of Safety and Visual Comfort. Remote Sens. 2022, 14, 826. [Google Scholar] [CrossRef]
- Delikostidis, I.; Engel, J.; Retsios, B.; van Elzakker, C.P.; Kraak, M.-J.; Döllner, J. Increasing the Usability of Pedestrian Navigation Interfaces by means of Landmark Visibility Analysis. J. Navig. 2013, 66, 523–537. [Google Scholar] [CrossRef]
- Aditya, T.; Laksono, D.; Sutanta, H.; Izzahudin, N.; Susanta, F. A Usability Evaluation of a 3d Map Display for Pedestrian Navigation. Int. Arch. Photogramm. Remote Sens. Spat. Inf. Sci. 2018, XLII-4/W10, 3–10. [Google Scholar] [CrossRef][Green Version]
- Miller, J.R. Biodiversity conservation and the extinction of experience. Trends Ecol. Evol. 2005, 20, 430–434. [Google Scholar] [CrossRef]
- Newman, P. The environmental impact of cities. Environ. Urban. 2006, 18, 275–295. [Google Scholar] [CrossRef]
- Beatley, T. Native to Nowhere: Sustaining Home and Community in a Global Age; Island Press: Washington, DC, USA, 2004; ISBN 1-55963-914-8. [Google Scholar]
- Tyrväinen, L.; Mäkinen, K.; Schipperijn, J. Tools for mapping social values of urban woodlands and other green areas. Landsc. Urban Plan. 2007, 79, 5–19. [Google Scholar] [CrossRef]
- Duan, Y.; Bai, H.; Li, S. Human Physiological Responses to Sitting and Walking in Green Spaces with Different Vegetation Structures: A Seasonal Comparative Study. Forests 2024, 15, 1759. [Google Scholar] [CrossRef]
- White, M.P.; Alcock, I.; Wheeler, B.W.; Depledge, M.H. Would you be happier living in a greener urban area? A fixed-effects analysis of panel data. Psychol. Sci. 2013, 24, 920–928. [Google Scholar] [CrossRef]
- Völker, S.; Kistemann, T. The impact of blue space on human health and well-being—Salutogenetic health effects of inland surface waters: A review. Int. J. Hyg. Environ. Health 2011, 214, 449–460. [Google Scholar] [CrossRef] [PubMed]
- Thorsson, S.; Lindqvist, M.; Lindqvist, S. Thermal bioclimatic conditions and patterns of behaviour in an urban park in Göteborg, Sweden. Int. J. Biometeorol. 2004, 48, 149–156. [Google Scholar] [CrossRef]
- Kántor, N.; Unger, J. The most problematic variable in the course of human-biometeorological comfort assessment—The mean radiant temperature. Open Geosci. 2011, 3, 90–100. [Google Scholar] [CrossRef]
- Weisser, W.W.; Hensel, M.; Barath, S.; Culshaw, V.; Grobman, Y.J.; Hauck, T.E.; Joschinski, J.; Ludwig, F.; Mimet, A.; Perini, K.; et al. Creating ecologically sound buildings by integrating ecology, architecture and computational design. People Nat. 2023, 5, 4–20. [Google Scholar] [CrossRef]
- van den Brink, M.; van den Brink, A.; Bruns, D. Boundary thinking in landscape architecture and boundary-spanning roles of landscape architects. Landsc. Res. 2022, 47, 1087–1099. [Google Scholar] [CrossRef]
- Murray, M.H.; Byers, K.A.; Buckley, J.; Lehrer, E.W.; Kay, C.; Fidino, M.; Magle, S.B.; German, D. Public perception of urban wildlife during a COVID-19 stay-at-home quarantine order in Chicago. Urban Ecosyst. 2023, 26, 127–140. [Google Scholar] [CrossRef]
- Norton, B.A.; Mears, M.; Warren, P.H.; Siriwardena, G.M.; Plummer, K.E.; Turner, T.; Hancock, S.; Grafius, D.R.; Evans, K.L. Biodiversity and environmental stressors along urban walking routes. Urban For. Urban Green. 2023, 85, 127951. [Google Scholar] [CrossRef]
- Giles-Corti, B.; Broomhall, M.H.; Knuiman, M.; Collins, C.; Douglas, K.; Ng, K.; Lange, A.; Donovan, R.J. Increasing walking: How important is distance to, attractiveness, and size of public open space? Am. J. Prev. Med. 2005, 28, 169–176. [Google Scholar] [CrossRef]
- Rojas-Rueda, D.; Nieuwenhuijsen, M.J.; Gascon, M.; Perez-Leon, D.; Mudu, P. Green spaces and mortality: A systematic review and meta-analysis of cohort studies. Lancet Planet. Health 2019, 3, e469–e477. [Google Scholar] [CrossRef]
- Frank, L.D.; Andresen, M.A.; Schmid, T.L. Obesity relationships with community design, physical activity, and time spent in cars. Am. J. Prev. Med. 2004, 27, 87–96. [Google Scholar] [CrossRef]
- Markvica, K.; Richter, G.; Lenz, G. Impact of urban street lighting on road users’ perception of public space and mobility behavior. Build. Environ. 2019, 154, 32–43. [Google Scholar] [CrossRef]
- Peña-García, A.; Hurtado, A.; Aguilar-Luzón, M.C. Impact of public lighting on pedestrians’ perception of safety and well-being. Saf. Sci. 2015, 78, 142–148. [Google Scholar] [CrossRef]
- Sundling, C.; Jakobsson, M. How Do Urban Walking Environments Impact Pedestrians’ Experience and Psychological Health? A Systematic Review. Sustainability 2023, 15, 10817. [Google Scholar] [CrossRef]
- Kang, J. Urban Sound Environment; Taylor & Francis: London, UK; New York, NY, USA, 2007; ISBN 0415358574. [Google Scholar]
- Brown, A.L.; Kang, J.; Gjestland, T. Towards standardization in soundscape preference assessment. Appl. Acoust. 2011, 72, 387–392. [Google Scholar] [CrossRef]
- Marquart, H.; Stark, K.; Jarass, J. How are air pollution and noise perceived en route? Investigating cyclists’ and pedestrians’ personal exposure, wellbeing and practices during commute. J. Transp. Health 2022, 24, 101325. [Google Scholar] [CrossRef]
- Zamora, A.N.; Campero, M.I.; Garcia, D.M.; King, A.C. Examining Relationships between Perceptions of Air Quality-Objectively Assessed Particulate Matter-And Health-Related Attributions among Midlife and Older Adults from the San Francisco Bay Area, California, USA. Int. J. Environ. Res. Public Health 2024, 21, 1010. [Google Scholar] [CrossRef]
- Zumthor, P. Atmospheres: Architectural Environments—Surrounding Objects; Birkhäuser Architecture: Basel, Switzerland, 2006; ISBN 978-3764374952. [Google Scholar]
- de La Fuente Suárez, L.A. Discovering the sensory, emotional, and interactive experiences of a place. Front. Psychol. 2024, 15, 1303397. [Google Scholar] [CrossRef]
Disclaimer/Publisher’s Note: The statements, opinions and data contained in all publications are solely those of the individual author(s) and contributor(s) and not of MDPI and/or the editor(s). MDPI and/or the editor(s) disclaim responsibility for any injury to people or property resulting from any ideas, methods, instructions or products referred to in the content. |
© 2025 by the authors. Licensee MDPI, Basel, Switzerland. This article is an open access article distributed under the terms and conditions of the Creative Commons Attribution (CC BY) license (https://creativecommons.org/licenses/by/4.0/).