Abstract
Spatial Daylight Autonomy (SDA) and Annual Sunlight Exposure (ASE) are widely adopted metrics for daylight performance assessment in sustainable building design. While valuable, the complexity of these metrics, particularly due to the influence of indirect bounced light, makes them difficult to interpret, especially in high-density residential buildings with multiple apartment units. Additionally, the computational intensity of such analyses limits their practical use in early-stage design or unit comparison. As a result, potential residents often rely solely on direct sunlight exposure when evaluating units without access to meaningful comparative data. To address this gap, this study proposes a simplified daylight evaluation metric, termed the Annual Daylight Index, that is both intuitive and computationally efficient. The index is defined as the total number of annual sunlight hours received across all floor areas of a building, divided by the number of rooms. Implemented using visual programming within a BIM environment, the method leverages a reverse sunlight tracing approach. Its accuracy and efficiency were verified by comparing results and computation times against established daylight simulation tools. The resulting index enables both micro (unit-level) and macro (building-level) comparisons, offering a practical tool for designers, residents, and researchers engaged in daylight evaluation of multi-unit housing projects.
1. Introduction
According to Konstantzos et al. [1], lighting has been shown to improve health, well-being, and task performance, thus making it a crucial factor for people when choosing a home to live in. Social surveys [2] have confirmed the need and desire for direct sunlight, especially in interior spaces. Thus, numerous design codes, regulations, and standards from around the world guarantee direct solar access rights.
In the Netherlands, the Bouwbesluit 2012 [3] requires a minimum of 3 h of sunlight on primary facades during the equinox period. Poland’s technical regulation [4] mandates at least 3 h of sunlight on living spaces during equinoxes, with lower standards for single-room units. Slovenia’s building code [5] states that buildings must receive at least 2 h of sunlight on 21 December, increasing to 4 h on the equinox and 6 h on the summer solstice. China’s urban residential design code [6] specifies a minimum of 2 to 3 h of sunlight around 20 January, depending on the city size. In Japan, national and local regulations [7] limit overshadowing of neighboring properties through setback and height controls tied to solar angles. Australia also enforces sunlight access: in New South Wales [8], at least 70% of apartments must receive 2 h of winter sun, while in Victoria [9], private open spaces must receive a minimum of 5 h of sunlight on the equinox. These diverse standards reflect a global concern for daylight quality in residential areas, especially in high-density housing. According to the Korean Building Act [10], to protect sunlight rights in apartment buildings, residents must have access to sunlight for at least two consecutive hours between 9 AM and 3 PM on the winter solstice.
Seoul is primarily recognized for its residential complexes, with apartments accounting for 43.6% of the city’s housing stock [11]. The average Floor Area Ratio (FAR) for these complexes ranges from 200% to 300%, while the average Building Coverage Ratio (BCR) falls between 15% and 25%. This results in high-density buildings that typically rise to about 30 stories [12]. The increasing construction of high-rise buildings in Seoul is restricting solar access, affecting the orientation of apartment units, and leading to legal disputes commonly referred to as the “battle for sunlight”, as some residences receive as little as 30 min of direct sunlight during the legally mandated period [13].
To prevent such conflicts, it is imperative to avoid constructing houses with inadequate sunlight, and residents must be made aware of the sunlight conditions before moving in. However, providing this information poses a significant challenge as architects face difficulties obtaining data about the sunlight exposure of a building, and residents have no means of knowing the level of brightness in their future residences. Urgent action is necessary to address these concerns.
In 2012, the Illuminating Engineering Society released metrics for analyzing annual climate-based daylighting [14]. Two years later, the Spatial Daylight Autonomy (sDA) and Annual Sunlight Exposure (ASE) metrics were introduced for evaluating daylight sufficiency and were subsequently adopted in LEEDv4. These metrics quickly gained popularity in the architecture community and were integrated into the lighting analysis software such as DesignBuilder, DIVA for Rhino, Honeybee for Grasshopper, and Insight for Revit. However, when applied to massive complexes, particularly in Korea, this metric, which includes direct and indirect bounce light, has limitations.
Firstly, sDA is defined by a threshold of 300 lux over 50% of the occupied hours for at least 55% of the floor area, a criterion originally developed for Western, work-oriented environments. This standard assumes that occupants engage in consistent visual tasks that require stable illumination levels. However, in Korean high-rise apartments, living rooms are typically spaces for resting, social interaction, and seasonal enjoyment of sunlight rather than task-oriented activities. In this context, the quality of daylight is understood less as a measure of illumination and more as an experiential and psychological condition. The presence, duration, and warmth of sunlight contribute to feelings of comfort, livability, and connection to the outdoors—qualities that are culturally and emotionally valued in Korean housing.
Accordingly, Korean daylight standards for residential design [10] emphasize the time of sunlight access—such as receiving at least two hours of direct sunlight in winter—rather than illuminance values. This time-based standard reflects a psychological expectation of comfort and well-being rather than a performance threshold. Several Korean studies [12] have also highlighted that daylight perception in residential contexts is influenced by cultural attitudes toward health, comfort, and seasonal light variation. Consequently, relying solely on metrics such as sDA or ASE, which focus on task-based efficiency, may result in misleading evaluations of daylight quality in Korean residential environments. Instead, accurate assessment in this context should incorporate both the physical duration of sunlight exposure and its psychological implications for occupant satisfaction.
Second, there is a significant need to compare units, buildings, and complexes based on direct sunlight hours. However, sDA/ASE cannot provide a tool for quick and direct comparison because of the complicated considerations of surface materials and indirect light calculations, and the speed of analysis is essential.
Given the limitations discussed above—including the growing demand for direct sunlight access, regulatory sunlight requirements, and the technical or cultural misalignment of the current daylighting metric—there is a clear need for a more accessible and context-appropriate method for evaluating sunlight in high-density, high-rise residential settings. This study aims to develop a simplified and efficient approach for calculating direct sunlight exposure, tailored to the needs of architects working with high-density apartment complexes. In parallel, it seeks to create an intuitive sunlight index that enables ordinary residents to understand and compare the sunlight conditions of residential units. By doing so, the research addresses both professional design needs and the public’s demand for greater transparency in solar access.
2. Materials and Methods
2.1. Methodologies
2.1.1. Theoretical Research
This research aims to develop a flexible, accessible, and rapid method for calculating direct sunlight in large, high-density apartment complexes. The first step is identifying the need for direct sunlight through extensive research of current papers and journals. In addition to residents’ demands, design codes and regulations mandated by the government serve as the basis for this research to ensure final practicality. The study will then determine the needs of architects regarding a better tool for calculating sunlight and examine the limitations of current tools to guide the development of a potential method. Furthermore, the best environment for developing a new tool will be chosen based on an overview of existing tools.
The present study investigates the impact of surface selection on research calculations, focusing on the plan surface instead of the façade. The accompanying figure provides a visual representation of the discrepancy in energy between the two surface options. Even with the same window area, and thus the same façade area, fluctuations in solar altitude and azimuth produce variations in the amount of sunlight reaching the interior. This difference can be explained by the cosine law of illumination, which states that the luminous flux E received on a surface is proportional to the cosine of the angle (θ) between the sunlight direction and the surface normal ().
For a vertical façade, when the sun is at a high altitude, the incident angle is large, causing to decrease and thereby reducing the luminous flux transmitted through the glazing. In contrast, on a horizontal plane, approaches 1 under the same condition, resulting in higher irradiance. As the sun lowers in the morning or afternoon, the façade receives sunlight at a more direct angle, increasing transmitted energy, while the horizontal surface experiences a larger and more elongated sunlight area due to shallower angles of incidence.
This geometric relationship clarifies why, even with an identical window size , the amount of transmitted energy () and the sunlight area () on the plan surface vary significantly throughout the day. At low solar altitudes, the window can deliver an additional energy component () into the room, increasing the sunlight area from A to () (Figure 1).
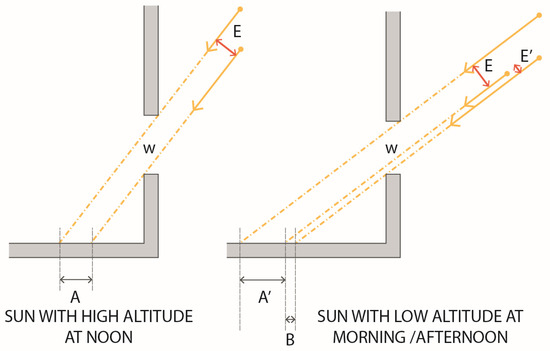
Figure 1.
Difference in energy when calculating on façade and plan.
The correlation of the energy at noon compared with morning can be calculated as follows:
where
A = Area receives sunlight at noon by an amount of sun energy E, with the window size W;
A’ = Area receives sunlight in the morning/afternoon by an amount of sun energy E;
B = Area receives sunlight in the morning/afternoon by an amount of sun energy E’;
E = Energy amount of the sun at noon, with the window size W;
E’ = Addition energy amount of sun in the morning/afternoon needed to cover the window size W.
These relationships demonstrate that while the façade receives relatively consistent flux across the day, the plan surface exhibits larger variation due to the cosine effect of solar incidence. Therefore, to achieve accurate evaluation of direct sunlight exposure in dense residential contexts, calculations should be based on the plan surface rather than the façade. Incorporating the cosine law ensures that results more accurately reflect the physical behavior of solar radiation and the perceived sunlight distribution within living spaces.
2.1.2. The Program Methodology
After tool selection, the next step is to perform direct sunlight calculations using coding based on two fundamental calculation tools:
- Vector from the Sun: Generate a vector from the sun’s position connecting obstacle points and openings in a room. This vector is employed to project sunlight and shadow onto a designated surface, with the sunlight area calculated by excluding the intersection of sunlight and shadow.
- Reverse Vector: Create a vector from a specific point towards the sun’s position. If this vector encounters no obstacles and successfully reaches the sun position, the corresponding point receives sunlight.
These tools enhance program efficiency and speed, leading to the development of two research methods. The optimal method will be selected based on performance.
2.1.3. Validation and Comparative Study
Upon completing programming for each method, a comparison with a validated tool ensures accuracy. Subsequently, further comparison between the proposed and current methods, focusing on requirements, especially speed, will determine the method that meets the necessary criteria.
2.2. Case Studies of the Research
With the rationale of harnessing natural light and ventilation from the south, typical floor plans of condominiums often take the form of an L or I shape. Rectangular windows, elongated in structure, are arranged to encompass 2 to 4 units facing either southwest or southeast directions [12]. Due to the similarity in the layout of this apartment, the computational model can be easily applied to residential complexes throughout the city of Seoul.
The selected case study of the research is the Jamsil Ricenz Apartment Complex which has a large population residing in multiple buildings with diverse orientations. The complex consists of 66 buildings, ranging from 24 to 33 levels, with 2–4 units on each level.
2.3. Literature Review
Several studies were conducted to explore new methods for achieving accurate daylighting calculations. One novel approach considered in these studies involved the use of visual programming tools such as Grasshopper for Rhino. Aksamija [15] employed an integrated computational workflow using Rhino 3D—with Grasshopper, Honeybee, and Ladybug plugins—alongside Revit with Insight 360 and Sefaira to conduct a comprehensive whole-building performance analysis. Meanwhile, Garcia et al. [16] compared new tools, Insight and DIVA, for daylighting analysis. In a separate study, Ghobad [17] summarized four popular workflows for daylighting calculation, namely DesignBuilder, DIVA for Rhino, Honeybee for Grasshopper, and Insight for Revit. All these methods adhered to standardized metrics such as sDA, ASE, and LEED v4, with graphical output represented in a colour grid. Some studies also included numerical output, albeit only for specific methods, as observed in Ghobad’s research.
Spiridigliozzi et al. [18] aimed to improve the workflow of daylighting calculation by utilizing BIM-BEM interoperability process and visual programming. The research involved three steps, namely modelling, information checking, and simulation, resulting in the production of a final graphical output. Although the study focused on daylighting calculation within the BIM environment, visual programming required the transfer of models between other software such as IDA ICE, and the outcome lacked numerical output. Another study by Awad and Abd-Rabo [19] focused not only on daylighting analysis but also on energy performance. This research served as an example of using Insight following the sDA and ASE standards. The daylighting calculation results in this study provided a pass/fail indication for each room. Over time, several methods have been enhanced to support additional requirements since the development period from 2013 to the present.
According to the studies mentioned above, most methods only provide graphical outputs and pass/fail results without any numerical data per room. Consequently, these approaches cannot facilitate the comparison of daylighting calculations among multiple apartments. Furthermore, only one study mentioned using a BIM environment, but the workflow required transferring between multiple software, leading to difficulties. To address this gap in previous research, this paper proposes a new approach that utilizes an integrated workflow in a BIM environment to generate numerical data for creating a lighting index.
Table 1 highlights Dynamo for Revit as a promising tool for improving lighting calculations. Similarly to Grasshopper, it supports analysis tools like Ladybug and Honeybee, directly integrating with Revit. A comparison reveals limitations in existing tools, such as Insight, which lacks details on specific sunlight-receiving areas. In contrast, Dynamo, a free coding environment based on Revit, has the potential to leverage Ladybug and Honeybee’s strengths for more advanced direct sunlight calculations.

Table 1.
Comparison of the potential tools to take research.
2.4. Sunlight Vector Method Concept
This study analyzes individual units within the condominium complex by considering factors such as the sun’s position, unit location, room dimensions, working plane height (0.8 m above the floor level), wall openings, and shadows cast by adjacent or higher floors. Figure 2 illustrates the analysis procedure. From the corner points of each wall opening, vectors are drawn in the same direction as the sunlight vector. These vectors are then projected onto the working plane, where their intersection points define the illuminated area, representing the sunlight penetration at a given time.
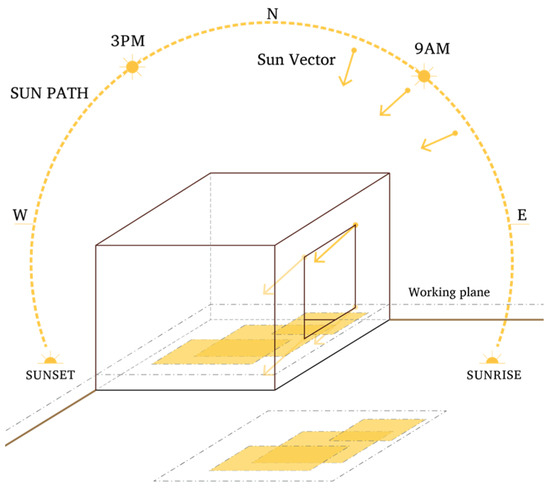
Figure 2.
Obtaining sunlight area in a room.
2.4.1. Obtaining the Shadow Area of Surrounding Buildings and Above Floors (Figure 3)
The same method is applied to calculate the shadow areas cast by surrounding buildings and upper floors. The program uses local environmental data to determine the sun’s position and corresponding sunlight vector at a specific time. Vectors aligned with the sunlight direction are drawn from the top corner points of each building and projected onto the working plane. The Opening Border Top and Opening Border Bottom families are defined using respective lines and points, allowing consistent connection between projected elements. It is essential that the Opening Border Bottom family is moved onto the same level as the calculated working plane. To include shadows from upper floors, surfaces are connected accordingly, completing the shadow generation process.
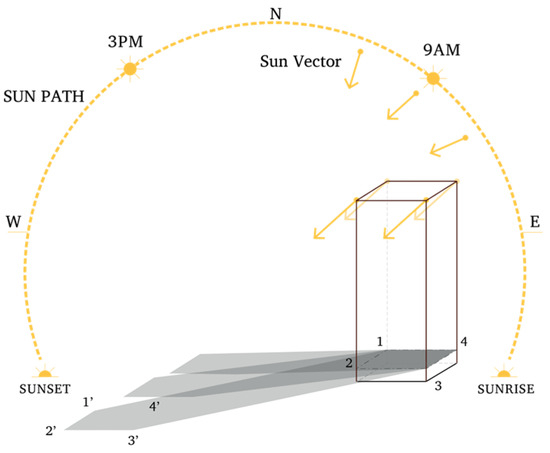
Figure 3.
Obtaining the shadow area of the surrounding buildings by joining points.
2.4.2. Subtracting the Area of Sunlight and Shadow (Figure 4)
After generating sunlight and shadow areas for a specific time, the total direct sunlight area is computed by subtracting the shadow area from the sunlight area. To optimize programming speed while maintaining research objectives, some constraints are applied:
- Considering only high-altitude direct sunlight: At low solar altitudes, the projected sunlight area on the working plane becomes distorted, as sunlight primarily strikes surrounding wall surfaces. Accounting for these effects would require additional calculation planes, increasing computational demand. To maintain analytical consistency and improve efficiency, this study limits analysis to sunlight projected onto the working plane, excluding sunlight on walls and that from excessively low solar altitudes.
- Wall thickness at the opening is assumed to be zero: Although walls possess physical thickness that affects the actual sunlight penetration area depending on solar position, apartment units generally share consistent window and façade designs. Thus, this study assumes zero wall thickness at all openings to simplify computation and improve efficiency without compromising the reliability of the sunlight index.
- Excluding bounce light and material effects on sunlight: As this study focuses exclusively on direct sunlight, secondary effects such as bounce light and material properties are excluded from the analysis. This simplification reduces modeling complexity and computation time without affecting the validity of the direct sunlight evaluation.
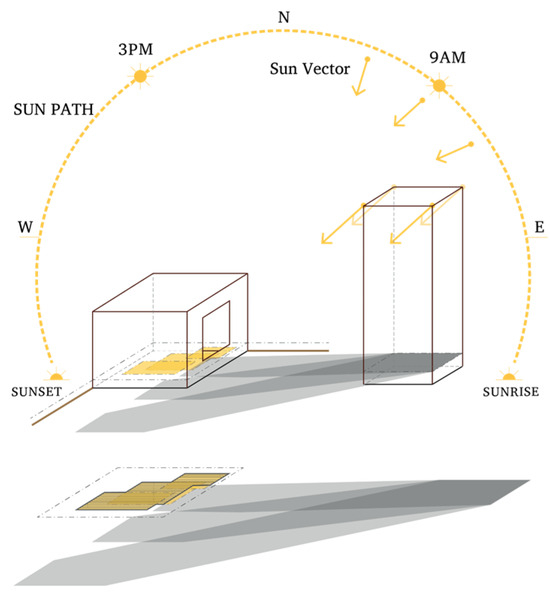
Figure 4.
Total direct sunlight is by subtraction.
This methodology proceeds through three main phases: (1) developing a 3D model of the study area, (2) generating sunlight and shadow data through visual programming, and (3) computing the final sunlight index.
2.5. Reverse Sunlight Vector Method Concept
In many solar geometry conventions (including Revit’s and Dynamo’s), the sunlight direction vector (from the sun toward the surface) (Figure 5a) is defined as:
where
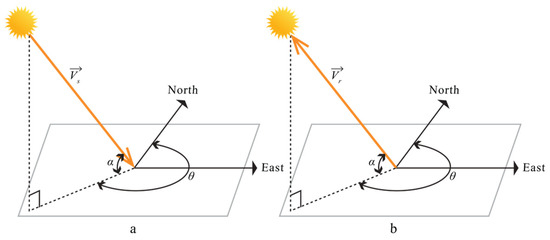
Figure 5.
(a) Sunlight vector; (b) Reverse Sunlight Vector.
: Solar altitude angle (angle of the sun above the horizon).
: Solar azimuth angle (angle of the sun’s projection on the horizontal plane, measured from north or east depending on convention).
A reverse sunlight vector (Figure 5b) originates from the receiver point and is oriented based on the sun’s position at a specific time, defined by the solar altitude angle and azimuth angle . The vector direction can be expressed as:
This vector represents the direction opposite to the incident sunlight and is generated by Dynamo using local weather data from Revit. The reverse sunlight vector method is basically checking whether the reverse sunlight vector from the receiver in that direction is obstructed or effectively simulating the sunlight path in reverse, from receiver to source.
The reverse sunlight vector method is based on four key factors: the positions of the sun, the location of the receiver object, the height of the working plane, and the presence of obstacles. The code for this method involves the following steps:
2.5.1. Creating the Receiver Object and Placing It on the Grid of the Surface That Will Receive Sunlight (Figure 6)
The receiver object is implemented as a Revit family, represented by a point at the center of a transparent cube. Each cube is positioned at the center of a corresponding square cell on the grid plane, with grid size determined according to a standard described later. A reverse sunlight vector originates from the cube’s center and is oriented based on the sun’s position and the direction of sunlight vectors at a specific time, which is generated by Dynamo using the local weather data in Revit.
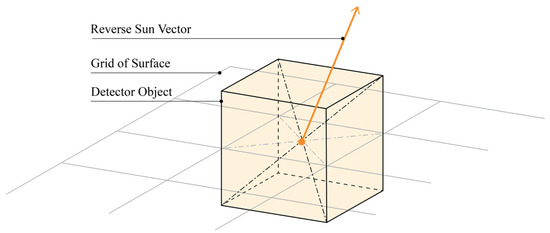
Figure 6.
The receiver object placed on the grid surface.
As a BIM entity, the receiver encapsulates both 3D geometry and associated data, including level, room name, unit name, location, grid size, and sunlight hours. This approach allows the receiver to serve as an information storage medium, eliminating the need to export data via Excel. Revit subsequently manages scheduling and data organization.
2.5.2. Checking for Clashes Between the Reverse Sunlight Vector and Any Obstacles and Recording the Data in the Receiver Parameters (Figure 7)
To identify clashes with obstacles, project buildings are defined as 3D geometry obstacles. Dynamo checks for clashes, and if one occurs, a zero value is recorded for the sunlight hour parameter in the receiver object’s parameters for that period. The sunlight hour parameter accumulates values per reverse sunlight vector throughout the calculation period.
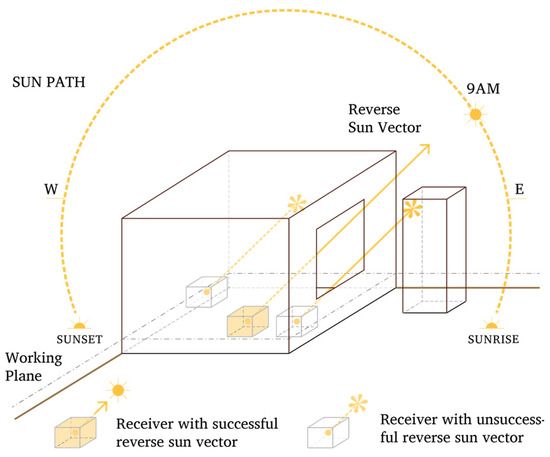
Figure 7.
The clash detection between reverse sunlight vectors.
3. Results
3.1. Sunlight Vector Method Process
3.1.1. The First Phase: Modeling
Following site visits, essential data for the case study buildings was collected for a new Revit model. Wall openings, excluding window or door details, were accurately positioned. Creating a rectangular wall opening could yield at least eight curves with unordered points, posing challenges in vector definition, especially for intricate wall openings. To overcome this, an Opening Borders family was introduced, consisting of lines following the wall opening border, pre-defined as simple (rectangular) or complex (more than 4 borders).
Approximately 3000 rooms and room names need to be placed inside the Revit model. All the surrounding buildings will be simplified to be a group of boxes with Top and Bottom Families.
3.1.2. The Second Phase: Programming Execution
The Dynamo code comprises eight consecutive modules, each serving a distinct function:
- Module 1: Sun Position and Tracking Family Input;
- Module 2: Levels Input;
- Module 3: Top and Bottom Input for Surrounding Buildings;
- Module 4: Working Plane Generation;
- Module 5: Above-Floor and Surrounding Buildings’ Surfaces Generation;
- Module 6: Sunlight Areas Execution within Rooms;
- Module 7: Shadow Areas Calculation;
- Module 8: Sunlight Areas Calculation (by subtracting shadow areas).
3.1.3. Visual Output
Upon completion of the code execution, Dynamo will generate an Excel file containing the data output. During the execution process, a graphical output plan is created for each level, illustrating the areas of sunlight and shadow (Figure 8).
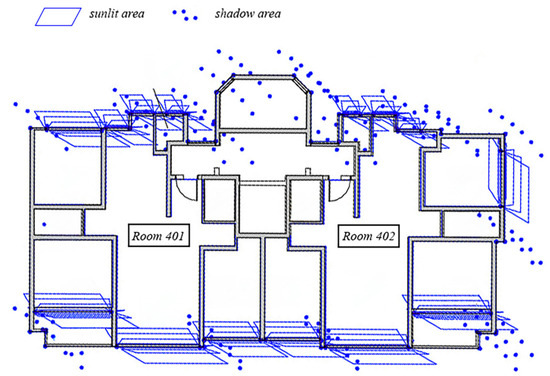
Figure 8.
Result by Dynamo code for the illustration of shadow and direct sunlight at level 4, building 201.
3.1.4. The Conclusion About the Sunlight Vector Method
Despite showing promising initial results, the method is limited by its inherent restrictions. Consequently, an alternative approach has been developed that employs the same idea but with a different methodology.
3.2. The Reverse Sunlight Vector Method Process
3.2.1. The First Phase: Modeling
Grids were created on each floor using existing building models, and receiver cubes were placed on these grids. As the Korean Building Act (1992) [20] does not specify a minimum sunlight area requirement, the study follows Australian Apartment design guides [21] for a minimum sunlight area of 1 square meter at the working plane level. To balance calculation speed and accuracy, a grid will be created at 800 mm above floor level, with grid size of 500 × 500 mm (Figure 9).
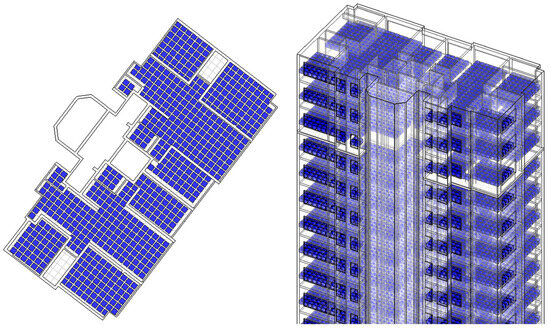
Figure 9.
Floor plans 27 and 3D model of building 201 with grid size 500 × 500 mm, blue squares are receiver cubes.
3.2.2. The Second Phase: Programming Execution
The following explanation describes the five correlative modules used in the Dynamo code (Figure A1):
- Module 1 (Figure A2): Select and Retrieve Receiver Locations: Module 1 imports all receiver families based on type using ‘Family.Types’. Filtering with ‘Element.GetParameterValueByName’, ‘String.Contain’, and ‘List.FilterByBoolMask’ identifies receiver locations in the project.
- Module 2 (Figure A3): Sun Position and Sunlight Vectors from EPW File: Seoul’s weather data, sourced from the EPW file, is imported into Dynamo. ‘Code block’ and ‘Calculate HOY’ determine the calculation time, exporting it to ‘SunPath’, which, in turn, provides sunlight vectors based on specified location and time.
- Module 3 (Figure A4): Obstacle Selection and Union: Module 3 treats all project objects as obstacles, utilizing ‘Select Model Elements’, ‘Element.Geometry’, ‘List.Flatten’, and ‘Solid.ByUnion’ to convert input objects into a single solid object.
- Module 4 (Figure A5): Create Reverse Sunlight Vectors: Module 4 reverses sunlight vectors from Module 2 using ‘Vector.Reverse’, generating reverse sunlight vectors based on receiver locations. These vectors are crucial for clash detection in Module 5.
- Modules 5 and 6 (Figure A6): Clash Detection and Result Recording: Modules 5 and 6, the final stages, employ ‘Geometry.DoesIntersect’ to detect clashes between reverse sunlight vectors and obstacles. If no intersection occurs, the corresponding receiver accumulates an additional sunlight hour in the “sun hour” parameter.
3.2.3. Visual Output
The reverse sunlight vector method presents a more visually engaging output compared to the sunlight vector method, utilizing color to represent sun hour values in each square grid (Figure 10). This graphic approach enhances intuitiveness and visual appeal, facilitating pattern identification and insights from the results.
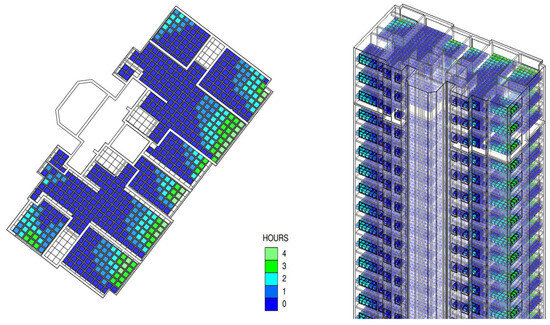
Figure 10.
Visual output plan and 3D model for the illustration of shadow and direct sunlight by reverse vector method, building 203.
3.2.4. Accuracy Checking
For validation, the widely accepted Revit Insight lighting analysis software was employed. Figure 11 shows a comparison of the method to Insight by analyzing sunlight areas in both plans, revealing nearly identical results. Although Insight does not provide a sunlight area schedule, comparing sun hour numbers per room between Insight and the reverse sunlight vector method (Table 2) indicates reliable results, as the values align closely according to the schedule.
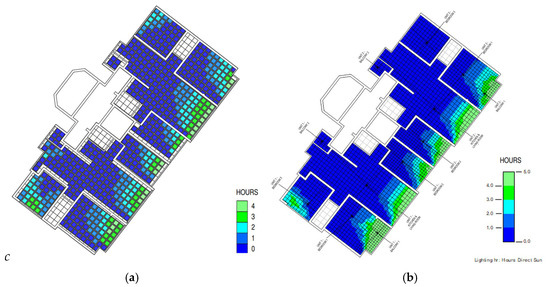
Figure 11.
Visual plan output of level 7 building 203: (a) reverse vector method, (b) insight.

Table 2.
Sunlight hour per room at level 27 building 203 from reverse vector method and Insight.
3.2.5. The Third Phase: Output Data Execution
This research utilizes variable inputs such as day, start and end hours (from 9 am to 3 pm), and time step. The reverse vector method, distinct from the sunlight vector method, leverages Revit’s unique capability to export schedules directly to Excel. This feature, not common in many other tools, allows the method to provide both sun-hours and sunlit areas for specific rooms, making it stand out in the field. The integration with Revit enhances the BIM workflow significantly.
3.3. The Direct Sun Index
The proposed Direct Sunlight Index extends beyond the calculation of sunlight at specific times or locations, emphasizing instead a cumulative evaluation across an area. It introduces the concept of an index representing the total sunlight received within a defined spatial domain. The index, denoted as S’H’, is theoretically defined as 100% sunlight, where S is the total area and H is the total measurement time for sunlight reception. The index is derived by comparing the accumulated sunlight irradiation time per unit area (S’H’) during the measurement period to the reference value representing full sunlight exposure (SH).
The application of the Reverse Sunlight Vectors method produces detailed results for the Direct Sunlight Index. This method determines building geometry and its influence on sunlight penetration, providing data for all rooms in each unit at every level within the complex. The computational procedure evaluates total sunlight hours, accumulated sunlit areas, and individual room areas to determine the daily sunlight ratio using the following equation:
where the total measurement duration: (hour).
And
Ru = Direct sunlight ratio of a unit (%);
Ark = Sunlight exposed area of room r at time step k (m2);
Su = Total area of the unit (m2);
n = Number of rooms in the unit;
m = Number of time steps in the measurement period;
Δτ = Time step interval.
In this equation, Δτ is adjustably set to 1 h, 10 min, or 1 min depending on the desired temporal resolution. While the resulting sunlight ratio remains constant, a smaller Δτ enhances the accuracy of the computation.
In Table 3, the direct sunlight index number Ru of unit 1, level 27, building 203 is calculated as below:

Table 3.
Direct sunlight index of unit 1 at level 27, building 203 from 9 am to 3 pm on 22nd December.
Here, Au represents the daily total sunlit area of the unit during the measurement period, corresponding to the total value of as defined in Equation (2). Therefore, Equation (3) is a simplified form of the same ratio, in which the daily sunlit area has already been integrated over all time steps. It is worth noting that, here in this study, H = 6 h (from 9 am to 3 pm).
Based on the data obtained from various units, as shown in Table 3, the data for the buildings over the course of four days in a year have been calculated and are presented in Figure 12. Similarly, to determine the overall direct sunlight of the entire complex, the data for each building are combined for the four days in a year (including the solstice and equinox days). However, due to the variability in the number of levels and units within each building, the daily sunlit area that receives direct sunlight must be divided by the number of levels to obtain the average accumulated sunlit area.
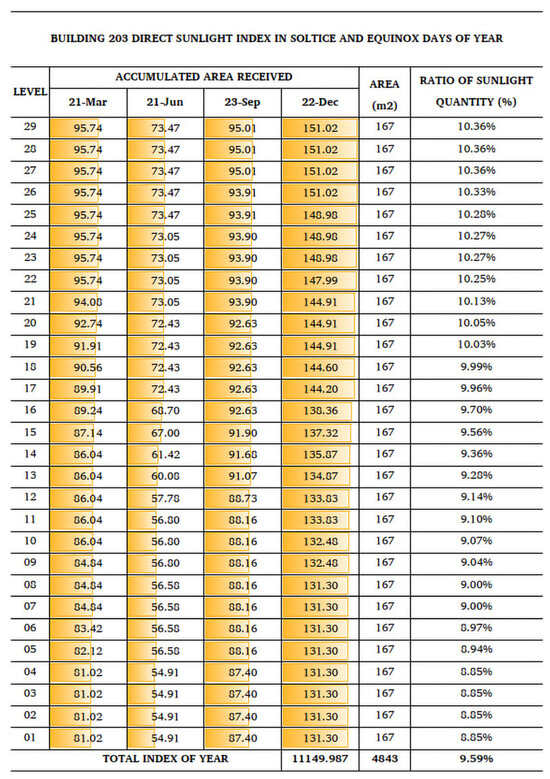
Figure 12.
Direct sunlight index of a building in four days of a year.
The equation below is used to calculate the average accumulated sunlit area for each building within the complex as shown in Table 4:
where

Table 4.
The direct sunlight index of the Jamsil Ricenz Apartment Complex.
Aavg = The average accumulated sunlit area per level of a building (m2 h);
AU = Daily sunlit area in four days of the year (m2 h);
N = Number of levels.
The direct sunlight ratio (%) in the whole complex index is calculated by dividing the total accumulated sunlit area of a building by the total building area, multiplied by the total sunlight hours over the measurement period, as shown by the following equation:
where
A = Total sunlit area of a building (m2 h);
AU = Sunlit area of a unit in a building (m2 h);
S = Building area (m2);
H = Number of time slots in the calculation period (hour);
R = Direct sunlight ratio of a building (%).
Based on the results, a direct sunlight index map and a range index (Figure 13, Figure A7 and Figure A8) can be created to provide a better understanding of the distribution of sunlight in the case study site. The results indicate that approximately 7% of buildings have a direct sunlight index of under 10%, while around 9% of buildings have a direct sunlight index of over 11%. Most buildings, roughly 84%, fall within the medium range of sunlight quantity.
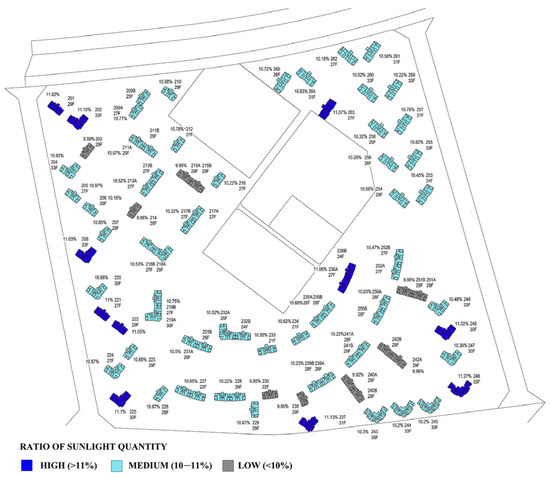
Figure 13.
The direct sunlight index map of the Jamsil Ricenz Apartment Complex.
The direct sunlight ratio in a building provides a comparison between the amounts of sunlight received across various buildings within the complex. The Direct Sunlight Index, assessed at both building and complex scales, offers valuable insights for architects, urban planners, and policymakers when developing or refining urban design strategies. A comprehensive understanding of this data enables more informed decision-making by all stakeholders, promoting improved living quality and environmental performance.
Table 5 summarizes the potential applications of the Direct Sunlight Index at different calculation scales. At the unit level (Table 2 and Table 3), the index provides direct, user-centered information that allows residents to assess and compare direct sunlight access in individual apartments. For example, Table 2 shows that although they are located at the same level, unit 2701 has much more direct sunlight than unit 2702. Due to the varying window placements on the façade, some bedrooms receive direct sunlight only in the morning. This is particularly beneficial for evaluating comfort, energy savings, or seasonal daylight conditions prior to moving in.

Table 5.
Direct sunlight index usage per scale.
At the building scale (Figure 12), the index supports architects and residents in understanding the overall daylight performance of a building. For instance, Figure 12 illustrates that building 201 receives the greatest amount of direct sunlight in December and the least in June, primarily due to its orientation.
Moreover, there is an increase in direct sunlight area from the lower to upper level. This pattern results from the shadow effects of surrounding buildings on the lower floors. Although in each season, the differences in direct sunlight area between levels are small (Figure 12), but in a year, the gaps are notable (Table 6). This index provides residents with a quick way to identify which units receive the most and least direct sunlight annually. Architects can use these results to refine façade design, window configuration, or orientation strategies to optimize daylight access for multiple units.

Table 6.
Data of Total Sunlit Area in each unit of building 201 in a year.
At the complex scale (Table 4 and Figure 13), the index becomes a strategic urban analysis tool for architects, urban planners, and policymakers. As can be seen in Figure 13, many buildings at the center have less direct sunlight than outer ones, likely due to mutual shading from surrounding taller or closely spaced buildings. Peripheral buildings, particularly those along the Southwestern and Southeastern edges, have unobstructed exposure and thus show higher ratios. Taller buildings (e.g., 30F–33F) generally gain more exposure to sunlight on upper levels, but their height also creates extended shadows that reduce sunlight for adjacent lower structures. In addition, the buildings’ orientation also impacts the amount of sunlight. Buildings facing South or Southeast tend to have higher sunlight ratios, as they receive more direct sunlight during the day, especially in winter when the sun’s path is lower. Conversely, buildings facing North or Northwest receive less direct sunlight, resulting in lower ratios. Overall, the index can be employed to evaluate sunlight distribution patterns across the site, identify shaded zones, or compare the solar performance of different building clusters, which informs long-term planning and development policies.
Because the Reverse Sunlight Vector method provides both quantitative outputs and visualized results, it enables an integrated overview of sunlight conditions. This approach makes sunlight information more transparent and accessible not only to professionals but also to residents, supporting data-driven decision-making in residential design and urban development. Moreover, it can also contribute to enhancing the real estate market and improving overall quality of life.
4. Discussion
The reverse vector method satisfies most of the criteria outlined in the hypothesis for a new method. Firstly, the method is free as it leverages the Dynamo software. Secondly, the use of optimization techniques enables the method to rapidly calculate direct sunlight for large and dense apartment complexes. Thirdly, the method is seamlessly integrated into the BIM workflow, ensuring a streamlined process. Fourthly, the method provides both graphical and numerical data by delivering sun hours and direct sunlight area information. Furthermore, the reverse vector method is flexible and can be applied to various situations that require direct sunlight calculation. Therefore, the reverse vector method represents a promising solution for the calculation of direct sunlight in the built environment.
As the reverse sunlight vector method has been found to provide more benefits than the sunlight vector method in studies, researchers have opted to use this method for speed comparison. Other tools included in the comparison are Insight for Revit (a BIM modeling environment with cloud-based analysis capabilities) and Grasshopper and Honeybee for Rhino (tools for NURBS modeling and coding analysis). The comparison is carried out using the same case study and follows the entire workflow, including modeling, execution, and generating outputs. While the process of the reverse sunlight vector method has been explained in detail, the following figures provide an overview of the process for Insight and Grasshopper, and Honeybee.
The present study compares three different methods of modeling based on the two types of modeling: Revit with BIM environment or Rhino with NURBS environment. The results indicate that Revit outperforms Rhino in terms of modeling speed. Revit offers advantages such as efficient handling of model objects, provision of multiple working views, and automatic parameter changes, thereby enabling rapid modeling, particularly for large-scale projects like apartment complexes. In contrast, Rhino only defines objects as lines, surfaces and requires manual management of layers, which makes it more challenging to handle larger projects. In the case study project, Revit required only three hours of modeling time, while Rhino took an entire day to complete. The use of different coding algorithms in Dynamo and Grasshopper (Insight is cloud-based) renders the comparison of execution time or coding time relative. The time spent on each method was as follows:
- The reverse sunlight vector method (Revit modeling and coding in Dynamo) took approximately 45 min for one building.
- Insight (Revit modeling and Insight on cloud) was the third in speed due to the slow upload and download of files, and it delivered sun hours without area data.
- Ladybug and Honeybee (Rhino modeling, coding in Grasshopper) were nearly the same as the reverse sunlight vector method but did not support numerical data output. At least two more programs were needed to achieve figure output (creating room space and exporting Excel data), along with more plugins (TT.Toolbox, Lunchbox, etc.), and complicated coding. Additionally, it required more modeling work to create room spaces.
Based on the workflow comparison and the final output of each method, the reverse sunlight vector method may not be the fastest in terms of execution speed. However, due to its flexibility in supporting various requirements and providing many output types, it could be considered the best-integrated workflow for direct sunlight calculation.
When comparing the reverse vector method with traditional calculation, which includes both direct and indirect sunlight, there is a noticeable difference in the results obtained through the sDA and ASE methods. The lighting plan (Figure 14) shows sunlight in almost every room near the window, but the reverse vector method indicates that only a few rooms have direct sunlight coming in. This difference can be attributed to the common misconception among people about sunlight. Ordinary people often associate a room with direct sunlight with a bright room. Hence, they may not understand why the sDA and ASE plans show sunlight in almost every room. Therefore, people may find it more familiar to use the direct sunlight index using the reverse vector method.
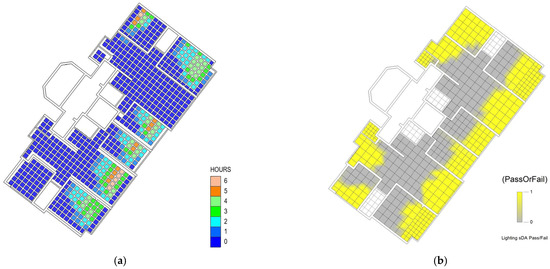
Figure 14.
Level 5, building 203: (a) Visual output plan in one year of direct sunlight by reverse sunlight vector method; (b) visual output plan in one year of sDA & ASE method by Insight.
5. Conclusions
Although many standards and software exist for calculating direct sunlight, convenient and intuitive methods for both architects and the public remain limited. This study addresses this gap by developing an approach and creating an example index for a large residential complex, culminating in the Reverse Sunlight Vector method and the comparative light index.
The Reverse Sunlight Vector method satisfies the key criteria for an effective sunlight calculation tool: it is free, fast, flexible, BIM-integrated, and provides both numerical and graphical outputs. Compared to other methods—Insight for Revit and Ladybug/Honeybee for Rhino—it demonstrates superior integration and usability, making it the most practical solution for analyzing direct sunlight in large apartment complexes. Unlike traditional sDA and ASE methods, it more accurately reflects actual direct sunlight exposure, offering a clearer, more intuitive assessment for residents and designers.
The Direct Sunlight Index enables quantitative and comparative analysis across multiple scales: unit, building, and complex—supporting diverse decision-making needs. At the unit level, it helps residents evaluate comfort, daylight availability, and seasonal variation. At the building level, it aids residents and architects in understanding vertical sunlight distribution and optimizing façade or orientation design. At the complex scale, it provides architects, urban planners, and policymakers with a strategic tool to assess solar performance, identify shaded zones, and guide sustainable urban planning. By integrating quantitative and visualized outputs, the method enhances transparency and accessibility, supporting data-driven decisions that improve residential quality, environmental performance, and real estate value.
A limitation of this study is that the Reverse Sunlight Vector method has not yet been validated against a fully mathematically defined reference object with precisely described inverse vectors, analyzed space centers, and window geometries. While the software used in this study already calculates these positions automatically according to its internal modeling rules, extracting and explicitly representing these values mathematically would require extending the current method. Therefore, rigorous analytical validation is possible, but it was beyond the scope of this study. Future work could focus on retrieving these mathematical descriptions from the model to enable such validation.
Future research could also improve workflow efficiency for faster sunlight calculations and explore the applicability of the method across different building types and scales. Additionally, integrating this approach with other sustainable design and energy analysis tools could further optimize overall building performance.
Author Contributions
Conceptualization, methodology, validation, supervision, D.-h.K.; software, formal analysis, visualization, H.B.P.L.; data curation, writing—original draft preparation, H.B.P.L. and T.T.N.; writing—review and editing, T.T.N. All authors have read and agreed to the published version of the manuscript.
Funding
This work was supported by the National Research Foundation of Korea (NRF) grant funded by the Korea government (MSIT) (2023R1A2C1007170).
Data Availability Statement
The data presented in this study is available on request from the corresponding author. The data are not publicly available because they are part of an ongoing study and will be used in future publications.
Conflicts of Interest
The authors declare no conflicts of interest.
Correction Statement
This article has been republished with a minor correction to the author information. This change does not affect the scientific content of the article.
Appendix A
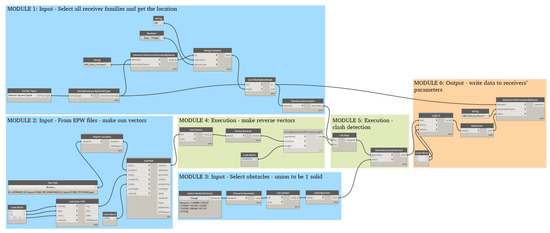
Figure A1.
Five Modules of Dynamo Code in the Reverse Sunlight Vector Method.

Figure A2.
Module 1: Input—select all receiver families and obtain the location.
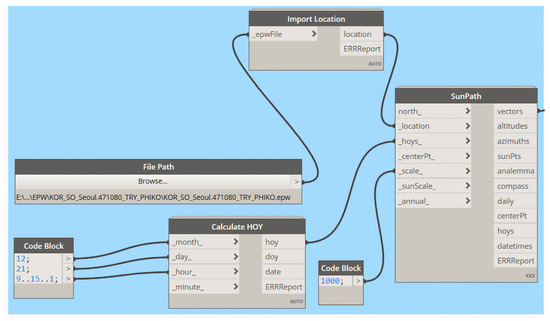
Figure A3.
Input—from EPW files—make sun vectors.

Figure A4.
Input—select obstacles—union to make 1 solid.

Figure A5.
Module 4: Execution—make reverse vectors.
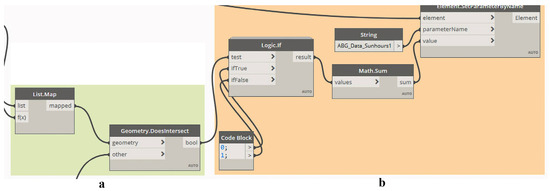
Figure A6.
(a) Module 5: Execution—clash detection; (b) Module 6: Output—write data to receiver’s parameters.
Appendix B

Figure A7.
Average Accumulated Area Received Sunlight Per Level of Buildings in the Jamsil Ricenz Apartment Complex.

Figure A8.
The direct sunlight ratio of Buildings in the Jamsil Ricenz Apartment Complex.
References
- Konstantzos, I.; Sadeghi, S.A.; Kim, M.; Xiong, J.; Tzempelikos, A. The effect of lighting environment on task performance in buildings—A review. Energy Build. 2020, 226, 110394. [Google Scholar] [CrossRef]
- Horvat, M.; Kanters, J. T.41.B.4: Needs of Architects Regarding Digital Tools for Solar Building Design; The International Energy Agency (IEA)—The Solar Heating and Cooling Technology Collaboration Programme (SHC): Cedar, MI, USA, 2012. [Google Scholar]
- Government of the Netherlands. Bouwbesluit 2012 [Building Decree 2012]. 2012. Available online: https://wetten.overheid.nl/BWBR0030461 (accessed on 31 December 2023).
- Ministerstwo Infrastruktury [Ministry of Infrastructure]. Rozporządzenie w Sprawie Warunków Technicznych, Jakim Powinny odpowiadać Budynki i Ich Usytuowanie [Regulation on the Technical Conditions to be Met by Buildings and Their Location]. 2002. Available online: https://isap.sejm.gov.pl/isap.nsf/DocDetails.xsp?id=WDU20020750690 (accessed on 31 December 2023).
- Vlada Republike Slovenije [Government of Slovenia]. Pravilnik o Minimalnih Tehničnih Zahtevah za Graditev Stanovanjskih Stavb in Stanovanj [Rules on Minimum Technical Requirements for Residential Buildings], Official Gazette RS, No. 61/17. 2017. Available online: https://www.uradni-list.si/glasilo-uradni-list-rs/vsebina/2017-01-3046 (accessed on 31 December 2023).
- GB 50180-93; Code for Planning and Design of Urban Residential Areas. Ministry of Housing and Urban-Rural Development of the PRC: Beijing, China, 1993. Available online: http://www.mohurd.gov.cn (accessed on 31 December 2023).
- Government of Japan. Building Standard Law. 2022. Available online: https://elaws.e-gov.go.jp/document?lawid=325AC0000000201 (accessed on 31 December 2023).
- New South Wales Government. State Environmental Planning Policy No. 65—Design Quality of Residential Apartment Development; SEPP 65; New South Wales Government: Sydney, Australia, 2015. Available online: https://legislation.nsw.gov.au/view/html/inforce/current/epi-2002-0530 (accessed on 31 December 2023).
- Department of Environment, Land, Water and Planning (DELWP). Better Apartments Design Standards. 2017. Available online: https://www.planning.vic.gov.au/guides-and-resources/guides/all-guides/better-apartments (accessed on 31 December 2023).
- Ministry of Government Legislation. Enforcement Decree of the Building Act. 2024. Available online: https://www.law.go.kr/법령/건축법시행령/제86조 (accessed on 31 December 2023).
- Statistics Korea. Housing Type by Administrative District (2023); KOSIS: Korea Statistical Information Service: Daejeon, Republic of Korea, 2023. Available online: https://kosis.kr/statHtml/statHtml.do?orgId=116&tblId=DT_MLTM_5403&conn_path=I2&language=en (accessed on 31 December 2023).
- Kim, S.H. High density dilemmas: Apartment development vs. urban management plan in Seoul. Seoul Urban Stud. 2018, 19, 1–19. [Google Scholar]
- Lee, S.-Y. Urban residents battle for sunlight. The Korea Times, 22 January 2020. Available online: https://www.koreatimes.co.kr/southkorea/society/20200122/urban-residents-battle-for-sunlight (accessed on 31 December 2023).
- IES Daylight Metrics Committee. Approved Method: IES Spatial Daylight Autonomy (sDA) and Annual Sunlight Exposure (ASE); IES-USA: New York, NY, USA, 2012. [Google Scholar]
- Aksamija, A. Methods for integrating parametric design with building performance analysis. ARCC Conf. Repos. 2018. Available online: https://www.arcc-journal.org/index.php/repository/article/view/459/363 (accessed on 14 October 2025).
- Garcia, M.S.; Freitas, M.L.M.; Souza, R.V.G.; Veloso, A.C.O. Comparison of daylighting simulation workflows and results using plugins for BIM and 3D Modeling programs: Application on early phases of design process. In Proceedings of the 7th International Building Physics Conference, IBPC2018—Healthy, Intelligent and Resilient Buildings and Urban Environments, Syracuse, NY, USA, 23–26 September 2018. [Google Scholar] [CrossRef]
- Ghobad, L. Daylighting and energy simulation workflow in performance based building simulation tools. In Proceedings of the 2018 Building Performance Analysis Conference and Simbuild, Chicago, IL, USA, 26–28 September 2018. [Google Scholar]
- Spiridigliozzi, G.; Pompei, L.; Cornaro, C.; De Santoli, L.; Bisegna, F. BIM-BEM support tools for early stages of zero-energy building design. IOP Conf. Ser. Mater. Sci. Eng. 2019, 609, 072075. [Google Scholar] [CrossRef]
- Awad, J.; Abd-Rabo, L. Daylight and Energy Performance Optimization in Hot—Arid Regions: Application and adaptation guide for designers in the UAE. Procedia Manuf. 2020, 44, 237–244. [Google Scholar] [CrossRef]
- Ministry of Land, Infrastructure and Transport. Article 86 (Restriction on Height of Buildings for Securing Sunshine, etc.). In Enforcement Decree of the Building Act; Korea Legislation Research Institute: Sejong, Republic of Korea, 1992. [Google Scholar]
- ENSW Department of Planning and Environment. Objective 4A-1. In Apartment Design Guide: Tools for Improving the Design of Residential Apartment Development; NSW Department of Planning and Environment: Sydney, Australia, 2015; p. 79. [Google Scholar]
Disclaimer/Publisher’s Note: The statements, opinions and data contained in all publications are solely those of the individual author(s) and contributor(s) and not of MDPI and/or the editor(s). MDPI and/or the editor(s) disclaim responsibility for any injury to people or property resulting from any ideas, methods, instructions or products referred to in the content. |
© 2025 by the authors. Licensee MDPI, Basel, Switzerland. This article is an open access article distributed under the terms and conditions of the Creative Commons Attribution (CC BY) license (https://creativecommons.org/licenses/by/4.0/).