Abstract
Deformation monitoring of heavy-haul railway tunnels is essential for ensuring operational safety. However, the spatial resolution of traditional point-based sensors is often insufficient for capturing the continuous deformation fields of tunnel structures. To overcome this limitation, in this study, densely distributed strain data that are acquired through distributed fiber-optic sensing technology are used, and a deep learning-based inversion framework that integrates high-resolution strain measurements with sparsely sampled convergence data is introduced. By employing a hybrid particle swarm optimization–random forest (PSO-RF) algorithm, a deep correlation model is constructed to establish the relationship between distributed strain profiles and discrete convergence measurements. This approach enables the prediction of cross-sectional convergence across multiple tunnel sections by using only a limited set of calibrated convergence sensors in combination with continuous strain field data, thereby effectively achieving global deformation inversion with minimal hardware deployment. The proposed method was validated through numerical simulations and field tests by using monitoring data from a heavy-haul railway tunnel. The algorithm exhibited a mean absolute error of less than 2 mm, thus demonstrating its ability to supply high-resolution deformation field data that are essential for structural health monitoring and diagnostics of tunnel infrastructures.
1. Introduction
Monitoring the deformation of heavy-haul railway tunnels is critical for ensuring operational safety. These tunnels are subjected to long-term cyclic loading from trains with axle loads that exceed 30 tons, which leads to cumulative fatigue damage in the lining structures. Common defects include concrete cracking, joint leakage, and subgrade mud-pumping. Compared with conventional railways, heavy-haul tunnels exhibit a 40–60% higher deformation rate, and track geometry distortions that are caused by uneven settlement pose direct threats to operational safety [1,2,3]. In recent years, incidents such as tunnel vault spalling and excessive sidewall convergence have been reported in major heavy-haul corridors, including the Daqin Line and Shuohuang Line. Domestic and international studies have indicated that lining deterioration accounts for more than 72% of the defects in heavy-haul tunnels. Traditional point-based monitoring methods are constrained by limited spatial resolution, which hinders the capture of continuous deformation fields and the early detection of hidden damage under dynamic loading. Consequently, structural condition assessment often suffers from significant delays. The development of high-density, real-time, and full-section monitoring technologies has thus become essential for ensuring the safety of high-capacity railway corridors, with considerable engineering significance for preventing sudden lining failures and reducing maintenance costs [4].
Research on health monitoring for railway tunnels is currently progressing rapidly. A variety of conventional and emerging techniques—including remote sensing [5,6], geographic information systems [7,8], and geophysical methods [9,10]—have been widely employed for surface and subsurface deformation monitoring. Each technique offers distinct advantages and limitations in terms of measurement range and accuracy. For example, Wai-Lok [11] reviewed the penetrating radar application in tunnel structural deformation monitoring. Although InSAR enables large-scale ground deformation monitoring, its data acquisition is limited by satellite revisit cycles, and it cannot detect subsurface deformations. To monitor internal tunnel deformations such as longitudinal settlement, hydrostatic leveling instruments are typically installed along the tunnel axis to measure relative elevation changes [12,13]. Cross-sectional convergence is typically monitored using tape extensometers or laser rangefinders on the basis of baseline measurements [14,15]. Furthermore, 3D laser scanning, which provides high accuracy and broad coverage, is being increasingly adopted for tunnel deformation monitoring. In recent years, Building Information Modeling (BIM) and Digital Twin (DT) technologies have also emerged as revolutionary frameworks for the digital management of tunnel infrastructure. BIM provides a foundation for lifecycle management by creating detailed 3D digital models encompassing both geometric and physical attributes [16,17]. The DT paradigm extends this concept by integrating real-time sensor data, physical models, and AI algorithms to create a dynamic virtual replica that evolves synchronously with its physical counterpart, enabling dynamic perception, diagnosis, and prognosis of structural behavior [18,19]. These studies represent significant strides in the integration and visualization of tunnel information.
Despite these advances, traditional point-based sensing methods remain fundamentally limited—especially in heavy-haul railway environments that are characterized by strong vibrations, heavy axle loads, and long distances—which results in blind spots, accuracy loss, and high maintenance complexity. These limitations impede their ability to meet the demand for continuous, high-resolution tunnel monitoring.
Distributed fiber optic sensing (DFOS) technology has emerged as a promising alternative that overcomes the spatial constraints of point-based sensors. A single optical fiber can serve as a continuous sensor along the entire tunnel and can simultaneously capture strain and temperature information. This significantly improves the comprehensiveness, real-time capability, and reliability of structural safety monitoring, and DFOS has been increasingly applied in tunnel engineering [20,21,22]. For instance, Seo [23] embedded optical fibers into tunnel segments to assess circumferential and longitudinal strain development during and after construction and used strain differences between the inner and outer arcs of the lining to estimate bending moments. Zhang [24] developed a novel fiber layout method for monitoring joint deformation in tunnel segments, enabling simultaneous measurement of horizontal joint openings and vertical differential settlement at immersion and expansion joints. Zhou [25,26] accounted for the ovalization effect in shield tunnels and proposed a DFOS-based monitoring method that uses a virtual conjugate beam approach to measure structural settlement and cross-section convergence, which was validated in the Jinan Metro project. However, DFOS is limited primarily to strain and temperature monitoring, and indirect interpretation is required for parameters such as vibration and displacement. Moreover, high equipment costs and demanding installation and protection requirements reduce its cost-effectiveness in applications that require multiparameter monitoring.
In response, an integrated deployment of distributed fiber optics and point-based sensors has been proposed to combine their strengths, achieving both full-area coverage and reinforced monitoring at critical points. This hybrid approach mitigates the reliance on indirect inference in purely distributed systems while overcoming the spatial gaps that are inherent in point-based sensors. It enhances data completeness, reliability, and early warning timeliness, and improves overall cost-effectiveness. Torres [27] successfully integrated point, long-gauge, and distributed fiber sensors in a high-speed railway tunnel to accurately reconstruct structural behavior. Li [28] introduced a dual-parameter strain/displacement monitoring system that incorporates fiber optics and video extensometers to measure strain and deformation in tunnel cross-sections. Moreover, advances in deep learning [29,30,31] have addressed traditional limitations in cross-scale feature fusion and implicit pattern extraction, thereby enabling the establishment of complex nonlinear relationships and spatial coupling mechanisms between point and distributed monitoring data. These advancements provide a theoretical foundation for high-precision full-field reconstruction models.
By leveraging these developments, a machine learning-based method for predicting multisection deformation in heavy-haul railway tunnels is proposed in this paper. The approach combines sparse tilt sensor measurements with high-density strain data from distributed fiber optics using a hybrid particle swarm optimization–random forest (PSO-RF) algorithm. First, a database is constructed using finite element simulations or field measurements. The PSO algorithm is then employed to optimize the hyperparameters of the random forest model, which reduces the effects of variability in geological conditions, geometric dimensions, and structural properties on prediction accuracy. Finally, the trained model uses distributed strain data to reconstruct the convergence field across multiple tunnel sections.
The remainder of this paper is organized as follows: Section 2 (“Theoretical Fundamentals”) elaborates on the reconstruction of multisection deformation on the basis of sparse tilt measurements and distributed strain data. Section 3 (“Numerical Example”) validates the method through numerical simulations. Section 4 (“Engineering Verification”) presents a practical application in the Shuiquanwan Tunnel. The conclusions are presented in the final section.
2. Theoretical Fundamentals
2.1. Tunnel Section Convergence Calculation on the Basis of the Inclination Angle
During the operational phase of railway tunnels, conventional laser rangefinders are rendered ineffective for convergence monitoring because of frequent visual obstructions that are caused by passing trains. To overcome this limitation, high-precision tilt sensors are installed symmetrically at the same height on both sidewalls. By continuously measuring the tilt angles of the two sidewalls relative to a reference vertical axis and incorporating known initial installation geometric parameters, the convergence deformation at specific heights of the tunnel cross-section can be derived by inverting the geometric relationships. This process is illustrated in Figure 1.
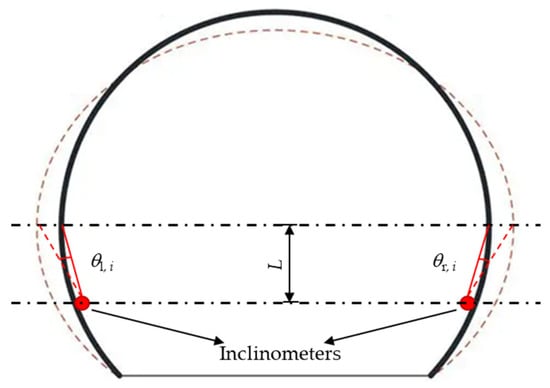
Figure 1.
Diagram of the deformation of a tunnel section.
The calculation formula is as follows:
where represents the horizontal convergence deformation of the neutral axis height at the i-th monitoring section of the tunnel; denotes the distance between the installation height of the inclinometer sensor and the neutral axis height; and and denote the inclination data that are collected by the inclinometer sensors on the left and right sidewalls, respectively, at the i-th monitoring section.
2.2. Nonlinear Relationship Between the Deformation Field and Strain Field
This section analyzes the relationship between strain and displacement under complex loading conditions, which exhibits a nonlinear trend, as shown in Figure 2. This arises primarily from material nonlinearity, nonlinear contact behavior between the lining and surrounding rock, and geometric nonlinearity induced by the coupling effects of various loads, especially for the irregular cross-sectional structure, like the horseshoe-shaped tunnel.
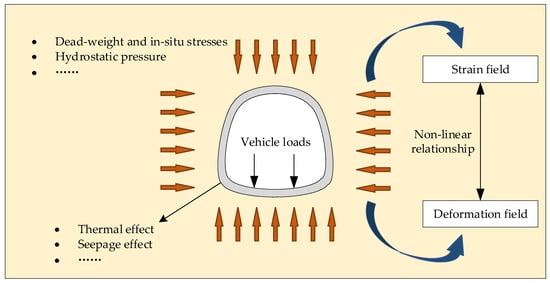
Figure 2.
Schematic of deformation and strain of tunnel lining under complex loads.
Subsequently, a detailed analysis of the relative relationship between structural deformation and strain under complex loading conditions will be presented. This analysis will elucidate why it is necessary to employ machine learning to establish the connection between tunnel strain and deformation, as opposed to relying solely on direct derivations from mechanical formulas.
During operation, the loads acting on a tunnel can be categorized into static loads (such as dead-weight and in situ stresses) and dynamic loads. The latter include external actions (e.g., hydrostatic pressure and vehicle loads) and internal processes (such as thermal and seepage effects). Therefore, the strain evolution during tunnel operation can be simplified as follows:
where , , and represent the strain fields that are induced by static loads, external actions, and internal actions, respectively.
For analytical convenience, strain can be represented in two ways: the continuous strain field and discrete strain values . For a continuum structure with known boundary conditions, theoretical displacement estimates can be derived on the basis of the geometric relationship between global strain and displacement:
where represents the displacement field that corresponds to the strain field and denotes the correlation between the strain field and the displacement field. The displacement field inherently incorporates the horizontal convergence deformation at each cross-section, as described in Equation (1).
Therefore, the problem of displacement estimation from local strains can be reformulated as determining the relationship between the local strain and the global strain on the basis of the three components in Equation (2). Prior to this, strains under different loads or actions can be expressed as follows:
where denotes the strain as the dependent variable with the matrix action as the independent variable; the first subscript of the variable can be De, Ex, or In, which represents static loading, external action, or internal action, respectively; and the second subscript is G or L, which denotes the global strain or local strain, respectively, that is induced by the corresponding action.
The first term in Equation (3) represents the local strain and global strain that are induced by static loading. This component can be considered constant over a period, which enables these values to be treated as constants and , respectively.
The second term in Equation (3) represents external actions on the lining, i.e., distributed forces that act on the boundary. Changes in external actions are typically monotonic, with hydrostatic pressure being the most significant. Under these conditions, the local and global strains that are induced by external actions correspond one-to-one with the external actions. In this case, the functions and form a bijective mapping. Therefore, on the basis of Equation (4), and can be further deducted to eliminate :
where denotes the correlation function between and . The coupled effects of multiple external actions can be addressed by providing samples such that the number of samples is greater than the number of parameters that are sought.
The second term in Equation (3) represents certain internal actions within the lining (such as thermal and seepage behavior), which exist in the form of physical forces whose effects differ from those of external actions. For such actions, and are multivalued functions of . In this case, directly estimating global strain on the basis of the local strain from Equation (5) may be misleading. The mathematical approach for solving multivalued functions involves converting them to single-valued functions by computing their branches. However, this is challenging for nonanalytic functions. Here, a simpler physical method is adopted by introducing a state factor to represent the effect of internal actions, thus providing constraints for a data-driven solution. is a multivalued function of and can be estimated in the following form:
where represents the introduced state variable and and represent functions with and as the independent variables and the dependent variable, respectively.
Then, similar to Equation (5), can be eliminated on the basis of Equations (4) and (6):
where is expressed as a function of , , and the state factor , which differs from Equation (5).
By substituting Equations (5) and (7) into (3) and using the three strain components that are shown in Equation (2), the displacement can be estimated as follows:
In summary, various challenges, including significant deformations, material nonlinearity, and contact nonlinearity in both the surrounding rock and lining structures, are frequently encountered in tunnel engineering. These complexities result in a highly nonlinear mapping relationship between the deformation field and strain field, which cannot be adequately captured by simple linear functions. The most appropriate methodology involves establishing a correlation model through deep learning techniques. This data-driven approach effectively captures intricate interactions and latent patterns, thereby enabling precise prediction of structural behavior under complex loading scenarios. By harnessing the ability of neural networks to address high-dimensional nonlinear problems, the model successfully integrates multisource monitoring data (such as distributed fiber optic sensing and point-based sensors) to achieve high-precision full-field deformation inversion from strain measurements. Consequently, it provides a powerful tool for structural health diagnosis and early warning systems and offers comprehensive monitoring coverage while maintaining cost-effectiveness through optimized sensor deployment strategies.
2.3. Deformation Reconstruction Method That Uses the RF-PSO Machine Learning Algorithm
The random forest (RF) algorithm is among the foremost machine learning techniques that are used to predict structural deformations in engineering applications. As an ensemble learning method that is rooted in decision trees, it has been extensively used for both classification and regression tasks. Operating through nonparametric computation, the RF algorithm generates numerous weak decision trees in a randomized fashion, with final predictions derived from the aggregated outputs of all the constituent trees. Its stochastic nature is manifested in two key aspects of the tree-building process: (1) random selection of data subsets; (2) random selection of feature subsets for node splitting. This deliberate randomization strategy effectively minimizes the correlations among individual trees, thereby conferring upon the RF algorithm exceptional robustness and predictive accuracy in handling complex engineering problems such as tunnel deformation analysis.
The RF algorithm involves bootstrap sampling and the random subspace method, with the following specific construction process:
- (1)
- First, bootstrap sampling is employed, which simulates the sampling method for statistical inference. With replacement, sampling is performed on the database, where each data group has an equal probability of being selected; k samples are randomly drawn to obtain the database subset;
- (2)
- From the database subset Ri, m features (input parameter categories) are randomly selected as root nodes for the random forest. Ri is progressively partitioned in a binary tree structure to construct a CARF decision tree;
- (3)
- Steps (1) and (2) are iteratively repeated to obtain n database subsets, and CARF decision trees that collectively form a random forest are generated. These decision trees independently predict the output target. For classification problems, the final result is determined by majority voting; for regression problems, the final result is the average of all the decision trees’ predictions.
The particle swarm optimization (PSO) algorithm is a global optimization technique that is characterized by fast convergence and resistance to local optima. Each particle’s position corresponds to the numerical value of the optimization target, and its fitness value represents the performance evaluation metric for that value. At the start of the PSO algorithm, a swarm of particles is initialized at random positions. Each particle calculates its fitness value using the fitness function and continuously updates its velocity and position on the basis of both local and global optima. The PSO algorithm iterates until an optimal solution is found. The updated formulas for the particle velocity and position are shown in Equations (9) and (10), respectively:
where represents the iteration count; represents the inertial weight; and represent the individual and global learning factors, respectively; and represent random numbers between 0 and 1; and and represent the individual optimal solution and the globally optimal solution, respectively, of particles and .
The selection of hyperparameters critically influences the practical performance of machine learning algorithms. These parameters must be specified prior to model training and are frequently determined through trial-and-error methods to identify a reasonably effective configuration [32,33]. However, this approach is often inefficient and does not guarantee optimality. In the context of cross-sectional convergence reconstruction, key hyperparameters include the number of decision trees in the random forest (RF) algorithm.
To address this challenge, a hybrid algorithm that combines particle swarm optimization (PSO) with an RF to optimize hyperparameter selection is proposed in this paper. In this framework, each particle’s position in the PSO represents a candidate set of hyperparameters, and the fitness function is defined as the prediction error of the model evaluated via k-fold cross-validation (CV). The workflow of the hybrid algorithm is depicted in Figure 3 and involves the following steps:
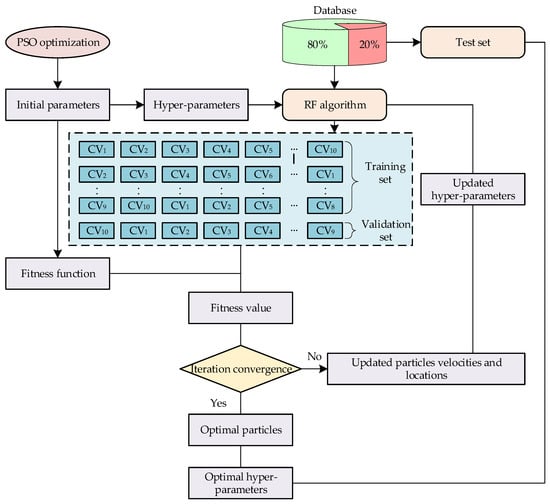
Figure 3.
Flowchart of the PSO hybrid algorithm for determining the optimal hyperparameters.
- (1)
- The particle swarm is initialized by configuring the swarm size, learning rates, and maximum number of iterations. The initial positions and velocities of the particles are randomly assigned, with each position corresponding to a value for the number of decision trees in the RF algorithm.
- (2)
- The PSO fitness function is defined as the average mean absolute error (MAE) that is obtained via k-fold cross-validation. Given its prevalent adoption in machine learning [34], a 10-fold CV strategy is employed. The dataset is randomly partitioned into 10 subsets, with 9 subsets used for training and the remaining subset for validation. This process is repeated 10 times, such that each subset serves as the validation set once. The MAE is computed for each validation fold, and the average MAE across all folds is used as the PSO fitness value. The fitness function is formulated as follows:where represents the mean absolute error for the i-th validation set. The particle velocity and position are updated on the basis of the fitness values to generate the next generation of particles, and the PSO algorithm proceeds to the next iteration.
- (3)
- The PSO algorithm is configured with a predefined maximum number of iterations. In each iteration, the fitness value of every particle is evaluated. The iterative procedure terminates when either the fitness value satisfies the target performance criterion or the maximum iteration count is attained. Upon meeting the stopping condition, the optimization process concludes and yields the globally optimal particle position, which corresponds to the optimal set of hyperparameters for the machine learning algorithm.To increase computational efficiency and minimize the influence of variations in parameter scales on model performance, the data are normalized to the interval [−1, 1]. The resulting predictions are then inversely transformed back to the original parameter space. The normalization procedure is defined by Equation (12):To assess the performance of the random forest (RF) algorithm in reconstructing cross-sectional convergence deformation from distributed optical fiber strain data, two evaluation metrics are adopted: the mean absolute error (MAE) and the Pearson correlation coefficient (R).where represents the measured value of cross-section convergence; represents the predicted value of cross-section convergence; represents the average of the measured cross-section convergence values; and represents the average of the predicted cross-section convergence values. Here, the smaller the value of is, the larger the value of , which indicates better predictive performance of the algorithm model.
2.4. Proposed Method for Multisectional Deformation Reconstruction
Distributed fiber optic sensing (DFOS) technology employs Brillouin or Raman scattering principles to perform spatially continuous, high-resolution measurements of strain and temperature. It provides several key advantages, including fully distributed sensing capability, real-time monitoring over long distances, and integrated multiparameter detection. By installing optical fibers along the tunnel lining, DFOS enables full-field monitoring of global deformation and stress distribution, which makes it highly suitable for structural health monitoring applications in tunnels. To further improve accuracy, high-precision displacement sensors are deployed at critical cross-sections to provide absolute measurements of radial deformation. These serve as calibration benchmarks for the fiber optic data, thereby significantly enhancing the overall monitoring precision. The designed monitoring scheme for railway tunnel is shown in Figure 4.
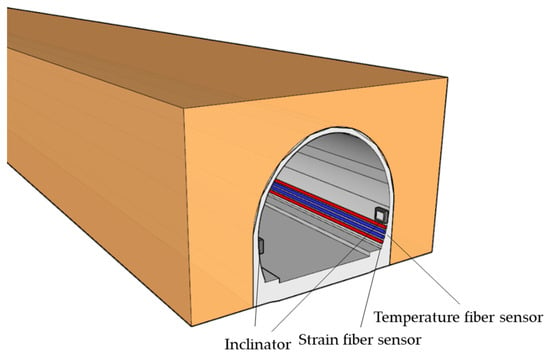
Figure 4.
Layout of the monitoring system for the railway tunnel.
- Data Preprocessing: The monitoring data that were considered in this study consisted of two types. The first type of data was distributed fiber optic sensing (DFOS) data, which underwent demodulation to convert photoelectric signals into longitudinal strain values along the tunnel lining. The second type was inclination data that were obtained from tilt sensors installed at intervals. These angular measurements were processed using Equation (1) to estimate the radial deformation at the corresponding cross-sections. Both datasets were subjected to spatiotemporal alignment and outlier removal to ensure consistency and reliability.
- Database Construction: The preprocessed data were integrated into a unified database. To increase robustness against anomalies, strain data from surrounding sections (at least 10 adjacent cross-sections) were incorporated for each convergence monitoring point. For every convergence cross-section, the strain data from nearby regions served as input, whereas the measured convergence value at that section was the output. This structured dataset was used to train a deep learning model. The database was randomly split, with 80% allocated for training and the remaining 20% reserved for testing.
In the proposed approach, the training and reconstruction processes for the convergence prediction model are performed independently and efficiently and require short computation times. This makes the approach practical for real-time data analysis and visualization in engineering applications. In this paper, a convergence prediction framework for heavy-haul railway tunnels is proposed on the basis of the fusion of point and distributed sensing, as illustrated in Figure 5.
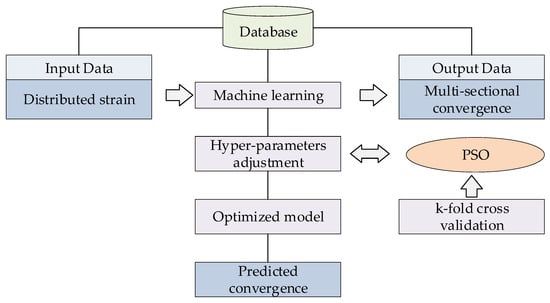
Figure 5.
Flowchart of the proposed method for multisectional deformation reconstruction.
- (i)
- Model Training Phase: By using an existing database (constructed from numerical simulations or historical monitoring data), a convergence prediction model for heavy-haul railway tunnels is developed. The hyperparameters of the machine learning algorithm are optimized via a PSO hybrid algorithm to improve the prediction accuracy.
- (ii)
- Operational Monitoring Phase: During actual monitoring, when a train passes through the tunnel, data from the corresponding period are collected. The trained model is then applied to predict convergence deformation at sections without physical sensors, thereby enabling comprehensive deformation assessment.
3. Numerical Example
3.1. FE Model Description
To validate the effectiveness of the proposed method, a finite element model was initially developed for verification. A three-dimensional model for simulating the interaction between the tunnel structure and the surrounding stratum was constructed by using the ANSYS (v2024 R2). The model measures 40 m in height, 60 m in width, and 200 m in length. The geometry was modeled using Boolean operations: a volumetric block that represented the stratum was first created, after which a tunnel cross-section was introduced 10 m above the base and subtracted to form the tunnel void. The lining was modeled as a continuous structure with a uniform thickness of 0.5 m, and the track bed was assigned a thickness of 0.4 m. The stratum and lining were discretized by using SOLID185 elements. The constitutive behavior of the surrounding rock was described by a simplified strain-softening Mohr–Coulomb model to balance accuracy and computational efficiency. The boundary conditions were defined as follows: The bottom surface was fully fixed; the four lateral surfaces were constrained in the normal direction; and the top surface was left free. The model accounted for self-weight to simulate long-term deformation of the tunnel structure. The finite element model is depicted in Figure 6.
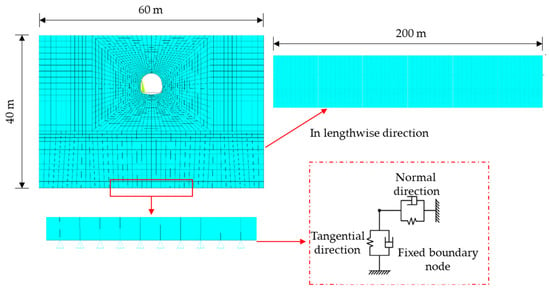
Figure 6.
FEM model of a heavy haul railway tunnel.
The lining, inflected arch, and track bed, and surrounding rock were modeled by linear elastic models, with specific parameters detailed in Table 1 and Table 2, which were obtained in typical heavy-haul railway tunnel projects in China. For the purpose of this methodological study, the material properties for each component (e.g., lining, surrounding rock) are assumed to be homogeneous and consistent across all tunnel sections.

Table 1.
Material parameters of the lining and track bed.

Table 2.
Material parameters of the surrounding rock.
Following the application of loads to the model for numerical analysis, the relative convergence deformation at both sidewalls of the tunnel structure was extracted as the output variable, with a spatial sampling interval of 20 m. To verify the reliability of inverting cross-sectional convergence using tilt sensors, both the tilt angles at convergence measurement points and the actual convergence deformation at the neutral axis were obtained. The comparative results indicated only minor discrepancies between the two datasets. The longitudinal strain values on both sides of the lining at the convergence monitoring sections were extracted as input variables, with a high spatial resolution of 0.2 m. For each convergence cross-section, strain data from 10 adjacent sections (both upstream and downstream) were incorporated. To simulate the inhomogeneous geological conditions that are typical of mountain tunnels, a uniform load of 30 t/m2 was applied to various regions on the top surface of the model. This approach replicated static structural deformations under 20 distinct surrounding rock scenarios, in addition to the inherent self-weight loading. The applied loading configurations are presented in Figure 7. Strain and convergence data points from a total of 180 cross-sections were compiled for analysis. The dataset was randomly partitioned, with 80% assigned for training and the remaining 20% reserved for testing.
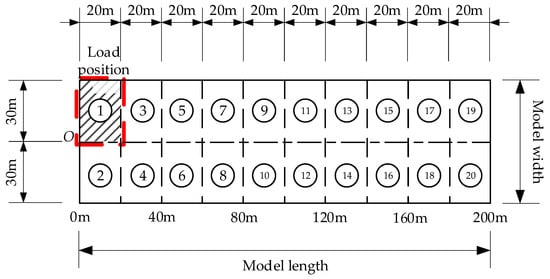
Figure 7.
Loading configurations of the simulation.
3.2. Numerical Results
In the hybrid algorithm analysis, the particle swarm optimization (PSO) algorithm was employed to iteratively optimize the hyperparameters of the random forest (RF) algorithm. The evolution of the optimal fitness value during the optimization process is shown in Figure 8a.
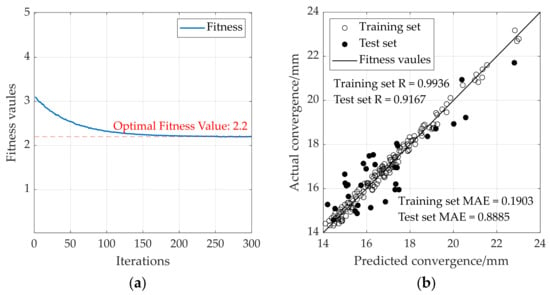
Figure 8.
The results of the training process in simulation: (a) process of hybrid PSO algorithm optimization; (b) analytical results of convergence using RF.
In the RF model for cross-sectional convergence prediction, the fitness value decreased markedly as the number of iterations increased, thus demonstrating a considerable enhancement in model performance through hyperparameter optimization. The prediction results of the RF algorithm are shown in Figure 8b.
On the training set, the model achieved performance metrics of MAE = 0.1903 and R = 0.9936, which indicated excellent predictive accuracy. For the test set, the values were MAE = 0.8885 and R = 0.9167, which reflected minor deviations between the predicted and measured values alongside a strong positive correlation. Notably, despite the limited availability of convergence data in the database, the RF algorithm demonstrated robust performance in accurately predicting varying magnitudes of convergence deformation, thus underscoring its strong generalization ability.
By leveraging the trained model and incorporating strain data from adjacent cross-sections, convergence at the central monitoring section was predicted. The convergence predictions under loading cases 0 (weight only), 1, and 9 are illustrated in Figure 9, and the corresponding errors across all load cases are summarized in Figure 10. The results indicate strong agreement between the predicted and measured convergence values, with all mean absolute errors remaining below 1.2 mm. In addition, it can be observed that loading case 0 (with red bar) exhibits the largest error, which indicates that the prediction results become more accurate as the load increases with larger structural deformation and strain. These findings confirm the model’s high accuracy in predicting deformation under varied loading scenarios and validate the reliability of the proposed method for monitoring tunnel convergence. The consistently low prediction errors further support the practical utility of this approach in structural health assessment for heavy-haul railway tunnels.

Figure 9.
Predicted results of the trained model (the red outline refers to the loading area): (a) load case 0 (weight only); (b) load case 1; (c) load case 9.
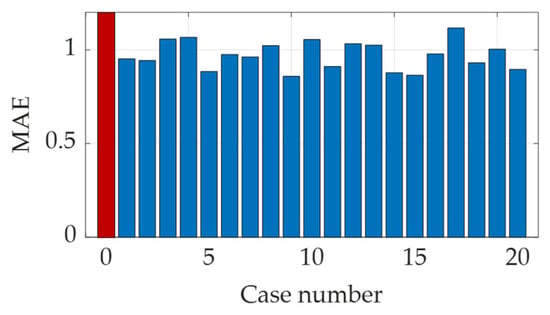
Figure 10.
Related errors between the predicted results and the actual data (the red bar refers to the load case 0).
It is important to note that the purpose of this numerical model is not to replicate the exact geometry of the specific tunnel used in the subsequent engineering verification. Rather, its purpose is to generate a training dataset that encompasses a wide spectrum of mechanical states (achieved through the multiple load cases). This approach compels the machine learning model to learn the universal physical relationship between strain and displacement, instead of memorizing the response of a single structure, thereby laying the foundation for its generalizable application to tunnels with different geometrical and geological conditions.
4. Engineering Verification
4.1. Brief Description
The proposed method was validated through a real-world engineering application in the Shuiquanwan Tunnel. Completed in 1997, this electrified double-track tunnel is a section of the Shuohuang Railway. It spans 4925 m in length and crosses the high terrace on the right bank of the Hutuo River, which features complex geological conditions and a maximum overburden depth of 419 m. The main information of Shuiquanwan Tunnel can be seen in Figure 11.
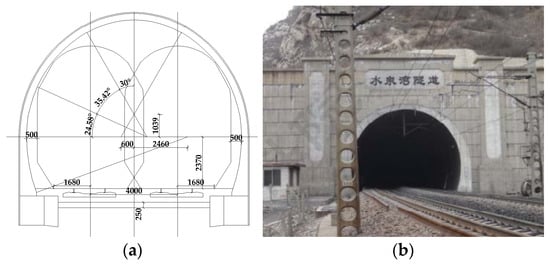
Figure 11.
Shuiquanwan Tunnel: (a) cross-section of the tunnel (unit: mm); (b) tunnel entrance.
In this project, the structural configuration, dynamic loads, and geological context of the Shuiquanwan Tunnel were addressed by deploying a high-performance distributed Brillouin fiber optic sensing system as its core monitoring solution. A fiber optic sensing network using the BOTDA technique with high spatial resolution was implemented to support online intelligent monitoring of the tunnel’s structural operational safety. For structural strain monitoring, fully distributed strain-sensing optical cables were installed along the entire sidewall lining. These cables were secured at 5 m intervals by using mechanical clamps and firmly bonded to the structure with epoxy-based adhesive to ensure reliable, real-time acquisition of the global strain field.
For temperature monitoring, fully distributed temperature-sensing optical cables were laid along the full extent of the track bed. These were similarly affixed at 5 m intervals by using clamps, which enabled continuous real-time measurement of the tunnel’s temperature field. The collected temperature data were further used to compensate for thermal effects in other monitoring parameters.
The installation of the inclinometers involves three steps: firstly, an adjustable bracket is secured to the tunnel side wall using expansion bolts; then, the mounting surface is leveled to ensure the reliability of data collection; finally, the inclinometer can be fixed onto the bracket.
The overall layout of the monitoring system, including plan and cross-sectional schematics, is provided in Figure 12. Photographs of the actual sensor installation are presented in Figure 13.
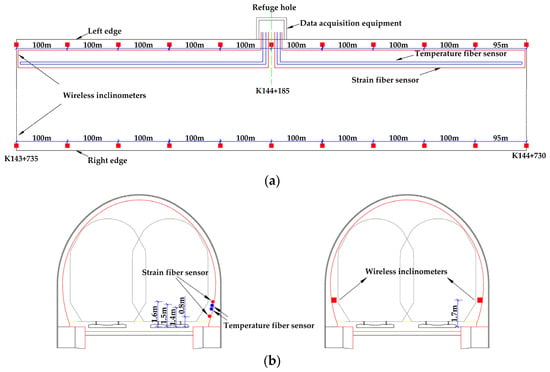
Figure 12.
Monitoring scheme of the Shuiquanwan Tunnel: (a) plan view; (b) cross-sectional view.
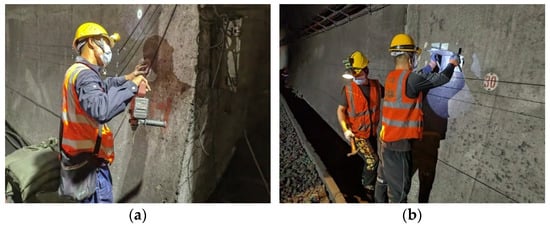
Figure 13.
Installation of the monitoring system: (a) distributed fiber sensor; (b) inclinometer.
To clarify the experimental setup and ensure the reproducibility and scientific rigor of the study, the technical specifications of the key sensors and equipment deployed on-site are detailed below in Table 3 and Table 4.

Table 3.
The parameters of the BOTDA analyzer (Harbin Institute of Technology, Harbin, China).

Table 4.
The parameters of the inclinometers.
The field data presented in this section were collected during maintenance windows in the absence of train loads. In this monitoring scheme, the distributed optical fiber operated at a sampling interval of 4 min. Accordingly, data acquired from convergence sensors were resampled to synchronize with the fiber optic data timeline.
The collected monitoring dataset is depicted in Figure 14. It should be pointed out that the distributed strain data shown in Figure 14a have been temperature-compensated using the concurrently measured temperature field to isolate the mechanical strain, while the temperature was around 25 °C during the test period.
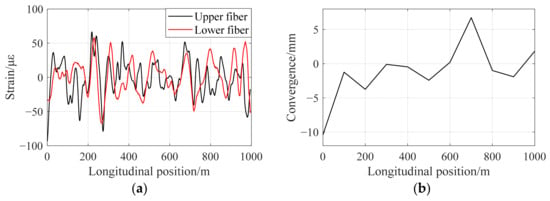
Figure 14.
Monitoring data for strain and convergence: (a) strain data; (b) convergence data.
In contrast to the convergence deformation observed in numerical simulations, the actual measured convergence deformation was more complex because of the influence of multiple practical factors.
4.2. Analytic Results
In the validation on real-world engineering data, the PSO algorithm was applied to iteratively optimize the hyperparameters of the RF model to improve the prediction performance. The variation curve of the optimal fitness value during the hybrid optimization process on the basis of field-measured data is shown in Figure 15a. As shown, the fitness value decreases rapidly as the number of iterations increases before eventually stabilizing. This trend is consistent with the findings from earlier numerical simulations (Figure 8), thus demonstrating that the PSO algorithm effectively guides the hyperparameters of the RF model toward the global optimum even when dealing with noise-contaminated and complex real-world data. As a result, the model achieves significantly improved accuracy and enhanced generalization ability for cross-sectional convergence prediction in practical engineering scenarios.
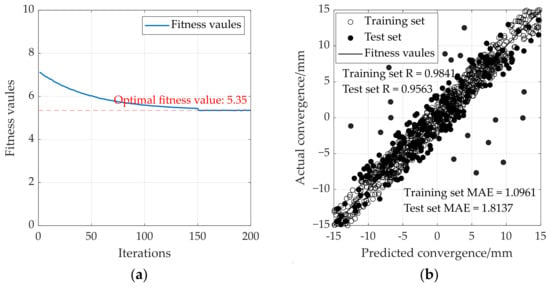
Figure 15.
The results of the training process in engineering verification: (a) process of hybrid PSO algorithm optimization; (b) analytical results of convergence using RF.
The prediction results of the RF algorithm are presented in Figure 15b. The model performed strongly on the training set, with MAE = 1.0961 and R = 0.9841. On the test set, the values were MAE = 1.8137 and R = 0.9563. Although there were deviations between the predicted and measured values in the test set, high consistency in overall deformation trends was maintained.
It is crucial to note that all data used in this engineering verification were obtained from the field monitoring system in the Shuiquanwan Tunnel. The tunnel has been in operation for nearly three decades, and its structural system, in conjunction with the surrounding rock mass, has reached a long-term quasi-static equilibrium. Under these stable conditions, a consistent and learnable relationship between the strain and convergence fields exists, providing a solid foundation for the data-driven model.
The high-resolution convergence field reconstructed in Figure 16 demonstrates the transformative potential of the proposed method, moving beyond traditional point-based monitoring towards a full-field comprehensive monitoring. This achievement can promote the discrete, isolated measurements developing to continuous, high-density perception, enabling the identification of global deformation patterns and potential localized anomalies.
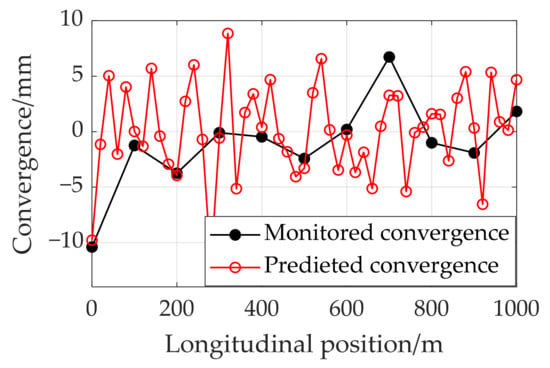
Figure 16.
Reconstructed convergence deformation along the tunnel.
From an engineering perspective, this capability is crucial for advancing from simple monitoring to intelligent diagnostics. The reconstructed deformation field provides actionable data for pinpointing potential weak zones, conducting refined risk assessments along the entire tunnel, and optimizing maintenance strategies in a cost-effective manner.
Furthermore, this approach offers a highly cost-effective solution for large-scale infrastructure monitoring. By deploying a limited number of high-precision point sensors and installing distributed optical fibers, it achieves comprehensive coverage without the prohibitive cost and complexity of setting up massive sensors. While a heavy-haul railway tunnel is used for validation in this study, the underlying framework of fusing dense strain data with sparse displacement benchmarks via machine learning holds significant promise for broader application in various underground infrastructures, such as metros and highway tunnels.
By using the trained model, convergence deformation at non-instrumented cross-sections was extrapolated, which enabled the reconstruction of the global deformation behavior of the heavy-haul railway tunnel, as depicted in Figure 16.
5. Conclusions
In this paper, a method for predicting multisection deformation in heavy-haul railway tunnels using a hybrid machine learning algorithm that combines an RF and PSO is proposed. The hybrid algorithm employs PSO to determine the optimal hyperparameters of the RF model while integrating data from distributed optical fiber sensors and sparse convergence sensors. This approach allows for the prediction of structural convergence deformation at sections where no convergence sensors are installed. The proposed method was validated through comparative analysis on field measurement data from an actual engineering project. The main conclusions are as follows:
- (i)
- It demonstrates that a high-resolution convergence field can be accurately reconstructed by the information fusion between spatially continuous strain data and sparsely calibrated displacement points. This establishes a new, cost-effective paradigm that overcomes the spatial resolution limitations and high cost of traditional sensing technology.
- (ii)
- A hybrid PSO-RF model is proposed and validated, which proves to be highly effective in capturing the intricate, nonlinear mapping between strain and displacement in a tunnel system. A key finding is that this model is effective both in the simplified numerical model and in the real structure, which demonstrates the model’s robustness in learning the underlying physical mechanics rather than memorizing specific scenarios.
- (iii)
- The method was quantitatively proven to achieve a mean absolute error of less than 2 mm in both numerical and field validations. This level of accuracy meets the requirements for practical engineering diagnostics, demonstrating that the proposed method is not merely a theoretical concept but a viable tool for high-precision, full-field deformation inversion in demanding environments like heavy-haul railways.
While the method was validated on a specific heavy-haul railway tunnel, the core framework is readily transferable to other underground infrastructures. Future work will focus on enhancing the model’s adaptability to tunnels under active construction or in rapidly evolving geological conditions, and on its integration into a real-time digital twin platform for predictive maintenance.
Author Contributions
All authors discussed and agreed upon the idea and made scientific contributions. X.Y. wrote the theoretical part, abstract, and conclusion parts; Z.Z. wrote the numerical example part; Y.L. wrote the introduction part and revised the paper. All authors have read and agreed to the published version of the manuscript.
Funding
This study was funded by the Scientific and Technological Innovation Project of Shuohuang Railway Development LLC (Grant No.: SHTL-22-10).
Data Availability Statement
The data that support the findings of this study are available from the corresponding author upon reasonable request.
Conflicts of Interest
Author Xiaokun Yan was employed by the company Shuohuang Railway Development LLC. The remaining authors declare that the research was conducted in the absence of any commercial or financial relationships that could be construed as a potential conflict of interest. The authors declare that this study received funding from Shuohuang Railway Development LLC. The funder was not involved in the study design, collection, analysis, interpretation of data, the writing of this article or the decision to submit it for publication.
References
- Hyun, J.P.; Sang, C.S. Quantitative Risk Analysis for Railway Tunnels. J. Korean Soc. Railw. 2017, 20, 400–412. [Google Scholar] [CrossRef]
- Mikaeil, R.; Haghshenas, S.S.; Shirvand, Y.; Hasanluy, M.V.; Roshanaei, V. Risk Assessment of Geological Hazards in a Tunneling Project Using Harmony Search Algorithm (Case Study: Ardabil-Mianeh Railway Tunnel). Civ. Eng. J. 2016, 2, 546–554. [Google Scholar] [CrossRef]
- Luo, Y.; Yang, J.; Xie, Y.; Fu, J.; Zhang, C. Investigation on evolution mechanism and treatment of invert damage in operating railway tunnels under heavy rainfall. Bull. Eng. Geol. Environ. 2024, 83, 160. [Google Scholar] [CrossRef]
- Moritz, B.; Heissenberger, R.; Schachinger, T.; Lienhart, W. Long-term monitoring of railway tunnels. Geomech. Tunn. 2021, 14, 35–46. [Google Scholar] [CrossRef]
- Bian, Y.; Guo, Y.; Yang, Y.; Chen, L.; Chen, H. Application of High Resolution Remote Sensing Technology in Plateau Railway Geological Survey: A Case Study of Atal Tunnel. In Proceedings of the 2023 5th International Conference on Civil Engineering, Environment Resources and Energy Materials (CCESEM 2023), Xiamen, China, 27 October 2023. [Google Scholar]
- Parra, J.; Necsoiu, M. Nonlinear inversion of subsidence signatures induced by tunnels detected with surface and remote sensing measurements. Lead. Edge 2019, 38, 550–553. [Google Scholar] [CrossRef]
- Suo, N.; Wang, L.H. Safety Monitoring Information System of Railway Tunnel Construction Based on GIS. Appl. Mech. Mater. 2013, 2308, 811–814. [Google Scholar] [CrossRef]
- Farhadian, H.; Tabrizi, D.S.; Yousefi, S.; Rezaei, A.; Saeidi, A. Evaluation of geological hazards along the Karaj water conveyance tunnel using multiple approaches and GIS. Results Eng. 2025, 26, 104758. [Google Scholar] [CrossRef]
- Wang, P.; Zhang, S.-S.; Chen, W.-D.; Xue, Y.-G.; Qu, Z.-M.; Xiao, H.-B.; Su, M.-X.; Zhang, K. A comprehensive analysis method for adverse geology in tunnels based on geological information and multi-source geophysical data. Appl. Geophys. 2025, 22, 43–52. [Google Scholar] [CrossRef]
- Nie, L.; Wang, C.; Liu, Z.; Xu, Z.; Sun, X.; Du, Y.; Wei, W. An integrated geological and geophysical approach to identify water-rich weathered granite areas during twin tunnels construction: A case study. Tunn. Undergr. Space Technol. 2023, 135, 105025. [Google Scholar] [CrossRef]
- Wai-Lok, L.W.; Derobert, X.; Annan, P. A review of ground penetrating radar application in civil engineering: A 30-year journey from locating and testing to imaging and diagnosis. NDT E Int. 2018, 96, 58–78. [Google Scholar] [CrossRef]
- Wang, A.G.; Li, T. Research on theory and method in fusing multi-source land subsidence monitoring data. Eng. Surv. Mapp. 2016, 25, 6–11. [Google Scholar]
- Zhang, D.; Nie, C.; Chen, M.; Huang, H.; Wu, Y. Wireless tilt sensor based monitoring for tunnel longitudinal Settlement: Development and application. Meas. 2023, 217, 113050. [Google Scholar] [CrossRef]
- Ariznavarreta-Fernández, F.; González-Palacio, C.; Menéndez-Díaz, A.; Ordoñez, C. Measurement system with angular encoders for continuous monitoring of tunnel convergence. Tunn. Undergr. Space Technol. 2016, 56, 176–185. [Google Scholar] [CrossRef]
- An, X.; Zheng, F.; Jiao, Y.; Li, Z.; Zhang, Y.; He, L. Optimized machine learning models for predicting crown convergence of plateau mountain tunnels. Transp. Geotech. 2024, 46, 101254. [Google Scholar] [CrossRef]
- Sresakoolchai, J. Different levels of development analysis for building information modeling in railway system asset management. J. Urban Plan Dev. ASCE 2025, 151, 04025034. [Google Scholar] [CrossRef]
- Sresakoolchai, J.; Kaewunruen, S. Integration of building information modeling and machine learning for railway defect localization. IEEE Access 2021, 9, 166039–166047. [Google Scholar] [CrossRef]
- Sresakoolchai, J.; Kaewunruen, S. Railway infrastructure maintenance efficiency improvement using deep reinforcement learning integrated with digital twin based on track geometry and component defects. Sci. Rep. 2023, 13, 2439. [Google Scholar] [CrossRef]
- Borjigin, A.O.; Sresakoolchai, J.; Kaewunruen, S.; Hammond, J. Digital Twin Aided Sustainability Assessment of Modern Light Rail Infrastructures. Front. Built Environ. 2022, 8, 796388. [Google Scholar] [CrossRef]
- Yang, F.; Feng, X.; Zhang, J.; Zhong, G.; Yuan, Y. Structural damage identification of subseabed shield tunnels based on distributed fiber optic sensors and information fusion. Tunn. Undergr. Space Technol. 2023, 139, 105215. [Google Scholar] [CrossRef]
- Gómez, J.; Casas, R.J.; Villalba, S. Structural Health Monitoring with Distributed Optical Fiber Sensors of tunnel lining affected by nearby construction activity. Autom. Constr. 2020, 117, 103261. [Google Scholar] [CrossRef]
- Wang, X.; Shi, B.; Wei, G.; Chen, S.-E.; Zhu, H.; Wang, T. Monitoring the behavior of segment joints in a shield tunnel using distributed fiber optic sensors. Struct. Control Health Monit. 2017, 25, e2056. [Google Scholar] [CrossRef]
- Seo, H.; Wilcock, M.J.; Soga, K.; Elshafie, M.; Mair, R.J. Distributed fibre optic monitoring of the time-dependent behaviour of tunnel segmental linings in London clay. In Proceedings of the 2017 World Congress on Advances in Structure Engineering and Mechanics, Seoul, Republic of Korea, 29 August 2017. [Google Scholar]
- Zhang, X.H.; Broere, W. Design of a distributed optical fiber sensor system for measuring immersed tunnel joint deformations. Tunn. Undergr. Space Technol. 2023, 131, 104770. [Google Scholar] [CrossRef]
- Zhou, Z.; Ma, X.; Liu, Y.; Li, H. A method for monitoring the uneven settlement of shield tunnels considering the flattening effect using distributed strain data measured from BOTDA sensors. Struct. Health Monit. 2025, 24, 351–371. [Google Scholar] [CrossRef]
- Zhou, Z.; Liu, Y.; Li, H. A method for convergence monitoring considering the flattening effect in a shield tunnel with BOTDA sensors. Measurement 2023, 211, 112611. [Google Scholar] [CrossRef]
- Torres, B.; Payá-Zaforteza, I.; Barrera, D.; Alvarado, Y.A.; Calderón García, P.A.; Loayssa Lara, A.; Sagues García, M.; Zornoza, A.; Sales Maicas, S. High-speed railway tunnel monitoring using point, long gauge and distributed strain and temperature fiber optic sensors. Inf. Constr. 2015, 67, e071. [Google Scholar] [CrossRef]
- Li, J.; Liu, Y.H.; Zhang, J.R. Simultaneous measurement of strain and displacement for railway tunnel lining safety monitoring. Sensors 2014, 24, 6201. [Google Scholar] [CrossRef] [PubMed]
- Xu, C.; Cao, B.T.; Yuan, Y.; Meschke, G. A multi-fidelity deep operator network (DeepONet) for fusing simulation and monitoring data: Application to real-time settlement prediction during tunnel construction. Eng. Appl. Artif. Intell. 2024, 133, 108156. [Google Scholar] [CrossRef]
- Abbas, N.; Umar, T.; Salih, R.; Akbar, M.; Hussain, Z.; Haibei, X. Structural health monitoring of underground metro tunnel by identifying damage using ANN deep learning auto-encoder. Appl. Sci. 2023, 13, 1332. [Google Scholar] [CrossRef]
- Tan, X.; Chen, W.; Tan, X.; Fan, C.; Mao, Y.; Cheng, K.; Du, B. Missing data imputation in tunnel monitoring with a spatio-temporal correlation fused machine learning model. J. Civ. Struct. Health Monit. 2024, 15, 1337–1348. [Google Scholar] [CrossRef]
- Chen, R.-P.; Zhang, P.; Kang, X.; Zhong, Z.-Q.; Liu, Y.; Wu, H.-N. Prediction of maximum surface settlement caused by earth pressure balance (EPB) shield tunneling with ANN methods. Soils Found. 2019, 59, 284–295. [Google Scholar] [CrossRef]
- Chen, R.; Zhang, P.; Wu, H.; Wang, Z.; Zhong, Z. Prediction of shield tunneling-induced ground settlement using machine learning techniques. Front. Struct. Civ. Eng. 2019, 13, 1363–1378. [Google Scholar] [CrossRef]
- Kohavi, R. A study of cross-validation and bootstrap for accuracy estimation and model selection. In Proceedings of the 14th International Joint Conference on Artificial Intelligence, Montreal, QC, Canada, 20–25 August 1995. [Google Scholar]
Disclaimer/Publisher’s Note: The statements, opinions and data contained in all publications are solely those of the individual author(s) and contributor(s) and not of MDPI and/or the editor(s). MDPI and/or the editor(s) disclaim responsibility for any injury to people or property resulting from any ideas, methods, instructions or products referred to in the content. |
© 2025 by the authors. Licensee MDPI, Basel, Switzerland. This article is an open access article distributed under the terms and conditions of the Creative Commons Attribution (CC BY) license (https://creativecommons.org/licenses/by/4.0/).