Abstract
Ordinary concrete exhibits inherent brittleness, which restricts its deformation capacity and durability under extreme loading conditions. Engineered cementitious composites (ECC) have been developed to address these limitations; however, conventional ECC often suffers from relatively low compressive strength, limiting its use in demanding structural applications. To overcome this drawback, high-strength ECC (HS-ECC) was prepared by incorporating high-volume mineral admixtures and three types of synthetic fibers-polypropylene (PP), polyethylene (PE), and polyvinyl alcohol (PVA). This study aimed to investigate the influence of fiber type and dosage on the flexural behavior of HS-ECC and to propose a toughness evaluation framework better suited to its strain-hardening characteristics. A comprehensive experimental program, including compressive and four-point bending tests, was conducted to evaluate failure modes, flexural performance, and post-cracking behavior. Results showed that PE fibers significantly enhanced flexural strength and toughness, PP fibers provided superior deformability at higher dosages, while PVA fibers tended to fracture due to strong matrix bonding, limiting their effectiveness in high-strength matrices. Based on the observed load–deflection responses, a physically meaningful flexural toughness evaluation method was developed, which reliably captured elastic, hardening, and softening stages of HS-ECC. The findings not only clarify the role of different fiber types in HS-ECC but also offer a new evaluation approach that can guide fiber selection and mix design for structural applications.
1. Introduction
Concrete is one of the most widely used construction materials in modern civil engineering due to its abundance, ease of preparation, and straightforward casting process. However, ordinary concrete is inherently brittle, leading to sudden failure once its tensile strength is exceeded [1,2]. This brittleness restricts the deformation capacity of structural members and compromises their safety and durability under extreme loads, such as earthquakes, impacts, or long-term service degradation. Cracks formed during loading or environmental exposure can propagate rapidly, accelerating stiffness loss, shortening service life, and increasing maintenance costs. To address these limitations, researchers have devoted significant efforts to improving the crack resistance, ductility, and toughness of cement-based materials [3,4,5]. Bahmani et al. [6] investigated the influence of various synthetic and steel fibers on the mechanical and environmental properties of high-performance concrete incorporating zeolite, highlighting the critical role of fiber type in controlling both mechanical performance and sustainability. Various strategies have been proposed, including optimizing mix proportions, introducing supplementary cementitious materials, and incorporating fibers to bridge cracks and transfer stress across fracture planes. Among them, fiber reinforcement has proven particularly effective, as it can arrest micro-cracks at an early stage, delay crack coalescence, and enhance energy absorption capacity.
Engineered cementitious composites (ECC), developed based on micromechanical principles, represent a significant advancement in cementitious materials [7,8,9]. Unlike conventional fiber-reinforced concrete, ECC exhibits strain-hardening behavior and multiple tightly controlled micro-cracking under tensile stress. Instead of forming a few wide cracks, ECC develops numerous fine micro-cracks, which enhance ductility, improve durability, and increase energy dissipation capacity [10,11]. These unique properties not only mitigate the brittleness of ordinary concrete but also significantly reduce crack widths, limiting ingress of harmful agents such as chloride ions or sulfates, thereby improving long-term performance. Consequently, ECC is particularly suitable for structural applications requiring high durability [12,13].
Flexural behavior is critical for structural safety and serviceability, as it governs a member’s ability to resist cracking, deformation, and collapse under bending loads [14]. Experimental studies have consistently demonstrated the superior flexural performance of ECC and its variants. For instance, Qin et al. [15] investigated ECC slabs with different strength grades and observed enhanced mid-span deflections and energy dissipation compared with conventional concrete. Similarly, Tian et al. [16] reported that ECC-reinforced concrete beams exhibited a synergistic improvement in flexural capacity and crack control. These findings confirm that ECC’s pseudo-strain-hardening behavior and multiple microcracking patterns effectively enhance flexural performance. Nevertheless, the relatively low compressive strength of conventional ECC restricts its application in structures demanding both high compressive capacity and ductility [17,18].
High-strength ECC (HS-ECC) combines compressive strength intermediate between conventional ECC (<60 MPa) and ultra-high performance ECC (>120 MPa) [12] with the strain-hardening and multiple micro-cracking behavior characteristic of ECC [19]. This allows HS-ECC to achieve both high strength and excellent ductility, making it suitable for high-rise buildings, long-span bridges, and other critical infrastructure [20,21]. This enhanced mechanical performance allows HS-ECC to sustain higher loads while maintaining substantial deformation capacity, which is crucial for structural resilience under extreme events such as seismic or impact loading. Its distinctive mechanical response, particularly in terms of flexural toughness, post-cracking deformation, and energy dissipation, necessitates systematic experimental and analytical evaluation. Moreover, understanding the influence of fiber type, content, and matrix composition on HS-ECC performance is essential for optimizing design and ensuring reliable structural behavior in practical applications.
Flexural toughness quantifies the energy absorption and post-cracking load-bearing capacity of cementitious composites [22,23,24]. Recent studies have shown that four-point bending tests are effective for characterizing the flexural response and toughness of ECC and its variants. For example, Zhang et al. [25] quantified ECC slab toughness through mid-span deflection and load–deflection behavior, while Wang et al. [26] reported enhanced ductility and energy dissipation in desert sand ECC. Zhu et al. [27] further demonstrated that the mix proportion significantly affects flexural toughness in green ECC. However, these studies generally rely on existing standards such as ASTM C1018 [28], JSCE-SF4 [29], and CECS 13:2009 [30], which have limitations when applied to strain-hardening composites, as they often fail to fully capture the strain-hardening stage, fiber bridging effects, and multiple microcrack distribution. These limitations highlight the need for a specialized evaluation framework for HS-ECC that adequately accounts for fiber contributions, crack distribution, and post-cracking load capacity.
In this study, a potentially sustainable HS-ECC was developed using a high proportion of mineral admixtures to reduce cement consumption and environmental impact. Domestically produced synthetic fibers—polypropylene (PP), polyethylene (PE), and polyvinyl alcohol (PVA)—were incorporated at varying volume fractions to further enhance economic feasibility. The objectives were to (i) evaluate the flexural behavior and toughness of HS-ECC with different fiber types and contents, (ii) compare their influence on load–deflection response and post-cracking toughness, and (iii) develop and validate a flexural toughness evaluation method tailored for HS-ECC. Based on the mechanical properties of the fibers, the following hypotheses were proposed: (H1) high-modulus PE fibers are expected to yield the highest flexural strength and toughness; (H2) PP fibers may provide good ductility at higher volumes, whereas PVA fibers may increase strength but limit toughness due to strong fiber–matrix bonding; and (H3) the proposed evaluation method is hypothesized to more effectively capture differences in fiber performance than conventional approaches. The compressive strength and four-point bending were conducted to verify these hypotheses and assess the suitability of the proposed method.
2. Test Setup and Existing Flexural Toughness Methods
2.1. Test Setup
This study develops a HS-ECC by using a high proportion of mineral admixtures to partially replace cement, thereby reducing the heat of hydration [31,32], lowering environmental impact, and decreasing construction costs [33,34]. The materials employed include ordinary Portland cement (P.O 42.5R), Class I fly ash (FA), S95 ground granulated blast-furnace slag (GGBFS), silica fume (SF), silica sand (SS) with particle sizes of 0.044-2 mm, and a superplasticizer with a minimum water-reduction rate of 25%. Specifically, SF was supplied by Xi’an Linyuan Microsilica Co., Ltd., (Xi’an, China) as an amorphous gray-white powder with a SiO2 content of 94% and a specific surface area of 19,000 m2/kg. GGBFS was provided by Shaanxi Delong Powder Materials Co., Ltd., (Xi’an, China), classified as grade S95, with a specific surface area of 410 m2/kg and a density of 2900 kg/m3. Class I FA was obtained from Henan Hengyuan New Materials Co., Ltd., (Zhengzhou, China), with a specific surface area of 427 m2/kg. The particle size distribution of cementitious materials is presented in Figure 1.
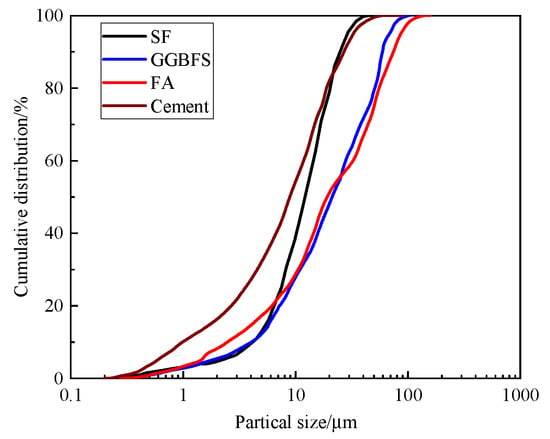
Figure 1.
Particle size distribution of cementitious materials.
To further enhance economic feasibility, low-cost domestically produced synthetic fibers such as PP, PE, and PVA were incorporated. For comparison, the Japanese Kuraray PVA fiber commonly used in ECC is priced at approximately 500 RMB/kg, whereas the domestic PE, PVA, and PP fibers cost about 120 RMB/kg, 20 RMB/kg, and 8 RMB/kg, respectively, demonstrating a significant cost advantage. These fibers were selected for their wide domestic availability, distinct mechanical and interfacial properties, and cost-effectiveness. Specifically, PP fibers exhibit a low modulus and weak fiber–matrix bonding, PE fibers provide high modulus and tensile strength, and PVA fibers offer strong hydrophilicity and interfacial adhesion. By using these three representative fibers, the study systematically evaluates their effects on the flexural performance of HS-ECC within an identical high-strength matrix, providing experimental evidence and quantitative data to guide rational fiber selection in ECC design and applications. The properties of these fibers are presented in Table 1, where the fiber aspect ratio refers to the length-to-diameter ratio, and elongation refers to the ultimate tensile strain at fiber failure.

Table 1.
Performance indices of fibers.
The study primarily investigates the effects of fiber type and volume content on the mechanical performance of HS-ECC, while keeping the matrix mix proportion constant. The mix proportions and the cost of each raw material per kilogram are presented in Table 2. Replacing 60% of cement with a combination of FA, GGBFS, and SF can reduce embodied CO2 emissions by about 30–40% and lower the adiabatic temperature rise by approximately 20–30% compared with ordinary Portland cement-only matrices [35,36]. These reductions are primarily attributed to the decreased clinker content, as well as the pozzolanic and latent hydraulic reactions of the mineral admixtures, which also enhance the long-term strength and microstructural stability of the matrix [35,36].

Table 2.
Mix proportion.
Three types of fibers (PP, PE, and PVA) were used, with contents controlled by volume fraction (vol.%) at five levels: 0.5%, 1.0%, 1.5%, 2.0%, and 2.5%. Similar fiber volume fractions, up to 2.5%, have also been adopted in previous ECC studies [37,38,39,40] to promote strain-hardening and multiple-cracking behavior. As this study aims to evaluate the applicability of domestically produced, cost-effective synthetic fibers in HS-ECC, it was necessary to systematically investigate a range of fiber volume fractions, including the upper bound of 2.5%, to elucidate their effects on mechanical performance and flexural toughness. Although a fiber content of 2.5% is relatively high, workability was maintained through the use of a high-range water-reducing admixture and a stepwise mixing procedure: (1) dry-mixing binders and sand for 2 min; (2) adding water with superplasticizer and mixing for 2 min; (3) gradually introducing fibers over 1 min; and (4) mixing for an additional 4 min to ensure uniform dispersion. The practicality of incorporating this fiber content was verified through trial mixing and specimen preparation, during which no significant balling or segregation was observed. Furthermore, the associated cost increase was negligible compared with the influence of fiber price; therefore, the economic feasibility of the proposed HS-ECC remains valid. Specimen labels (e.g., PP-0.5) indicate the fiber type and corresponding volume fraction, with the same notation applied to other fibers.
Specimen dimensions and test methods were determined according to JC/T 2461-2018 [41]. Compressive strength (fcu) was measured using 100 mm cubic specimens [41]. The specimen dimensions and the four-point bending test setup are shown in Figure 2. Four-point bending specimens measured 100 mm × 100 mm × 400 mm, with two linear variable displacement transducers installed at mid-span to measure deflection [41]. Tests were conducted on an MTS servo-controlled universal testing machine with a 100 kN capacity under displacement control at a rate of 0.1 mm/min. Loading was stopped when the load decreased to 85% of the peak load. Each test group consisted of three specimens, cured under standard conditions (20 ± 2 °C and relative humidity ≥ 95%) for 28 days. Compressive and flexural strengths were averaged over the three specimens. Peak flexural strength (fp) was calculated using the standard formula fp = FpL/(bh2), where Fp is the peak load of the specimen (N), L is the span between supports (mm), b is the specimen cross-sectional width (mm), and h is the specimen cross-sectional height (mm).
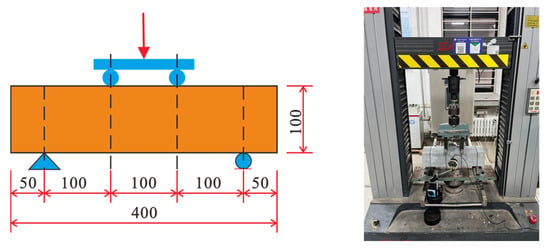
Figure 2.
Four-point bending test specimen size and test setup.
2.2. Existing Methods for Flexural Toughness Evaluation
Flexural toughness indices are widely used to characterize the flexural performance of concrete [42,43]. Common calculation methods are provided in standards such as ASTM C1018 [28], JSCE-SF4 [29], CECS 13:2009 [30], and JG/T 472-2015 [41]. Based on four-point bending test results, the applicability of these methods is discussed herein, and a flexural toughness evaluation method suitable for HS-ECC is proposed. The ASTM C1018 standard [28] uses the flexural toughness index to characterize concrete flexural performance. This method has the advantages of clear physical meaning and dimensionless representation. In ASTM C1018, the initial cracking point is defined as the deviation point from the linear portion of the load–deflection curve. However, the identification of this point is highly influenced by subjective factors, leading to significant variations in calculated results. Moreover, the load–deflection curve of HS-ECC exhibits a deflection hardening stage after initial cracking, which cannot be fully captured by the ASTM C1018 method.
The JSCE-SF4 standard [29] evaluates concrete flexural toughness using equivalent flexural strength, avoiding the sensitivity to the initial cracking point and providing a concise calculation method convenient for engineering applications. However, JSCE-SF4 considers only a limited number of characteristic deflection points, which may not fully reflect the flexural toughness of HS-ECC. For example, in PE fiber-reinforced HS-ECC specimens, the equivalent flexural strength calculated according to JSCE-SF4 yielded the ranking: PE-2.0 > PE-2.5 > PE-1.5 > PE-1.0 > PE-0.5, which contradicts the actual behavior observed in the load–deflection curves. This discrepancy arises because some HS-ECC specimens exhibited mid-span deflections far greater than the specified characteristic deflection L/150 (2 mm) but had not yet entered the deflection softening stage, maintaining significant load-carrying capacity. Therefore, JSCE-SF4 is not suitable for evaluating HS-ECC flexural toughness.
The CECS 13:2009 standard [30] modifies JSCE-SF4 by introducing a dimensionless flexural toughness ratio to characterize concrete flexural performance. However, the determination of the initial cracking strength in CECS 13:2009 is the same as that in ASTM C1018 and remains highly influenced by subjective factors. Additionally, CECS 13:2009 adopts the same equivalent flexural strength as JSCE-SF4, limiting its ability to fully characterize HS-ECC flexural behavior.
The JG/T 472-2015 standard [41] was developed to evaluate the flexural toughness of steel fiber-reinforced concrete and considers both pre-peak and post-peak flexural toughness ratios to represent overall flexural performance. However, using the flexural toughness ratio to represent pre-peak toughness may be inappropriate. The formula for calculating the pre-peak flexural toughness ratio is derived as follows:
where Re,p represents the pre-peak flexural toughness ratio of the specimen; fe,p is the equivalent flexural strength before peak deflection (MPa); Ap denotes the area under the load–deflection curve before peak deflection (N∙mm); and δp is the peak deflection (mm).
As shown in Figure 3, Re,p is defined as the ratio of the area under the load–deflection curve, Ap, to the area of the rectangle defined by Fpδp (or Fp′δp′). For a convex curve (curve a), the flexural toughness ratio is greater than 0.5, whereas for a concave curve (curve b), the ratio is less than 0.5. This indicates that the convex curve a has a higher flexural toughness ratio than the concave curve b. However, the area under the load–deflection curve for the concave curve b is actually larger than that of the convex curve a, suggesting that the concave curve exhibits superior flexural performance. Therefore, the pre-peak flexural toughness ratio primarily reflects the degree of slope change in the load–deflection curve, and its use for evaluating HS-ECC specimens has inherent limitations. For example, the pre-peak flexural toughness ratios calculated according to the JG/T 472-2015 standard for PP-2.0, PE-2.0, and PVA-2.0 specimens are 0.78, 0.67, and 0.56, respectively, which show some discrepancy with the actual behavior observed in the experimental load–deflection curves.
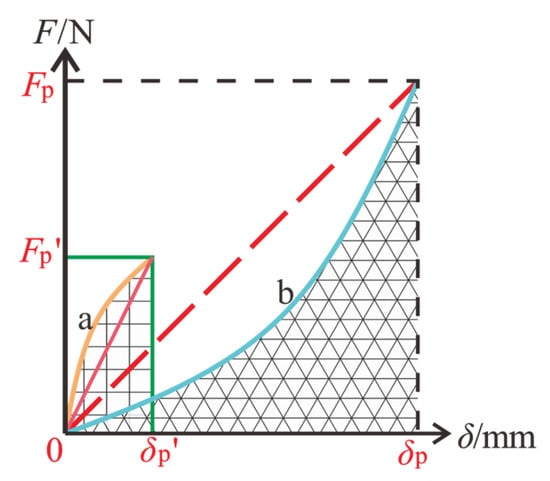
Figure 3.
Flexural toughness indexes of JGT 472-2015.
3. Results and Discussion
3.1. Compressive Performance
The performance indices of HS-ECC with different fiber types and volume fractions are summarized in Table 3. The matrix was proportioned to achieve 60% replacement of cement by mineral admixtures—higher than the typical 50% used in conventional ECC [44,45]. This high substitution rate reduces cement content, lowers production cost, improves environmental sustainability, and enhances packing density and pozzolanic reactivity. The inclusion of finely dispersed SF further densified the microstructure, resulting in a 28-day compressive strength of 76.3–83.64 MPa, thereby confirming the classification of the mixture as HS-ECC and satisfying the high-strength concrete requirements specified in the Chinese code JGJ/T 281-2012 [46]. Compressive failure modes are shown in Figure 4: matrix specimens fractured with a loud sound, exhibiting brittle failure, whereas HS-ECC specimens produced only a faint noise. Fiber bridging effectively prevented brittle failure, preserving specimen integrity and resulting primarily in diagonal surface cracks.

Table 3.
Performance indices of specimens.
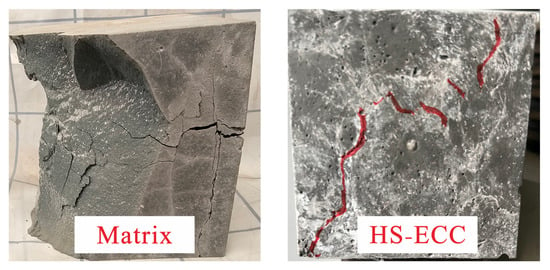
Figure 4.
Failure patterns of compressive specimens.
The effects of fiber type and volume content on the compressive strength of HS-ECC are illustrated in Figure 5. The compressive strength is influenced by two competing mechanisms: the enhancement effect provided by fiber bridging, which restrains lateral deformation, and the weakening effect caused by initial defects introduced by fibers. The net change in compressive strength depends on whether the enhancement effect compensates for the weakening effect. Overall, the three fiber types exhibited different impacts on compressive strength. The water contact angles of the fibers follow the order PP > PE > PVA, with PP fibers being hydrophobic, PE fibers moderately hydrophobic, and PVA fibers highly hydrophilic [45].
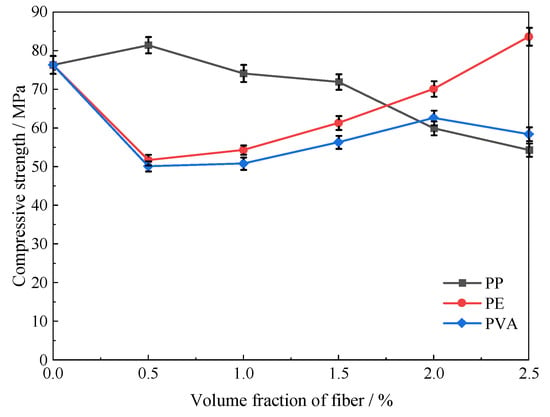
Figure 5.
Compressive strength influenced by fiber type and volume fraction.
When the fiber volume fraction was ≤1.5%, PP fibers were well dispersed within the matrix, effectively restraining lateral deformation and increasing compressive strength. Consequently, specimens containing PP fibers exhibited the highest compressive strength, followed by those with PE fibers. In contrast, the strong hydrophilicity of PVA fibers reduced the availability of free water in the matrix, leading to more initial defects and the lowest compressive strength among the specimens.
When the fiber volume fraction was ≥2.0%, high-strength and high-modulus fibers could partially offset the negative effects associated with poor dispersion and increased initial defects, thereby enhancing compressive strength. Under these conditions, PE fiber specimens exhibited the highest compressive strength, followed by PVA fiber specimens, and then PP fiber specimens. These observations demonstrate that the impact of fibers on compressive strength is generally limited and often negative, which is consistent with findings reported by previous studies [47].
Specifically, for PP fibers, a volume fraction ≤ 0.5% enhanced compressive strength, as the randomly distributed fibers effectively constrained lateral expansion under uniaxial compression. The compressive strength of PP-0.5 specimens increased by 6.7% compared with the plain matrix. However, when the PP fiber volume fraction was ≥1.0%, the increase in fiber content led to more initial defects, and the reinforcing effect of PP fibers was insufficient to compensate for the negative impact, resulting in decreases of 2.9%, 5.8%, 21.5%, and 28.8% for PP-1.0, PP-1.5, PP-2.0, and PP-2.5 specimens, respectively. These results indicate that higher PP fiber content amplifies the negative influence of initial defects on compressive strength.
For PVA fibers, all specimens exhibited lower compressive strength than the plain matrix. This phenomenon is primarily attributed to the hydrophilic hydroxyl groups in PVA and the absence of hydrophobic treatment, which caused free water to accumulate on fiber surfaces, reducing water availability for hydration and increasing initial defects. When the PVA fiber volume fraction was ≤2.0%, the compressive strength of PVA-0.5, PVA-1.0, PVA-1.5, and PVA-2.0 specimens decreased by 34.3%, 33.4%, 26.2%, and 18.0%, respectively, relative to the plain matrix. This indicates that increasing the PVA fiber content within this range partially mitigated the weakening effect, delaying the reduction in compressive strength. However, at a 2.5% volume fraction, excessive fibers reduced matrix homogeneity and density, further increasing initial defects, resulting in a 23.5% decrease for PVA-2.5 specimens.
For PE fibers, a volume fraction of ≤2.0% reduced compressive strength, with PE-0.5, PE-1.0, PE-1.5, and PE-2.0 specimens showing decreases of 32.2%, 28.8%, 19.7%, and 8.1%, respectively. When the fiber volume fraction reached 2.5%, the compressive strength increased by 9.6%. This behavior can be attributed to the dual role of PE fibers in the matrix. At low contents, isolated fibers introduce defects and weak fiber–matrix interfaces, which serve as preferential sites for microcrack initiation. Limited dispersion or local clustering further creates voids and heterogeneities, thereby reducing compactness and mechanical integrity. As the fiber content exceeds a critical threshold (2.5%), PE fibers form an interconnected three-dimensional network that effectively bridges microcracks, suppresses crack propagation, dissipates strain energy, and constrains lateral dilation of the matrix. This network enhances both compressive strength and ductility, compensating for the negative effects observed at lower fiber contents.
3.2. Flexural Performance
The crack patterns at the bottom of the matrix and HS-ECC specimens under four-point bending tests are shown in Figure 6. For the plain matrix specimens, the load–deflection curves exhibited an approximately linear increase before cracking. Upon reaching the peak load, sudden cracks developed, propagating rapidly through the specimen and resulting in typical brittle failure in the pure bending region, with the specimen splitting into two separate blocks. In contrast, fiber-reinforced specimens displayed an overall “crack but not fail” mode. Multi-crack propagation was observed for PP fiber specimens at volume fractions ≥ 2.0% and for PE fiber specimens at volume fractions ≥ 1.0%, whereas PVA fiber specimens did not exhibit multi-crack propagation.
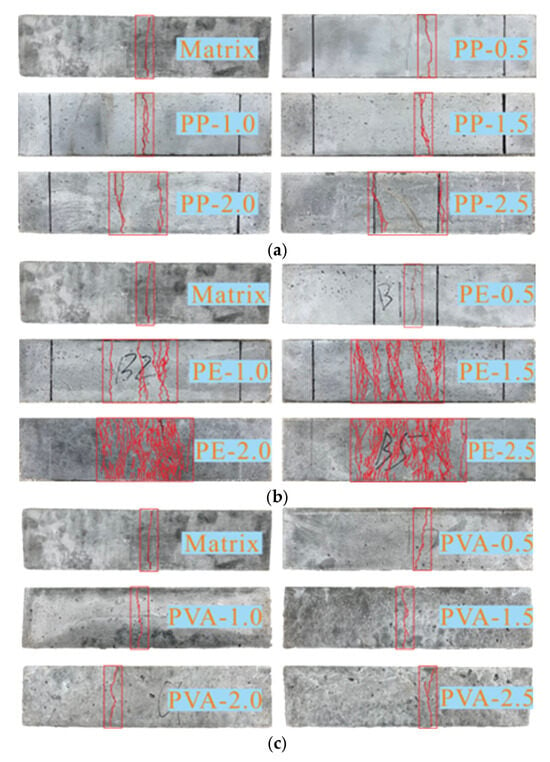
Figure 6.
Crack patterns at the bottom of specimens under four-point bending test. (a) Specimens containing PP fibers; (b) Specimens containing PE fibers; (c) Specimens containing PVA fibers.
The load–deflection curves are presented in Figure 7. During loading, both the matrix and fibers carried the applied load. In the initial stage, the load increased almost linearly until the first visible crack appeared at the specimen’s bottom. After the initial cracking, the stress transfer mechanism changed: randomly distributed fibers in the matrix absorbed energy, and fiber bridging carried part of the load. When the fiber bridging capacity was lower than the matrix failure load, the load–deflection curves exhibited a sharp drop, without showing deflection hardening or multi-crack propagation. For example, specimens with low fiber content, such as PP-0.5, PP-1.0, and PVA-0.5, contained only a few fibers bridging the crack tips; the load dropped sharply, but brittle failure was avoided due to limited fiber bridging. Specimens with higher fiber content, such as PP-1.5, or those with high fiber tensile strength and modulus, such as PE-0.5 and PVA-1.0, showed a small drop followed by partial load recovery, indicating some secondary strengthening. This demonstrates that increasing fiber content and fiber strength can enhance load-carrying capacity. However, the peak load did not exceed the initial cracking load, suggesting that the fiber bridging capacity remained lower than the matrix failure load, and neither deflection hardening nor multi-crack propagation occurred.
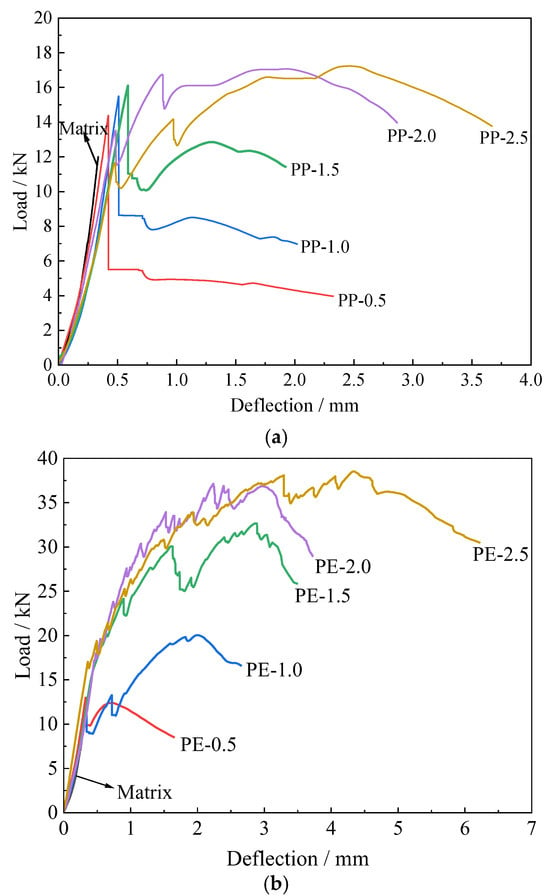
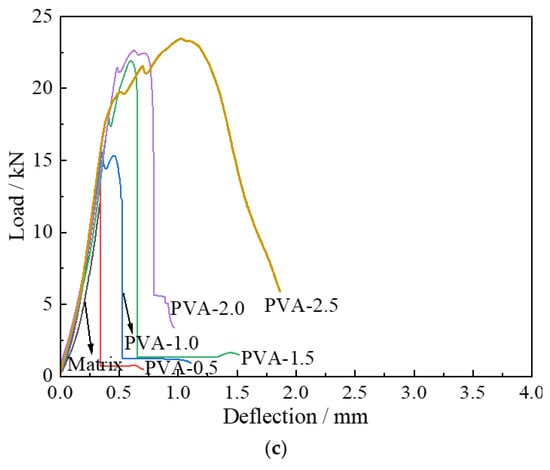
Figure 7.
Load–deflection curve of specimens under four-point bending test. (a) Specimens containing PP fibers; (b) Specimens containing PE fibers; (c) Specimens containing PVA fibers.
When the fiber bridging capacity exceeded the matrix failure load, the load–deflection curves exhibited a fluctuating increase, indicative of deflection hardening, as observed in PP-2.0, PP-2.5, PE-1.0 to PE-2.5, and PVA-1.5 to PVA-2.5 specimens. Due to the relatively low tensile strength and weak fiber–matrix bond of PP fibers, fibers could be easily broken or pulled out with limited energy dissipation; thus, a high fiber volume fraction was required for effective multi-crack development, as observed in PP-2.0 and PP-2.5 specimens. In contrast, PE fibers, with high tensile strength and modulus, demonstrated pronounced deflection hardening and multi-crack propagation in PE-1.0 to PE-2.5 specimens. Although PVA-1.5 to PVA-2.5 specimens exhibited deflection hardening, only a single crack was observed. This is attributed to the strong bond between PVA fibers and the matrix: much of the fiber bridging capacity was consumed by fiber debonding, and most fibers either did not slip or slipped minimally, preventing multi-crack development when the matrix failure load exceeded the fiber bridging capacity. After reaching the peak load, all HS-ECC specimens entered the deflection softening stage. Progressive fiber pullout, fiber fracture, and matrix damage led to gradual crack widening and continued deflection increase, ultimately resulting in the loss of load-carrying capacity.
The fiber bridging effect transformed brittle failure into ductile failure and significantly improved both flexural strength and deformability. The influence of fiber type and volume fraction on peak flexural strength and peak deflection is shown in Figure 8. Compared with the plain matrix, the flexural strength of all three fiber-reinforced specimens increased with increasing fiber volume fraction. At a volume fraction of 0.5%, the flexural strengths of the three fiber types were similar, indicating that at low fiber contents, the limited number of fibers per unit area of the matrix provided only a small enhancement effect.
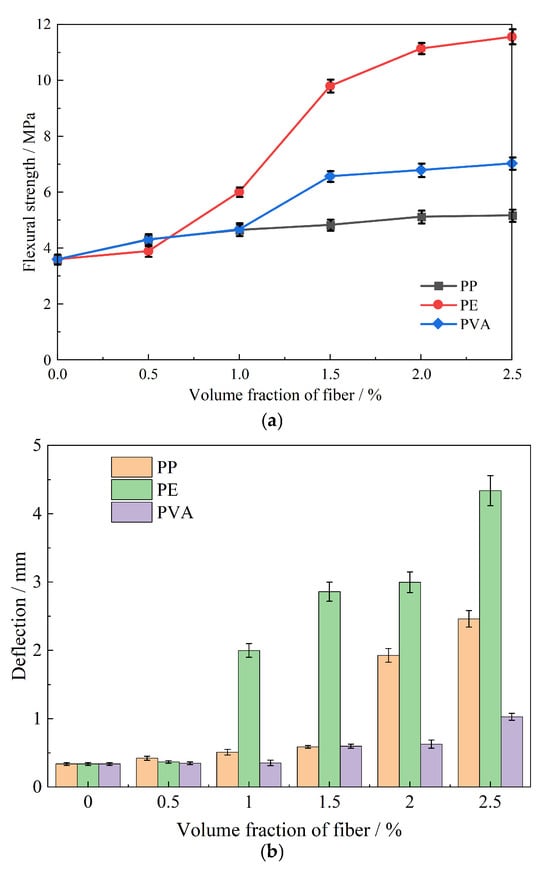
Figure 8.
Effect of fiber type and volume fraction on peak flexural strength and peak deflection. (a) Effect of fiber type and volume fraction on peak flexural strength; (b) Effect of fiber type and volume fraction on peak deflection.
At fiber volume fractions of 1.0% and 1.5%, varying degrees of flexural strength improvement were observed among the three fiber types. Due to the low elastic modulus and weak fiber–matrix bond of PP fibers, their crack-bridging effect was limited, resulting in modest flexural strength increases of 29.2% and 34.2% for PP-1.0 and PP-1.5 specimens, respectively. In contrast, high-strength and high-modulus PE fibers produced substantial enhancement effects, with flexural strength increases of 66.9% and 172.2% for PE-1.0 and PE-1.5 specimens, respectively. The mechanical properties of PVA fibers lie between those of PP and PE fibers; accordingly, PVA-1.0 and PVA-1.5 specimens exhibited flexural strength increases of 29.6% and 82.6%, respectively. When the fiber volume fraction reached 2.0% and 2.5%, the enhancement of flexural strength for all three fiber types tended to plateau, likely due to reduced average fiber spacing and non-uniform fiber distribution, which increased internal defects and limited further strength gains.
HS-ECC exhibited excellent deformability compared with ordinary concrete. At a fiber volume fraction of 0.5%, the peak deflection of all fiber-reinforced specimens was similar to that of the matrix; however, the load–deflection curves were fuller and exhibited residual load-carrying capacity after the peak load, indicating that even a small fiber content could improve deformability. When the fiber volume fraction was ≥1.0%, the beneficial effect on deformability became more pronounced, with increasingly fuller load–deflection curves. Compared with the matrix, peak deflection increased by 51.0%, 74.5%, 471.8%, and 630.3% for PP-1.0, PP-1.5, PP-2.0, and PP-2.5 specimens, respectively. Although PP fibers have relatively low tensile strength and modulus, their weak bond with the matrix facilitated fiber pullout and slip, enabling good load-carrying capacity under high deformation.
PE fibers produced the most significant improvement in deformability, with peak deflection increases of 493.2%, 748.4%, 789.3%, and 1186.9% for PE-1.0, PE-1.5, PE-2.0, and PE-2.5 specimens, respectively. This substantial increase is attributed to the high strength and modulus of PE fibers, which prevented fiber fracture and allowed effective bridging across cracks, enhancing both fiber pullout and slip, as shown in the fracture surfaces in Figure 9. PVA fibers exhibited relatively limited improvement in deformability, with peak deflection increases of 4.7%, 77.4%, 86.1%, and 204.7% for PVA-1.0, PVA-1.5, PVA-2.0, and PVA-2.5 specimens, respectively. The relatively poor deformability is mainly due to the strong hydrophilicity of PVA fibers, which promoted strong fiber–matrix bonding through hydration reactions, leading to fiber fracture during debonding and minimal fiber pullout or slip, as observed on the fracture surfaces (Figure 9).
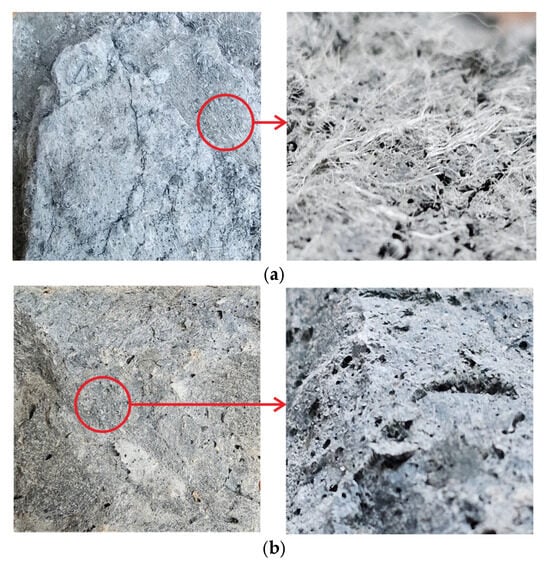
Figure 9.
Fracture surface of PE fiber and PVA fiber specimens under four-point bending test. (a) Fracture surface of specimens with PE fibers; (b) Fracture surface of specimens with PVA fibers.
To identify the optimal balance between compressive strength and ductility in HS-ECC, a ductility-to-strength index (δp/fcu) was introduced, and the calculated results are summarized in Table 3. The δp/fcu index increased consistently with fiber content for all fiber types, although the growth rate and maximum values varied considerably. Among the three fibers, PE-2.5 achieved the highest value (δp/fcu = 0.0519), indicating the best balance between strength and ductility, followed by PP-2.5 (0.0453) and PVA-2.5 (0.0176). While higher PE contents (≥2.0%) provided the most favorable ductility–strength combination, PE-1.5 (0.0467) also exhibited excellent overall performance with good workability and lower material cost. Therefore, considering mechanical performance, cost, and constructability, PE fibers at 1.5–2.5% represent the most rational selection for HS-ECC design.
The three fiber types influenced compressive strength, flexural strength, and deformability in distinct ways, reflecting differences in their mechanical properties and fiber–matrix interactions. PP fibers, with a low elastic modulus and weak interfacial bonding, promoted wide and multiple cracks, resulting in excellent deformability but moderate stress-transfer efficiency [48,49,50,51,52]. At higher contents (>2.0%), increased porosity and fiber–matrix defects slightly reduced overall performance. In contrast, PE fibers exhibited high tensile strength and elastic modulus, enabling greater crack-bridging stresses and energy absorption. Their moderate elongation allowed sufficient pullout and slip-hardening, while strong interfacial adhesion enhanced stress transfer and confinement, leading to marked improvements in both flexural strength and deformability. Regarding compressive strength, PP fibers slightly outperformed PE fibers at low contents (<1.5%) due to their softness, which mitigates internal stress concentrations. However, at higher contents, the superior stiffness and adhesion of PE fibers outweighed defect-induced weakening. PVA fibers, characterized by strong interfacial adhesion from chemical bonding and surface roughness, exhibited limited multiple cracking but achieved relatively high peak flexural strength, surpassing all PP specimens. Although PVA fibers slightly reduced compressive strength due to hydrophilicity and the introduction of microdefects, their abundant hydroxyl groups formed hydrogen bonds and localized chemical bridges at the interface, enabling efficient load transfer. The dense fiber distribution and high interfacial friction further contributed to superior flexural load-bearing behavior. For applications requiring moderate flexural strength, PP fibers at ≥2.0% provide excellent deformability, whereas PVA fibers at ≥1.5% achieve higher strength but limited ductility; surface hydrophobic treatment may further improve PVA performance.
4. Evaluation of Flexural Toughness
4.1. Flexural Toughness Evaluation Method for HS-ECC
HS-ECC exhibits remarkable ductility and multiple cracking behavior due to the fiber-bridging mechanism, which delays crack initiation and enhances post-cracking energy absorption. The flexural behavior of HS-ECC differs significantly from that of conventional fiber-reinforced concrete, necessitating a method to quantitatively characterize the evolution of flexural toughness throughout the entire loading process. As shown in Figure 10, the failure process under loading can be divided into three stages: Stage I—elastic stage; Stage II—deflection hardening stage; and Stage III—deflection softening stage. The subjectivity in identifying the initial cracking point in ASTM C1018 [28] is particularly challenging for HS-ECC due to its strain-hardening behavior and multiple fine cracks, which make visual detection unreliable. Moreover, existing evaluation methods for the flexural toughness of fiber-reinforced concrete are inadequate for comprehensively assessing the flexural toughness of HS-ECC. To overcome this limitation, a displacement offset method, based on the 0.02% strain offset originally introduced for axial tensile tests [53], is applied to determine the initial crack point A in the four-point bending tests. This method provides a systematic and quantitative means of determining the initial cracking load and corresponding mid-span deflection, thereby eliminating the subjectivity associated with visual observation.
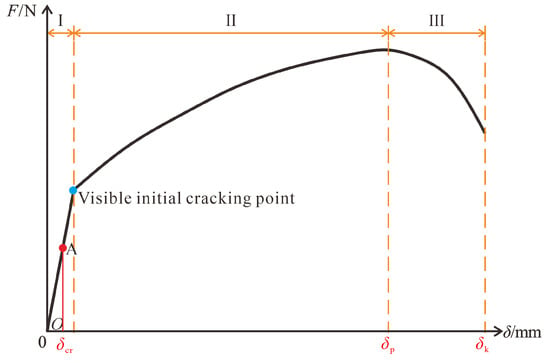
Figure 10.
Failure process of HS-ECC specimens under four-point bending test.
In Stage I, the width of any initial crack generally does not exceed 0.02 mm; thus, HS-ECC can be regarded as a homogeneous and continuous linear-elastic material. For four-point bending tests, the load–deflection relationship can be derived from structural mechanics principles and is expressed in Equation (2). Specifically, the stress–strain and stress–load relationships at the tensile edge of HS-ECC are given in Equation (3).
where δ is the mid-span displacement (mm); F is the applied load (N); E is the elastic modulus (MPa); and I is the moment of inertia of the section (mm4).
where σ is the stress (MPa), and ε is the tensile strain.
By combining Equations (2) and (3), the mid-span deflection at the initial crack point can be calculated as follows:
where δcr is the mid-span displacement at the initial crack point (mm), and ε0.02 is the tensile edge strain of 200 με.
The enhancement of concrete performance by synthetic fibers before the peak load is primarily reflected in the increased peak flexural strength, peak displacement, and overall toughness. After the peak load, the improvement is mainly manifested in the enhancement of residual flexural strength and load-bearing capacity. Following the initial cracking point, the proposed method evaluates the flexural toughness of HS-ECC throughout the entire loading process from the perspectives of energy ratio and strength ratio. The flexural toughness indices, expressed in terms of energy and strength ratios, are defined in Equations (5) and (6), respectively.
The energy ratio consists of two components: the peak energy ratio (Ip) and the post-peak energy ratio (Ik), which correspond to the deformation-hardening and deformation-softening stages of HS-ECC, respectively.
where Tcr and Tp represent the areas under the load–deflection curve from the origin O to δcr and δp, respectively (N∙mm); Tpk denotes the area under the curve from δp to δk (N∙mm). δp is the mid-span deflection at the peak load point (mm); Considering that the load-bearing capacity decreases significantly after 80% of the peak load, δk is defined as the mid-span deflection corresponding to 80% of the peak load (mm), in accordance with the Chinese code JC/T 2461-2018 [41].
The strength ratio consists of two components: the peak toughness ratio (Rp) and the post-peak toughness ratio (Rk). These parameters characterize the flexural toughness of HS-ECC throughout the entire loading process by quantifying the equivalent flexural strengths at the peak and post-peak stages, respectively.
where fcr is the first crack strength (MPa), and fep and fek are the peak equivalent strength (MPa) and residual equivalent strength (MPa), respectively, defined as follows:
Compared with the existing methods, the proposed flexural toughness evaluation approach for HS-ECC offers the following advantages: (1) It enables a quantitative assessment of the flexural toughness of HS-ECC throughout both the deflection-hardening and deflection-softening stages. (2) Larger values of Ip indicate superior flexural toughness and a greater contribution of fibers to energy absorption, while higher Ik values reflect improved post-peak flexural performance and enhanced residual load-bearing capacity. Similarly, larger Rp values correspond to higher equivalent flexural tensile strength during the hardening stage and stronger crack resistance provided by the fibers, signifying their greater contribution to the enhancement of average flexural tensile strength and crack resistance. A larger Rk value denotes higher residual equivalent strength. (3) For ductility-oriented designs, the flexural toughness index expressed in terms of the energy ratio is recommended, whereas for strength-oriented designs, the flexural toughness ratio in terms of the strength ratio can be adopted. (4) The method is dimensionless and therefore independent of specimen size or loading configuration, making it broadly applicable to various structural design and evaluation scenarios.
4.2. Flexural Toughness Evaluation of HS-ECC
Based on the HS-ECC flexural toughness evaluation method proposed above, the flexural toughness indices of all specimens were calculated from the experimental results, and the results are summarized in Table 4. It can be observed that the incorporation of fibers significantly enhances the flexural toughness of the specimens. This improvement is primarily attributed to the fiber bridging effect, which allows the specimens to continue carrying load after matrix cracking, thereby increasing the energy absorption threshold and effectively enhancing flexural toughness.

Table 4.
Flexural toughness indexes of specimens.
The flexural toughness indices of all specimens increased with increasing fiber content, confirming that fiber reinforcement effectively enhanced the energy absorption and post-cracking performance of HS-ECC. For PP fibers, both the Ip and the Rp increased gradually with fiber content, while the post-peak indices (Ik, Rk) remained relatively low at low fiber dosages. When the PP fiber volume fraction was ≤1.5%, Ip increased from 26 (Matrix) to 41.5, 50.2, and 66.7 for PP-0.5, PP-1.0, and PP-1.5, respectively, representing improvements of 59.6%, 93.1%, and 156.5% relative to the matrix. However, the Ik (0.08-0.11) and Rk (0.21–0.32) remained small, indicating that the deflection-hardening stage was not fully developed and that the residual load capacity was still limited. When the PP fiber volume fraction reached ≥ 2.0%, both pre-peak and post-peak toughness improved significantly. Ip increased sharply to 430.8 and 533.3 for PP-2.0 and PP-2.5, respectively, an increase in more than 1500% relative to the matrix. Correspondingly, Ik increased to 0.28 and 0.33, and Rk rose to 0.50 and 0.51. This indicates that a distinct deflection-hardening stage occurred, and the load–deflection curve exhibited a gradual post-peak decline with considerable residual load-carrying capacity. These improvements are attributed to the increased number of fibers bridging across cracks and enhanced crack control ability. However, due to the relatively low modulus and tensile strength of PP fibers, the interfacial bond strength remains weak, which limits toughness development at lower fiber contents.
The PE fiber series exhibited the most pronounced improvement in flexural toughness among all fiber types. Even at a low volume fraction of 0.5%, the PE-0.5 specimen showed Ip = 38.6 and Ik = 0.25, both higher than those of the PP and PVA counterparts at the same fiber content, indicating excellent crack-bridging efficiency. As the PE fiber content increased, the flexural toughness indices grew dramatically. Ip increased from 454.7 for PE-1.0 to 2189.8 for PE-2.5, and Ik rose from 0.34 to 0.52. The corresponding Rp and Rk values also improved from 0.41 to 0.55 to 0.91 and 0.84, respectively, indicating that PE fibers provided superior post-cracking ductility and energy absorption capacity. This significant enhancement results from the high tensile strength, modulus, and excellent interfacial compatibility of PE fibers, which enable multiple fine cracks and stable deflection hardening. The increasing Rk values with fiber content demonstrate the enhanced residual equivalent strength, confirming the effectiveness of PE fibers in improving toughness.
For PVA fibers, at low volume fractions (0.5–1.0%), the Ip values (34.6–37.3) were only slightly higher than those of the matrix, and Ik values (0.07–0.09) remained minimal, indicating limited toughness improvement and an absence of deflection hardening. As fiber content increased from 1.5% to 2.5%, Ip rose from 114.7 to 277.5, and Rp from 0.34 to 0.48, showing a moderate enhancement in flexural strength and toughness. However, the overall Rk values (0.37–0.58) remained relatively low compared with those of the PE fiber specimens, implying a weaker post-peak load-carrying capacity. The limited improvement is primarily attributed to the strong hydrophilicity of PVA fibers, which increases fiber–matrix bonding strength, leading to fiber rupture rather than pullout during crack propagation. Although this contributes to higher flexural strength, it restricts deformation capacity and thus limits overall toughness.
The flexural toughness indices obtained from the proposed evaluation method are consistent with the experimental load–deflection curves, confirming its reliability. Among the three fiber types, PE fibers exhibited the most significant enhancement in both pre-peak and post-peak toughness due to their high modulus, tensile strength, and superior interfacial performance. PP fibers provided moderate improvement, but only at higher volume fractions (≥2.0%) did deflection hardening become apparent. PVA fibers, despite their ability to increase flexural strength, showed limited toughness improvement because of premature fiber rupture.
4.3. Comprehensive Performance Evaluation
To determine the optimal fiber content and hybrid ratio, an integrated evaluation of mechanical properties and cost was conducted using the TOPSIS method [54]. Fifteen mixture proportions were selected as evaluation objects, each incorporating eight indicators: fcu, fp, δp, Ip, Ik, Rp, Rk, and cost. Among these, cost was treated as a loss indicator, with lower values being preferable, while the remaining indicators were considered benefit indicators, as higher values reflect superior mechanical properties of HS-ECC. The eight indicators were then normalized to construct a normalization matrix, with each row representing a mixture proportion and each column corresponding to an evaluation indicator. Due to differences in units and magnitudes among the indicators, the square sum normalization method was applied to standardize the matrix. Following normalization, the maximum and minimum values of each column were used to construct the ideal value vector and the negative-ideal value vector, respectively. The distances Di+ and Di− from each evaluation object to the ideal and negative-ideal values, respectively, were calculated. Using fcu as an example, the corresponding formulas are provided in Equation (4). Based on these distances, the closeness coefficient (Ci) for each evaluation object was computed as Ci = Di−/(Di+ + Di−).
where Dfcu,i+ and Dfcu,i− represent the squared differences in indicator fcu used in calculating the Euclidean distance between each evaluation object and the ideal or negative-ideal solution, respectively; Rfcu,i is the normalized value of fcu for each evaluation object obtained through square sum normalization; Rfcu+ and Rfcu− are the maximum and minimum normalized values of fcu across all evaluation objects, corresponding to the ideal and negative-ideal solutions, respectively.
Multi-scale integrated evaluation indicators are presented in Table 5, where a higher Ci value indicates superior comprehensive performance. Among the three fiber types, PE fibers exhibited the most significant improvement, with Ci increasing steadily from 0.208 (PE-0.5) to 0.826 (PE-2.5). This trend indicates that the high tensile strength and stiffness of PE fibers are highly effective in enhancing toughness and energy absorption, particularly at higher volume fractions. In contrast, PP fibers showed a moderate increase in Ci, peaking at 0.399 for PP-2.5. This suggests that the optimal content for PP fibers is around 2.5%, where their crack-bridging ability and energy dissipation are maximized despite limited stiffness. PVA fibers consistently exhibited the lowest Ci values, ranging only from 0.162 (PVA-1.0) to 0.330 (PVA-2.5). The relatively strong hydrophilic bond between PVA fibers and the matrix, while beneficial for strength, limited fiber pull-out and energy dissipation, resulting in reduced integrated performance. Their best performance was observed at 2.5% PVA, though even at this level (Ci = 0.330), they lagged significantly behind PE and PP. Overall, the ranking of fiber effectiveness in improving HS-ECC comprehensive performance is PE > PP > PVA, with PE fibers demonstrating clear superiority, particularly at higher dosages (≥2.0%). Based on these results, PE fiber at 2.5% volume fraction is identified as the optimal choice, achieving the highest Ci value of 0.826. From an engineering perspective, however, PE 2.0% may be considered a more practical alternative, as it provides a relatively high Ci while balancing material cost and workability concerns.

Table 5.
Comprehensive performance evaluation indicators.
5. Conclusions
- (i)
- Compared with the compressive strength of the matrix, the effect of PP fiber volume fraction on compressive strength shows an initial increase followed by a decrease, with enhancement observed only at a 0.5% volume fraction. PVA fibers consistently reduce compressive strength, while PE fibers initially reduce compressive strength at low volume fractions and enhance it only at a high-volume fraction of 2.5%.
- (ii)
- PE fibers exhibit the most significant improvement in flexural performance and deformability when the volume fraction is ≥1.0%. For applications where flexural strength requirements are moderate, low-cost PP fibers at a volume fraction ≥ 2.0% provide substantial deformability. PVA fibers at volume fractions ≥ 1.5% achieve higher flexural strength; however, due to strong fiber–matrix bonding, PVA fibers tend to fracture, resulting in limited deformability and only marginal improvement in flexural toughness. Therefore, domestically produced PVA fibers are not recommended for use in high-strength matrices.
- (iii)
- A physically meaningful flexural toughness evaluation method was proposed, which is applicable for analyzing HS-ECC specimens reinforced with different fiber types and volume fractions. For ductility-oriented designs, the flexural toughness index expressed in terms of the energy ratio is recommended, whereas for strength-oriented designs, the flexural toughness ratio in terms of the strength ratio can be adopted. This method reliably captures both deflection hardening and residual load-carrying behavior, providing an effective tool for toughness assessment.
Future research will focus on validating and extending the proposed HS-ECC system. The flexural toughness evaluation method will be applied to different matrix systems, while hybrid combinations of the three synthetic fibers will be explored. The durability of HS-ECC under freeze–thaw cycles and chloride exposure, as well as the behavior of large-scale structural members such as beams and tunnel segments, will be investigated. In parallel, digital image correlation and microstructural characterization combined with tests will provide detailed insight into fiber-bridging mechanisms and strain-hardening behavior, and direct calorimetry, along with life cycle assessment, will quantify heat of hydration and embodied carbon, supporting rational fiber selection, micromechanical understanding, and sustainable design.
Author Contributions
Conceptualization, B.C.; methodology, B.C. and X.-Y.Z.; software, X.-Y.Z.; validation, L.H.; formal analysis, L.H.; investigation, B.C., L.H., R.-G.Y., H.M. and J.-T.L.; data curation, R.-G.Y.; writing—original draft preparation, B.C.; writing—review and editing, B.C., L.H., R.-G.Y., X.-Y.Z., H.M. and J.-T.L.; project administration, H.M.; funding acquisition, H.M. and J.-T.L.; All authors have read and agreed to the published version of the manuscript.
Funding
This project was sponsored by the Natural Science Basic Research Program of Shaanxi Province (2024-JM-056) and the Key Research and Development Program of Shaanxi Province (2020-SK-390).
Data Availability Statement
The data presented in this study are available on request from the corresponding author.
Conflicts of Interest
Author Liang Hou was employed by the company Xi’an Yibo Architectural Planning and Design Co., Ltd. Author Hao Meng was employed by the company Xi’an Rail Transit Group Co., Ltd. Author Jing-Tian Li was employed by the company Shaanxi Longsheng Fuxiang Construction Engineering Co., Ltd. The remaining authors declare that the research was conducted in the absence of any commercial or financial relationships that could be construed as a potential conflict of interest.
References
- Zhou, S.; Jiang, Z.; Ou, Q.; Liu, J.; Wang, C. Analysis on flexural toughness of steel fiber reinforced concrete based on acoustic emission and digital image correlation techniques. Constr. Build. Mater. 2025, 492, 143039. [Google Scholar] [CrossRef]
- Li, P.; Huang, M.; Shang, Y.; Kuang, Y.; Xiong, G.; Tang, X. Study on mechanical properties of coarse-fine polypropylene fiber blended concrete. Buildings 2025, 15, 2971. [Google Scholar] [CrossRef]
- Ding, L.; Lin, Z.; Xu, C.; Li, B.; Shen, J. Study on the hybrid effect of basalt and polypropylene fibers on the mechanical properties of concrete. Buildings 2025, 15, 3197. [Google Scholar] [CrossRef]
- Manso-Morato, J.; Hurtado-Alonso, N.; Revilla-Cuesta, V.; Skaf, M.; Ortega-López, V. Fiber-Reinforced concrete and its life cycle assessment: A systematic review. J. Build. Eng. 2024, 94, 110062. [Google Scholar] [CrossRef]
- Zheng, Y.; Lv, X.; Hu, S.; Zhou, J.; Wan, C.; Liu, J. Mechanical properties and durability of steel fiber reinforced concrete: A review. J. Build. Eng. 2024, 82, 108025. [Google Scholar] [CrossRef]
- Bahmani, H.; Mostafaei, H. Impact of fibers on the mechanical and environmental properties of high-performance concrete incorporating zeolite. J. Compos. Sci. 2025, 9, 222. [Google Scholar] [CrossRef]
- Hu, Z.; Elchalakani, M.; Yehia, S.; Ran, H.; Sadakkathulla, M.A.; Guo, X. Engineered cementitious composite (ECC) strengthening of reinforced concrete structures: A state-of-the-art review. J. Build. Eng. 2024, 86, 108941. [Google Scholar] [CrossRef]
- Xu, S.; Li, W.; Wang, X.; Zhang, H.; Liu, J.; Jiang, H.; Wang, X.; Ma, H.; Shi, J.; Yu, Z.; et al. The mechanical properties and durability of the pe-bfrp hybrid-fiber-engineered cementitious composite (ECC). Buildings 2025, 15, 1860. [Google Scholar] [CrossRef]
- Chen, W.; Liang, L.; Jiang, F.; Tang, Z.; Sun, X.; Yu, J.; Li, V.C.; Yu, K. New opportunity: Materials genome strategy for engineered cementitious composites (ECC) design. Cem. Concr. Compos. 2025, 159, 106009. [Google Scholar] [CrossRef]
- Singh, M.; Saini, B.; Chalak, H.D. Performance and composition analysis of engineered cementitious composite (ECC)–A review. J. Build. Eng. 2019, 26, 100851. [Google Scholar] [CrossRef]
- Yuan, F.; Pan, J.; Leung, C.K.Y. Flexural behaviors of ECC and concrete/ECC composite beams reinforced with basalt fiber-reinforced polymer. J. Compos. Constr. 2013, 17, 591–602. [Google Scholar] [CrossRef]
- Ding, Y.; Yu, K.Q.; Yu, J.; Xu, S. Structural behaviors of ultra-high performance engineered cementitious composites (UHP-ECC) beams subjected to bending-experimental study. Constr. Build. Mater. 2018, 177, 102–115. [Google Scholar] [CrossRef]
- Sheng, J.; Yin, S.; Yue, J.; Yang, Y. Bending performance of ECC-RC composite beam reinforced with textile. Constr. Build. Mater. 2021, 287, 123079. [Google Scholar] [CrossRef]
- El-Helou, R.G.; Graybeal, B.A. Flexural behavior and design of ultrahigh-performance concrete beams. J. Struct. Eng. 2022, 148, 04022013. [Google Scholar] [CrossRef]
- Qin, F.; Han, Y.; Wei, X.; Wang, X.; Zhang, Z.; Zhang, X. Flexural behavior of engineered cementitious composites (ECC) slabs with different strength grades. Materials 2025, 18, 2047. [Google Scholar] [CrossRef]
- Tian, J.; Wu, X.; Tan, X.; Wang, W.W.; Hu, S.; Du, Y.; Yuan, J.; Huang, W.; Huang, X. Experimental study and analysis model of flexural synergistic effect of reinforced concrete beams strengthened with ECC. Constr. Build. Mater. 2022, 352, 128987. [Google Scholar] [CrossRef]
- Lu, C.; Pan, J.; Luo, B.; Li, Z.; Leung, C.K.Y. Correlation of flaw structure and cracking behavior in SHCC with X-ray CT scanning technique. Constr. Build. Mater. 2022, 331, 127296. [Google Scholar] [CrossRef]
- Men, P.; Wang, X.; Liu, D.; Zhang, Z.; Zhang, Q.; Lu, Y. On use of polyvinylpyrrolidone to modify polyethylene fibers for improving tensile properties of high strength ECC. Constr. Build. Mater. 2024, 417, 135354. [Google Scholar] [CrossRef]
- Xu, L.Y.; Huang, B.T.; Li, V.C.; Dai, J.G. High-strength high-ductility Engineered/Strain-Hardening Cementitious Composites (ECC/SHCC) incorporating geopolymer fine aggregates. Cem. Concr. Compos. 2022, 125, 104296. [Google Scholar] [CrossRef]
- Huang, B.T.; Zhu, J.X.; Weng, K.F.; Li, V.C.; Dai, J.G. Ultra-high-strength engineered/strain-hardening cementitious composites (ECC/SHCC): Material design and effect of fiber hybridization. Cem. Concr. Compos. 2022, 129, 104464. [Google Scholar] [CrossRef]
- Wu, J.D.; Guo, L.P.; Cao, Y.Z.; Lyu, B.C. Mechanical and fiber/matrix interfacial behavior of ultra-high-strength and high-ductility cementitious composites incorporating waste glass powder. Cem. Concr. Compos. 2022, 26, 104371. [Google Scholar] [CrossRef]
- Dong, S.; Zhou, D.; Ashour, A.; Han, B.; Ou, J. Flexural toughness and calculation model of superfine stainless wire reinforced reactive powder concrete. Cem. Concr. Compos. 2019, 104, 103367. [Google Scholar] [CrossRef]
- Das, C.S.; Dey, T.; Dandapat, R.; Mukharjee, B.B.; Kumar, J. Performance evaluation of polypropylene fiber reinforced recycled aggregate concrete. Constr. Build. Mater. 2018, 189, 649–659. [Google Scholar] [CrossRef]
- Ranade, R.; Li, V.C.; Stults, M.D.; Rushing, T.S.; Roth, J.; Heard, W.F. Micromechanics of high-strength, high-ductility concrete. ACI Mater. J. 2013, 110, 375–384. [Google Scholar]
- Zhang, Y.; Zhang, S.; Deng, M. Four-point bending tests of ECC: Mechanical response and toughness evaluation. Case Stud. Constr. Mater. 2022, 17, e01573. [Google Scholar] [CrossRef]
- Wang, D.; Che, J.; Liu, H.; Chin, S.C. Enhanced ductility and toughness of desert sand engineered cementitious composites. Buildings 2023, 13, 1538. [Google Scholar] [CrossRef]
- Zhu, M.; Chen, B.; Wu, M.; Han, J. Effects of different mixing ratio parameters on mechanical properties of cost-effective green engineered cementitious composites (ECC). Constr. Build. Mater. 2022, 328, 127093. [Google Scholar] [CrossRef]
- ASTM C 1018; Standard Test Method for Flexural Toughness and First-Crack Strength of Fiber Reinforced Concrete (Using Beam with Third Point Loading). ASTM Internation: West Conshohocken, PA, USA, 1997; pp. 544–551.
- JSCE-SF4; Method of Test for Flexural Strength and Flexural Toughness of Fiber Reinforced Concrete. Japan Concrete Institute: Tokyo, Japan, 1984; pp. 45–51.
- CECS 13:2009; Standard Test Methods for Fiber Reinforced Concrete. China Planning Press: Beijing, China, 2010.
- Alexander, M.G.; Magee, B.J. Durability performance of concrete containing condensed silica fume. Cem. Concr. Res. 1999, 29, 917–922. [Google Scholar] [CrossRef]
- Martinola, G.; Baeuml, M.F.; Wittmann, F.H. Modified ECC by means of internal impregnation. J. Adv. Concr. Technol. 2004, 12, 207–212. [Google Scholar] [CrossRef][Green Version]
- Yun, K.K.; Choi, S.Y.; Yeon, J.H. Effects of admixtures on the rheological properties of high performance wet-mix shotcrete mixtures. Constr. Build. Mater. 2015, 78, 194–202. [Google Scholar] [CrossRef]
- Zhang, P.; Li, Q.; Zhang, H. Combined effect of polypropylene fiber and silica fume on mechanical properties of concrete composite containing fly ash. J. Reinf. Plast. Compos. 2011, 30, 1349–1358. [Google Scholar] [CrossRef]
- Chen, C.; Habert, G.; Bouzidi, Y.; Jullien, A. Environmental impact of cement production: Detail of the different processes and cement plant variability evaluation. J. Clean. Prod. 2010, 18, 478–485. [Google Scholar] [CrossRef]
- Scrivener, K.; John, V.; Gartner, E. Eco-efficient cements: Potential economically viable solutions for a low-CO2 cement-based materials industry. Cem. Concr. Res. 2018, 114, 2–26. [Google Scholar] [CrossRef]
- Liu, L.; Xiao, J.; Wu, Z. The effect of fiber content on the static and dynamic performance of PE-ECC. Case Stud. Constr. Mater. 2024, 20, e03041. [Google Scholar] [CrossRef]
- Lin, J.; Song, Y.; Xie, Z.; Guo, Y.; Yuan, B.; Zeng, J.; Wei, X. Static and dynamic mechanical behavior of engineered cementitious composites with PP and PVA fibers. J. Build Eng. 2020, 29, 101097. [Google Scholar] [CrossRef]
- Ehrenbring, H.; Pacheco, F.; Christ, R.; Tutikian, B.F. Bending behavior of engineered cementitious composites (ECC) with different recycled and virgin polymer fibers. Constr. Build. Mater. 2022, 346, 128355. [Google Scholar] [CrossRef]
- Said, S.H.; Razak, H.A.; Othman, I. Flexural behavior of engineered cementitious composite (ECC) slabs with polyvinyl alcohol fibers. Constr. Build. Mater. 2015, 75, 176–188. [Google Scholar] [CrossRef]
- JC/T 2461-2018; Standard Test Method for the Mechanical Properties of Ductile Fiber Reinforced Cementitious Composites. China Building Materials Press: Beijing, China, 2018.
- Zhu, J.X.; Xu, L.Y.; Huang, B.T.; Weng, K.F.; Dai, J.G. Recent developments in engineered/strain-hardening cementitious composites (ECC/SHCC) with high and ultra-high strength. Constr. Build. Mater. 2022, 342, 127956. [Google Scholar] [CrossRef]
- Yang, E.H.; Yang, Y.; Li, V.C. Use of high volumes of fly ash to improve ECC mechanical properties and material greenness. ACI Mater. J. 2007, 104, 303–311. [Google Scholar] [CrossRef]
- He, S.; Wang, X.; Bai, H.; Xu, Z.; Ma, D. Effect of fiber dispersion, content and aspect ratio on tensile strength of PP fiber reinforced soil. J. Mater. Res. Technol. 2021, 15, 1613–1621. [Google Scholar] [CrossRef]
- Zhang, D.; Yu, J.; Wu, H.; Jaworska, B.; Ellis, B.; Li, V. Discontinuous micro-fibers as intrinsic reinforcement for ductile Engineered Cementitious Composites (ECC). Compos. Part B-Eng. 2020, 184, 107741. [Google Scholar] [CrossRef]
- JGJ/T 281-2012; Technical Specification for High-Strength Concrete Structures. China Architecture & Building Press: Beijing, China, 2012.
- Li, V.C.; Leung, C.K.Y. Steady-state and multiple cracking of short random fiber composites. J. Eng. Mech. 1992, 118, 2246–2264. [Google Scholar] [CrossRef]
- Yang, D.; Luo, Q.; Chen, R.; Li, Q.; Zhu, G.; Zhang, Y. Pullout behavior of polyethylene fiber from cement matrix: Effect of embedment length, matrix strength, and inclination angle. J. Build. Eng. 2024, 95, 110360. [Google Scholar] [CrossRef]
- Wu, J.; Guo, L.; Wang, L.; Fei, X.; Chen, M.; Yue, H.; Xu, R. Micromechanical design based on microscale fiber/matrix interactions for single PE fiber pullout. Constr. Build. Mater. 2024, 416, 135117. [Google Scholar] [CrossRef]
- Abbas, Y.; Iqbal, K. Fiber-matrix interactions in fiber-reinforced concrete: A review. Arab. J. Sci. Eng. 2016, 41, 1183–1198. [Google Scholar] [CrossRef]
- Singh, S.; Shukla, A.; Brown, R. Pullout behavior of polypropylene fibers from cementitious matrix. Cem. Concr. Res. 2004, 34, 1919–1925. [Google Scholar] [CrossRef]
- Deng, F.; Cao, C.; Xu, L.; Chi, Y. Interfacial bond characteristics of polypropylene fiber in steel/polypropylene blended fiber reinforced cementitious composite. Constr. Build. Mater. 2022, 341, 127897. [Google Scholar] [CrossRef]
- Haber, Z.B.; Varga, I.D.L.; Graybeal, B.A.; Nakashoji, B. FHWAHRT-18-036 Properties and Behavior of UHPC-Class Materials; Federal Highway Administration: Washington, DC, USA, 2018. [Google Scholar]
- Şimşek, B.; Uygunoğlu, T. Multi-response optimization of polymer blended concrete: A TOPSIS based Taguchi application. Constr. Build. Mater. 2016, 117, 251–262. [Google Scholar] [CrossRef]
Disclaimer/Publisher’s Note: The statements, opinions and data contained in all publications are solely those of the individual author(s) and contributor(s) and not of MDPI and/or the editor(s). MDPI and/or the editor(s) disclaim responsibility for any injury to people or property resulting from any ideas, methods, instructions or products referred to in the content. |
© 2025 by the authors. Licensee MDPI, Basel, Switzerland. This article is an open access article distributed under the terms and conditions of the Creative Commons Attribution (CC BY) license (https://creativecommons.org/licenses/by/4.0/).