Abstract
The study investigates the potential of using Vietnam fly ash (FA) as a substitute for traditional Portland cement to reduce both the volume of landfilled waste and the carbon footprint of concrete mixtures, while maintaining adequate mechanical performance of the produced elements. Additionally, the incorporation of construction and demolition waste, recycled brick aggregate (BR), as a partial aggregate substitute was investigated to enhance the sustainability and resource efficiency of composite formulations. Five mixes, including a reference, were produced by casting and three-dimensional concrete printing (3DCP). Printability (flow table), water absorption (gravimetry and infrared thermography), and flexural/compressive behavior were assessed; printed specimens were tested parallel and perpendicular to the layer plane. Recycled additions reduced flow by 15–22%, yet all mixes remained printable. Printed specimens showed higher capillary uptake than cast ones. In flexure, modified mixtures composition exhibited 50% lower peak stress than the reference. Cast elements outperformed printed ones: the printed reference was 33% weaker than its cast counterpart, and other mixes were 10–15% lower. In compression, printed specimens loaded perpendicular to layers reached 6–7 MPa (35% below cast), whereas parallel loading yielded up to 3.5 MPa with larger scatter. The findings confirm the feasibility of utilizing secondary raw materials in 3DCP formulations to support resource efficiency and carbon footprint reduction in the construction industry.
1. Introduction
In light of accelerating climate change and the growing imperative for sustainable development, the construction sector, particularly the cement industry, plays a pivotal role in the ongoing transition toward more energy- and resource-efficient systems. Cement, a fundamental component of concrete, is essential to the development of modern infrastructure; however, it also poses considerable environmental challenges, chiefly due to its significant greenhouse gas (GHG) emissions. In contrast to many industrial processes, approximately 60% of carbon dioxide (CO2) emissions from cement production originate from the calcination of limestone (CaCO3), which thermally de-composes into calcium oxide (CaO), releasing CO2 as a byproduct [1]. The remaining 34% primarily results from the combustion of fossil fuels required to achieve the high processing temperatures [2], with 6% stemming from electricity consumption [3]. Given this emissions profile, effective mitigation strategies must go beyond improvements in energy efficiency. A fundamental re-evaluation of the composition of clinker raw materials is necessary. In the European Union, for example, 2011 data indicate that clinker production reached 140 million tonnes, while cement output totaled 191 million tonnes. This resulted in CO2 emissions totaling 122 million tonnes, of which 7.66 million tonnes were attributed to the use of alternative fuels, accounting for 25.6% of thermal energy demand. Additionally, 2.15 million tonnes originated from biomass combustion, representing 8.7% of the thermal input [4].
To address rising environmental and regulatory pressures, the cement industry is increasingly adopting strategies for substituting traditional raw materials, primarily limestone, with alternative secondary materials derived from industrial and post-consumer waste streams. These include fly ash, metallurgical slags, dewatered sewage sludge, recycled fine aggregates from crushed concrete, and selected fractions of construction and demolition waste (CDW) [5,6,7]. One of the key advantages of such materials is their often pre-decarbonated nature, which facilitates a significant reduction in process-related CO2 emissions and contributes to the decarbonization of the cement value chain.
Contemporary efforts in the construction sector focus on sustainability through CO2 emission reduction and natural aggregate conservation, partly achieved by recycling construction and industrial waste. Concrete debris from building demolitions constitutes a substantial portion of CDW. Industrial by-products such as fly ash and ground granulated blast furnace slag (GGBFS) are commonly employed as cement substitutes or supplementary cementitious materials. Globally, approximately 900 million tonnes of fly ash and 300 million tonnes of slag are produced annually, with around 60% of this output concentrated in China and India [8,9,10]. Incorporating such materials into cementitious mixtures enables the production of composites with tailored mechanical properties suitable for structural applications [11], while significantly reducing the environmental footprint of the construction industry, one of the most emission-intensive sectors [12,13].
The partial replacement of Portland cement with fly ash reduces the clinker content in concrete, thereby lowering energy consumption and CO2 emissions. Fly ash is particularly attractive due to its widespread availability, pozzolanic reactivity, and low processing costs. In standard mixes, fly ash typically replaces 5–25% of ordinary Portland cement (OPC) by mass; however, in specialized formulations, such as low-heat or mass concrete, replacement levels of up to 80% have been successfully implemented [14,15,16,17,18,19,20].
The chemical and physical properties of fly ash exhibit regional variability due to differences in coal sources and combustion technologies. Finer fly ash particles demonstrate enhanced pozzolanic activity, as they react more efficiently with calcium hydroxide (CH) to form calcium silicate hydrate (C–S–H), thus densifying the cement matrix and extending the service life of concrete [21,22]. Reactivity is further influenced by the mineralogical composition—particularly the content of amorphous aluminosilicates, quartz, and mullite, as well as particle size distribution, specific surface area, and glass content [23]. Recent studies have increasingly focused on developing cementitious formulations optimized for three-dimensional concrete printing (3DCP), incorporating industrial by-products and CDW. Common constituents include fly ash (FA), silica fume (SF), GGBFS, and recycled aggregates such as recycled concrete aggregate (RCA) and ground brick waste (GBW). To meet the stringent rheological and mechanical requirements of extrusion-based additive manufacturing, mixtures are supplemented with chemical admixtures, including polycarboxylate ether (PCE)-based high-range water-reducing agents, viscosity-modifying agents such as hydroxypropyl methylcellulose (HPMC), and reinforcing elements like polypropylene (PP) fibers. These additives collectively contribute to achieving the necessary thixotropy, buildability, and interlayer adhesion for successful 3D printing [19,24,25,26,27].
A comprehensive review of the current literature indicates that while various studies have addressed the incorporation of industrial and construction-derived by-products into cementitious systems for additive manufacturing, considerable research gaps remain—particularly concerning the systematic utilization of recycled materials in three-dimensional concrete printing (3DCP). Specifically, the field lacks a standardized, multi-material framework that quantitatively links the chemistry and particle-size characteristics of recycled constituents to time-dependent rheology (buildability, thixotropy, interlayer adhesion) and to anisotropic mechanical performance under printing-relevant curing conditions. Moreover, cross-comparative, protocol-driven studies spanning multiple waste streams and directly contrasting printed versus cast specimens are scarce, which impedes reproducible material selection, durability benchmarking, and transparent life-cycle/CO2 assessments for 3DCP mixtures. The central challenges relate to optimizing fresh-state properties and ensuring structural integrity during and after the printing process. For instance, Guo et al. developed a 3D printable mixture in which fly ash (FA) and quartz sand served as the primary constituents, with ground granulated blast furnace slag (GGBFS) and silica fume (SF) functioning as reactive binders [28]. Dey et al. demonstrated that the incorporation of FA significantly enhanced the rheological performance of the mixture. Specifically, a formulation containing 15% FA exhibited a 330% increase in yield stress relative to the control mix, thereby enabling stable extrusion and retention of geometric fidelity post-deposition [29]. Taqa et al. further reported that the integration of fly ash nanoparticles (N-FA) led to a marked improvement in the mechanical strength parameters of 3D printable cementitious composites [30]. In alignment with circular economy principles, current research is increasingly oriented toward integrating CDW—such as recycled fine aggregate (RFA), GBW, RCA, and recycled clay brick waste (RCBW)—into 3DCP formulations [31]. After suitable processing (e.g., crushing, grading, surface treatment), these materials can serve as partial or full substitutes for natural aggregates without impairing mechanical or rheological performance [32]. GBW, in particular, offers pozzolanic and filler properties that improve strength development and durability, while mitigating landfill demand. Ivanova and Mechtcherine reported that particle size distribution, surface area, and grain morphology significantly influence key rheological parameters such as yield stress, extrudability, and interlayer stability, critical for successful layer-by-layer deposition in 3DCP [33,34]. Further studies have shown that RCA inclusion in fresh mixtures results in time-dependent rheological improvements: yield stress increases exponentially, and shear modulus increases linearly within the first 15 min of mixing. Buildability (the ability of a mixture to maintain geometric stability during multi-layer printing) also improves with increasing RCA content [35,36]. However, balancing the setting time remains a challenge in 3DCP. Concrete must rapidly gain static yield strength post-extrusion to retain its shape, yet remain fluid enough for effective pumping. Accelerators and thermal curing methods may assist in controlling setting time but can complicate the printing process and compromise long-term mechanical performance [37,38]. Despite various limitations and the need to optimize the process, concrete 3D printing offers multiple advantages over traditional construction methods, including faster production times, cost efficiency, and the ability to fabricate geometrically complex structures that would be difficult or impossible to achieve using conventional techniques [39]. The development of a fully functional, sustainable cementitious system for 3DCP that simultaneously incorporates both industrial by-products and CDW remains an open challenge. Such a system must satisfy complex rheological and mechanical criteria while conforming to the “green concrete” paradigm.
This study aims to evaluate the physicochemical and performance characteristics of locally sourced waste materials, assessing their suitability for 3DCP. Special emphasis is placed on their potential to reduce CO2 emissions associated with cement production and aggregate extraction, thereby supporting the decarbonization of the construction sector. Moreover, the innovative aspect of this study lies in the evaluation of diverse recycled materials, fly ash of varying origins, and demolition-derived brick waste (BR), selected for the extrusion-based 3D concrete printing technology. Most previous research works focus on a single type or waste fraction. Our evaluation of diverse recycled waste streams and lightweight fillers demonstrates how differences in chemical composition and particle-size distribution directly influence the printability and mechanical outcomes, thereby providing practical selection criteria for secondary raw materials. Furthermore, a novel methodological contribution is the combined use of gravimetric water absorption measurements and infrared thermography, enabling both quantitative and visual assessment of moisture transport in printed versus cast specimens. The orientation-dependent compressive strength analysis highlights the critical role of interlayer anisotropy in waste-based 3DCP materials. These findings establish new insights into composition-process-property relationships that are essential for advancing circular-material strategies in additive manufacturing for construction.
2. Materials and Methods
In order to mitigate the environmental impact of the construction sector through the integration of waste-derived materials into three-dimensional concrete printing (3DCP), it is crucial to evaluate mixture parameters that influence print quality and material performance. In addition to intrinsic material characteristics, other key factors include the design and configuration of the printing system components, such as a custom-developed mixing station conceptualized within the framework of the “Implementation Doctorate” program and validated under industrial conditions in collaboration with partner companies, as well as specific processing parameters.
The experimental program was designed to assess the feasibility of using recycled materials as partial or full substitutes for conventional aggregates and binders in cementitious mixtures. Test specimens were fabricated using both 3D concrete printing (3DCP) and traditional casting methods in accordance with the EN 196-1 standard [40], allowing for a comparative analysis of the impact of fabrication technique on the final mechanical and physical properties of the produced elements.
All samples were prepared in a laboratory setting equipped with specialized infra-structure for testing 3D concrete printing technologies.
The experimental study was conducted on five mixtures containing different types of recycled additives. A control mixture was formulated using conventional raw materials and served as the baseline for comparison. The detailed composition of this reference mix is presented in Table 1.

Table 1.
Composition of the reference mixture used in 3D-printing tests.
Beyond achieving the required target strength, each mixture should also be designed to fulfill key performance criteria in the fresh state to ensure suitability for extrusion-based printing. These criteria include adequate pumpability and extrudability, sufficient green strength to support successive layers without deformation, and strong interlayer bonding.
To meet these requirements, the tested mixtures were enhanced with chemical admixtures, including setting accelerators (based on calcium nitrate) and high-range water-reducing agents (superplasticizers; PCE type), as well as rheology modifiers. Functional fillers such as ground limestone (particle size 0–0.2 mm; 93% CaCO3) and microsilica (particle size 0.1–0.2 µm; 94% SiO2) were introduced to modify the cement matrix structure, both by enhancing cohesion and increasing the specific surface area, which contributes to improved control over the setting and hardening processes.
The reference mixture described above was modified by replacing conventional aggregate with recycled brick derived from construction and demolition waste. In parallel, efforts to reduce the cement content focused on the partial substitution of ordinary Portland cement with fly ash, an industrial by-product, thereby supporting the principles of resource efficiency and emission reduction.
Based on existing literature concerning the use of fly ash in additive manufacturing and 3D concrete printing technologies, the replacement level was established at 15% by mass of the binder component [28,29,30,41,42]. This level of substitution was intended to preserve the high mechanical properties of the reference mix while simultaneously lowering its carbon footprint. Guided by LCA evidence, a 15% by-mass replacement of OPC with fly ash was selected to balance early-age performance with carbon mitigation. Using European EPD factors for CEM I and EN 15804+A2—compliant fly ash [43], this level of substitution yields an estimated 14–15% cradle-to-gate (A1–A3) reduction in the concrete’s embodied carbon (46–58 kg CO2 e/m3 for typical printable binder contents of 400–500 kg/m3), consistent with published reductions reported for 20% FA (18.7–19.4%) and scaling trends at higher replacements [44,45,46,47,48].
To broaden the scope of the investigation and capture the variability of industrial by-products, multiple types of fly ash were sourced from different power generation facilities located in Vietnam. Each variant was characterized prior to use to evaluate its compatibility with the 3D printing process and its influence on the composite’s performance.
The detailed proportions of components used in the modified mixtures were presented in Table 2.
Table 2.
Mixture composition of tested samples incorporating recycled brick waste and fly ash as partial cement replacement.
The material was prepared from dry constituents, with mixing carried out immediately prior to testing. Water was added to the pre-formulated dry blend at a weight-to-weight (w/w) ratio of 1:5. The mixing process was conducted using a specialized mixing station developed as part of the Implementation Doctorate program, designed specifically for compatibility with 3D concrete printing applications. The resulting fresh mixture was utilized within 20 min of preparation to ensure consistency in rheological and mechanical performance during testing.
The chemical composition of the fly ash was analyzed using a Bruker S2 PUMA energy-dispersive X-ray fluorescence (ED-XRF) spectrometer (Bruker, MA, USA). Approximately 10 g of each sample was placed in a 34 mm diameter sample holder fitted with a 4 μm polypropylene foil. High-purity helium (grade 5.0) was employed as a shielding gas during the measurements to enhance detection sensitivity, particularly for light elements.
To characterize the particle size distribution of the fly ash samples, measurements were performed using an Anton Paar 1190D laser diffraction particle size analyzer (Anton Paar GmbH, Graz, Austria). The analysis was carried out using the wet dispersion method, with deionized water as the dispersing medium. An integrated ultrasonic system was activated throughout the measurement process to prevent particle agglomeration and ensure a stable, homogeneous suspension. The particle size distribution was measured over a range of 0.5 to 3500 μm. All measurements were conducted in triplicate to ensure repeatability and data reliability. Data acquisition and analysis were performed using Kalliope software version 2.22.1 provided by the instrument manufacturer.
Test mixtures were prepared using a laboratory 3D concrete printer and a precision laboratory scale (accuracy: 0.1 g; maximum capacity: 20 kg). Initially, the dry components were accurately weighed and homogeneously blended. Water was subsequently introduced at a weight-to-weight ratio of 1:5, and the mixtures were processed using a laboratory mixer set to standardized parameters: a mixing time of 5 min and a rotation speed of 120 rpm. Prior to the printing process, each fresh mixture was subjected to consistency testing to ensure its suitability for extrusion. Flow table tests were conducted in accordance with EN 1015-3 [49]. Maintaining optimal consistency is critical not only for uninterrupted material flow during extrusion but also for ensuring geometric stability and layer adhesion of the printed elements [50,51,52]. The 3D printing system employed in this study features a screw-type extruder, designed for use with mixtures exhibiting flow values in the range of 120–200 mm (per EN 1015-3), which is considered optimal for this type of printing application.
In this study, sample elements were produced using a laboratory-scale 3D concrete printer equipped with a custom-designed extrusion head (Figure 1). This print head was developed within the framework of the Implementation Doctorate program, with the aim of optimizing extrusion parameters for cementitious materials containing recycled components. The printing process was performed at a linear deposition speed of 50 mm/s. This printing speed resulted in an interlayer time interval of approximately 1 min. Such a brief interlayer interval limited the influence of interlayer time on bond quality, which in turn affects the final mechanical properties of the prints.
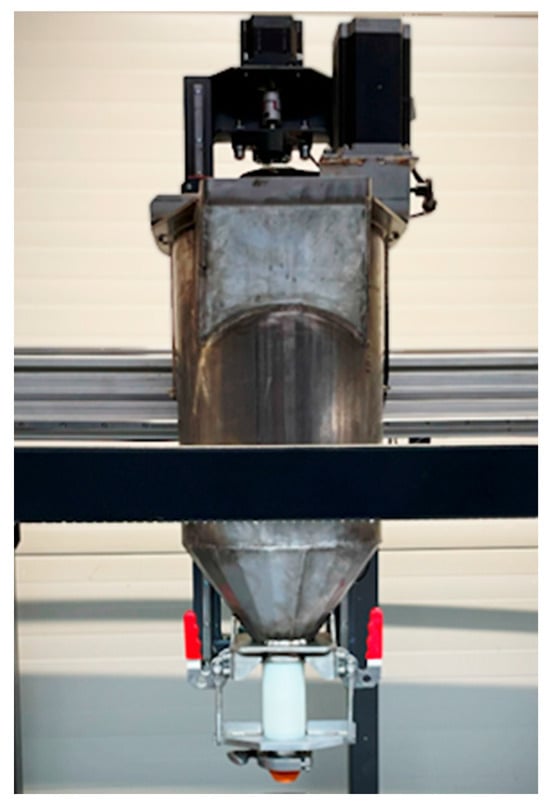
Figure 1.
View of the custom-designed print head of the laboratory 3D concrete printer used in this study.
A 20 mm-diameter nozzle was mounted on the print head. Extruding two parallel paths yielded a printed element with a total width of 40 mm. The layer height was set to 8 mm, and five layers were deposited to obtain final sample elements with a total height of 40 mm. The selected layer height was dictated by process constraints, including limitations imposed by nozzle geometry and material rheology. As demonstrated in previous studies, the maximum printable layer thickness is influenced by a range of parameters, such as extrusion speed, material viscosity, and nozzle design [37]. During specimen printing, the ambient temperature was approximately 22 °C with a relative humidity of 42%.
Following the printing process, all samples were left to cure under controlled laboratory conditions (average temperature 22.5 ± 2 °C; average relative humidity 45 ± 5%) for a period of 28 days to ensure sufficient hydration and strength development. After the curing phase, the specimens underwent final trimming and preparation for mechanical testing.
Figure 2 illustrates a representative view of the 3D printing process of the samples. Each printed element had an initial length of 500 mm and a cross-sectional dimension of approximately 40 × 40 mm, which ensured dimensional consistency and facilitated subsequent testing procedures.
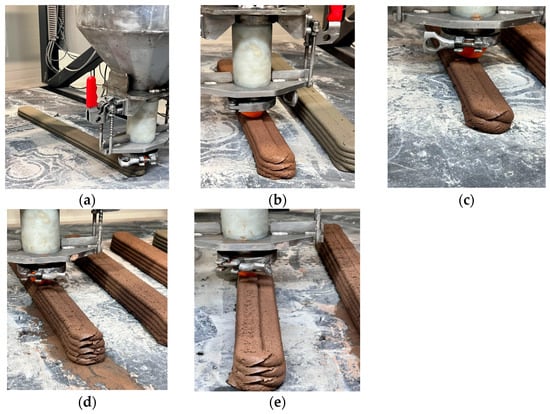
Figure 2.
Representative view of the 3D printing process of: (a) S1-P, (b) S2-P, (c) S3-P, (d) S4-P, (e) S5-P.
Upon completion of curing, the printed specimens were cut into standardized segments of 160 mm in length, as depicted in Figure 3. This segmentation enabled uniformity in testing and comparability across all samples.
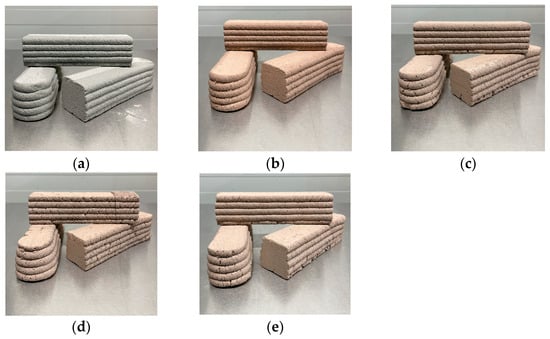
Figure 3.
Representative view of prepared for testing 3D printed samples: (a) S1-P, (b) S2-P, (c) S3-P, (d) S4-P, (e) S5-P.
The water absorption test was conducted using a specially prepared water tank equipped with a plastic separator at its base to enable unobstructed water flow beneath the samples. The tank was continuously replenished to maintain a consistent water level of 3 mm above the supporting platform, ensuring sustained yet minimal contact between the specimens and water, thereby facilitating controlled absorption conditions.
Additively manufactured and cast specimens were positioned vertically, with a 40 × 40 mm2 surface area in direct contact with the water interface.
Mass variation for each sample was recorded at 15 min intervals to quantify the amount of water absorbed over time. Concurrently, the propagation dynamics of moisture within the samples were monitored using a FLIR E96 thermal imaging camera, capturing thermal images at 5 min intervals to visualize the wetting front.
The water absorption coefficient was determined using Equation (1):
where
A—capillary water absorption coefficient, (kg/(m2h1/2));
—sample mass increase, (kg);
F—suction surface, (m2);
—time square root increase, (h1/2).
To assess the influence of the 3D printing process on the mechanical performance of the hardened material, each material variant was also cast using a conventional three-part mold. For each mixture, three cast specimens were produced to serve as a reference for comparison with their 3D-printed counterparts.
The specimens were demolded after three days and subsequently subjected to standard curing for 28 days under controlled conditions. All cast samples were fabricated with uniform dimensions of 160 × 40 × 40 mm, consistent with the cut segments obtained from the 3D-printed elements, thereby ensuring comparability during mechanical testing.
Three-point bending tests were performed according to ISO EN 196-1 using an MTS Criterion 43 (Eden Prairie, MI, USA) controlled by MTS TestSuite 1.0 software (Figure 4). The crosshead speed was maintained at 50 N/s to determine the strength of both the casted and printed samples (Figure 5).
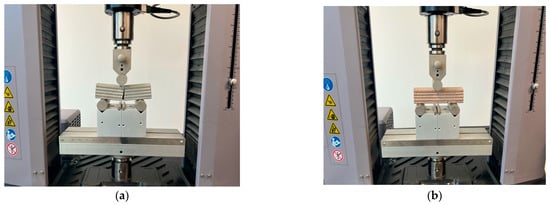
Figure 4.
Representative view of samples during three-point bending strength tests: (a) S1-P sample, (b) S3-P sample.
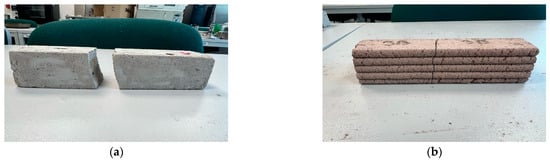
Figure 5.
Representative view of the fracture of the sample after the flexural strength test of: (a) S1-C sample, (b) S3-P sample.
The following formula was used to calculate the flexural strength:
where
—maximum bending stress, );
—maximum bending moment, (Nm);
—section modulus for bending, (m3)
—maximum failure load,
—span between supports, (m);
—width of the cross-section, (m);
—height of the cross-section, (m).
Compressive strength tests were conducted using a MTS Criterion 43 universal testing machine, applying a constant loading rate of 50 N/s until specimen failure. Cubic samples with dimensions of 40 × 40 × 40 mm were used in all test series. The tests covered all material composition variants and were performed on specimens produced using two fabrication methods: conventional casting and 3D printing. For the printed specimens, two orientations relative to the printing direction were considered—perpendicular and parallel to the direction of layer deposition (Figure 6).
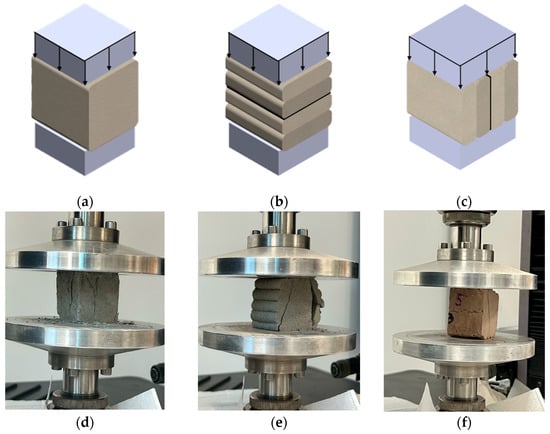
Figure 6.
The scheme of compressive strength test for: (a) cast specimens; (b) 3D-printed specimens with loading applied parallel to the direction of layer deposition; and (c) 3D-printed specimens with loading applied perpendicular to the layer orientation. Representative photographs captured during the tests, corresponding to each configuration, were shown in (d–f), respectively.
3. Results and Discussion
Table 3 presents the results of the elemental composition analysis of fly ashes utilized as an additive in formulations designed for 3D printing.
Table 3.
Elemental composition of fly ashes used as an additive in 3D printing mixtures.
The obtained results indicate that silicon, aluminum, and iron were the predominant components in all samples, with Si exhibiting the highest concentration, particularly in Fly Ash 3 (68.5%). Notable variations were observed in potassium (K) content, which was significantly higher in Fly Ash 1 (10.14%) compared to Fly Ash 3 (1.89%). The magnesium (Mg), calcium (Ca), titanium (Ti), and iron (Fe) contents also varied across the samples, indicating differences in the source material or combustion processes. Fly Ash 1 and 2 exhibit a similar elemental composition.
High contents of silicon (Si) and aluminum (Al) are beneficial for both the flowability and the mechanical strength development of cementitious mixtures, primarily due to their pozzolanic reactivity.
On the other hand, a significant concentration of potassium (K), classified as an alkali, may influence the setting time, alter the pH, and reduce interlayer adhesion. Furthermore, high alkali content can promote alkali–silica reaction (ASR), although this risk remains limited under low moisture conditions and at moderate alkali levels. A low calcium (Ca) content is generally favorable, as it avoids excessive cementation. However, higher Ca levels would typically accelerate the setting process, potentially increasing the yield stress and negatively affecting extrudability. In this context, the moderate Ca content, as observed in the tested fly ash samples ranging from 1.65% to 2.28%, yields a neutral to slightly beneficial effect on rheological behavior. Magnesium (Mg), present in small amounts, may slightly prolong the hydration process. However, due to its limited concentration, it is unlikely to have a significant impact on the overall print quality.
As widely reported in the literature, the inclusion of fly ash typically reduces the yield stress of cementitious mixtures, especially within the 8–12% replacement range, thereby improving flowability and mixture stability [53].
Based on the chemical composition of the three fly ash samples, Fly Ash 3 appears to be the most suitable additive for 3D printable concrete mixtures. Its high Si content and relatively low K/Ca ratio are expected to positively influence flowability, rheological performance, and mechanical strength of the printed elements.
Table 4 and Figure 7 present the particle size distribution of the tested additives. This parameter influences both the water demand of the mixture and the efficiency of the hydration process, which in turn affects the final mechanical properties of the material [54,55].
Table 4.
Particle size distribution of the three tested fly ashes and brick waste used as an additive to concrete mixtures.
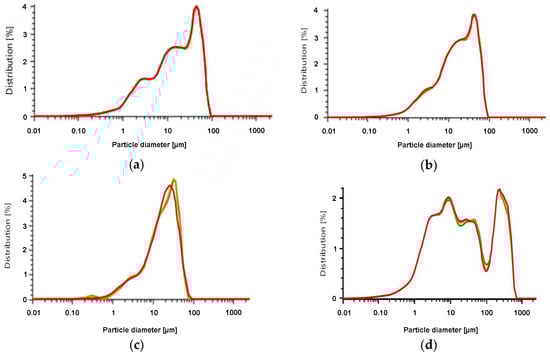
Figure 7.
Particle size distribution curve of: (a) Fly Ash 1; (b) Fly Ash 2; (c) Fly Ash 3, (d) Brick waste.
The data in Table 4 and Figure 7 illustrate the particle size distributions, showing that for each FA variant, the 90th-percentile particle size (D90) is ~52 µm, whereas for the brick waste it is ~274 µm. The most commonly occurring particle size in the tested fly ash samples ranges between 20 and 25 µm. Among the analyzed materials, FA 3 exhibits the most concentrated grain size distribution. Nevertheless, all samples have particle sizes on the borderline between dust and fine aggregate, with the majority falling within the dust category (i.e., <63 µm) [56]. In the context of being a substitute for the standard binder—Portland cement—the analyzed fly ash shows a similar particle-size fraction, which, according to the literature, typically falls within 5–30 µm [57,58,59].
A representative view of the samples during the consistency test on the flow table is presented in Figure 8. The results of these tests are summarized Figure 9.
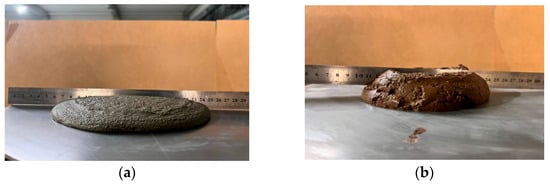
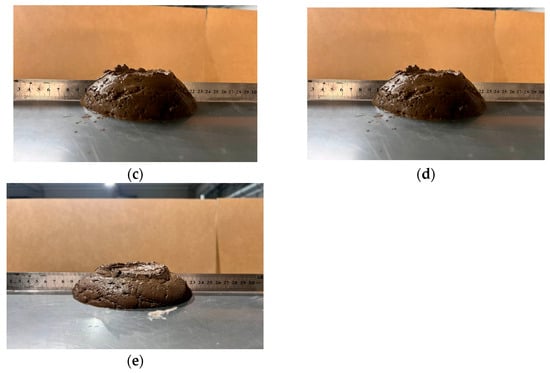
Figure 8.
A representative view of the material at the consistency test on the flow table test: (a) REF (S1-C and S1-P samples), (b) REF/BR (S2-C and S2-P samples), (c) REF/BR/FA1 (S3-C and S3-P samples), (d) REF/BR/FA2 (S4-C and S4-P samples), (e) REF/BR/FA3 (S5-C and S5-P samples).
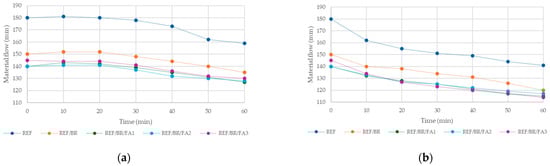
Figure 9.
Variation in material flow over time depending on continuous mixing: (a) material mixed between measurements; (b) material not mixed between measurements.
Based on the obtained results, the reference mixture without additives exhibited the highest flow value (180 mm), indicating low viscosity and high flowability. The incorporation of brick waste (BR) reduced the flow to 150 mm, which can be attributed to increased internal friction and water uptake resulting from the introduction of fine particles into the mixture [60,61,62].
A further decrease in flow was observed when fly ash (FA) was incorporated. The lowest values (140 mm) were recorded for samples containing FA1 and FA2, whereas FA3 slightly improved flowability to 145 mm. Previous studies have shown that replacing part of the cement with fly ash increases water demand and may reduce early-age strength, but improves long-term strength and durability [53].
A flow range of 140–150 mm is commonly considered optimal for extrusion-based 3D concrete printing, as it provides sufficient plasticity for the extrusion process while limiting excessive spread that could impair the dimensional accuracy and geometry of the printed layers. Mixtures with flow values within this range also promote better interlayer adhesion due to reduced bleeding and higher yield stress, thereby enhancing the structural integrity of the printed element. In this context, the reference mixture (REF) is too fluid, which may result in low stability of printed layers and their deformation or settlement during the deposition of subsequent filaments.
Figure 9 further shows that flow retention depends strongly on whether the material is kept in motion. With continuous mixing between measurements (Figure 9a), all compositions maintain a nearly constant flow for ~30 min after water addition, followed by a gradual decline; nonetheless, the values remain within a printable range, and the mixtures are suitable for extrusion for more than 60 min. Conversely, when the material is not mixed between measurements (Figure 9b), a rapid drop in flow is observed as early as ~10 min. Under such conditions, the open time of FA-bearing mixtures (REF/BR/FA1-FA3) is practically limited to ~30 min; beyond this point, the flow approaches ~120 mm, which can markedly reduce extrusion stability and, in extreme cases, lead to nozzle clogging.
Importantly, the post-extrusion loss of flowability is beneficial for buildability: once deposited, a higher structural viscosity/yield stress helps each filament retain its shape and resist the pressure of subsequent layers. In practical terms, this highlights the pumpability-buildability trade-off: it is advantageous to maintain mixing immediately prior to extrusion (in the test setup, mixing is performed in the printhead) to delay thixotropic structuration before extrusion, while relying on rapid stiffening after deposition to preserve the printed geometry.
Among the tested variants, Fly Ash 3—which caused the smallest reduction in flow and exhibited favorable time-dependent behavior—appears to be the most advantageous additive when the aim is a mixture offering a well-balanced compromise between rheological behavior and the mechanical durability of the printed structure. The results show that recycled additions can be incorporated without compromising extrusion-based printability or geometric stability during printing, thereby broadening the compositional spectrum of materials viable for 3D concrete printing (3DCP).
The innovative parallel approach of water absorption, gravimetric measurements, and thermographic imaging testing allows for the quantitative and visual capture of differences in moisture transport capacity between printed and cast samples, revealing the critical influence of interlayer interfaces. Figure 10a and Figure 10b present the changes in the capillary water absorption coefficient as a function of time and the specimen type, for cast and 3D-printed samples, respectively.
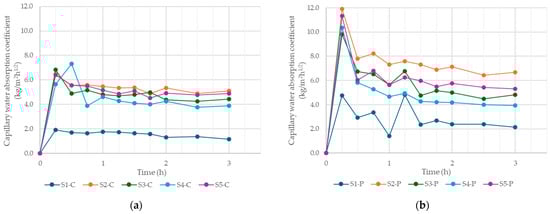
Figure 10.
The changes in the capillary water absorption coefficient of: (a) casted samples; (b) 3D concrete printing samples; as a function of time and the specimen composition.
Figure 10a presents a comparative analysis of water absorption rates for all five cast samples positioned vertically. Among them, sample S1-C exhibited the lowest capillary water absorption coefficient, measured at 1.93 kg/m2·h1/2. In contrast, the remaining samples demonstrated significantly higher absorption rates, ranging from 4 to 6 kg/m2·h1/2. A noticeable peak was observed in the early phase of absorption for sample S4-C; however, this anomaly is attributed to a measurement error, as evidenced by the subsequent abrupt decline and the lack of similar behavior in other trials.
Figure 10b illustrates the evolution of water absorption over time for vertically oriented 3D-printed samples. Sample S2-P displayed the highest initial water absorption coefficient, reaching 11.9 kg/m2·h1/2, before stabilizing within the range of 7–8 kg/m2·h1/2. Sample S1-P remained at a comparatively lower level of 4.76 kg/m2·h1/2; however, this value still represents an increase of over 100% relative to the cast counterpart (S1-C).
The averaged results from all test series are summarized in Figure 11, which corroborates the patterns identified in the time-dependent data. Samples S2-C/S2-P and S5-C/S5-P consistently exhibited the highest water uptake in both the cast and 3D-printed specimen series, whereas the reference sample (S1-C/S1-P) demonstrated the greatest resistance to water penetration.
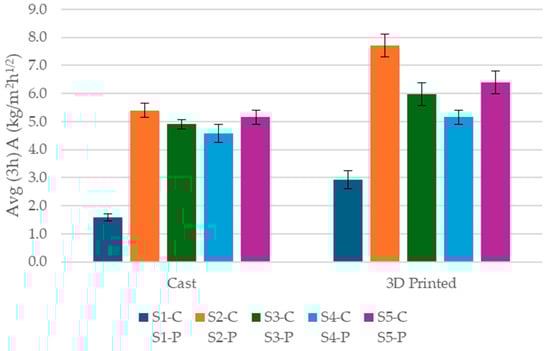
Figure 11.
Average capillary water absorption coefficient from 3h test.
Each test series exhibits a characteristic trend in the evolution of the capillary water absorption coefficient, with a distinct peak observed during the initial absorption phase, followed by a gradual decline over time. A comparative analysis between cast and 3D-printed specimens clearly indicates that the absorption rates of printed samples are substantially higher than those of their cast counterparts. This effect is independent of the composition of the tested mixture.
Figure 12 and Figure 13 present representative visible-light and infrared images of the evolution of moisture spread over time for samples produced by 3D printing and conventional casting.
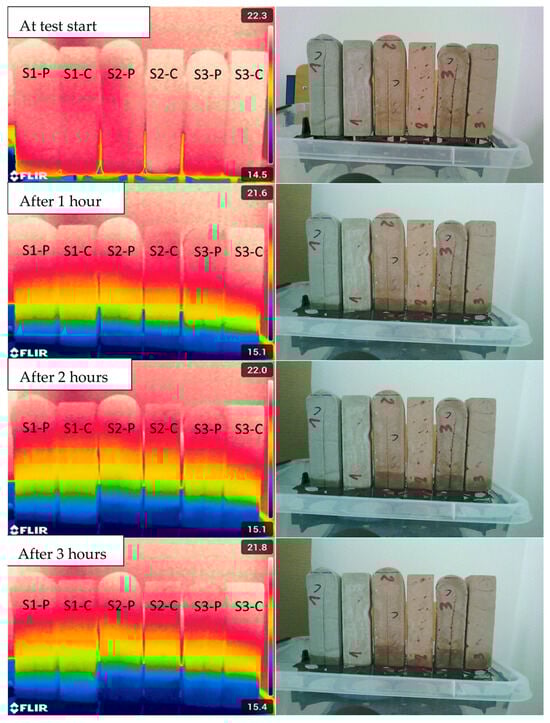
Figure 12.
Images of the evolution of moisture dispersion in samples numbered 1 to 3, recorded in both visible and infrared light, as a function of time and depending on the composition of the tested sample, produced both by 3D printing (marked on the sample with the symbol-P) and traditional casting (marked on the sample with the symbol-C).
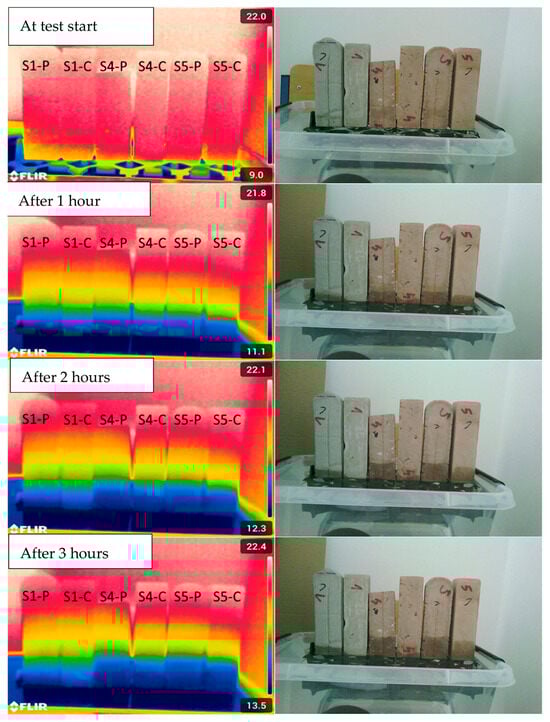
Figure 13.
Images of the evolution of moisture dispersion in samples numbered 1, 4 and 5, recorded in both visible and infrared light, as a function of time and depending on the composition of the tested sample, produced both by 3D printing (marked on the sample with the symbol-P) and traditional casting (marked on the sample with the symbol-C).
The analysis performed using infrared thermography corroborates the data obtained from gravimetric measurements conducted during the water absorption process. Consistently across all test series, the reference sample (S1-C/S1-P) exhibited the lowest absorption capacity. Among the group of samples S1-C/S1-P, S2-C/S2-P, and S3-C/S3-P presented in Figure 12, sample S2-C/S2-P, incorporating recycled brick aggregate without the addition of fly ash, demonstrated the highest level of water absorption. A similar trend is observed in Figure 13, where sample S5-C/S5-P shows the most pronounced absorption among the compared specimens. Across all comparative analyses, the differences in absorption behavior between printed and cast samples were clearly visible, aligning with the corresponding variations in mass recorded throughout the test period.
The results of the conducted study clearly indicate that samples fabricated using 3D printing exhibit significantly higher water absorption coefficients compared to their cast counterparts, regardless of the composition of the applied mixture. This phenomenon is well-supported by existing literature and can be attributed to fundamental microstructural and technological differences between the two manufacturing methods.
In additive manufacturing, material is deposited layer by layer, resulting in the formation of so-called interlayer interfaces, which are typically characterized by increased porosity and reduced adhesion relative to the homogeneous structure of cast elements. These interfaces serve as preferential pathways for fluid migration, thereby promoting more rapid and extensive water ingress into the material [63,64].
Moreover, the microstructure of printed elements exhibits pronounced anisotropy—pores tend to align along the direction of printing. This spatial configuration facilitates capillary water uptake, particularly in alignment with the orientation of the printed layers [65]. In contrast, cast samples benefit from mechanical compaction methods (e.g., vibration), which result in lower porosity, greater homogeneity, and reduced capillary connectivity, thus limiting water absorption.
The rheological properties of the mixture also play a critical role. Mixtures used for extrusion-based 3D printing must possess sufficient stability and shape retention after deposition, typically necessitating higher viscosity and the use of chemical admixtures. Consequently, these mixes often contain greater amounts of entrapped air and micropores, further increasing their water absorption capacity [66,67].
Furthermore, process-related variables, such as the time interval between successive layer depositions, ambient temperature, and humidity, directly affect the degree of bonding at interlayer interfaces and can amplify capillary effects, even when using the same material formulation. For engineering use, the elevated capillary uptake observed in printed elements should be mitigated by shortening interlayer intervals, employing surface activation, and, where relevant, applying surface sealers in exposure-prone zones. Routine diagnostics—such as infrared thermography during process qualification—can visualize interfacial transport and help establish process windows.
A particularly significant outcome of the mechanical testing, with potential applicability for both future research and industrial practice, is the identification of mixtures in which mechanical properties are maintained or even enhanced despite the incorporation of recycled materials, thereby challenging conventional expectations regarding the performance of waste-derived constituents. The stress-displacement responses from the three-point bending tests are shown in Figure 14. The mean flexural strengths of the tested specimens are presented in Figure 15.
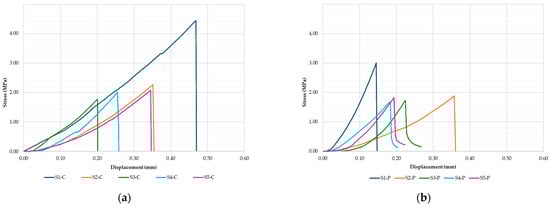
Figure 14.
Variation in stress-displacement behavior during the three-point bending test of: (a) cast specimens; (b) 3D printing specimens; depending on material composition.
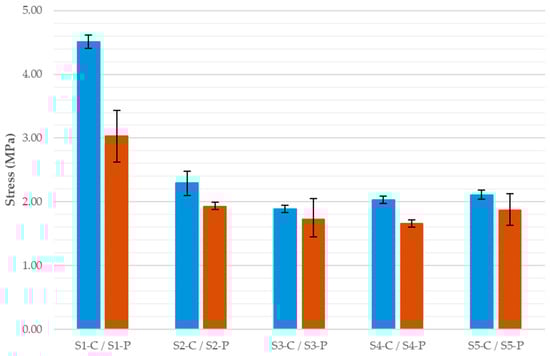
Figure 15.
The mean flexural strengths of the tested specimens.
In the case of the cast specimens (Figure 14a), the reference mix (S1-C) attained the highest peak (4.5 MPa) at the largest displacement, indicating increased ductility. S2-C showed an extended curve too but with a lower peak (2.2 MPa) and smaller displacement at failure. The fly-ash variants (S3-C to S5-C) reached lower peaks (1.6–2.1 MPa) and failed after shorter paths, consistent with a more brittle response.
For the 3D-printed specimens (Figure 14b), the printed reference (S1-P) was strongest within the printed set (peak 3.0 MPa) but remained below S1-C. S2-P exhibited the most gradual response, combining a relatively low peak (1.9 MPa) with the largest displacement at failure, suggesting reduced brittleness. The FA-modified mixes (S3-P to S5-P) showed intermediate peaks (1.6–1.85 MPa) and limited post-peak resistance, with S5-P giving the highest peak (1.85 MPa).
An examination of the flexural strength summary reveals a marked reduction—approximately 50%—in the peak stress sustained by the mixes with modified composition. Given that the addition of recycled brick aggregate to the reference mixture was set at 20% by mass, the observed drop in measured strength is more pronounced and may stem both from the reduced binder fraction in the modified mixtures and from the lower intrinsic strength of the brick-derived binder/matrix. Among the FA-containing specimens, both cast and 3D-printed, the FA3 variant (S5-C/S5-P) achieved the highest values. Notably, the addition of FA did not materially further reduce strength relative to S2-C/S2-P. A clear strength advantage of cast over printed specimens is evident. The printed reference specimen was ~33% weaker than its cast counterpart, while the remaining mixes differed by approximately 10–15% in favor of the cast variants. This trend most likely results from insufficient material compaction and the propensity for defects to form at interlayer interfaces. The variation in stress-displacement characteristics observed during compressive strength testing, considering material composition, manufacturing method (casting or 3D printing), and the orientation of the specimen relative to the direction of applied load and layer deposition, was presented in Figure 16. The mean compressive strengths of the tested specimens are presented in Figure 17.
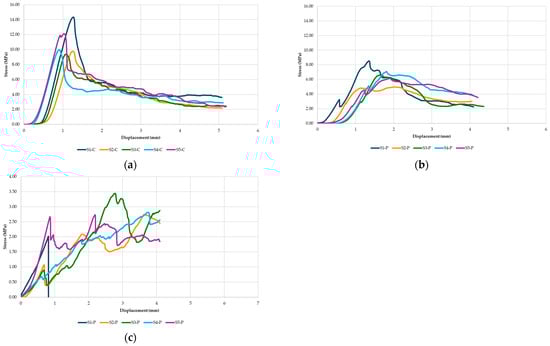
Figure 16.
Variation in stress-displacement behavior during the compressive strength tests of: (a) cast specimens; (b) 3D concrete printed specimens with loading applied perpendicular to the layer orientation; (c) 3D concrete printed specimens with loading applied parallel to the layer orientation.
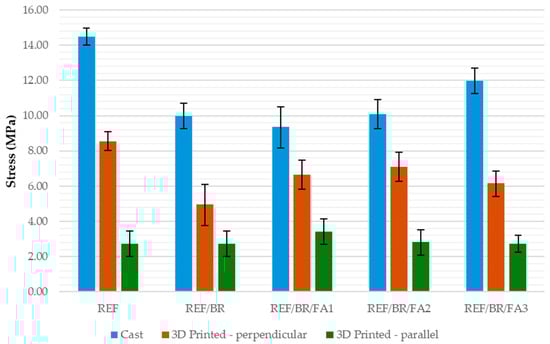
Figure 17.
The mean compressive strengths of the tested specimens.
In the series of cast samples, the highest compressive strength was recorded for the reference specimen (S1-C), reaching a peak stress of approximately 14.5 MPa. This result confirms the high homogeneity and mechanical integrity of the mixture without supplementary additives. Sample S2-C, incorporating recycled brick aggregate, exhibited one of the lowest strength values (~10 MPa), which is likely attributable to the reduced binder content due to partial substitution with the waste-derived material. Samples S3-C to S5-C, containing both recycled brick and fly ash, showed lower peak stresses in the range of 8–12 MPa.
All printed samples tested in the direction perpendicular to the layer orientation displayed lower peak stress values compared to their cast counterparts. The reference printed sample (S1-P) again performed best, with a peak stress of approximately 8.5 MPa; however, this still represents a substantial reduction relative to the cast version (by 43%). Samples S3-P to S5-P reached compressive strengths in the range of 6–7 MPa, and these values exceeded that of the S2-P variant (4.97 MPa), indicating that introducing such additives into the mixture improves compressive strength. Nevertheless, the average values for these variants were about 35% lower than their cast counterparts, potentially due to limited interlayer adhesion or increased porosity introduced during the printing process., However, these samples demonstrated a more extended post-peak response, indicating slightly increased deformability and reduced brittleness. The presence of distinct stress peaks followed by stepped drops suggests progressive failure through crushing in multiple zones.
Printed samples tested in the direction parallel to the layer orientation exhibited the lowest compressive strength values among all series, with none exceeding 3.5 MPa. These specimens also showed greater variability in the stress-displacement curves, particularly for samples S1-P and S2-P. Such behavior is most likely associated with uneven contact surfaces between the specimens and the loading plates, leading to non-uniform stress distribution, local stress concentrations, and premature failure initiation.
It is well established that, when comparing the mechanical performance of concrete specimens, 3D-printed samples generally exhibit significantly lower flexural strength than cast specimens with equivalent material compositions [68,69]. This effect is particularly pronounced when the loading is applied parallel to the direction of layer deposition. For instance, Sapata et al. reported that the flexural strength of 3D-printed specimens tested parallel to the printing layers was only about 77% of that achieved by their cast counterparts [70]. Similarly, cast samples tend to outperform printed ones by approximately 20–30% in terms of compressive strength. This disparity is attributed to the denser microstructure of cast elements and the absence of a layered architecture, which in printed materials is often associated with anisotropy, weaker interlayer bonding, and internal porosity [68,69].
Although improvements in interlayer bonding, achieved through process optimization or material modifications, can enhance the mechanical performance of printed elements, they generally remain insufficient to fully compensate for the structural compactness attainable in conventionally cast specimens. Minimizing this performance gap between the two technologies is critical for the practical implementation and market adoption of concrete 3D printing.
For structural design, the minimum capacity in the weakest loading orientation (parallel to layers) should govern. Where feasible, orient principal compressive stresses perpendicular to the layers, or adopt hybrid print-and-fill strategies to alleviate interlayer weaknesses. Process control should verify that the strength in the weakest orientation meets service demands with an explicit safety margin reflecting the observed ~35–40% gap relative to cast specimens.
4. Conclusions
This article addresses key aspects of 3D concrete printing technology, with a focus on material modifications to the printing mixtures. The experimental study enabled an evaluation of the printability of modified composites and the effects of incorporating recycled components on the rheological behavior of fresh mixtures, as well as the mechanical performance of the hardened material. In addition to reporting material trends, this work formulates practical mixture-design and process windows to facilitate engineering application. Based on the obtained results, the following conclusions can be found:
The incorporation of recycled additives significantly affected the consistency of the fresh mixtures, although not to the extent that would compromise the printability. The measured flow of the fresh mix decreased by 15–22% compared to the reference mix, a reduction primarily attributed to the increased water demand associated with the porous nature and irregular shape of the recycled components. For practice, targeting a flow of 140–150 mm at extrusion, maintaining gentle continuous mixing up to deposition, and keeping interlayer intervals near 1 min yielded stable buildability with screw-type extrusion.
Water absorption tests revealed that samples S2-C/S2-P and S5-C/S5-P exhibited the highest absorption coefficients, suggesting elevated porosity and reduced material density. This effect is particularly linked to the use of crushed brick waste, which features high internal porosity and a large specific surface area due to microcracks and capillary structures formed during the firing process. In contrast, the inclusion of fly ash, a fine-grained pozzolanic material, may have contributed to partial void filling, thereby reducing water absorption in some mixtures.
Notable differences in absorption were also observed between cast and printed specimens. Printed samples exhibited higher absorption rates, which can be attributed to the lack of compaction during layer-by-layer deposition, leading to increased interfacial porosity. Process qualification using infrared thermography provides a rapid, visual check of moisture transport along interfaces and can be incorporated into quality control.
Mechanical performance tests confirmed that the reference mixture REF (samples S1-C/S1-P) exhibited the highest flexural strength in both cast and printed forms. The inclusion of crushed brick aggregate (S2-C/S2-P) resulted in reduced stiffness and strength but introduced greater deformability, as evidenced by increased displacement. The addition of fly ash (S3-C/S3-P to S5-C/S5-P) helped to mitigate the strength loss observed in the brick-only mixture (S2-C/S2-P), although the improvement was marginal, indicating that fly ash may not serve as an effective full replacement for cement. In compressive strength testing, cast specimens consistently achieved the highest and most uniform results, reflecting the reliability and compaction efficiency of traditional casting methods. Printed samples tested perpendicular to the layer orientation exhibited lower but relatively consistent strength values, suggesting controlled failure behavior. Conversely, specimens tested parallel to the layers displayed the lowest strength and greatest variability, likely due to anisotropic microstructure and uneven stress distribution caused by imperfect contact surfaces. Printed samples generally exhibited larger displacement ranges during loading, suggesting differences in fracture mechanisms, specifically, the presence of more microcracks and reduced interlayer cohesion, which are typical of additive manufacturing processes. Design implication: the weakest orientation should govern capacity checks; whenever possible, align principal loads perpendicular to layers or adopt hybrid print-and-fill strategies.
The innovative contribution of this work was the demonstration that samples printed with the addition of recycled brick aggregate (BR) exhibit greater deformability (ductility), which may provide a functional advantage in applications requiring energy dissipation, not just maximum load-bearing capacity. Subsequent modifications to the mixtures should be application-driven. For non-load-bearing or moderately load-bearing applications, the BR fraction can be 20% or higher. By contrast, load-bearing members should be produced from compositions closer to the reference mixture, with modifications introduced primarily via fly ash (FA).
The investigation confirms the potential of using recycled materials from the construction and energy sectors as partial substitutes in cementitious mixtures for 3D printing applications, thus reducing the carbon footprint of concrete mixtures and limiting the consumption of natural mineral raw materials for their production. While the modified mixtures demonstrated reduced mechanical performance relative to the reference composition, they present a promising pathway toward more sustainable construction practices by reducing the reliance on virgin raw materials and lowering the environmental impact. Further research should focus on optimizing and standardizing mix designs for three-dimensional concrete printing (3DCP) to improve the structural performance of sustainable, printed concrete elements, supported by detailed microstructural analyses. It is also essential to conduct larger-scale trials to verify potential limitations, including pumpability issues in industrial-scale equipment and shrinkage-related defects in large printed elements.
Author Contributions
Conceptualization, M.M. and M.H.; methodology, M.M. and M.H.; software, M.M. and S.M.A.S.; validation, M.M., M.R. and M.H.; formal analysis, M.M., M.R., D.H.T. and M.H.; investigation, M.M., S.M.A.S. and M.H.; resources, M.M., D.H.T. and M.H.; data curation, M.M., S.M.A.S. and M.H.; writing—original draft preparation, M.M., M.R., S.M.A.S. and M.H.; writing—review and editing, M.M. and M.H.; visualization, M.M. and S.M.A.S.; supervision, M.H.; project administration, M.H.; funding acquisition, M.H. All authors have read and agreed to the published version of the manuscript.
Funding
This research has been supported by the Ministry of Science and Higher Education within the program “Implementation Doctorate”, DWD/5/0237/2021.
Data Availability Statement
The original contributions presented in the study are included in the article, further inquiries can be directed to the corresponding author.
Acknowledgments
We would like to acknowledge support by the European Union within the Erasmus+ program.
Conflicts of Interest
The authors declare no conflicts of interest.
References
- Pisciotta, M.; Pilorgé, H.; Davids, J.; Psarras, P. Opportunities for Cement Decarbonization. Clean. Eng. Technol. 2023, 15, 100667. [Google Scholar] [CrossRef]
- Spire. Strategic Research and Innovation Agenda, P4Planet Processes4Planet 2050 Roadmap. 2021. Available online: https://www.aspire2050.eu/sites/default/files/users/user85/p4planet_07.06.2022._final.pdf (accessed on 2 November 2025).
- European Commission; Joint Research Centre. Decarbonisation Options for the Cement Industry; Publications Office: Luxembourg, 2023. [Google Scholar]
- Stowarzyszenie Producentów Cementu. The Role of Cement in the 2050 Low Carbon Economy; The European Cement Association: Brussels, Belgium, 2018. [Google Scholar]
- Naqi, A.; Jang, J.G. Recent Progress in Green Cement Technology Utilizing Low-Carbon Emission Fuels and Raw Materials: A Review. Sustainability 2019, 11, 537. [Google Scholar] [CrossRef]
- Nassar, R.-U.-D.; Balachandra, A.; Soroushian, P. Formulation of High-Recycled-Content Hydraulic Cements Based on Alkali Aluminosilicate Chemistry and Mechanochemical Processing Techniques. Constr. Build. Mater. 2024, 437, 137017. [Google Scholar] [CrossRef]
- Wen, J.; Wang, B.; Dai, Z.; Shi, X.; Jin, Z.; Wang, H.; Jiang, X. New Insights into the Green Cement Composites with Low Carbon Footprint: The Role of Biochar as Cement Additive/Alternative. Resour. Conserv. Recycl. 2023, 197, 107081. [Google Scholar] [CrossRef]
- Orozco, C.; Babel, S.; Tangtermsirikul, S.; Sugiyama, T. Comparison of Environmental Impacts of Fly Ash and Slag as Cement Replacement Materials for Mass Concrete and the Impact of Transportation. Sustain. Mater. Technol. 2024, 39, e00796. [Google Scholar] [CrossRef]
- Scrivener, K.L.; John, V.M.; Gartner, E.M. Eco-Efficient Cements: Potential Economically Viable Solutions for a Low-CO2 Cement-Based Materials Industry. Cem. Concr. Res. 2018, 114, 2–26. [Google Scholar] [CrossRef]
- American Coal Ash Association (ACAA). The U.S. Fly Ash Market: Production & Utilization Forecast; ACAA: Feltham, UK, 2020. [Google Scholar]
- Salini, U.; Parayil, A. Behavior of Controlled Low-Strength Material Incorporating Industrial by-Products Fly Ash, Quarry Waste and Concrete Waste. Constr. Build. Mater. 2024, 447, 138057. [Google Scholar] [CrossRef]
- The International Energy Agency (IEA). World Energy Outlook 2021; IEA: Paris, France, 2021. [Google Scholar]
- Nayak, D.K.; Abhilash, P.P.; Singh, R.; Kumar, R.; Kumar, V. Fly Ash for Sustainable Construction: A Review of Fly Ash Concrete and Its Beneficial Use Case Studies. Clean. Mater. 2022, 6, 100143. [Google Scholar] [CrossRef]
- Ogrodnik, P.; Rutkowska, G.; Szulej, J.; Żółtowski, M.; Powęzka, A.; Badyda, A. Cement Mortars with Addition of Fly Ash from Thermal Transformation of Sewage Sludge and Zeolite. Energies 2022, 15, 1399. [Google Scholar] [CrossRef]
- Sambangi, A.; Kundeti, N.; Srimani, R.; Nadukuditi, A. Effect of Fly Ash and Alccofine as Cementitious Materials on M40 Grade Concrete. Mater. Today Proc. 2023. [Google Scholar] [CrossRef]
- Ali, T.; Qureshi, M.Z.; Onyelowe, K.C.; Althaqafi, E.; Deifalla, A.; Ahmed, H.; Ajwad, A. Optimizing Recycled Aggregate Concrete Performance with Chemically and Mechanically Activated Fly Ash in Combination with Coconut Fiber. Sci. Rep. 2025, 15, 9346. [Google Scholar] [CrossRef]
- Madurwar, K.; Burile, A.; Sorte, A. Compressive Strength of Cement & Fly Ash Mortar: A Case Study. SSRN J. 2019. [Google Scholar] [CrossRef]
- Rudziewicz, M.; Hutyra, A.; Maroszek, M.; Korniejenko, K.; Hebda, M. 3D-Printed Lightweight Foamed Concrete with Dispersed Reinforcement. Appl. Sci. 2025, 15, 4527. [Google Scholar] [CrossRef]
- Sugandhini, H.K.; Nayak, G.; Shetty, K.K.; Kudva, L.P. The Durability of High-Volume Fly Ash-Based Cement Composites with Synthetic Fibers in a Corrosive Environment: A Long-Term Study. Sustainability 2023, 15, 11481. [Google Scholar] [CrossRef]
- Raj, B.S.; Rao, M.K. Flexural Performance of Sustainable Fly Ash Based Concrete Beams. IOP Conf. Ser. Earth Environ. Sci. 2023, 1130, 012021. [Google Scholar] [CrossRef]
- Ondova, M.; Stevulova, N.; Estokova, A. The Study of the Properties of Fly Ash Based Concrete Composites with Various Chemical Admixtures. Procedia Eng. 2012, 42, 1863–1872. [Google Scholar] [CrossRef]
- Haustein, E.; Kuryłowicz-Cudowska, A. Effect of Particle Size of Fly Ash Microspheres (FAMs) on the Selected Properties of Concrete. Minerals 2022, 12, 847. [Google Scholar] [CrossRef]
- Synowiec, K. The Influence of Fly Ash Type on Properties of Cements Composites. Eng. Trans. 2015, 63, 191–201. [Google Scholar] [CrossRef]
- Zhou, L.; Gou, M.; Ji, J.; Hou, X.; Zhang, H. Durability and Hardened Properties of 3D Printed Concrete Containing Bauxite Tailings. Mater. Today Sustain. 2024, 25, 100704. [Google Scholar] [CrossRef]
- Szcześniak, A.; Siwiński, J.; Stolarski, A.; Piekarczuk, A.; Nasiłowska, B. The Influence of the Addition of Microsilica and Fly Ash on the Properties of Ultra-High-Performance Concretes. Materials 2024, 18, 28. [Google Scholar] [CrossRef]
- Rudziewicz, M.; Maroszek, M.; Setlak, K.; Góra, M.; Hebda, M. Optimization of Foams—Polypropylene Fiber-Reinforced Concrete Mixtures Dedicated for 3D Printing. Materials 2024, 17, 4106. [Google Scholar] [CrossRef] [PubMed]
- Kruger, J.; Zeranka, S.; Van Zijl, G. An Ab Initio Approach for Thixotropy Characterisation of (Nanoparticle-Infused) 3D Printable Concrete. Constr. Build. Mater. 2019, 224, 372–386. [Google Scholar] [CrossRef]
- Guo, X.; Yang, J.; Xiong, G. Influence of Supplementary Cementitious Materials on Rheological Properties of 3D Printed Fly Ash Based Geopolymer. Cem. Concr. Compos. 2020, 114, 103820. [Google Scholar] [CrossRef]
- Dey, D.; Srinivas, D.; Boddepalli, U.; Panda, B.; Gandhi, I.S.R.; Sitharam, T.G. 3D Printability of Ternary Portland Cement Mixes Containing Fly Ash and Limestone. Mater. Today Proc. 2022, 70, 195–200. [Google Scholar] [CrossRef]
- Taqa, A.A.; Mohsen, M.O.; Aburumman, M.O.; Naji, K.; Taha, R.; Senouci, A. Nano-Fly Ash and Clay for 3D-Printing Concrete Buildings: A Fundamental Study of Rheological, Mechanical and Microstructural Properties. J. Build. Eng. 2024, 92, 109718. [Google Scholar] [CrossRef]
- Pickin, J.; Wardle, C.; O’Farrell, K.; Nyunt, P.; Donovan, S. National Waste Report 2020; Report prepared for the Department of Agriculture, Water and the Environment; Australian Government: Melbourne, Australia, 2020. Available online: https://www.dcceew.gov.au/sites/default/files/env/pages/5a160ae2-d3a9-480e-9344-4eac42ef9001/files/national-waste-report-2020.pdf (accessed on 2 November 2025).
- Xiao, J.; Zou, S.; Yu, Y.; Wang, Y.; Ding, T.; Zhu, Y.; Yu, J.; Li, S.; Duan, Z.; Wu, Y.; et al. 3D Recycled Mortar Printing: System Development, Process Design, Material Properties and on-Site Printing. J. Build. Eng. 2020, 32, 101779. [Google Scholar] [CrossRef]
- Ivanova, I.; Mechtcherine, V. Effects of Volume Fraction and Surface Area of Aggregates on the Static Yield Stress and Structural Build-Up of Fresh Concrete. Materials 2020, 13, 1551. [Google Scholar] [CrossRef]
- Ivanova, I.; Mechtcherine, V. Evaluation of Structural Build-Up Rate of Cementitious Materials by Means of Constant Shear Rate Test: Parameter Study. In Rheology and Processing of Construction Materials; Mechtcherine, V., Khayat, K., Secrieru, E., Eds.; RILEM Bookseries; Springer International Publishing: Cham, Switzerland, 2020; Volume 23, pp. 209–218. ISBN 978-3-030-22565-0. [Google Scholar]
- Wu, Y.; Liu, C.; Liu, H.; Zhang, Z.; He, C.; Liu, S.; Zhang, R.; Wang, Y.; Bai, G. Study on the Rheology and Buildability of 3D Printed Concrete with Recycled Coarse Aggregates. J. Build. Eng. 2021, 42, 103030. [Google Scholar] [CrossRef]
- Fonseca, M.; Matos, A.M. 3D Construction Printing Standing for Sustainability and Circularity: Material-Level Opportunities. Materials 2023, 16, 2458. [Google Scholar] [CrossRef]
- Zhang, N.; Sanjayan, J. Extrusion Nozzle Design and Print Parameter Selections for 3D Concrete Printing. Cem. Concr. Compos. 2023, 137, 104939. [Google Scholar] [CrossRef]
- Kamhawi, A.; Aghaei Meibodi, M. Techniques and Strategies in Extrusion Based 3D Concrete Printing of Complex Components to Prevent Premature Failure. Autom. Constr. 2024, 168, 105768. [Google Scholar] [CrossRef]
- Tu, H.; Wei, Z.; Bahrami, A.; Ben Kahla, N.; Ahmad, A.; Özkılıç, Y.O. Recent Advancements and Future Trends in 3D Concrete Printing Using Waste Materials. Dev. Built Environ. 2023, 16, 100187. [Google Scholar] [CrossRef]
- EN 196-1:2016; Methods of Testing Cement—Part 1: Determination of Strength. European Committee for Standardization: Brussels, Belgium, 2016.
- Kaya, E.; Ciza, B.; Yalçınkaya, Ç.; Felekoğlu, B.; Yazıcı, H.; Çopuroğlu, O. A Comparative Study on the Effectiveness of Fly Ash and Blast Furnace Slag as Partial Cement Substitution in 3D Printable Concrete. J. Build. Eng. 2025, 108, 112841. [Google Scholar] [CrossRef]
- Tseng, K.-C.; Chi, M.; Yeih, W.; Huang, R. Influence of Slag/Fly Ash as Partial Cement Replacement on Printability and Mechanical Properties of 3D-Printed Concrete. Appl. Sci. 2025, 15, 3933. [Google Scholar] [CrossRef]
- CEN EN 15804:2012+A2:2019/AC:2021; Sustainability of Construction Works—Environmental Product Declarations—Core Rules for the Product Category of Construction Products. CEN: Brussels, Belgium, 2019.
- CEMBUREAU. Environmental Product Declaration (EPD) According to EN 15804 and ISO 14025; CEMBUREAU—The European Cement Association: Brussels, Belgium, 2020; Available online: https://cembureau.eu/media/3lplreko/epd-for-cement-cem-i.pdf (accessed on 5 September 2025).
- Kiwa-Ecobility Experts. Environmental Product Declaration (EPD) According to ISO 14025 and EN 15804: EFA-Füller S-MA; BauMineral GmbH: Berlin, Germany, 2023; Available online: https://www.baumineral.de/downloads/file/572/EFA-F%C3%BCller%20S-MA%20EPD-Kiwa-EE-157618-EN.pdf (accessed on 5 September 2025).
- Construction Technology Institute (ITB). Environmental Product Declaration (EPD)—Cements CEM I, CEM II, CEM III; Polish Cement Association (SPC): Warsaw, Poland, 2024; Available online: https://www.itb.pl/wp-content/uploads/2024/08/ITB_EPD_116_Polish-Cement-Association-CEMENTS.pdf (accessed on 3 September 2025).
- Jungclaus, M.A.; Williams, S.L.; Arehart, J.H.; Srubar, W.V. Whole-Life Carbon Emissions of Concrete Mixtures Considering Maximum CO2 Sequestration via Carbonation. Resour. Conserv. Recycl. 2024, 206, 107605. [Google Scholar] [CrossRef]
- Nath, P.; Sarker, P.K.; Biswas, W.K. Effect of Fly Ash on the Service Life, Carbon Footprint and Embodied Energy of High Strength Concrete in the Marine Environment. Energy Build. 2018, 158, 1694–1702. [Google Scholar] [CrossRef]
- EN 1015-3:1999; Methods of Test for Mortar for Masonry. Determination of Consistence of Fresh Mortar (by Flow Table). CEN: Brussels, Belgium, 1999.
- Maroszek, M.; Rudziewicz, M.; Hutyra, A.; Dziura, P.; Hebda, M. Evaluation of 3D Concrete Printing Extrusion Efficiency. Appl. Sci. 2024, 14, 11866. [Google Scholar] [CrossRef]
- Paritala, S.; Singaram, K.K.; Bathina, I.; Khan, M.A.; Jyosyula, S.K.R. Rheology and Pumpability of Mix Suitable for Extrusion-Based Concrete 3D Printing—A Review. Constr. Build. Mater. 2023, 402, 132962. [Google Scholar] [CrossRef]
- Kaszyńska, M.; Hoffmann, M.; Skibicki, S.; Zieliński, A.; Techman, M.; Olczyk, N.; Wróblewski, T. Evaluation of Suitability for 3D Printing of High Performance Concretes. MATEC Web Conf. 2018, 163, 01002. [Google Scholar] [CrossRef]
- Xu, K.; Yang, J.; He, H.; Wei, J.; Zhu, Y. Influences of Additives on the Rheological Properties of Cement Composites: A Review of Material Impacts. Materials 2025, 18, 1753. [Google Scholar] [CrossRef] [PubMed]
- Singh, A.; Miao, X.; Zhou, X.; Deng, Q.; Li, J.; Zou, S.; Duan, Z. Use of Recycled Fine Aggregates and Recycled Powders in Sustainable Recycled Concrete. J. Build. Eng. 2023, 77, 107370. [Google Scholar] [CrossRef]
- Robayo–Salazar, R.; Vargas, A.; Martínez, F.; Mejía De Gutiérrez, R. Utilization of Powders and Fine Aggregates from the Recycling of Construction and Demolition Waste in the 3D Printing of Portland-Based Cementitious Materials. Clean. Mater. 2024, 11, 100234. [Google Scholar] [CrossRef]
- EN 933-1:2012; Tests for Geometrical Properties of Aggregates—Part 1: Determination of Particle Size Distribution—Sieving Method. Czech Office for Standards, Metrology and Testing: Prague, Czech Republic, 2012.
- Bentz, D.P.; Garboczi, E.J.; Haecker, C.J.; Jensen, O.M. Effects of Cement Particle Size Distribution on Performance Properties of Portland Cement-Based Materials. Cem. Concr. Res. 1999, 29, 1663–1671. [Google Scholar] [CrossRef]
- Ferraris, C.; Hackley, V.; Avilés, A. Measurement of Particle Size Distribution in Portland Cement Powder: Analysis of ASTM Round Robin Studies. Cem. Concr. Aggreg. 2004, 26, 1–11. [Google Scholar] [CrossRef]
- Gao, G.; Li, Q.; Luo, H.; Huang, X. Effect of Particle Size Distribution on Microstructure and Chloride Permeability of Blended Cement with Supplementary Cementitious Materials. Sci. Eng. Compos. Mater. 2023, 30, 20220226. [Google Scholar] [CrossRef]
- Kubissa, J.; Koper, M.; Koper, W.; Kubissa, W.; Koper, A. Water Demand of Concrete Recycled Aggregates. Procedia Eng. 2015, 108, 63–71. [Google Scholar] [CrossRef]
- Golewski, G.L. Assessing of Water Absorption on Concrete Composites Containing Fly Ash up to 30% in Regards to Structures Completely Immersed in Water. Case Stud. Constr. Mater. 2023, 19, e02337. [Google Scholar] [CrossRef]
- Miao, L.; Wen, M.; Jiao, C.; He, S.; Guan, X. Study on Desorption Characteristics of Water Vapor in Fly Ash Concrete Materials. Case Stud. Constr. Mater. 2024, 20, e03103. [Google Scholar] [CrossRef]
- Wolfs, R.J.M.; Bos, F.P.; Salet, T.A.M. Hardened Properties of 3D Printed Concrete: The Influence of Process Parameters on Interlayer Adhesion. Cem. Concr. Res. 2019, 119, 132–140. [Google Scholar] [CrossRef]
- Panda, B.; Unluer, C.; Tan, M.J. Investigation of the Rheology and Strength of Geopolymer Mixtures for Extrusion-Based 3D Printing. Cem. Concr. Compos. 2018, 94, 307–314. [Google Scholar] [CrossRef]
- Marchment, T.; Sanjayan, J.; Xia, M. Method of Enhancing Interlayer Bond Strength in Construction Scale 3D Printing with Mortar by Effective Bond Area Amplification. Mater. Des. 2019, 169, 107684. [Google Scholar] [CrossRef]
- Le, T.T.; Austin, S.A.; Lim, S.; Buswell, R.A.; Gibb, A.G.F.; Thorpe, T. Mix Design and Fresh Properties for High-Performance Printing Concrete. Mater. Struct. 2012, 45, 1221–1232. [Google Scholar] [CrossRef]
- Kazemian, A.; Yuan, X.; Cochran, E.; Khoshnevis, B. Cementitious Materials for Construction-Scale 3D Printing: Laboratory Testing of Fresh Printing Mixture. Constr. Build. Mater. 2017, 145, 639–647. [Google Scholar] [CrossRef]
- Yaqub, W.; Aslani, F. Mechanical Properties and Fire Resistance of 3D-Printed Cementitious Composites with Plastic Waste. Int. J. Concr. Struct. Mater. 2024, 18, 84. [Google Scholar] [CrossRef]
- Girskas, G.; Kligys, M. 3D Concrete Printing Review: Equipment, Materials, Mix Design, and Properties. Buildings 2025, 15, 2049. [Google Scholar] [CrossRef]
- Sapata, A.; Šinka, M.; Šahmenko, G.; Korat Bensa, L.; Hanžič, L.; Šter, K.; Ručevskis, S.; Bajāre, D.; Bos, F.P. Establishing Benchmark Properties for 3D-Printed Concrete: A Study of Printability, Strength, and Durability. J. Compos. Sci. 2025, 9, 74. [Google Scholar] [CrossRef]


Disclaimer/Publisher’s Note: The statements, opinions and data contained in all publications are solely those of the individual author(s) and contributor(s) and not of MDPI and/or the editor(s). MDPI and/or the editor(s) disclaim responsibility for any injury to people or property resulting from any ideas, methods, instructions or products referred to in the content. |
© 2025 by the authors. Licensee MDPI, Basel, Switzerland. This article is an open access article distributed under the terms and conditions of the Creative Commons Attribution (CC BY) license (https://creativecommons.org/licenses/by/4.0/).