Abstract
Small-diameter tunnels play a crucial role in urban infrastructure, managing functions such as sewage, rainwater, and electrical systems. However, the safety assessment of small-diameter tunnel shield construction faces difficulties due to unclear physical relationships and the limitations of traditional physical information models in predicting complex risks. To address this issue, the integration of physical information with data-driven analysis methods offers a promising approach. Combining these advantages, a hybrid model was proposed to establish a robust construction safety risk evaluation framework for small-diameter tunnels under geological conditions. The presently proposed method mainly consists of a clustering of risk factors, physical information stratification, and risk early warning. Specifically, the K-means clustering method optimized by the Harris Hawks algorithm was used for risk identification, the Analytic Hierarchy Process was used for risk analysis, and the physical information output from the risk analysis was used for risk warning. A case study was produced, utilizing the proposed hybrid model for the Wuhan East Lake Deep Tunnel project. The results show the risk transfer path through inadequate personnel safety awareness and protection, mechanical system failures and installation deviations, substandard material quality and improper stacking, outdated or immature construction technology, and environmental risks.
1. Introduction
The advancement of modern tunnel construction processes has yielded vast amounts of data, which can be effectively utilized to enhance the accuracy of construction safety evaluations. Data-driven approaches improve upon traditional observation methods by leveraging data analysis and pattern recognition techniques, enabled by comprehensive datasets that describe the physical properties of the modeling system. Compared to traditional methods, data-driven approaches offer efficient and precise support for on-site decision-making processes, leading to potential time and cost savings.
Recent developments in the application of data-driven and physical models in tunnel shield construction have underscored their efficacy in improving operational efficiency and predicting construction safety. Based on the severity of the potential extrusion problem, Hadi et al. [1] proposed a multi-level data mining decision evaluation method to predict the level of soil extrusion. The extrusion conditions in the rock tunnel are predicted according to the four parameters commonly used in the early design stage, that is, diameter, buried depth, support stiffness and rock tunnel quality. Six different types of machine learning methods are analyzed by Sheil et al. [1,2], namely decision trees, rules, miscellaneous, functions, Bayesian and lazy classifiers, which are included in the proposed method and help the user determine which method should be used to achieve the desired degree of accuracy. Pan et al. [3] proposes that the multilevel decision model can be effectively used for tunnel extrusion analysis problems and produce promised results. The prediction accuracy of the developed multi-level model can reach more than 90%, achieving good results for compression risk mitigation and prevention. Huang et al. [4] introduced the practical application and development trend of BIM, machine learning, computer vision and other technologies in the process of tunnel shield construction, reviewed BIM technology in traditional mechanized tunnel construction, and summarized the key application technologies of machine learning and computer vision in different stages of underground shield construction. Based on the characteristics of tunnel shield construction, a comprehensive risk assessment method of tunnel construction risk is constructed by Wang et al. [5,6] using empowerment and the cloud model, and a risk assessment index system is established on the basis of engineering geological conditions, natural environmental conditions, the tunnel engineering design scheme and construction management research. For the safety risk assessment of tunnel shield construction, Yu et al. [7] used digital twin technology to build a knowledge-driven environment for optimizing the evaluation strategy, and proposed a digital twin and knowledge-driven decision support method for the active maintenance of electromechanical equipment in tunnel construction (TEE). Thomas et al. [8]’s use of the digital method will change the way in which geological data is collected, as well as the application of the rock classification method and design analysis in the field of tunnel tunneling and tunnel construction maintenance process. Karniadakis et al. [9] considered that great progress has been made in the study of mathematical partial differential equations (PDEs) for multi-physical field problems in complex engineering.
However, while data-driven methods excel in handling large volumes of diverse data for predictive analysis, they may not always adhere to fundamental physical laws. Combining data-driven approaches with physical information mitigates this limitation, allowing for more accurate and rapid predictive analyses that integrate the strengths of both methodologies. By designing specialized data variables that adhere to physical invariants, such integrated approaches can achieve enhanced accuracy in complex engineering prediction problems.
Thus, the integration of physical information with data-driven methods represents a significant step forward in achieving precise prediction and analysis in tunnel construction safety. This hybrid approach not only builds upon established physical models but also harnesses the power of big data analytics to improve decision-making and enhance safety measures throughout the construction process. The objective of this study is to develop and validate a hybrid safety evaluation model for small-diameter tunnel shield construction that integrates physical information with data-driven analysis methods. The model aims to improve the accuracy of risk prediction under complex geological conditions, enhance the identification of critical safety issues during construction, and provide practical guidance for optimizing safety measures in real engineering projects.
2. Methods
Urban small-diameter tunnels are critical for maintaining city operations, supporting infrastructure such as sewage, rainwater, and electrical systems. Unlike larger underground tunnels, the construction of small-diameter tunnels poses unique challenges including confined starting points, difficulties in material handling, challenging construction conditions, elevated machinery layouts, and intricate maneuvering requirements. In response to these challenges, the data-driven approach has rapidly gained prominence, leveraging increased data availability and computing power to address complex tasks effectively.
Data-driven methodologies have been widely applied across various challenging tasks, harnessing extensive datasets to enhance deployment success rates. However, despite their utility, data-driven approaches face limitations such as the lack of process mechanisms under different conditions, dependency on expert knowledge, and challenges in monitoring and diagnosing models. These factors restrict their applicability, particularly in industrial settings with complex mechanisms and environments requiring robustness beyond smooth operational processes.
Conversely, traditional physical modeling methods rely on strict control equations and clear physical relationships but struggle with scalability and complexity in large-scale engineering projects involving numerous variables and complex systems. Traditional physical models rely on well-defined engineering relationships and parameters. While they provide mechanistic insights, they often struggle with predicting complex or uncertain risks inherent in small-diameter tunnel shield construction due to geological variability and intricate construction systems. Single data-driven approaches (e.g., purely statistical or machine learning models) can capture patterns from historical data, but they may lack interpretability and fail to consider underlying physical principles, which are critical for practical safety management and early warning.
To bridge these methodological gaps and improve safety evaluations in small-diameter tunnel shield construction, this study proposes a decision support method integrating physical information and data-driven approaches. This hybrid approach leverages the strengths of both methodologies; the comprehensive data analysis capabilities of data-driven models are enriched by the rigorous physical control equations that ensure adherence to essential laws of physics. By combining accurate physical calculations with efficient predictive capabilities, this approach enhances the predictive accuracy and robustness required for complex engineering problems.
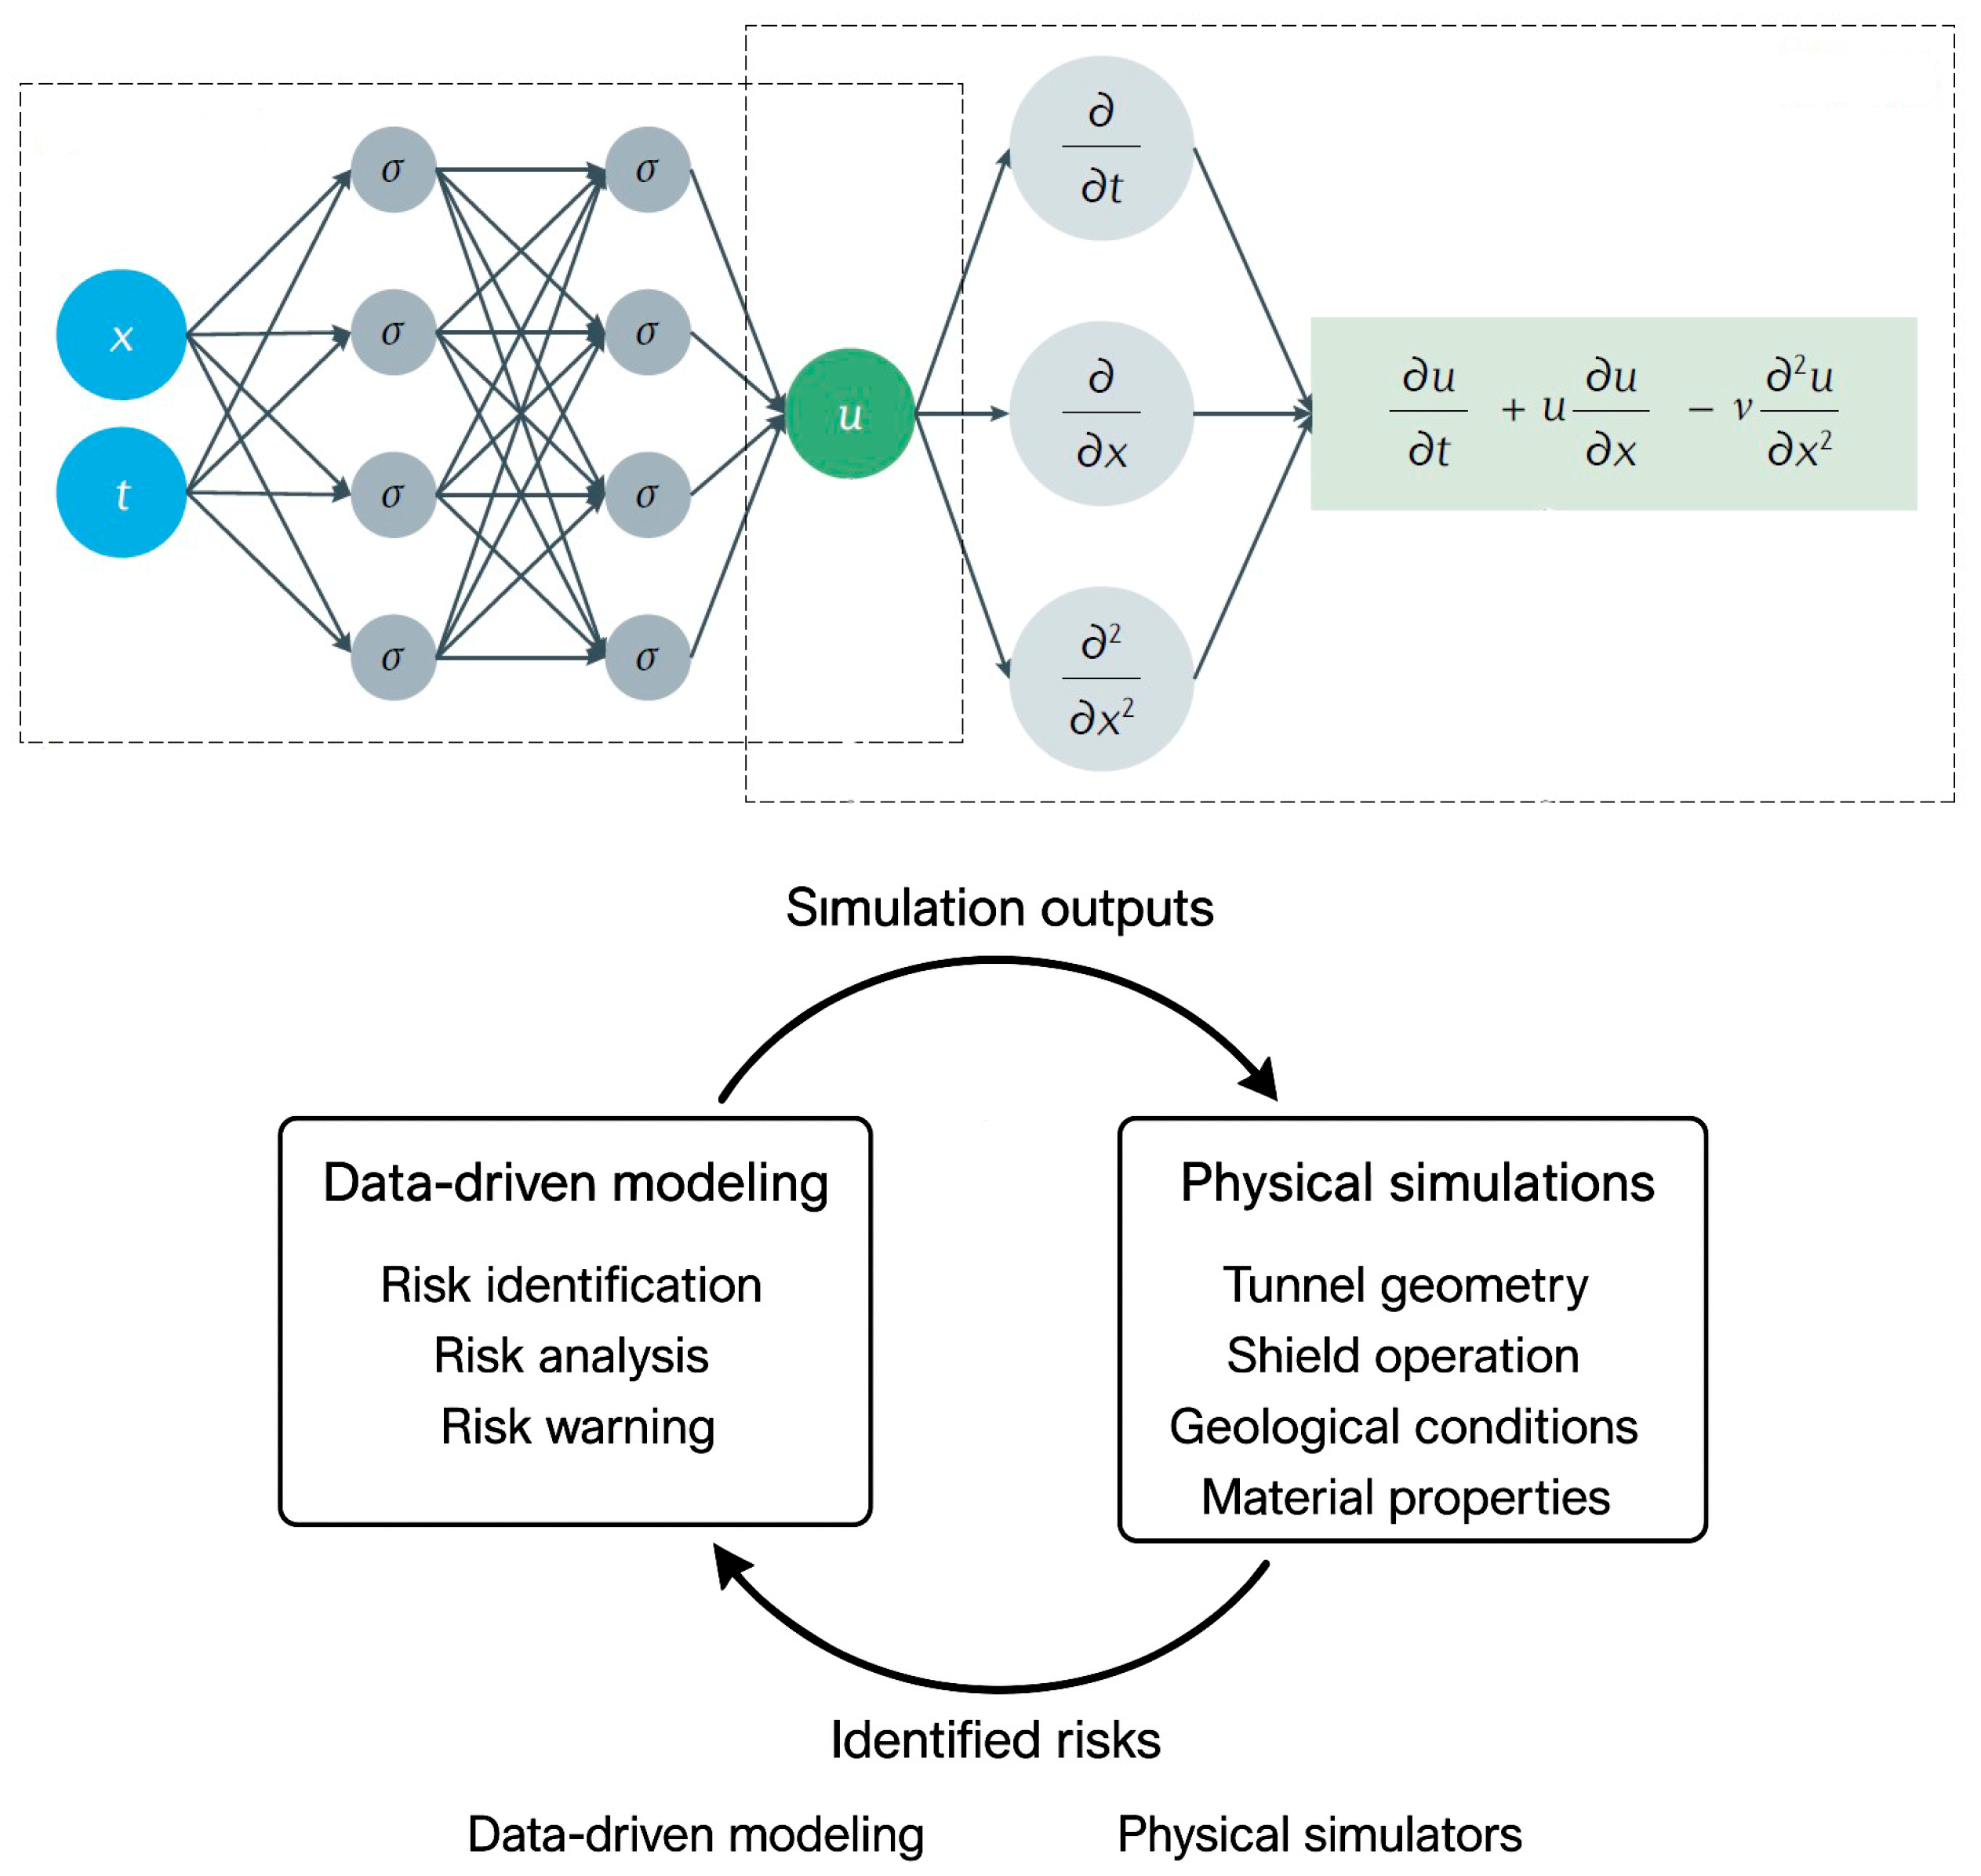
The proposed model not only addresses the limitations of traditional data-driven methods but also integrates physical insights to provide a more holistic safety evaluation framework. The proposed hybrid model combines these two approaches, leveraging physical information stratification for a realistic representation of engineering conditions and using data-driven techniques (K-means clustering optimized by Harris Hawks algorithm and Analytic Hierarchy Process) to identify and quantify risk factors. This integration enables (a) more accurate risk identification under complex conditions, (b) enhanced interpretability of results, linking data-driven insights with physical mechanism, and (c) practical early-warning outputs that can guide on-site safety management. Figure 1 illustrates the foundational structure of this integrated approach, emphasizing its potential to advance safety assessments and predictive analyses in small-diameter tunnel shield construction.
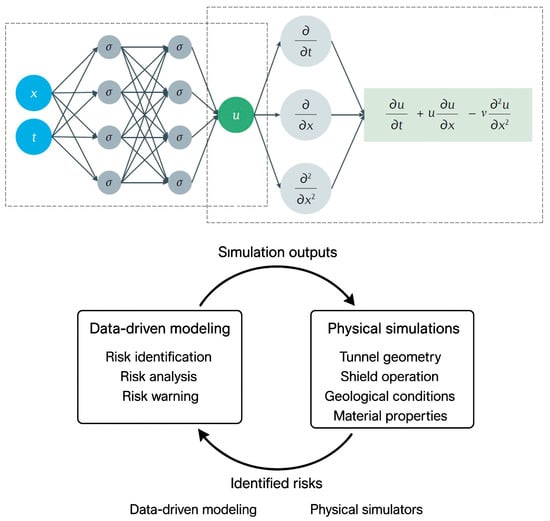
Figure 1.
A data-driven modeling approach based on physical information.
In summary, by fusing physical information with data-driven methodologies, this study aims to overcome existing challenges and enhance the reliability and effectiveness of safety evaluations in urban small-diameter tunnel projects. This approach not only promises improved predictive capabilities but also lays the groundwork for future advancements in tunnel construction safety and efficiency. The advantages of accurate calculation of physical modeling and data-driven efficient prediction are combined, and the basic structure is shown in Figure 1 [10].
2.1. Model Construction
Considering the characteristics of shield construction in small-diameter tunnels, we propose a data-driven model based on physical information to predict the construction process. This model consists of three main components: risk identification, risk analysis, and risk warning.
Risk Identification Module: We use the K-means clustering method, optimized by the Harris Hawks Optimization (HHO) algorithm, to classify and organize various factors affecting construction safety. This helps identify key risk factors related to people, machines, materials, methods, and the environment, thus constructing a comprehensive safety risk index system for the small-diameter tunnel shield construction process.
Risk Analysis Module: Using the established risk index system, we collect quantitative indicators of the main physical information in risk factors and risk events, which serve as input and output variables. The Analytic Hierarchy Process (AHP) is employed to determine the hierarchical correlation structure between these variables. By leveraging a data-driven approach, we establish a predictive model that approximates the relationship between input and output variables.
Risk Early Warning Module: Based on the physical information output from the risk analysis module, we conduct quantitative scoring using weight analysis. This allows us to categorize risk levels, identify major risk events and their contributing factors, and develop corresponding early warning plans and preventive measures.
The model enables comprehensive risk identification, analysis, and prediction throughout the small-diameter tunnel shield construction process, guiding effective risk mitigation measures. By integrating physical information, such as material performance and structural strength, into physical equations, we establish clear relationships between variables and evaluate component risks accurately.
2.2. Clustering of Risk Factors
Data-driven methods rely on data mining techniques to uncover useful patterns and knowledge from complex and disordered data. For the identification of construction safety risk factors, appropriate clustering analysis methods are necessary. K-means clustering, known for its simplicity, flexibility, and speed, is used widely but is sensitive to noise and outliers [11]. To enhance K-means performance, we employ the HHO algorithm, which offers robust results in solving multi-constraint optimization problems with few parameters.
where , , and represent the number of data points, number of clustering points, relationship matrix and relationship matrix.
However, the K-means clustering analysis method has limitations, such as its sensitivity to noisy data and outliers, as well as a tendency to become stuck in local optima. Traditional optimization algorithms, like Genetic Algorithms (GA) [12], Ant Colony Optimization (ACO) [13], and Particle Swarm Optimization (PSO) [14], also have drawbacks, including numerous control variables, slow convergence speeds, and sensitivity to parameter settings.
To overcome these issues, the Harris Hawks Optimization (HHO) [15] algorithm is employed to enhance the effectiveness of K-means clustering. Introduced by Heidari and Mirjalili, the HHO algorithm draws inspiration from the cooperative hunting behaviors of Harris hawks in nature. Despite its relatively recent development, HHO has quickly proven to be an effective tool for various engineering problems due to its few control parameters, high search efficiency, and strong optimization capabilities.
The HHO algorithm is a population-based optimization technique that simulates the hunting strategies of Harris hawks. In this method, the hawks’ positions represent potential solutions to an optimization problem, and their movements are designed to converge towards the optimal solution through cooperative behaviors.
The HHO algorithm operates in two main phases: exploration and exploitation. During the exploration phase, Harris hawks assess the state of the prey and update their positions to improve their chances of capturing the prey (finding the optimal solution). This process continues until the algorithm achieves a satisfactory level of performance in solving the optimization problem.
where , , , , , , and represent the position of the individual eagle at the t iteration, the randomly selected population individual, the position of the prey, the random number of the (0, 1) interval, the average position of all the individual eagles, and the lower and upper limits of the search range, respectively.
where and represent the total number of individual eagles, which is the position of the i-th individual eagle.
The HHO algorithm selects the transition time from exploration to the development stage of the prey. The calculation formula of the escape energy is as follows:
where and are the initial escape energy of the prey and the maximum number of iterations of the algorithm.
When the escape energy ≥ 1, the HHO algorithm remains in the exploration stage; when the escape energy < 1, the HHO algorithm enters the development stage, which is divided into four states according to the value of the escape energy and the escape factor .
When ≥ 0.5 and ≥ 0.5, it means that the prey still has enough physical strength to escape, and the eagles will gently surround the prey to fatigue it. This stage is expressed as follows:
When < 0.5 and ≥ 0.5, indicating that the prey fitness is not low enough to escape capture, the stage is expressed as follows:
When ≥ 0.5 and < 0.5, it means that the prey still has the energy to escape, and the eagles will produce a soft encirclement to hunt the prey. The stage is expressed as follows:
When < 0.5 and < 0.5, it means that the prey does not have enough energy to escape, and the eagle group constructs a hard siege to trap the prey. The stage is expressed as follows:
2.3. Physical Information Stratification
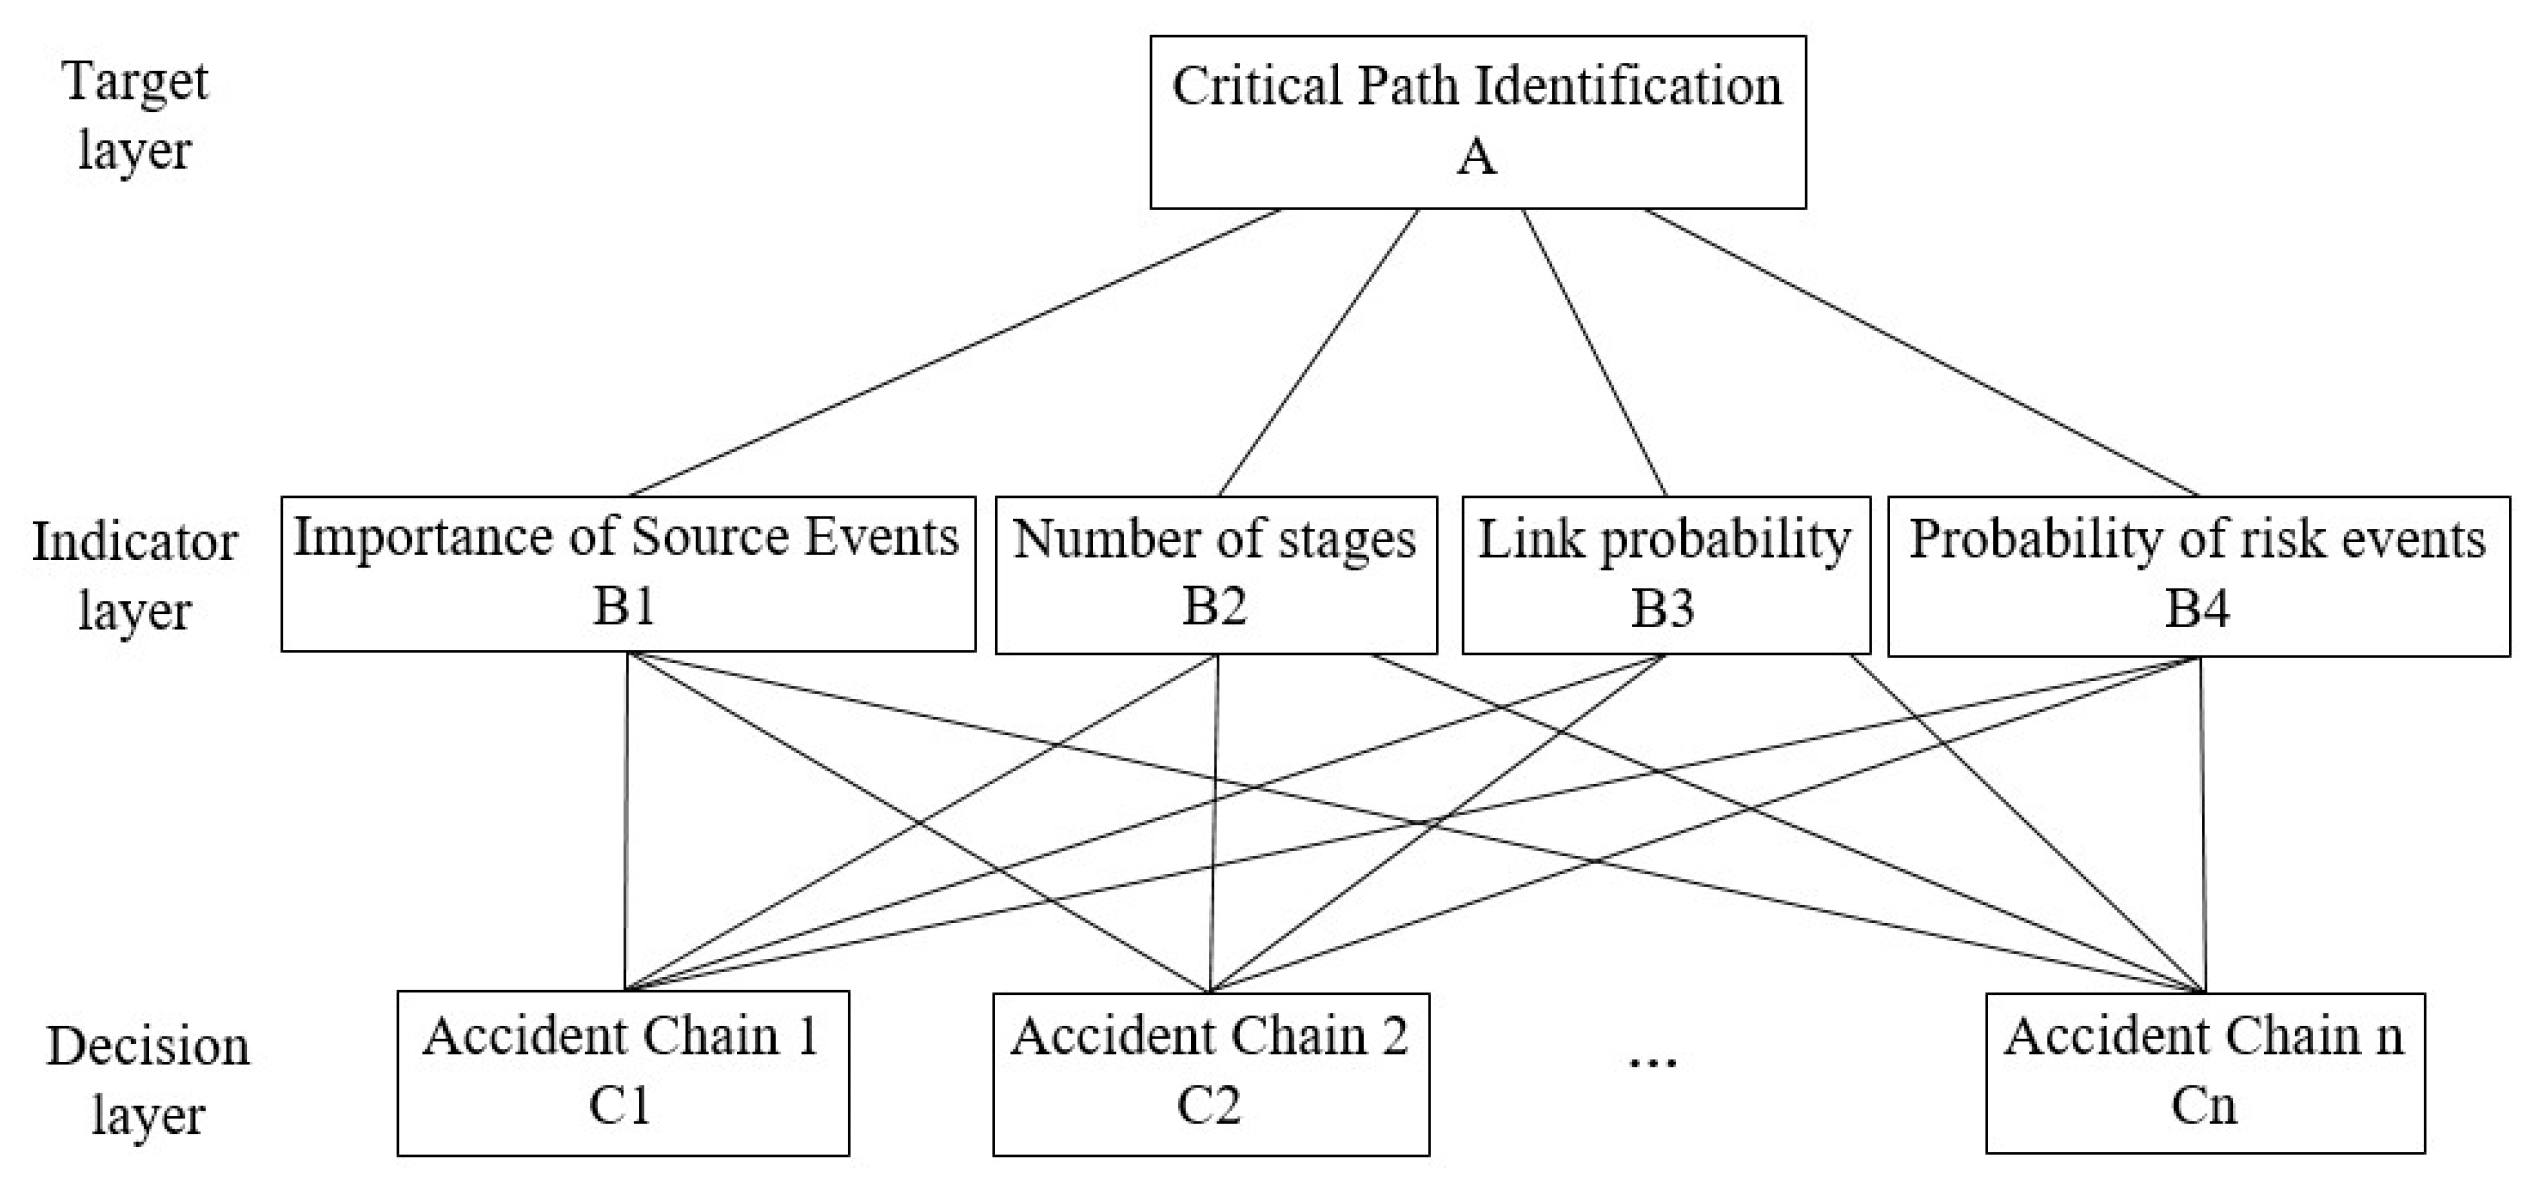
Following the cluster analysis of risk factors, we built the correlation structure of physical information from risk factors to risk events through numerical simulation of the tunnel shield construction process. The analysis involves determining input and output variables and organizing them into a three-level network structure based on logical hierarchy. The network is structured with a target layer (A) representing the overarching goal of critical path identification, an indicator layer (B1–B4) comprising criteria such as importance of source events, number of stages, link probability, and probability of risk events, and a decision layer (C1–Cn) consisting of various accident chains. Weights were assigned using the Analytic Hierarchy Process (AHP), where pairwise comparisons of the indicators were conducted on a 1–9 scale based on expert input and validated data, ensuring a consistency ratio below 0.1. This method systematically prioritizes the indicators relative to the goal, providing a robust and reproducible basis for the weight assignments rather than an arbitrary selection. As shown in Figure 2, the network structure includes the following:
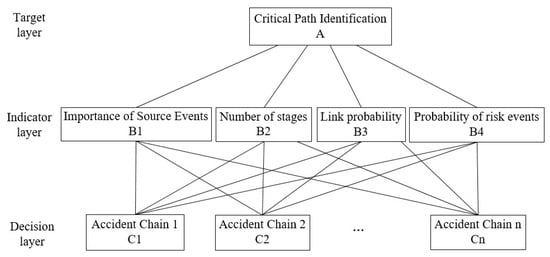
Figure 2.
Physical information three-layer network architecture.
- Target Layer: Identifies key risk events (A).
- Index Layer: Represents attributes such as the importance of the accident chain source event (B1), the number of links (B2), connection probability (B3), and the probability of terminal risk events (B4).
- Decision Layer: Includes feasible schemes to achieve the expected goals.
For the multi-level structure of physical information, logical relationship analysis and the application of the AHP hierarchical analysis method are needed [16]. A matrix composed of the relative importance scale between factors at the same level or between two adjacent levels is called the judgment matrix, and this judgment matrix is the key step for weight calculation and analysis. For this model, the following judgment matrix should be constructed. Judgment matrix A–B: the relative importance of two or more indicators of the index layer for the overall target [16]. This is shown in Table 1.

Table 1.
Physical model and pressure parameters for tunnel shield construction.
The rock mass quality Q was calculated using the six parameters method [27]
where , , , , and represent the rock quality designation, joint set number, joint roughness number, joint alteration number, joint water reduction factor, and stress reduction factor.
where , and represent the weight of the i index in the total target, the relative importance scale between the i index and the j index in the index layer for the total target, and each element of the normalized standard judgment matrix . The matrix determination scaling is shown in Table 2.

Table 2.
Judgment matrix A–B.
Judgment matrix Bk—C: For the index Bk (k = 1, 2, 3, 4), the relative importance of two or more of the decision-making schemes is taken into account.
where , and represent the weight of the i-th scheme in kth index, the relative importance scale between the i-th scheme and the j-th scheme for the kth index in index layer, and the elements of the normalized criterion judgment matrix .
2.4. Risk Early Warning
Based on the analyzed model, we establish a logical relationship from risk factors to risk events using weight analysis. This allows us to rank accident chains from highest to lowest risk, selecting the highest scoring chains for targeted early warning and prevention. By focusing on key nodes from risk factors to risk events, we ensure effective risk management and mitigation.
To ensure the effectiveness of the risk early warning module, the system integrates real-time data acquisition and continuous model updating, enabling the timely detection of emerging hazards. Once a risk threshold is exceeded, the module automatically issues graded alerts—ranging from early reminders to urgent warnings—through on-site display terminals, mobile notifications, and control room systems. Corresponding response protocols are pre-defined for each alert level, including immediate on-site inspections, suspension of high-risk operations, deployment of mitigation measures, and escalation to project management. This rapid feedback loop ensures that warnings are not only issued promptly but are also accompanied by clear, actionable steps, thereby enhancing the practical value of the risk management framework and improving accident prevention in construction projects.
3. Case Study
3.1. Project Background
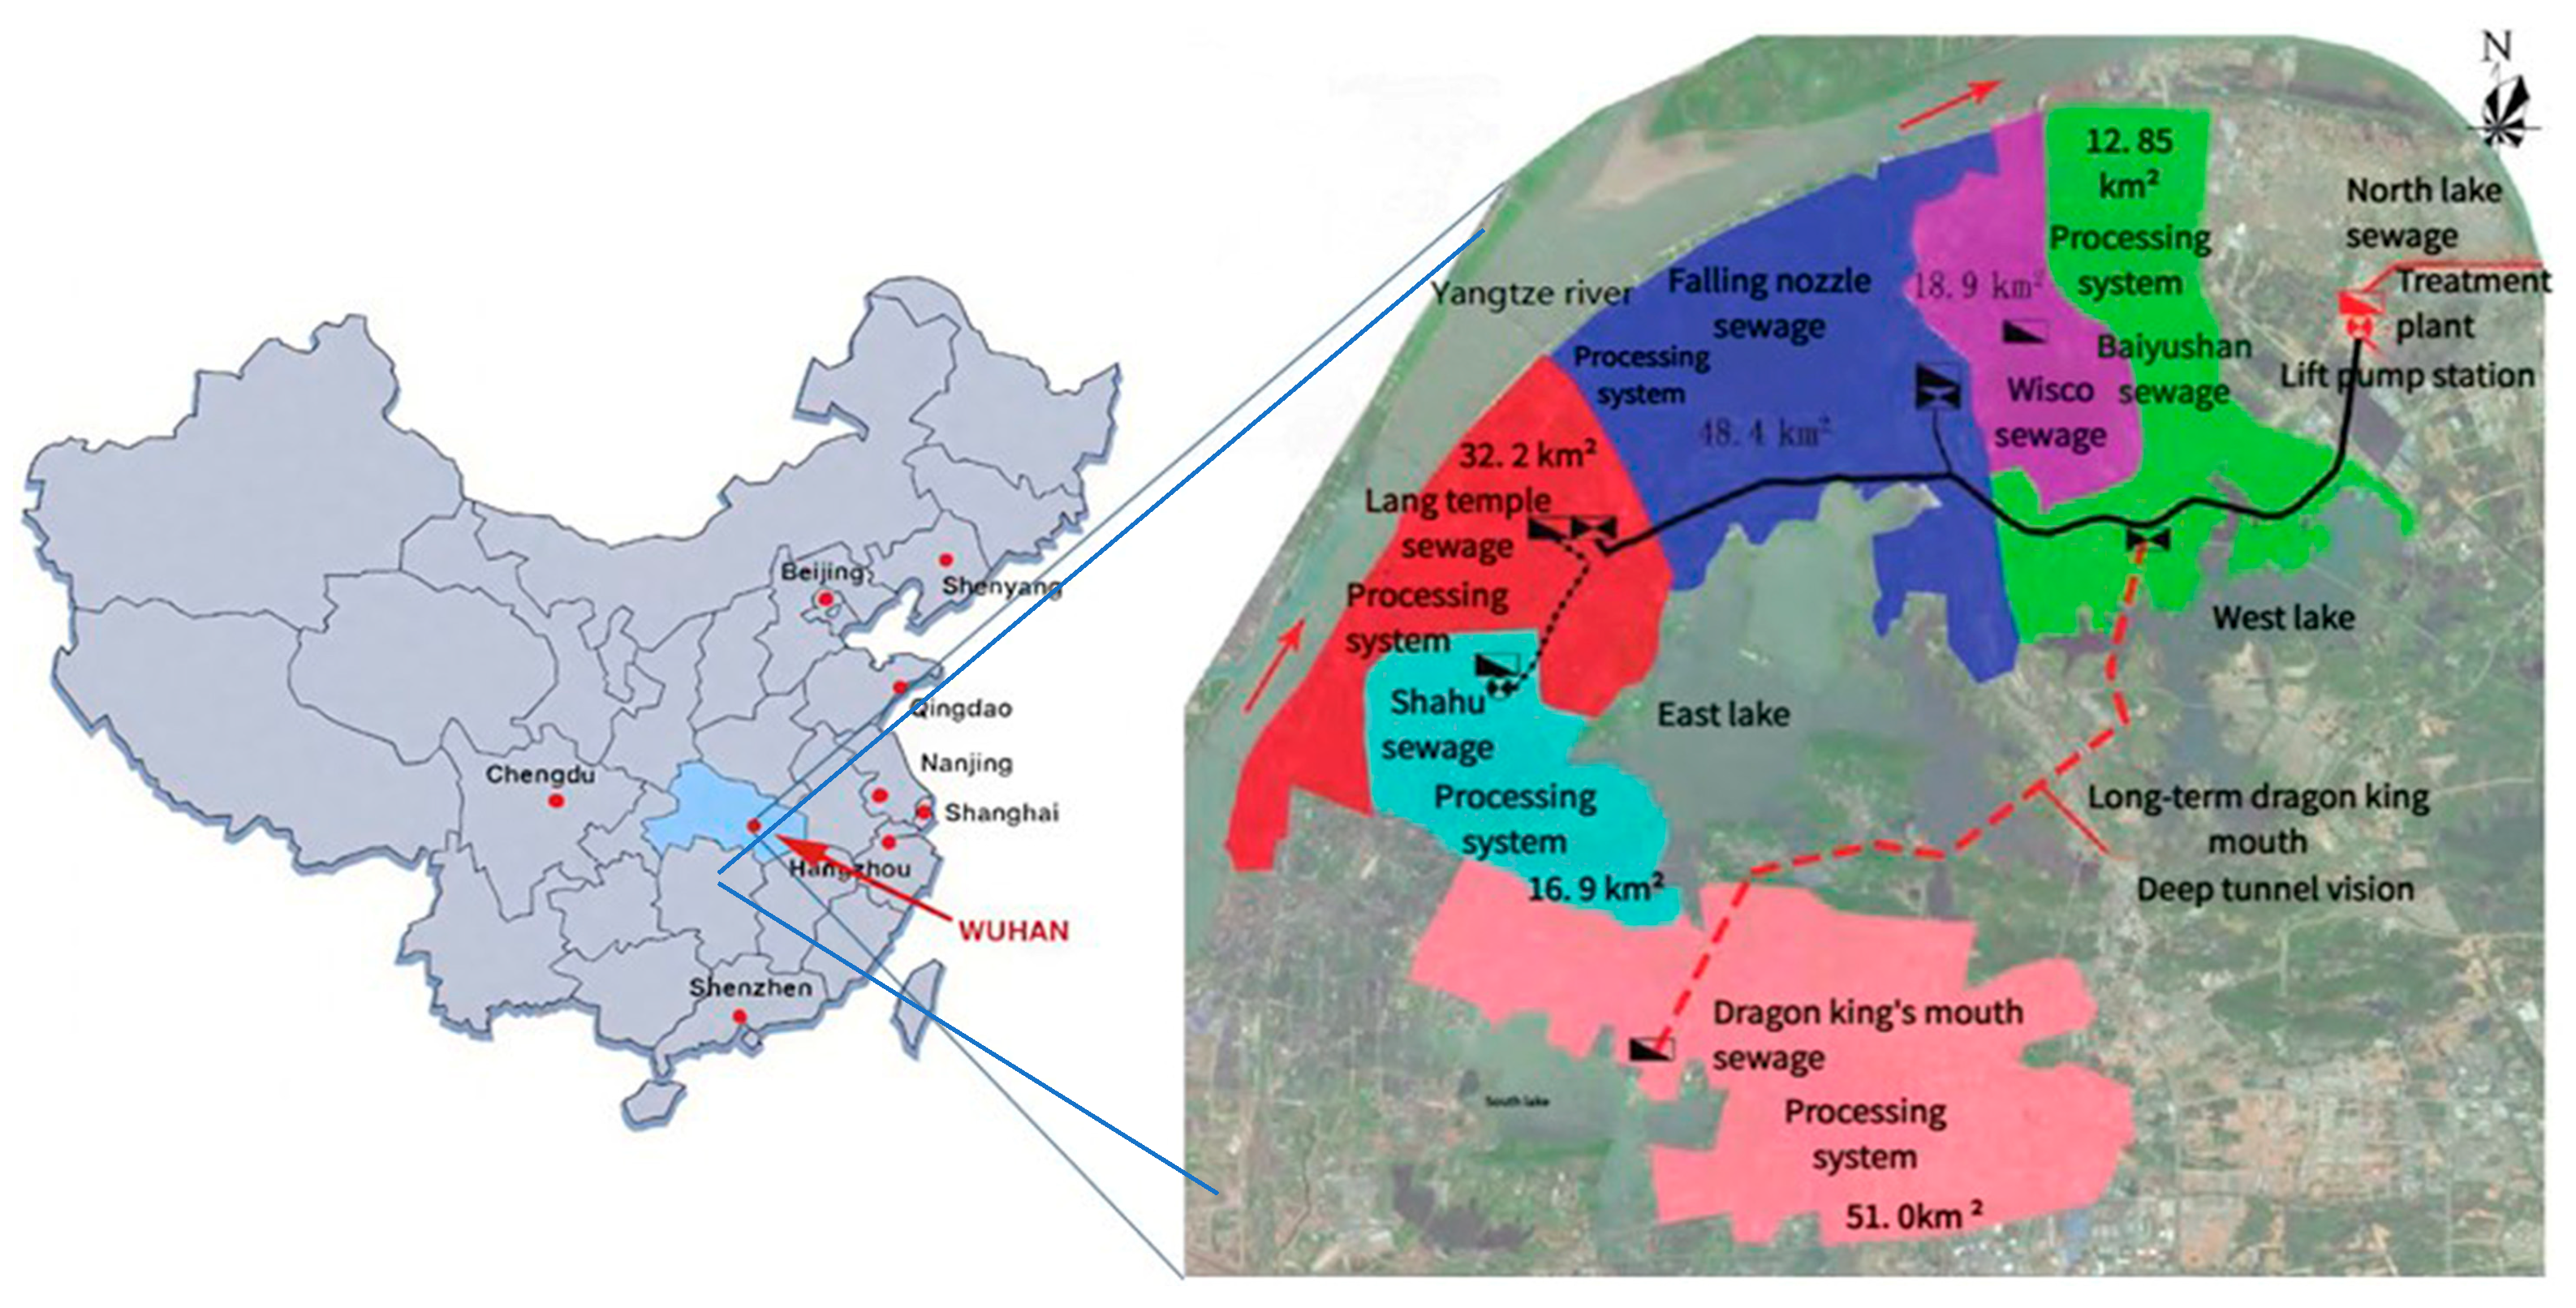
This study focuses on the Wuhan East Lake core area, and specifically the East Lake Deep Tunnel project. The main tunnel spans the Wuchang, Hongshan, and Qingshan districts, as well as the East Lake Scenic Area, connecting the Erlang Temple, Luobuzui, and Wudong pretreatment stations with the Beihu Sewage Treatment Plant. The tunnel is 17.5 km long, with an average depth of 30–50 m, and was fully constructed using a shield machine, as shown in Figure 3.
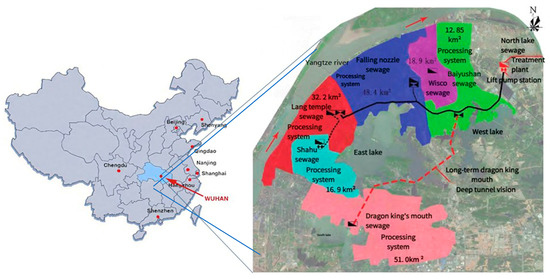
Figure 3.
Project schematic.
The shield machine is received at a shaft located 32 m underground, at the interface between a water-rich sand layer and a rock layer. The construction uses an “underwater receiving” method common in cross-river tunneling: the shaft is filled with approximately 20 m of water, about 4000 m3, to balance internal and external water pressure, after which the shield machine assembles tunnel segments. Gaps are then grouted to prevent groundwater infiltration, and the shaft is finally drained to expose the machine.
The project includes a total curve length of 734.727 m, a minimum turning radius of 300 m, and an internal diameter of 3.4 m, which distinguishes it from conventional subway tunnels that are typically shorter by 1–2 km, wider by 5–8 m in diameter, and shallower by 10–20 m in depth.
Data for this study were obtained from the shield construction monitoring system, geotechnical investigation reports, and daily construction monitoring records. To ensure reliability, raw data underwent preprocessing: invalid data were removed, and tunneling parameters from the segment assembly, standby, and test tunneling stages were excluded due to zero or human-influenced operation. Selected preprocessed data related to geological conditions, tunnel geometry, shield operation factors, and safety indices are summarized in Table 3.

Table 3.
Selected project construction data.
Here H, E, C, Φ, P, PS, SC, TC, TJ, ST, PG, AG, GS, and Sf represent the tunnel cover depth, compression modulus, cohesion, internal friction angle, density, soil bin pressure, cutterhead rotation speed, cutterhead torque, jack thrust, tunneling speed, grouting pressure, grouting amount, ground settlement, and segment floating. A more detailed explanation of these input parameters is given as follows.
H represents the depth of the tunnel from the ground surface (in meters), a key geometric parameter influencing the overburden pressure and stress distribution. E represents the stiffness of the soil under compressive loading, a critical factor influencing ground settlement and segment floating. C represents the weighted mean cohesion of the soil layers (in kPa), indicating the shear strength of the soil due to internal bonding forces. Φ represents the weighted mean internal friction angle of the soil layers (in degrees), describing the soil’s resistance to shear stress due to friction between particles. P represents the weighted mean density of the soil layers (in g/cm3). PS represents the pressure in the soil bin of the earth pressure balanced shield machine (in bar), controlling the stability of the excavation face and minimizing ground settlement. SC represents the rotational speed of the shield machine’s cutterhead (in rpm), affecting the rate of soil excavation and disturbance. TC represents the torque applied to the cutterhead (in kN·m), indicating the energy required to cut through the soil, which can influence soil stability and settlement. TJ represents the thrust force applied by the shield machine’s hydraulic jacks (in kN), driving the shield forward and affecting soil disturbance and segment stability. ST represents the speed at which the shield machine advances (in mm/min), affecting the rate of soil disturbance and potential for segment floating or settlement. PG represents the pressure applied during grout injection (in bar), ensuring effective filling of voids and influencing the stability of the tunnel structure and surrounding soil. AG represents the volume of grout injected behind the tunnel segments (in m3), used to fill voids and stabilize the surrounding soil. GS represents the output safety index (in mm), which is the vertical displacement of the ground surface due to tunneling. Sf represents the output safety index (in mm), which is the upward displacement of tunnel segments due to buoyancy or soil pressure, critical for tunnel structure safety.
3.2. Index System
For risk definition, the risk in small-diameter tunnel shield construction is defined as the potential for adverse events or conditions that could lead to safety hazards, structural failures, environmental impacts, or project delays during the construction process. These risks are characterized by their likelihood and severity, impacting personnel safety, tunnel structure integrity, and the surrounding environment. The model addresses these risks through a comprehensive framework comprising risk identification, analysis, and early warning modules, focusing on quantifiable safety indices and their contributing factors to enable proactive mitigation and ensure construction safety.
The influencing factors for construction safety risks in small-diameter tunnel shield construction, as outlined in the Risk Identification Module, are categorized into five key aspects: people, machines, materials, methods, and environment. These are identified and organized using the K-means clustering method optimized by the Harris Hawks Optimization (HHO) algorithm to form a comprehensive safety risk index system. In this study, the latest research achievements in the field of engineering safety and technology are systematically reviewed, thereby establishing a comprehensive foundation for subsequent analysis. Building upon these insights, the application, advantages, and limitations of a wide range of technical methods are thoroughly examined, with particular emphasis placed on both their theoretical underpinnings and practical implications. Moreover, different engineering scenarios and problem types are carefully analyzed, while the technical approaches adopted in such contexts are critically assessed in order to highlight their relative suitability and inherent constraints [28,29,30,31,32,33,34,35,36,37,38,39,40,41,42]. Through this in-depth evaluation, attention is directed toward the identification of key risk factors that exert a significant influence on construction safety. On the basis of these findings, the risk factors are rigorously screened, comparatively discussed with reference to prior studies, and finally selected as the principal objects of analysis in the engineering case studies presented herein. Specific factors include the following.
- Personnel: Weak safety awareness, insufficient skills, improper protective measures, and failure to rectify identified hazards among construction personnel and management.
- Machinery: Unreasonable selection or operation of shield machines, cutterhead issues, propulsion or segment assembly system failures, and outdated equipment technology.
- Materials: Substandard quality or damage to tunnel segments, inadequate grouting materials, improper material handling, or insufficient reinforcement quantities.
- Methods: Low maturity of construction techniques (e.g., split launching, secondary lining), incorrect tunneling parameter settings, inadequate safety measures, or insufficient safety investments.
- Environment: Incomplete geological or hydrological data, undetected natural cavities, high groundwater levels, and failure to monitor or address changes in the surrounding environment (e.g., impacts from nearby structures or water bodies).
These factors were derived from clustering analysis to capture their hierarchical correlations and contributions to safety risks, as processed by the Analytic Hierarchy Process (AHP) in the Risk Analysis Module.
Based on the specific construction characteristics of the project, we used a fuzzy K-means cluster analysis method optimized by the HHO algorithm to identify safety risk indicators. These indicators span five aspects, human, machine, material, method, and environment, as detailed in Table 4.

Table 4.
Construction safety risk evaluation indicators for the East Lake Deep Tunnel.
The dataset for the proposed model is prepared by integrating physical simulations with real-world engineering data to generate quantitative indicators for the risk factors and safety indices. The process involves the following.
Physical Simulations: Controlled physical models, such as scaled sandbox or centrifuge tests, are used to simulate small-diameter tunnel shield construction under varying conditions (e.g., different soil types, overburden depths, or groundwater levels). These simulations replicate excavation processes, segment installation, and environmental interactions, capturing responses like ground settlement, segment floating, or soil deformation using sensors (e.g., strain gauges, pressure cells).
Data Collection: Quantitative data from simulations include physical parameters such as material properties (e.g., compression modulus, cohesion, friction angle, density), tunnel geometry (e.g., cover depth), and shield operation parameters (e.g., cutterhead rotation speed, jack thrust, grouting pressure). These are supplemented with real-world data, ensuring a robust dataset.
Preprocessing: The collected data undergoes preprocessing to remove invalid entries. This involves cleaning noise, normalizing values, and selecting key variables using feature engineering to align with the risk index system established via K-means clustering and AHP.
Validation: The dataset is validated against real-world case histories and augmented with synthetic data if needed to enhance model training. The dataset is split into training and testing subsets, with techniques like k-fold cross-validation applied to ensure generalization, as seen in similar ML-based studies.
3.3. Risk Assessment
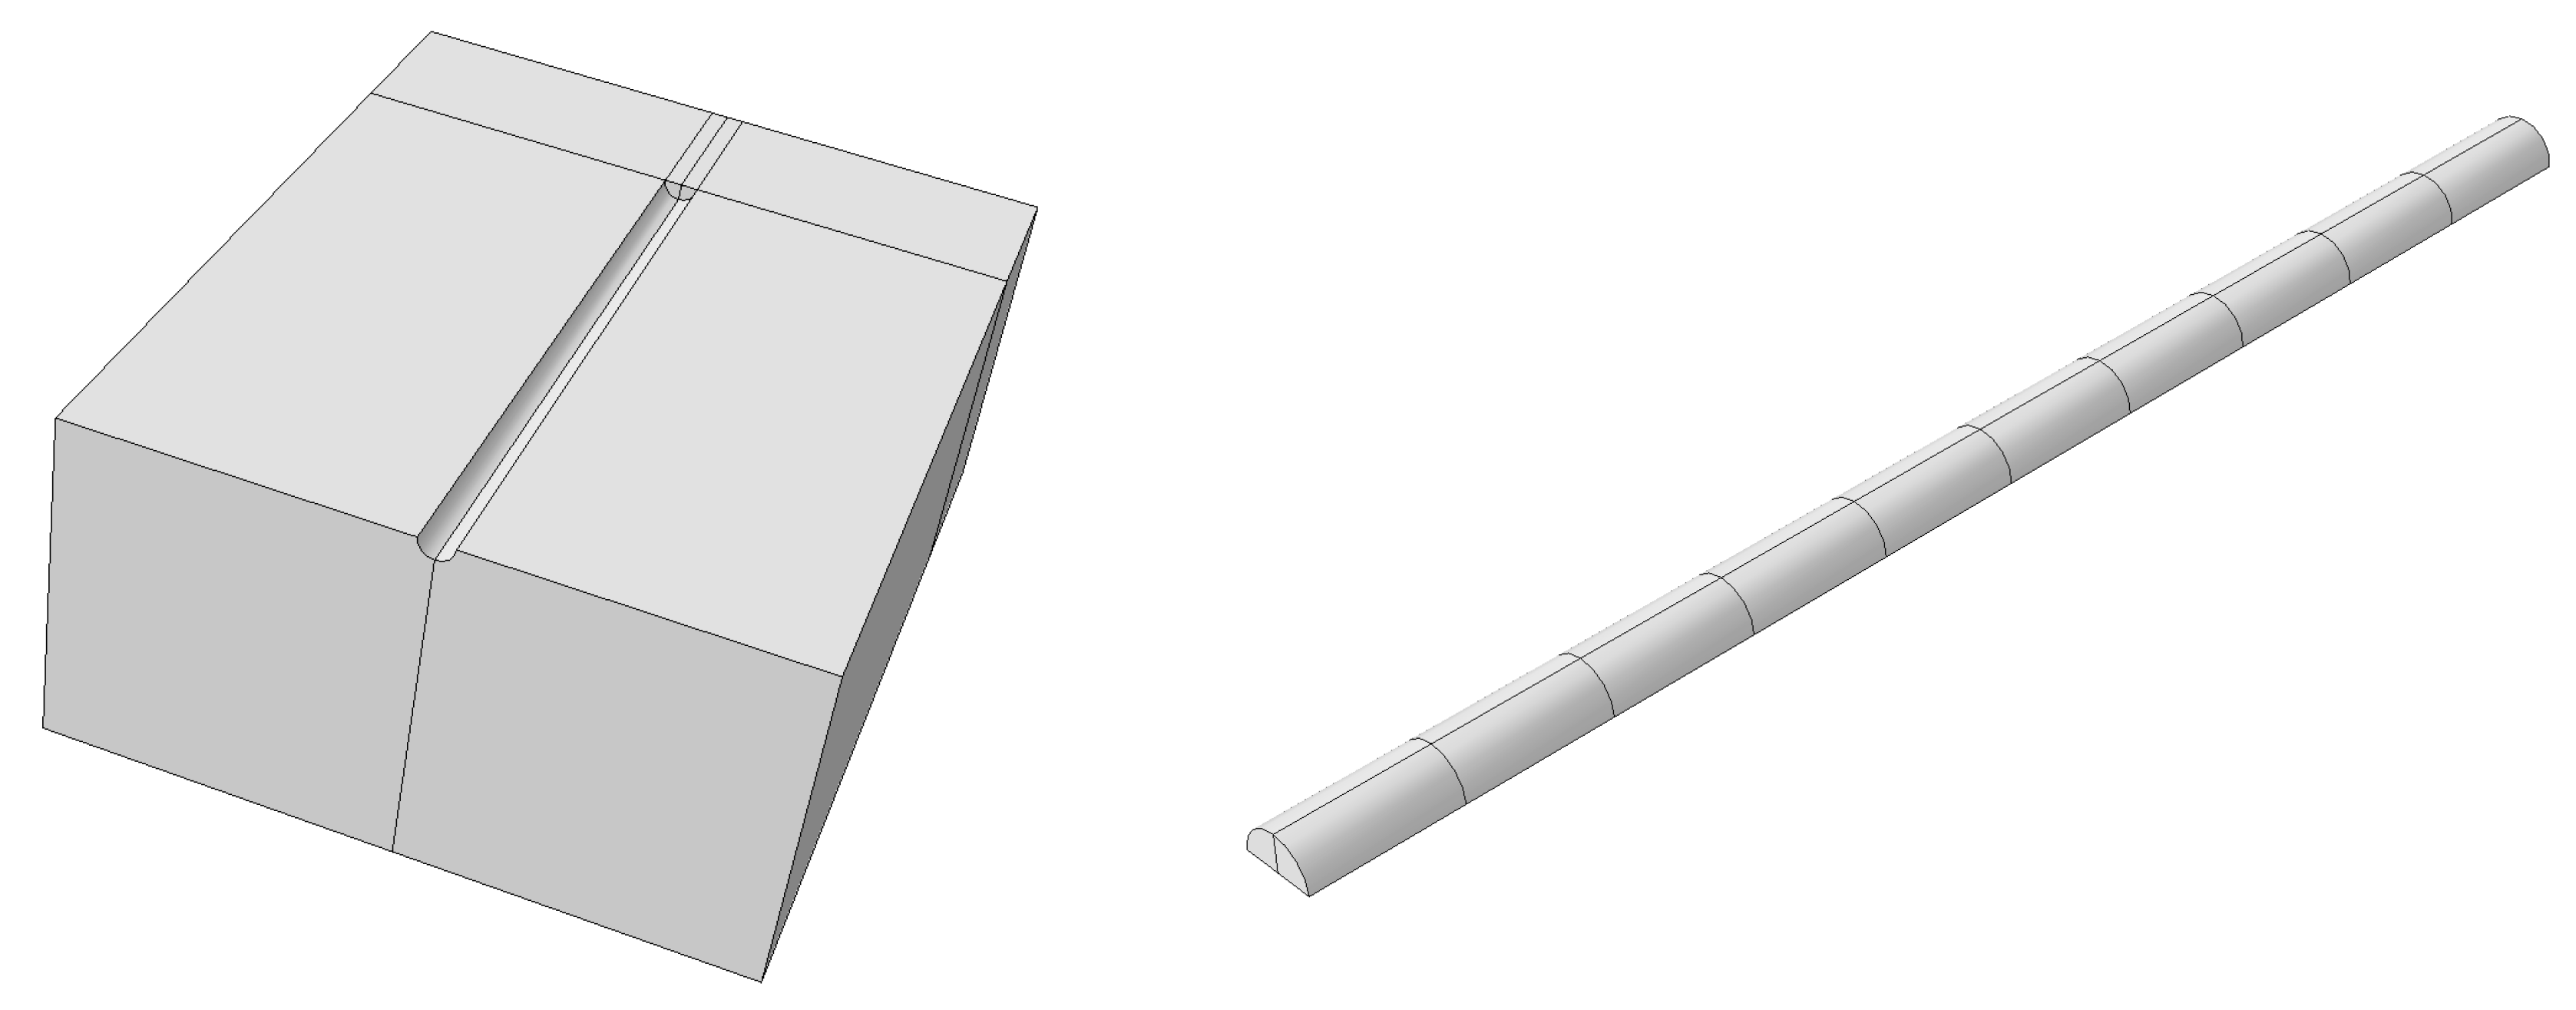
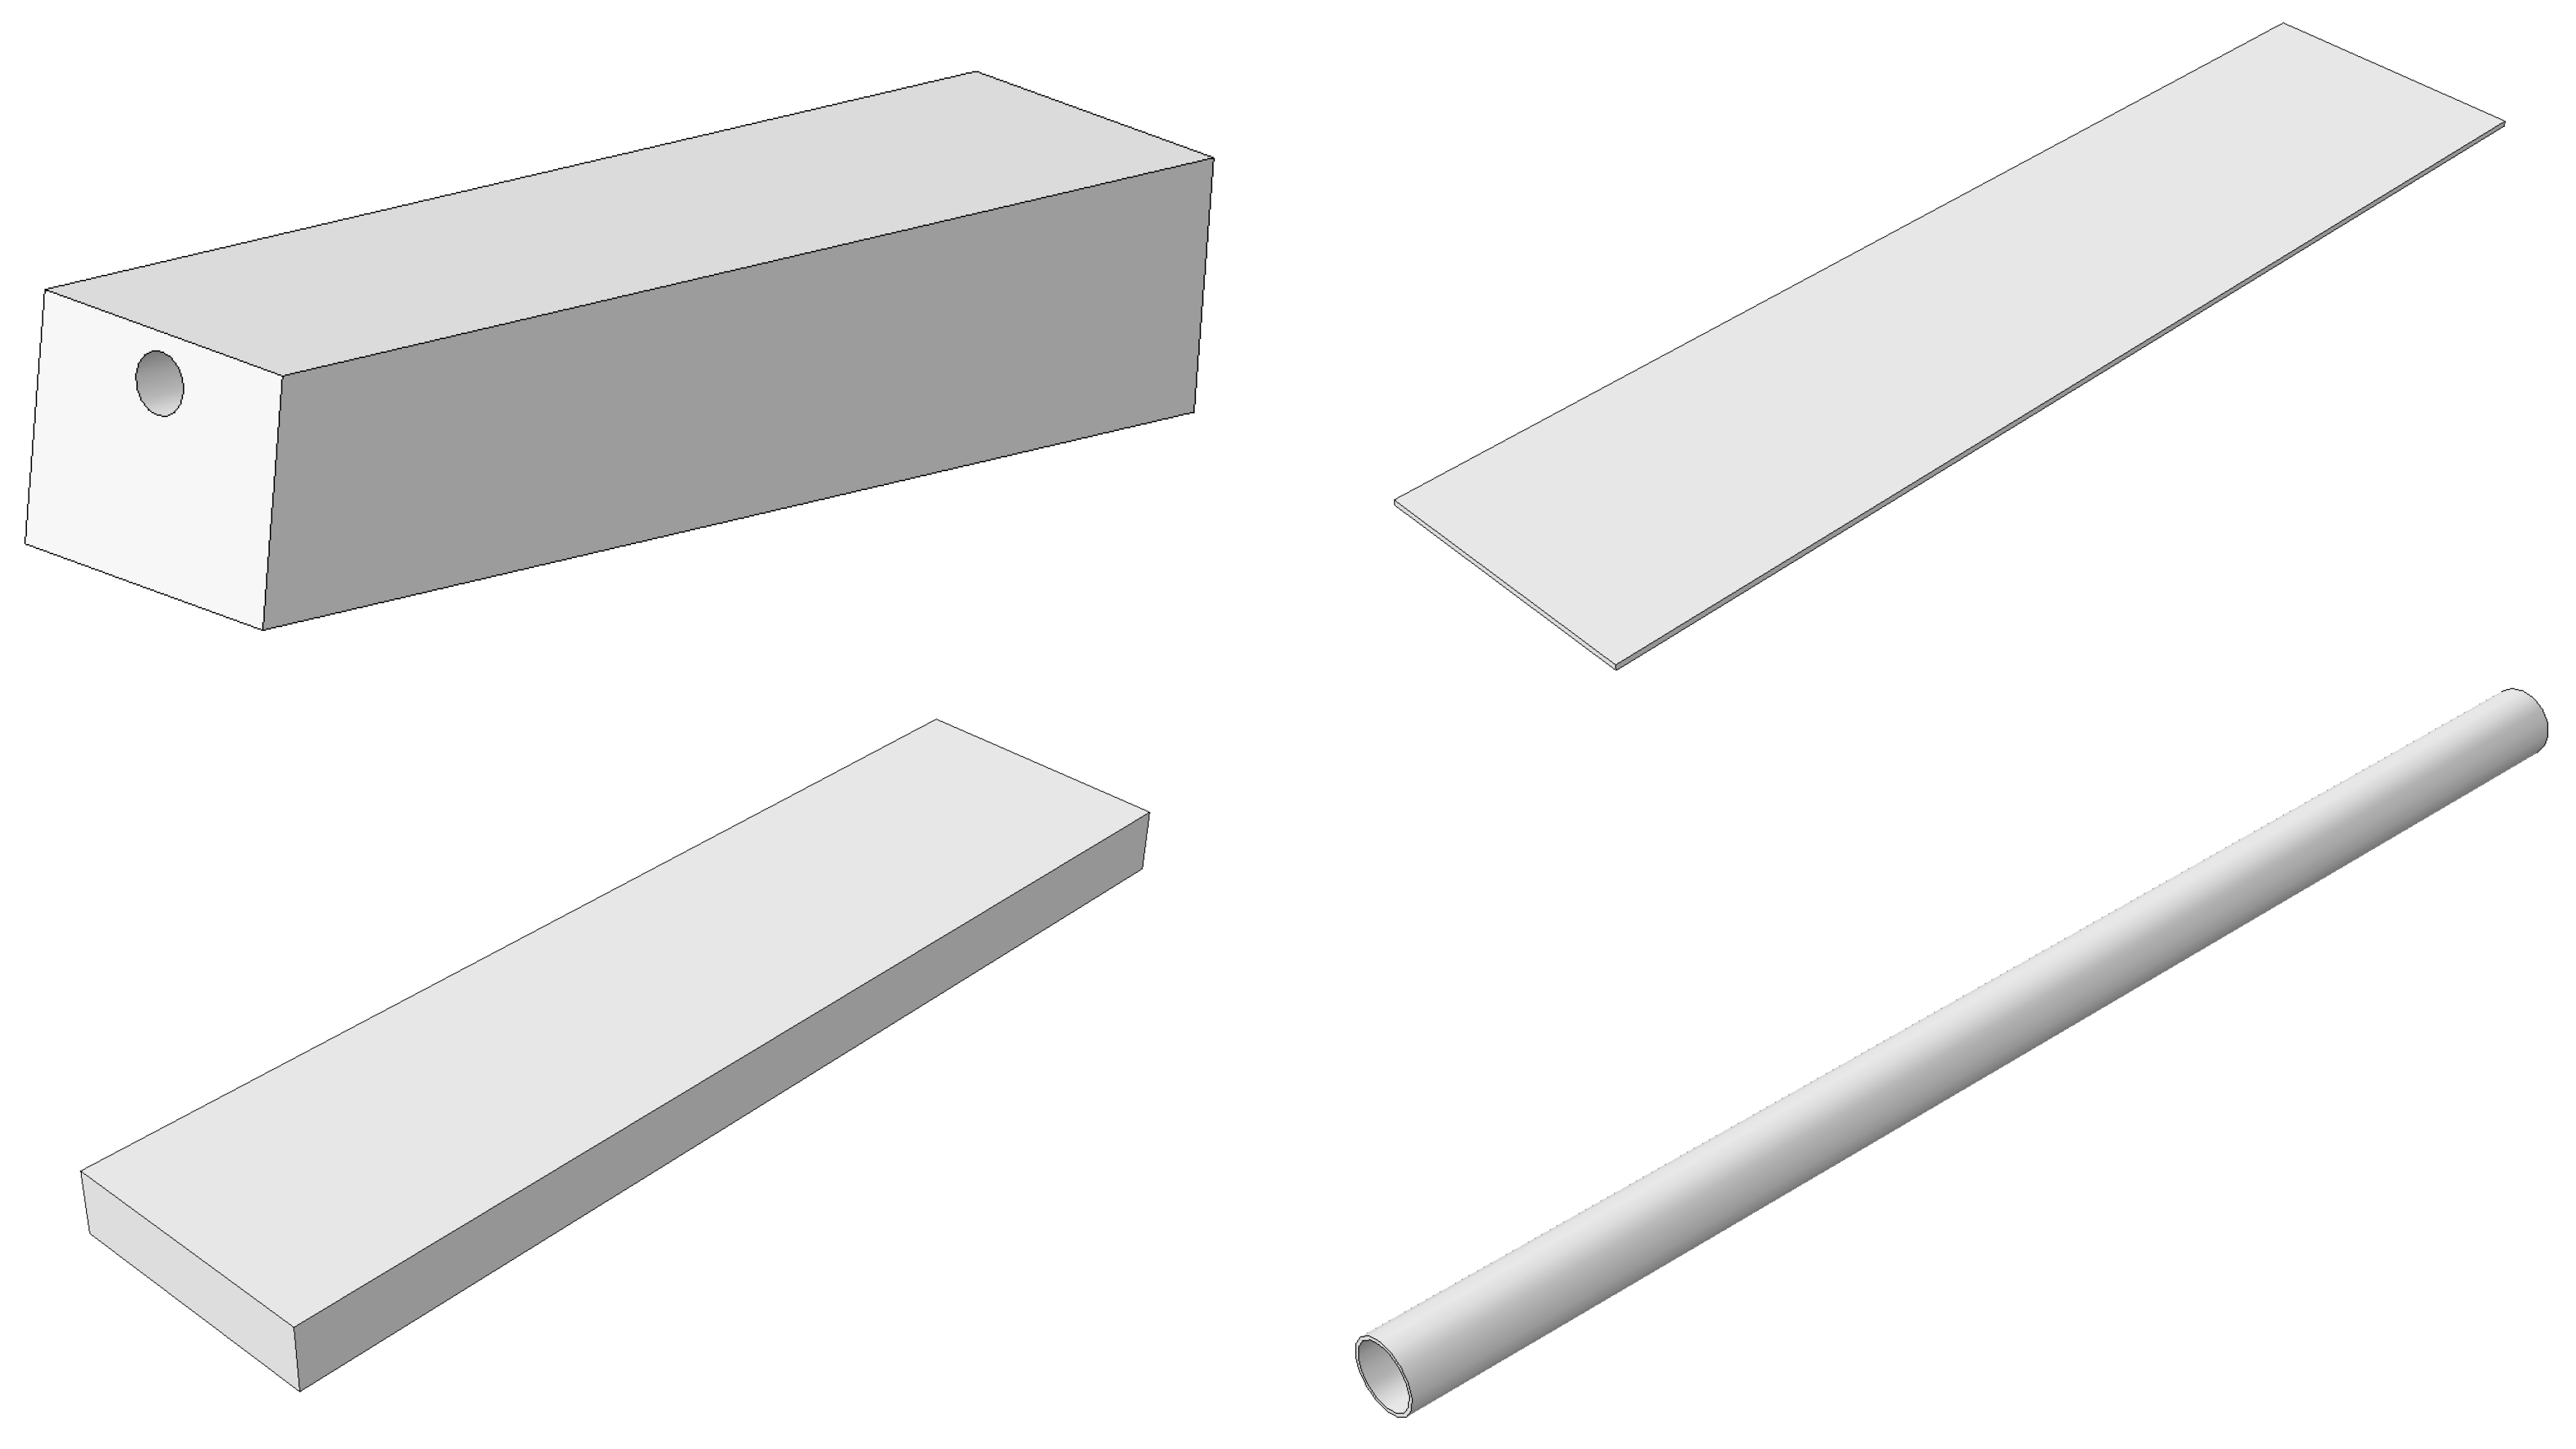
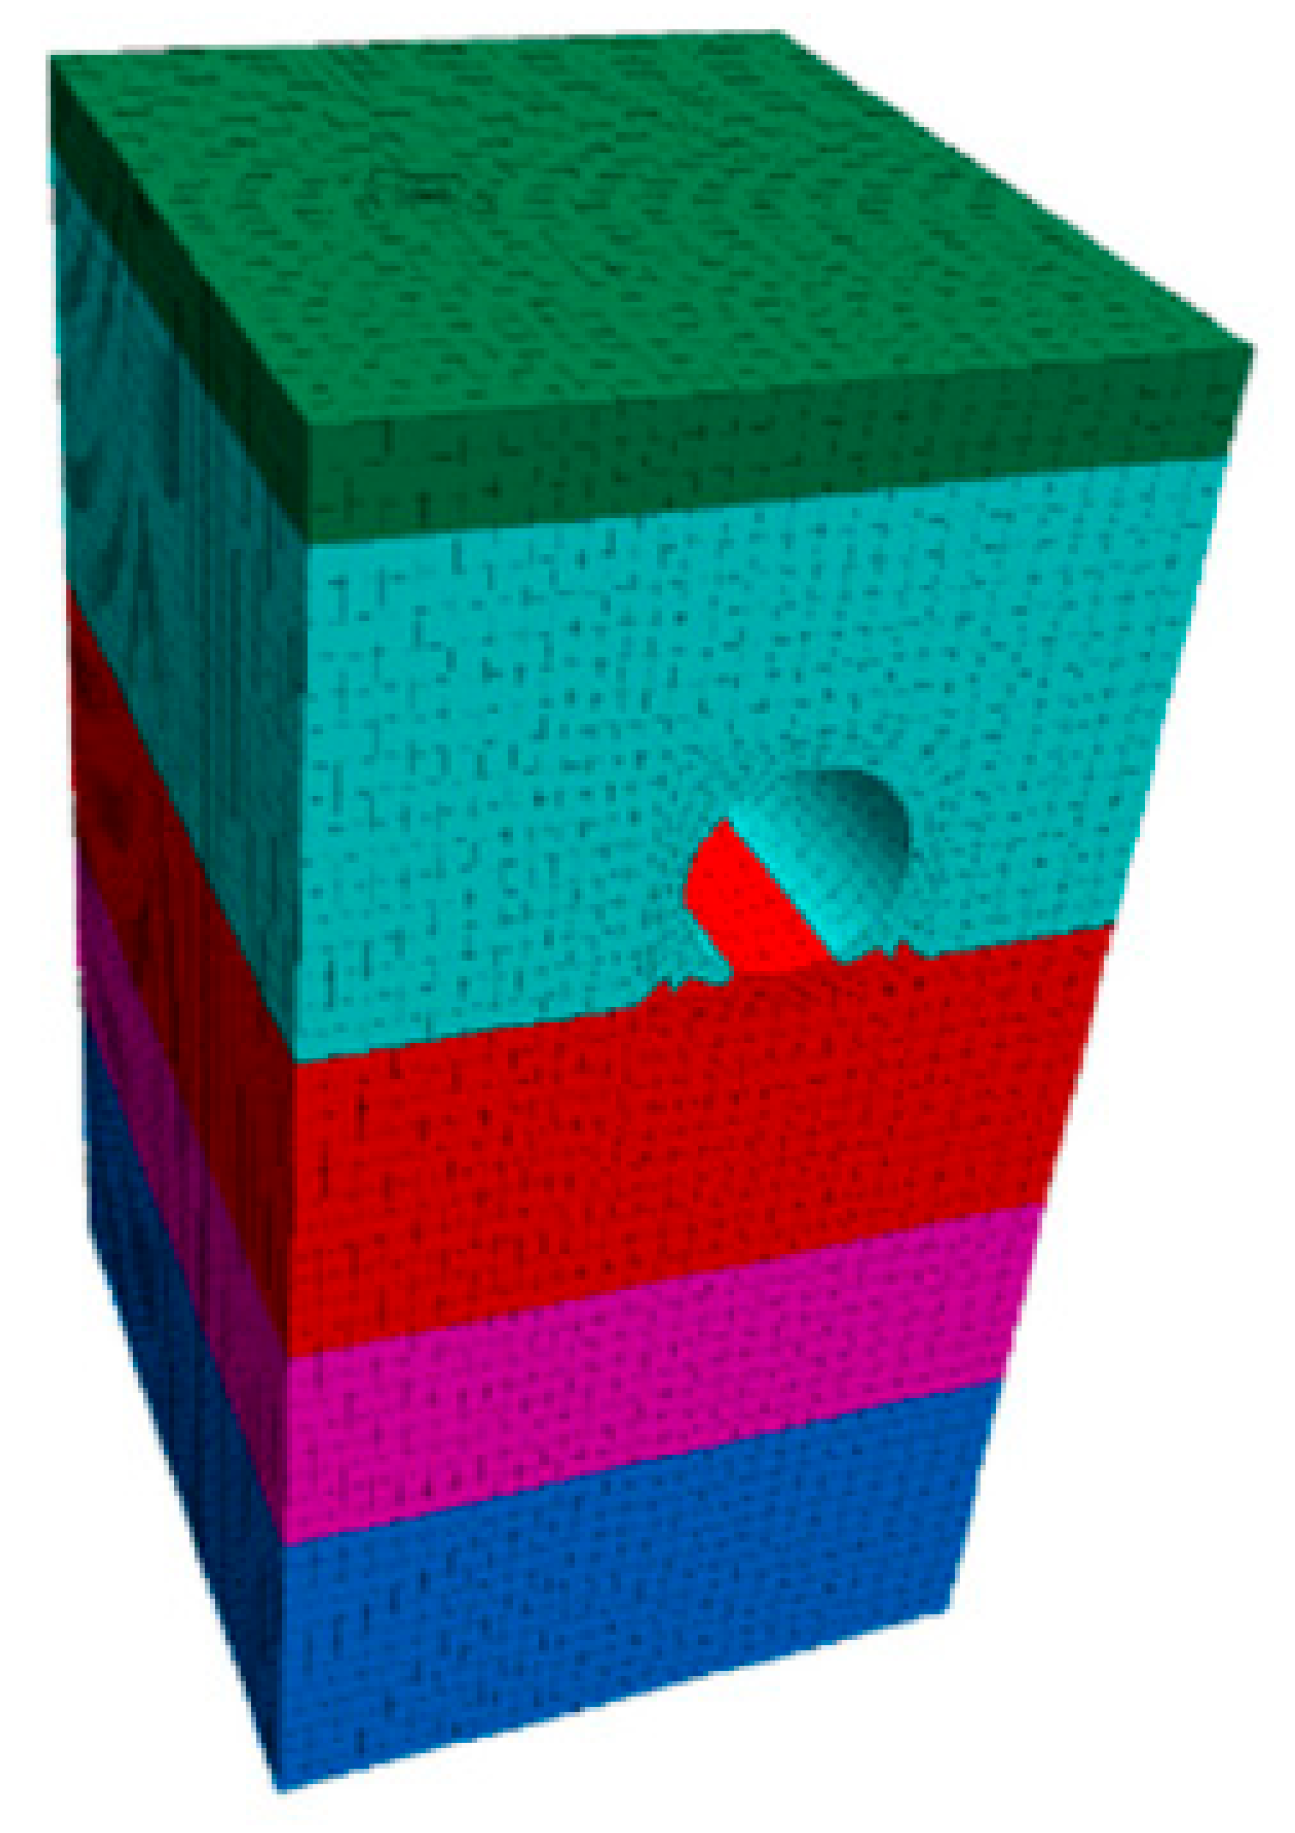
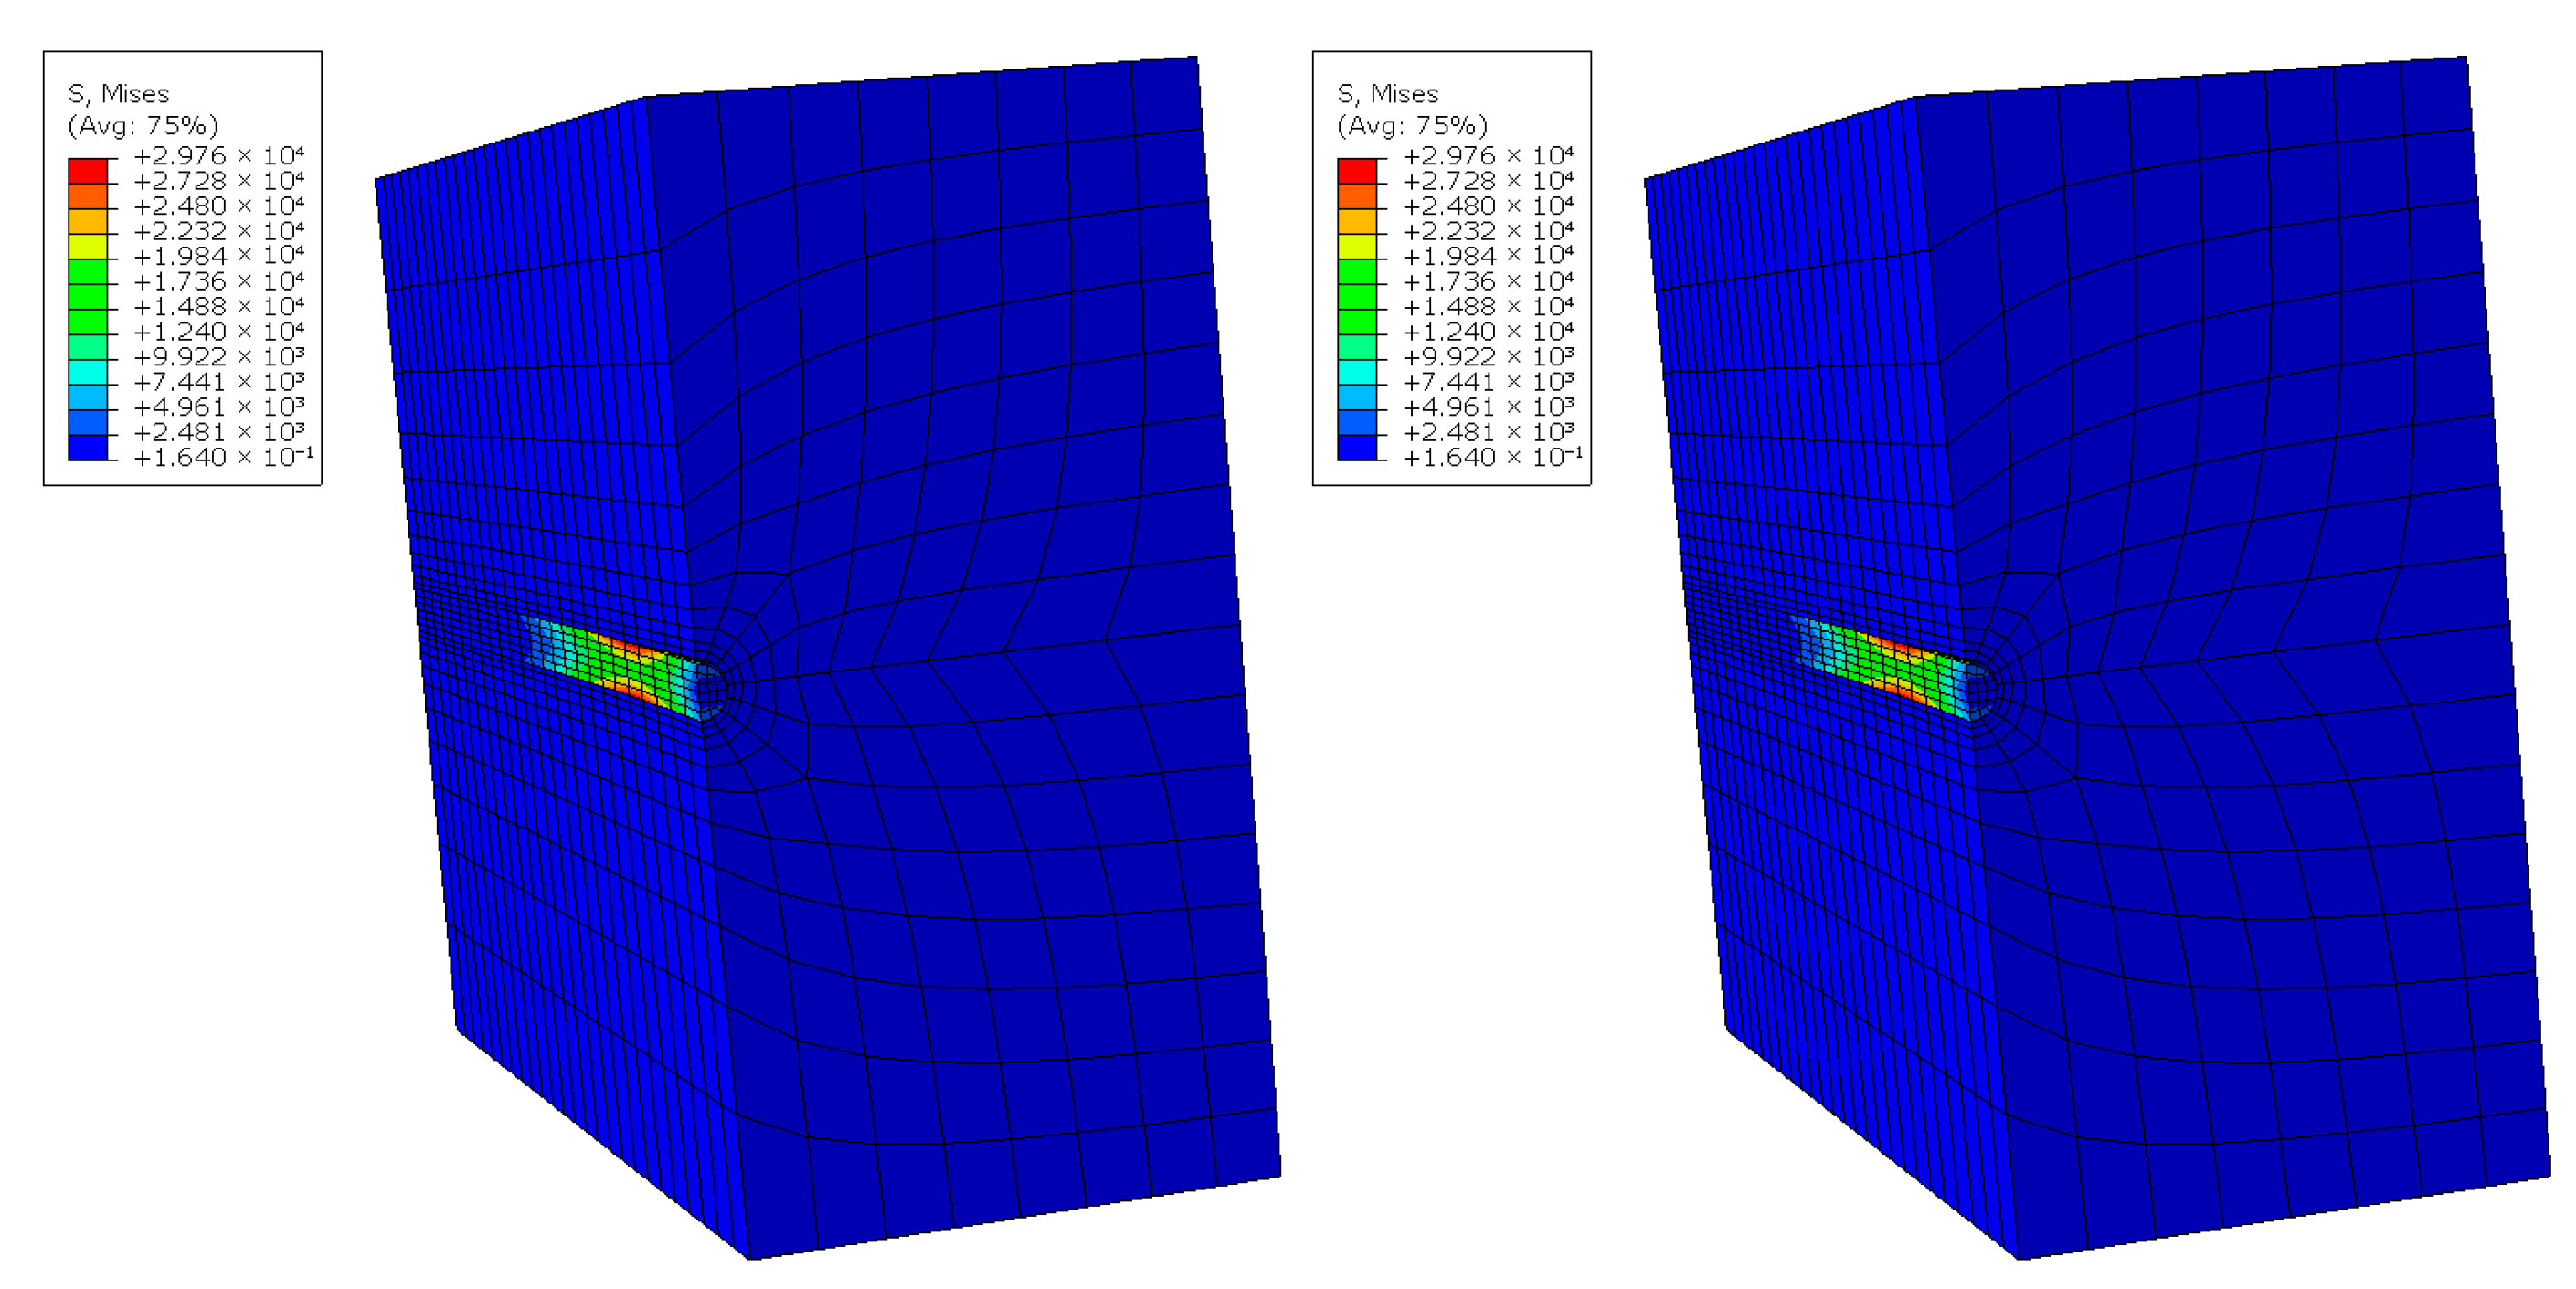
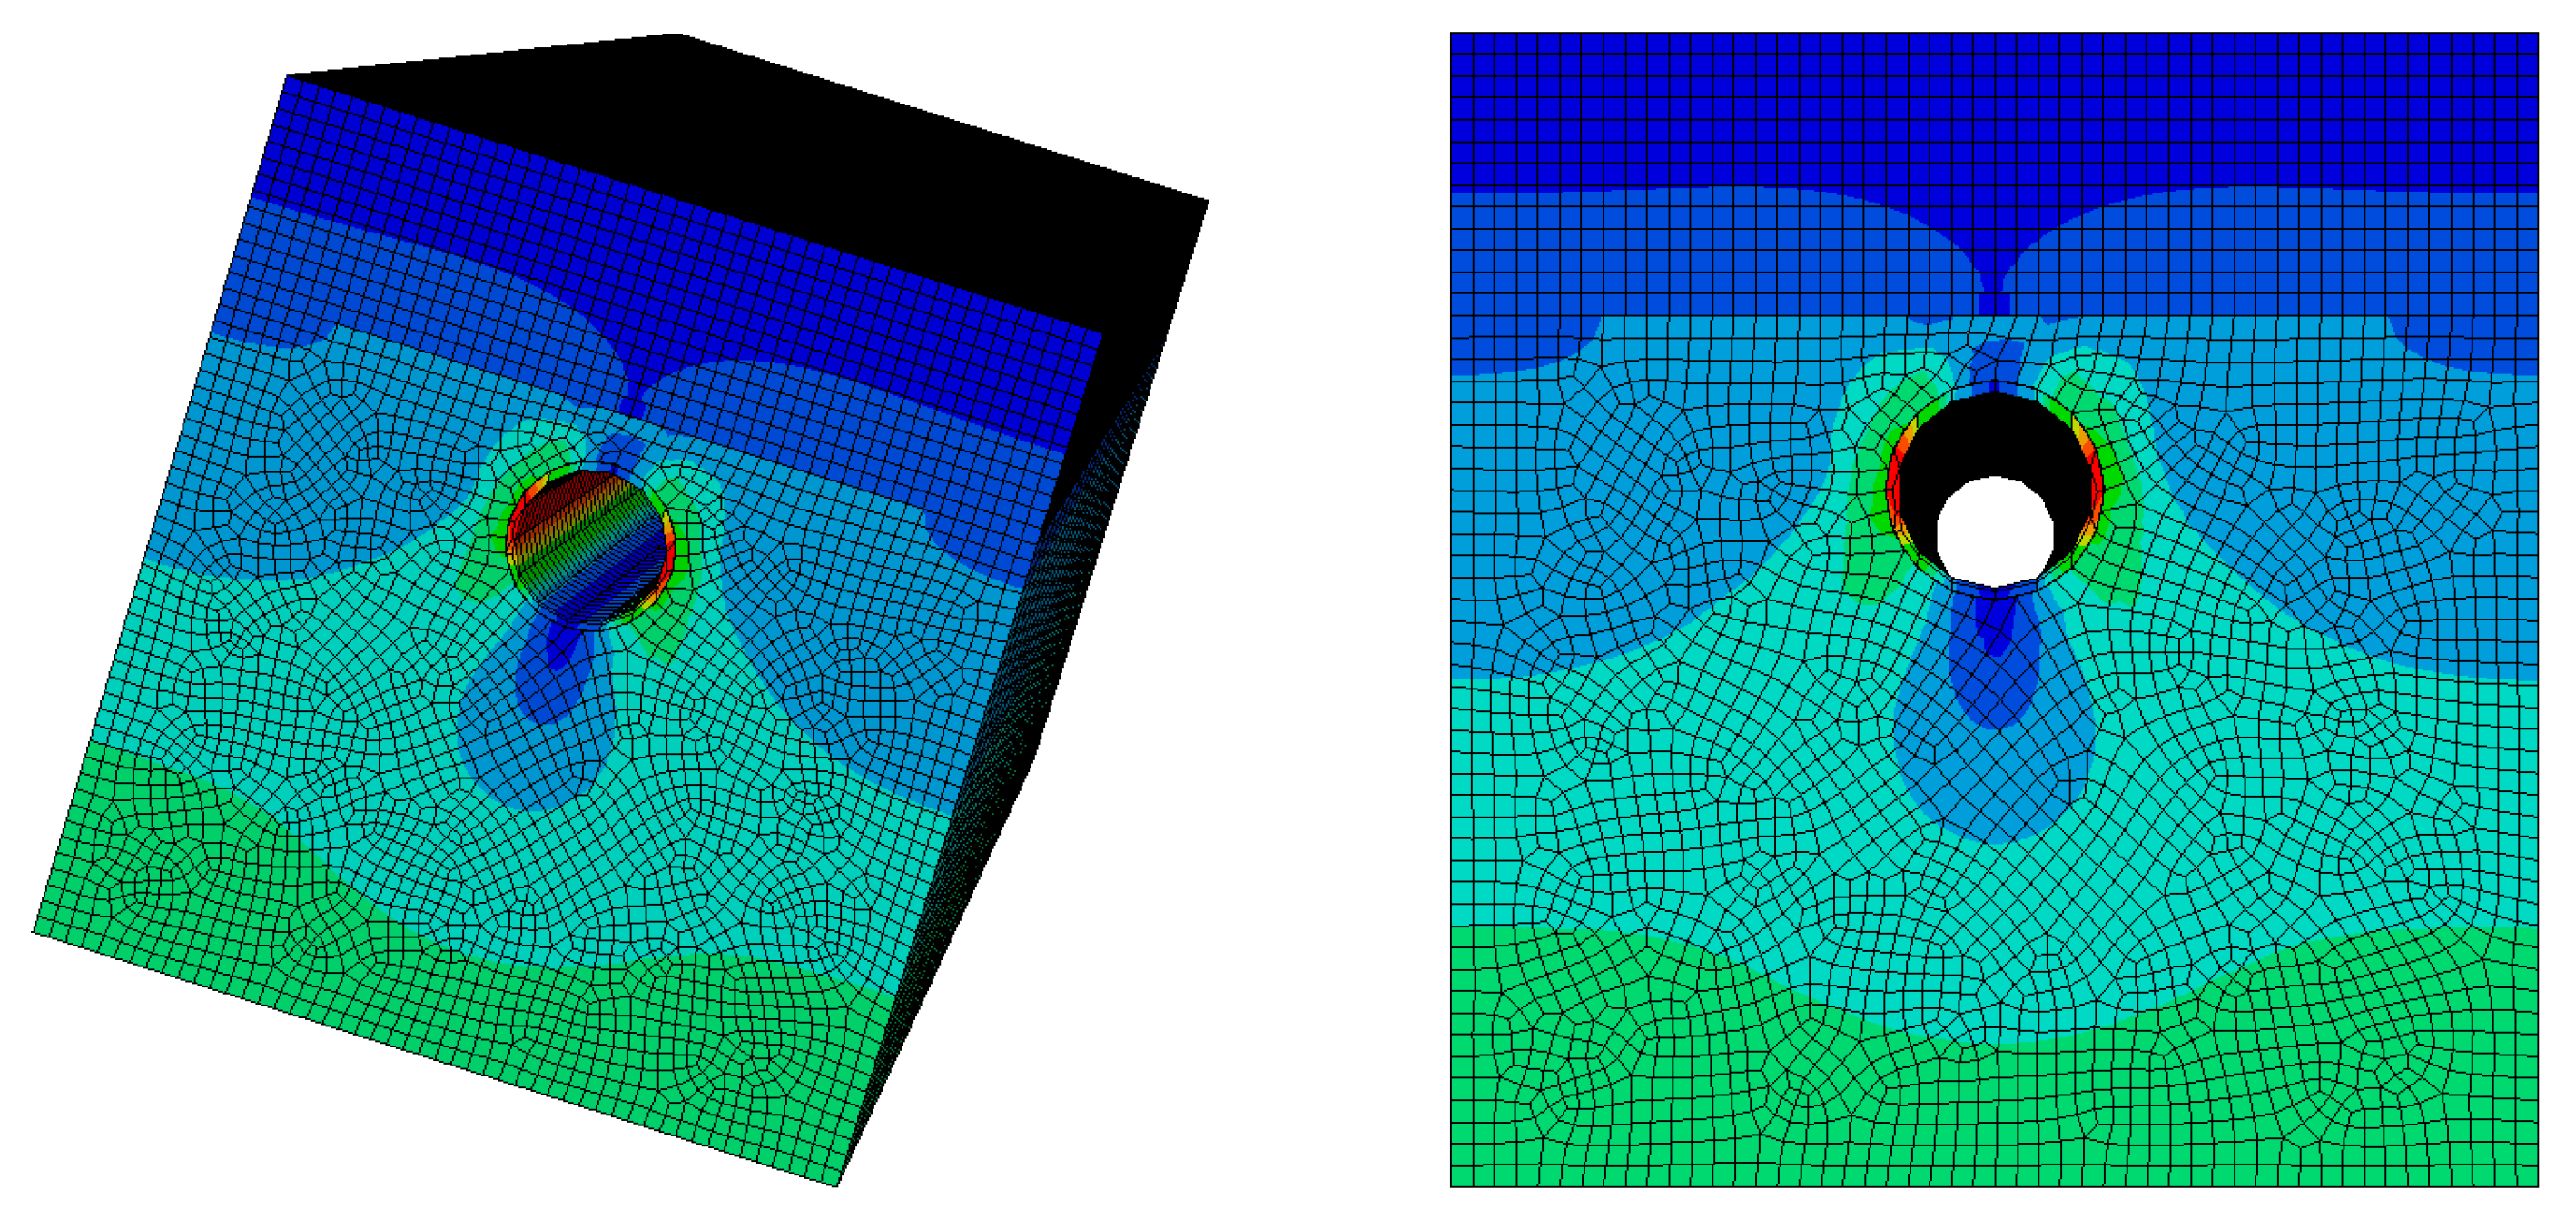
Using the identified risk factor index system, we established a logical hierarchy between risk factors and risk events. Through numerical simulation of the shield construction process using Abaqus (v2022), we analyzed the physical model and its input variables. The numerical model simulates the construction process of an urban small-diameter tunnel shield, analyzing stress and deformation. To simplify the complex soil structure, we separately constructed the surrounding rock and soil body and tunnel excavation components, assigning appropriate material attributes, as shown in Figure 4, Figure 5, Figure 6, Figure 7 and Figure 8.
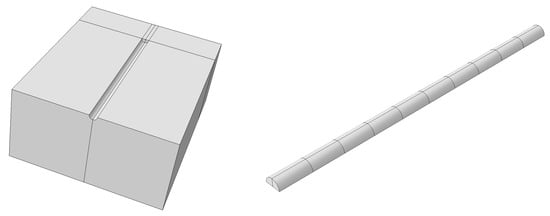
Figure 4.
Model of each component I.
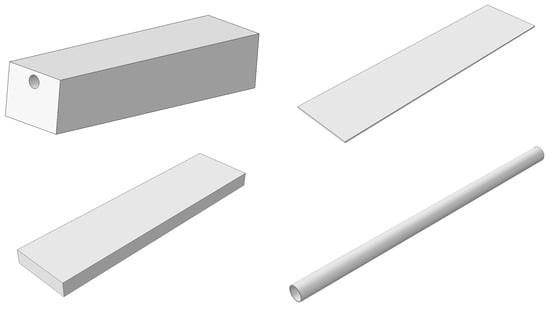
Figure 5.
Model of each component II.
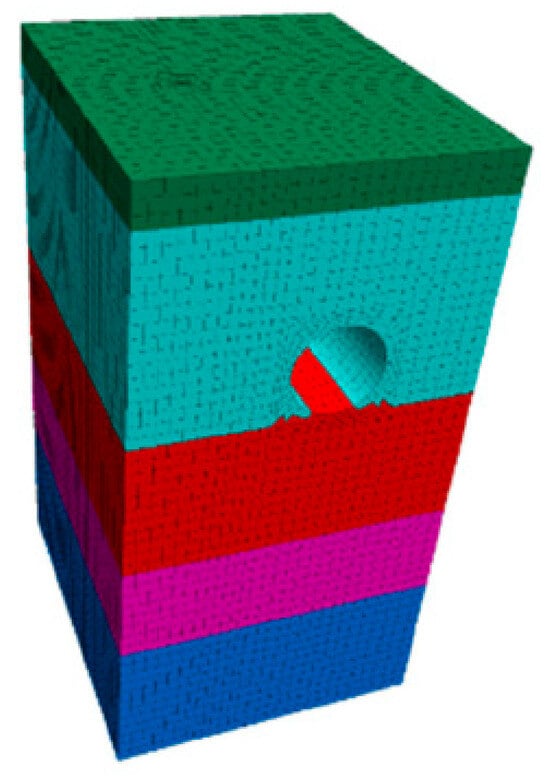
Figure 6.
Integral model of components.
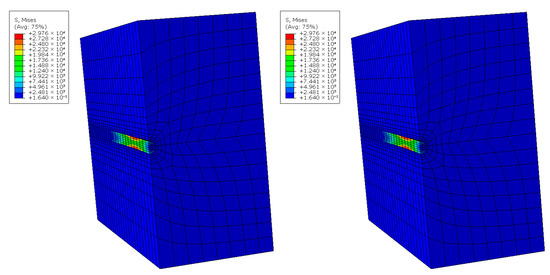
Figure 7.
Stress and deformation during tunnel shield construction I.
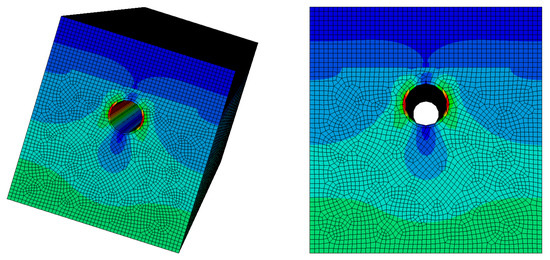
Figure 8.
Stress and deformation during tunnel shield construction II.
The components were assembled, with corresponding boundary conditions and constraints applied. Gravity load and uniform pressure were applied to the top of the soil to calculate structural deformation and stress. The resulting stress and deformation data, along with construction data from Table 5, were used to evaluate construction risks using the method proposed in Section 2. The top eight construction risk factors were ranked as follows.

Table 5.
Top eight combinations of factors for construction risk.
The analysis revealed that inadequate safety awareness among shield engineering managers, insufficient shaft engineering safety protection, vertical deviation of steel molds, segment quality issues, improper material stacking, outdated segment installation technology, immature reverse technology, and incomplete geological and hydrological information were the primary contributors to production accidents. The combination of these risks significantly increases the likelihood of major accidents during construction. Therefore, measures must be taken across the five aspects of human, machine, material, method, and environment to mitigate these risks and prevent accidents.
4. Results and Discussion
The evaluation model for small-diameter tunnel construction risks was applied to the Wuhan East Lake Deep Tunnel project. According to the calculation results, the critical risk path was identified as A11, A23, B13, B22, C12, C23, D15, D21, E13, and E22. These paths represent the most influential accident chains within the risk system, and their presence highlights the multifaceted nature of safety challenges in the shield construction of small-diameter deep tunnels. The findings indicate that the safety risks of this project can be summarized into five major categories: personnel, machinery, materials, methods, and environment.
- (1)
- Personnel risks were characterized by weak safety awareness among management staff, insufficient training, and inadequate protection measures for workers operating in vertical shafts. Unlike large-diameter tunnel projects where working conditions allow better supervision and safer evacuation, the narrow space in small-diameter projects magnifies the potential consequences of human error. The lack of robust safety culture and systematic training not only increases the probability of accidents but also exacerbates their severity when combined with other risk factors such as equipment failure or environmental hazards.
- (2)
- Machinery risks mainly manifested in failures of the shield machine’s segment assembly system and deviations in the verticality of fixed steel molds. These mechanical issues are closely tied to the confined workspace and the higher precision required in small-diameter tunnels. Compared with large-diameter projects, where equipment has greater stability and redundancy, small-diameter shield machines are more vulnerable to installation deviations and system malfunctions. These technical deficiencies can compromise construction efficiency, induce structural deformation, and ultimately jeopardize tunnel safety.
- (3)
- Materials risks emerged in the form of substandard segment quality and the improper stacking of construction materials on vertical shaft operation platforms. The narrow space for storage and transportation within the shaft increases the likelihood of damage, mishandling, and contamination of materials. Furthermore, insufficient inspection and quality control procedures aggravate these risks. In contrast to large-diameter tunnels where storage areas and handling systems are more standardized, small-diameter tunnels require stricter protocols to ensure material reliability and prevent cascading effects on structural stability.
- (4)
- Methods risks were associated with the use of outdated or immature techniques, including deficiencies in negative ring segment installation and the low maturity of reverse construction methods. These technical shortcomings reveal a gap between the rapid development of shield technology and its practical application in small-diameter tunnels. Due to the complex geometry, small turning radii, and delicate operational demands of small tunnels, conventional methods may not be directly applicable. The adoption of unverified or poorly adapted methods can easily lead to construction deviations, safety incidents, or long-term performance issues.
- (5)
- Environment risks were identified as incomplete knowledge of engineering geological and hydrological conditions, as well as the inability to promptly respond to changes in the surrounding environment of vertical shafts. Small-diameter tunnels are particularly sensitive to local variations in geology and groundwater because of their limited reinforcement capacity and smaller excavation face. Unanticipated water inflow, soil deformation or ground settlement can quickly escalate into significant safety hazards. Compared with large-diameter tunnels, which are often supported by more comprehensive monitoring systems, small-diameter projects require tailored survey methods and adaptive risk management strategies.
The interconnections among these five categories of risks are particularly noteworthy. For instance, inadequate personnel awareness and training may increase the likelihood of mechanical failures, while the adoption of underdeveloped construction methods may result in inferior material performance. Similarly, insufficient protection for workers combined with adverse environmental conditions amplifies the risks of improper material handling and installation deviations. These interdependencies highlight the systemic nature of construction safety risks, where isolated problems can propagate along accident chains and trigger compound failures.
From a practical perspective, the analysis underscores the urgent need to adopt advanced and mature construction technologies specifically suited to small-diameter tunnels. Restricted operational space, the necessity for high-precision operations, and complex alignment requirements demand a more integrated approach to risk management. The following recommendations are proposed:
- (1)
- Personnel factors: Safety training should be institutionalized as a mandatory requirement, complemented by daily awareness briefings and strict supervisory mechanisms. This approach would not only enhance vigilance but also reduce the frequency of operational errors under confined conditions.
- (2)
- Machinery factors: Preventive measures such as routine maintenance schedules, pre-installation deviation checks, and real-time monitoring of shield equipment should be standardized. These steps would improve equipment reliability and reduce the probability of mechanical breakdowns.
- (3)
- Materials factors: Quality inspections must be enforced at multiple stages, from delivery to installation. Standardized storage and handling protocols should be established, with continuous monitoring to ensure that segment integrity and material conditions meet project specifications.
- (4)
- Methods factors: Updated construction techniques should be introduced and validated through pilot applications and expert reviews. Only proven methods adapted to the unique challenges of small-diameter projects should be employed.
- (5)
- Environment factors: Comprehensive pre-construction geological and hydrological investigations should be carried out, supplemented by adaptive contingency plans for managing unforeseen environmental changes during construction.
In summary, the results demonstrate that the construction safety of small-diameter shield tunnels is influenced by a network of interdependent risk factors. The confined working space, limited error tolerance, and complex environmental interactions amplify the risks compared with large-diameter tunnel projects. The proposed evaluation model not only identifies the most critical risk paths but also provides practical guidance for targeted interventions. By focusing on personnel training, equipment reliability, material quality, methodological innovation, and environmental adaptability, the overall safety performance of small-diameter deep tunnel construction can be significantly enhanced.
5. Conclusions
This paper focuses on the safety evaluation of urban small-diameter tunnel shield construction. Traditional methods often lack clear physical logic and perform poorly in complex risk scenarios. To address this, we propose a hybrid model that integrates physical information with data-driven analysis. Applied to a real engineering case, the model evaluates construction safety risks across five dimensions—human, machine, material, method, and environment—identifying the most critical risk factor combinations and recommending targeted mitigation measures. The main conclusions are as follows:
- The most dangerous combination of risk factors involves inadequate personnel safety awareness and protection, mechanical system failures and installation deviations, substandard material quality and improper stacking, outdated or immature construction technology, and environmental risks such as unknown hydrology and surrounding conditions.
- Risk factors across human, machine, material, method, and environment dimensions are interrelated, exhibiting causal correlations rather than acting in isolation.
- Small-diameter tunnel shield construction features—such as limited operating space, complex operations, and small turning radius—require careful consideration of advanced and mature construction technologies to ensure safety and efficiency.
- Risk mitigation strategies include the following:
- (a)
- Personnel: Mandatory safety training and daily awareness briefings.
- (b)
- Machinery: Routine maintenance, pre-installation deviation checks and real-time monitoring.
- (c)
- Materials: Strict quality inspections and standardized stacking procedures.
- (d)
- Methods: Adoption of updated, tested, and mature construction technologies.
- (e)
- Environment: Comprehensive pre-construction hydrological and geotechnical surveys, with adaptive contingency plans.
By integrating these strategies into a phased risk-management framework, monitored through periodic audits, the hybrid model can dynamically optimize safety during urban small-diameter tunnel shield construction.
Author Contributions
Conceptualization, K.H.; methodology, K.H. and J.W.; validation, J.W.; formal analysis, K.H.; data curation, K.H. and S.G.; writing—original draft preparation, K.H.; writing—review and editing, Y.W. and K.H.; project administration, J.W. All authors have read and agreed to the published version of the manuscript.
Funding
This research was funded by Science and Technology Plan Project of Hubei Provincial Department of Education in 2022, grant number B2022215.
Data Availability Statement
The original contributions presented in the study are included in the article, and further inquiries can be directed to the authors upon reasonable request.
Acknowledgments
The authors gratefully acknowledge the support received from the Science and Technology Plan Project of Hubei Provincial Department of Education. My deepest gratitude goes to the experts for their support and guidance. They have put forward many beneficial suggestions during the whole process of writing this paper.
Conflicts of Interest
The authors declare no conflicts of interest.
References
- Fathipour-Azar, H. Multi-level Machine Learning-Driven Tunnel Squeezing Prediction: Review and New Insights. Arch. Comput. Methods Eng. 2022, 29, 5493–5509. [Google Scholar] [CrossRef]
- Sheil, B.B.; Suryasentana, S.K.; Mooney, M.A.; Zhu, H. Machine learning to inform tunnelling operations: Recent advances and future trends. Proc. Inst. Civ. Eng.-Smart Infrastruct. Constr. 2020, 173, 74–95. [Google Scholar]
- Pan, Y.; Fu, X.; Zhang, L. Data-driven multi-output prediction for TBM performance during tunnel excavation: An attention-based graph convolutional network approach. Autom. Constr. 2022, 141, 104386. [Google Scholar] [CrossRef]
- Huang, M.Q.; Ninić, J.; Zhang, Q.B. BIM, machine learning and computer vision techniques in underground construction Current status and future perspectives. Tunn. Undergr. Space Technol. Inc. Trenchless Technol. Res. 2021, 108, 103677. [Google Scholar] [CrossRef]
- Wang, J.; Liu, J.; Wei, Q.; Wang, P. Risk Assessment Based on Combined Weighting-Cloud Model of Tunnel Construction. Teh. vjesnik. 2021, 28, 203–210. [Google Scholar]
- Fu, X.; Wu, M.; Tiong, R.L.K.; Zhang, L. Data-driven real-time advanced geological prediction in tunnel construction using a hybrid deep learning approach. Autom. Constr. 2023, 146, 104672. [Google Scholar] [CrossRef]
- Yu, G.; Lin, D.; Wang, Y. Digital Twin-enabled and Knowledge-driven decision support for tunnel electromechanical equipment maintenance. Tunn. Undergr. Space Technol. Inc. Trenchless Technol. Res. 2023, 140, 105318. [Google Scholar] [CrossRef]
- Marcher, T.; Erharter, G.H.; Winkler, M. Machine Learning in tunneling—Capabilities and challenges. Geomech. Tunn. 2020, 13, 191–198. [Google Scholar] [CrossRef]
- Karniadakis, G.E.; Kevrekidis, I.G.; Lu, L.; Perdikaris, P.; Wang, S.; Yang, L. Physics-informed machine learning. Nat. Rev. Phys. 2021, 3, 422–440. [Google Scholar] [CrossRef]
- Ge, S.; Gao, W.; Cui, S.; Chen, X.; Wang, S. Safety prediction of shield tunnel construction using deep belief network and whale optimization algorithm. Autom. Constr. 2022, 142, 104488. [Google Scholar] [CrossRef]
- Zhang, J. Research and Application of K-Means Clustering Algorithm. Master’s Thesis, Wuhan University of Technology, Wuhan, China, 2007. [Google Scholar]
- Yang, J.J.; Liu, Y.; Wei, L.X.; Zhan, H. Dual coding hybrid genetic algorithm for optimal schedule of pumping stations in multi-sources water injection system. Acta Autom. Sin. 2006, 32, 154–160. [Google Scholar]
- López-Ibáñez, M.; Prasad, T.D.; Paechter, B. Ant colony optimization for optimal control of pumps in water distribution networks. J. Water Resour. Plan. Manag. 2008, 134, 337–346. [Google Scholar] [CrossRef]
- Sedki, A.; Ouazar, D. Hybrid particle swarm optimization and differential evolution for optimal design of water distribution systems. Adv. Eng. Inform. 2012, 26, 582–591. [Google Scholar] [CrossRef]
- Heidari, A.A.; Mirjalili, S.; Faris, H.; Aljarah, I.; Mafarja, M.; Chen, H. Harris hawks optimization: Algorithm and applications. Future Gener. Comput. Syst. 2019, 97, 849–872. [Google Scholar] [CrossRef]
- Peng, W.Y.; Fan, Y.Y.; Li, H. Risk assessment of the construction phase of large span bridge based on gray clustering method. J. Eng. Manag. 2015, 29, 101–105. [Google Scholar]
- Jethwa, J.L.; Singh, B.; Singh, B. Estimation of ultimate rock pressure for tunnel linings under squeezing rock conditions-a new approach. In Proceedings of ISRM Symposium on Design and Performance of Underground Excavations, Cambridge, UK, 3–6 September 1984; Brown, E.T., Hudson, J.A., Eds.; British Geotechnical Society: Cambridge, UK, 1984; pp. 231–238. [Google Scholar]
- Singh, B.; Jethwa, J.L.; Dube, A.K.; Singh, B. Correlation between observed support pressure and rock mass quality. Tunn. Undergr. Space Technol. 1992, 7, 59–74. [Google Scholar] [CrossRef]
- Aydan, Ö.; Akagi, T.; Kawamoto, T. The squeezing potential of rocks around tunnels; theory and prediction. Rock Mech. Rock Eng. 1993, 26, 137–163. [Google Scholar] [CrossRef]
- Barla, G. Squeezing rocks in tunnels. ISRM News J. 1995, 2, 44–49. [Google Scholar]
- Goel, R.K.; Jethwa, J.L.; Paithankar, A.G. Indian experiences with Q and RMR systems. Tunn. Undergr. Space Technol. 1995, 10, 97–109. [Google Scholar] [CrossRef]
- Bhasin, R.; Grimstad, E. The use of stress-strength relationships in the assessment of tunnel stability. Tunn. Undergr. Space Technol. 1996, 11, 93–98. [Google Scholar] [CrossRef]
- Hoek, E.; Marinos, P. Predicting tunnel squeezing problems in weak heterogeneous rock masses. Tunn. Tunn. Int. 2000, 32, 45–51. [Google Scholar]
- Hoek, E. Big tunnels in bad rock. J. Geotech. Geoenviron. Eng. 2001, 127, 726–740. [Google Scholar] [CrossRef]
- Jimenez, R.; Recio, D. A linear classifier for probabilistic prediction of squeezing conditions in Himalayan tunnels. Eng. Geol. 2011, 121, 101–109. [Google Scholar] [CrossRef]
- Dwivedi, R.D.; Singh, M.; Viladkar, M.N.; Goel, R.K. Prediction of tunnel deformation in squeezing grounds. Eng. Geol. 2013, 161, 55–64. [Google Scholar] [CrossRef]
- Rehman, H.; Ali, W.; Naji, A.M.; Kim, J.-J.; Abdullah, R.A.; Yoo, H.-K. Review of Rock-Mass Rating and Tunneling Quality Index Systems for Tunnel Design: Development, Refinement, Application and Limitation. Appl. Sci. 2018, 8, 1250. [Google Scholar] [CrossRef]
- Liang, J.; Liu, W.; Yin, X.; Li, W.; Yang, Z.; Yang, J. Experimental study on the performance of shield tunnel tail grout in ground. Undergr. Space 2025, 20, 277–292. [Google Scholar] [CrossRef]
- Li, D.; Nie, J.; Wang, H.; Yu, T.; Kuang, K.S.C. Path planning and topology-aided acoustic emission damage localization in high-strength bolt connections of bridges. Eng. Struct. 2025, 332, 120103. [Google Scholar] [CrossRef]
- Li, D.; Chen, Q.; Wang, H.; Shen, P.; Li, Z.; He, W. Deep learning-based acoustic emission data clustering for crack evaluation of welded joints in field bridges. Autom. Constr. 2024, 165, 105540. [Google Scholar] [CrossRef]
- Zheng, Y.; Tian, Z.; Yu, Z.; Chen, J.; Jiang, T.; Kong, L.; Luo, J. A thermal history-based approach to predict mechanical properties of plasma arc additively manufactured IN625 thin-wall. J. Manuf. Process. 2025, 140, 91–107. [Google Scholar] [CrossRef]
- Li, X.; Meng, S.; Sun, W.; Yuan, M.; Liu, X.; Nan, Y.; Wang, Y. Research on the risk assessment of the green construction of hydraulic tunnels based a on combination weighting-cloud model. Evol. Intell. 2025, 18, 57. [Google Scholar] [CrossRef]
- Jiang, X.; Zheng, C.; Zhuo, Y.; Kong, X.; Ge, Z.; Song, Z.; Xie, M. Advancing Industrial Data Augmentation in AIGC Era: From Foundations to Frontier Applications. IEEE Trans. Instrum. Meas. 2025, 74, 1–22. [Google Scholar] [CrossRef]
- Cao, K.; Chen, S.; Chen, Y.; Nie, B.; Li, Z. Decision analysis of safety risks pre-control measures for falling accidents in mega hydropower engineering driven by accident case texts. Reliab. Eng. Syst. Saf. 2025, 261, 111120. [Google Scholar] [CrossRef]
- Sha, F.; Wang, Q.; Wang, N.; Liu, F.; Ni, L. Performance of underwater shield synchronous double-liquid plastic grout with high W/C and volume ratio. Constr. Build. Mater. 2025, 465, 140172. [Google Scholar] [CrossRef]
- Meng, W.; Xin, L.; Jinshuai, S.; Weiwei, L.; Zhongzheng, F.; Shuai, W.; Wenguang, Y. A study on the reasonable width of narrow coal pillars in the section of hard primary roof hewing along the air excavation roadway. Energy Sci. Eng. 2024, 12, 2746–2765. [Google Scholar] [CrossRef]
- Zou, B.; Chen, Y.; Bao, Y.; Liu, Z.; Hu, B.; Ma, J.; Long, X. Impact of tunneling parameters on disc cutter wear during rock breaking in transient conditions. Wear 2025, 560–561, 205620. [Google Scholar] [CrossRef]
- Zou, B.; Pei, C.; Chen, Q.; Deng, Y.; Chen, Y.; Long, X. Progress on Multi-Field Coupling Simulation Methods in Deep Strata Rock Breaking Analysis. Comput. Model. Eng. Sci. 2025, 142, 2457–2485. [Google Scholar] [CrossRef]
- Qi, H.; Zhou, Z.; Manu, P.; Li, N. Falling risk analysis at workplaces through an accident data-driven approach based upon hybrid artificial intelligence (AI) techniques. Saf. Sci. 2025, 185, 106814. [Google Scholar] [CrossRef]
- Zhou, Z.; Zhuo, W.; Cui, J.; Luan, H.; Chen, Y.; Lin, D. Developing a deep reinforcement learning model for safety risk prediction at subway construction sites. Reliab. Eng. Syst. Saf. 2025, 257, 110885. [Google Scholar] [CrossRef]
- Chang, J.; Thewes, M.; Zhang, D.; Huang, H.; Lin, W. Deformational behaviors of existing three-line tunnels induced by under-crossing of three-line mechanized tunnels: A case study. Can. Geotech. J. 2025, 62, 1–21. [Google Scholar] [CrossRef]
- Hu, D.; Liu, J.; Li, Y.; Tan, Z. Prediction method of ground settlement for rectangular tunnel construction. Tunn. Undergr. Space Technol. 2025, 164, 106814. [Google Scholar] [CrossRef]
Disclaimer/Publisher’s Note: The statements, opinions and data contained in all publications are solely those of the individual author(s) and contributor(s) and not of MDPI and/or the editor(s). MDPI and/or the editor(s) disclaim responsibility for any injury to people or property resulting from any ideas, methods, instructions or products referred to in the content. |
© 2025 by the authors. Licensee MDPI, Basel, Switzerland. This article is an open access article distributed under the terms and conditions of the Creative Commons Attribution (CC BY) license (https://creativecommons.org/licenses/by/4.0/).

