Abstract
Urban pedestrian-only spaces face challenges like inadequate leisure experiences and user discomfort. To enhance spatial conditions, it is crucial to evaluate various influencing factors. Many studies focus on individual elements, missing the benefits of a comprehensive approach. This study aims to propose a pedestrian behavior prediction model that establishes the relationship between multiple spatial factors and pedestrian distribution. We introduce a two-layer simulation framework for pedestrian dynamics, comprising a tactic layer responsible for path planning and an operational layer for velocity prediction based on the social force model. This framework enhances prediction accuracy, achieving a 46.3% improvement over the conventional model. Moreover, it underscores the importance of a holistic approach, emphasizing the need to consider group dynamics and random behaviors in pedestrian modeling.
1. Introduction
The appeal of shopping, dining, leisure, and other activities in urban pedestrian-only spaces is growing. However, the high concentration of pedestrians has led to overcrowding, resulting in challenges such as diminished leisure experiences and reduced travel comfort []. The pedestrian comfort within urban infrastructure can be evaluated by level of service (LOS). The Highway Capacity Manual (HCM) is a widely accepted standard for assessing LOS based on three indicators: flow, speed, and density []. Level of Service (LOS) is categorized into six levels, from A to F, representing a range of walking experiences. As LOS decreases, walking experience declines due to reduced speed and increased density. Initially, pedestrian flow increases as LOS decreases, reaching its peak at a moderate level (level D) before declining further with additional decreases in LOS. Among the various indicators, pedestrian density is particularly significant and widely utilized []. By employing urban design strategies to passively manage pedestrian density, the functionality of urban spaces can be enhanced while addressing comfort issues for pedestrians []. This study focuses on urban pedestrian-only spaces—outdoor public areas within a city designed specifically to exclude motorized vehicle traffic. These spaces prioritize safe and enjoyable movement for pedestrians, encompassing streets, squares, and pathways. Various urban environmental factors shape the pedestrian environment, influencing walking behavior and the distribution of pedestrian density [].
Predicting pedestrian density relies on models of pedestrian behavior, which can be categorized into macroscopic and microscopic approaches. Macroscopic models offer faster computational speeds but consider limited kinds of influencing factors, while microscopic models provide greater prediction accuracy []. Since this study explores a broad spectrum of influencing factors, a microscopic model is employed. These models can predict individual walking trajectories [] and provide insights into patterns of collective self-organization [].
Microscopic models generally fall into two categories: knowledge-driven and data-driven models []. Data-driven models, particularly Long Short-Term Memory (LSTM) models, offer high accuracy in predicting pedestrian movements [,,]. However, they typically require input from previous steps to forecast future behaviors. While these models excel at predicting individual walking trajectories, they are less effective for simulating collective behavior and establishing relationships between environmental factors and collective behavior []. This study focuses on knowledge-driven models, specifically agent-based models (ABM) and social force models (SFM), which are well-suited for examining how environmental factors influence collective behavior.
ABM is effective for investigating individual walking trajectories []. ABM models can be derived from cellular automata, but the discretization of space and time in cellular automata can limit the speed and direction of pedestrian flow []. Research by Lee, Lee & Kang [] demonstrated that ABM can effectively simulate pedestrian behavior in the presence of corners and obstacles, by accurately modeling corresponding behavior and properly setting random behavior. Hussein & Sayed [] validated the accuracy of predicting personal walking trajectories in crowded environments. Furthermore, Ma, Brandt, Seipel & Ma [] highlighted the importance of incorporating visual parameters in trajectory predictions. Bossowski, Szandala & Mazurkiewicz [] emphasized the need for a walking dynamics model that considers factors such as route length, obstacle avoidance, visibility, and grouping behavior. ABM is suitable for studying individual pedestrian walking behavior influenced by various kinds of environmental factors and collective behavior shaped by environmental factors without subdivided attributes.
SFM is widely utilized for predicting collective self-organization patterns. According to Helbing & Molnár [], a pedestrian’s motion can be influenced by their internal motivation to move in a specific direction at a desired speed, along with interactions with other pedestrians and environmental boundaries, such as walls and obstacles. Initial validations of these models focused on the accuracy of individual pedestrian walking behavior []. Moussaïd, Helbing, Garnier, Johansson, Combe & Theraulaz [] introduced an SFM that was successfully validated against collective crowd patterns. Subsequent research has incorporated the effects of corners [], obstacles [], and visibility [] to refine the model further. However, these influencing factors have been analyzed separately, leaving the interaction effects among them still unclear. SFM is suitable for studying collective behavior, but the scenarios are simple compared with urban walking condition.
In summary, the limitations of current research can be identified in two main areas. First, while individual pedestrian trajectory prediction models emphasize the importance of incorporating various influencing factors, they lack the capability to simulate collective patterns. Many models from previous studies, while essential for predicting collective patterns, have focused on a single type of influencing factor, thus falling short of a comprehensive framework. Although some integrate Agent-Based Model (ABM) and Social Force Model (SFM), they still struggle to clarify the relationship between pedestrian density distribution and multiple urban design factors. This limitation reduces their effectiveness in supporting urban design practices. However, recent studies indicate that a comprehensive model is now feasible to be developed. Research has shown that pedestrian density distribution is correlated with the characteristics of walking spaces, including the layout of traversable spaces, non-traversable spaces, and visual restriction spaces. However, the mechanisms underlying these differences remain insufficiently explored [].
The purpose of this study is to develop a two-layer prediction model for pedestrian walking behavior and density distribution in urban pedestrian-only spaces. The tactic layer utilizes an agent-based model to describe behaviors such as approaching aim behavior, turning behavior, visual restriction behavior, and traversing restriction behavior. In the operational layer, a social force model (SFM) is employed to capture group behavior dynamics and random behavior. By applying this model to simulate crowd behavior, pedestrian density distribution in urban environments can be accurately predicted. With the goal of improving comfort by optimizing density distribution, it provides a basis for proposing urban design strategies to optimize the pedestrian environment.
2. Materials and Methods
The walking behavior prediction model can be structured into three layers: the strategic layer, the tactic layer, and the operational layer []. In the strategic layer, travel goals are defined, focusing primarily on overall urban analysis rather than specifically on pedestrian-only spaces. The tactic layer determines walking aims through path planning, while the operational layer predicts movement at a specific moment, influenced by the goals established in the tactic layer. The tactic and operational models can be combined to create a local walking behavior prediction model []. The walking aim identified in the tactic layer sets the desired direction, which influences the operational layer’s predictions of pedestrian movement []. By integrating these two layers, we can better understand the relationship between urban pedestrian-only environments and collective walking behavior.
The framework of the model proposed in this study is illustrated in Figure 1. The process begins with the development of the tactic layer model, which predicts walking aims based on various environmental factors. Next, the operational layer model is employed to forecast pedestrian walking behavior. In the third step, agent-based simulation is used to predict pedestrian density distribution. Finally, the resulting data allows us to determine the relationship between the influencing factors and pedestrian density distribution.
Figure 1.
The framework of the model given in this paper, along with the analysis logic.
2.1. Tactic Layer Path Planning Model
In the tactic layer (TL) of path planning, research indicates that pedestrians consider walking time (path length), passing difficulty, and risk factors to make decisions []. In urban pedestrian-only spaces, passing difficulty can be perceived as uniform. The walking destination and turning space influence path length, while physical boundaries and collision risks affect risk factors. Consequently, TL path planning behavior is shaped by these elements: walking destination, turning space, collision risk, and physical boundaries. The walking distance prompts approaching aim (AA) behavior, reflecting the tendency to reach the destination via the shortest path. Turning space leads to turning (TN) behavior, which describes adjustments in direction when direct routes are unavailable. Collision risk results in visual restriction (VR) behavior in areas with limited visual information, increasing the likelihood of potential collisions with other pedestrians. Lastly, physical boundaries lead to traversing restriction (SR) behavior, which anticipates and avoids collisions with environmental obstacles.
This study employs Maslow’s hierarchy of needs to organize the logic behind the four behaviors discussed, as illustrated in Figure 2. Maslow [] identified five levels of human needs, ranging from basic to advanced: physiological, safety and security, love and belonging, self-esteem, and self-actualization. Generally, lower-level needs have a greater influence on human behavior, and with the rise of demand level, the influence of demand on people gradually decreases. In this context, AA and TN behaviors are associated with efficiently reaching one’s destination, which aligns with self-actualization needs. Conversely, VR and SR behaviors are linked to the risks of collisions with the physical environment or other pedestrians, representing the safety needs of individuals.
Figure 2.
Model logic for tactic layer path planning.
According to Maslow’s hierarchy of needs, AA and TN behaviors, as well as VR and SR behaviors, form two distinct pairs at the same level. Although AA and TN do not occur simultaneously, VR and SR may act concurrently and influence the walking direction determined by AA and TN. The respective influence weights of VR and SR on walking direction are denoted as and . Let the walking direction determined by AA and TN be , and the direction suggested by VR behavior be . The resulting direction influenced by AA, TN, and VR () is . Similarly, if represents the direction determined by SR behavior, the final walking aim () is . The overall logic of path planning is illustrated in Figure 2.
In AA behavior, pedestrians direct their movement toward their destination, which represents their walking aim. The behaviors of TN, VR, and SR are more complex, and the methods for determining the walking aim will be discussed in the following section. All these TL path planning principles are informed by existing research findings.
2.1.1. Path Planning for Turning (TN) Behavior
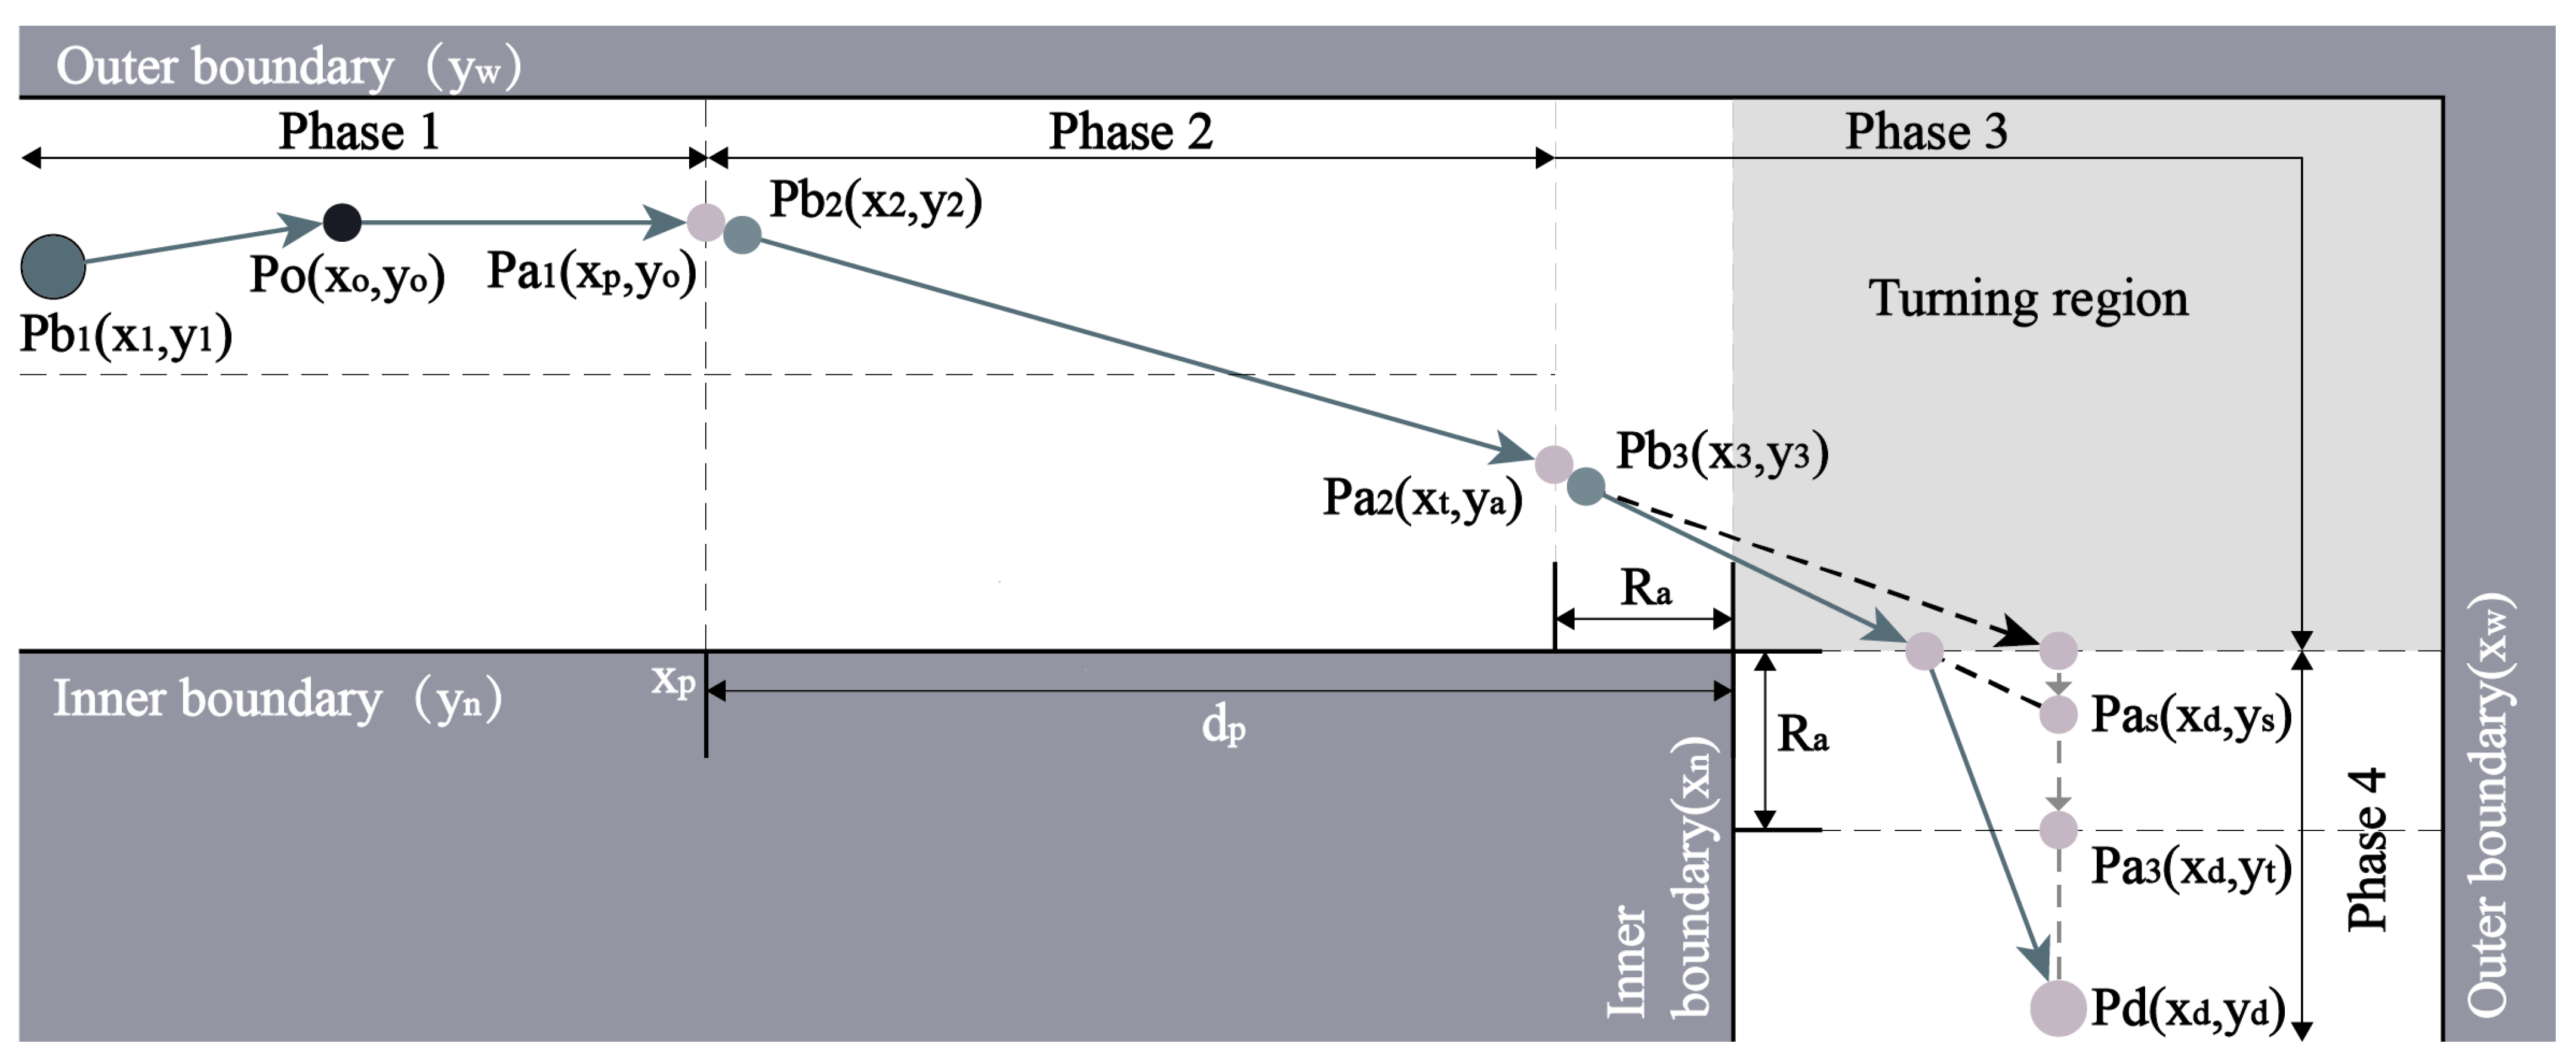
Dias & Loverglio [], Wu, Yue, Liu, Zhang & Shao [] categorize the TN behavior into four distinct stages, as illustrated in Figure 3. Phase 1 involves a straight-walking stage before the turn, where pedestrians move parallel to the corridor boundary. Phase 2 occurs when pedestrians approach a set distance upstream of the turning area, prompting them to move closer to the inner curve of the corner. Phase 3 begins when the turning region falls within the pedestrian’s field of attention; during this phase, they gradually adjust their direction before entering the intended corridor. Phase 4 sees pedestrians unaffected by the turning factors, at which point they engage in AA behavior.
Figure 3.
Path planning for turning behavior.
When , the pedestrian is in Phase 1. Here, represents the x-coordinate of the current position , The pedestrian’s walking aim is []. The x-coordinate of the inner curve is , with positioned a certain distance upstream of . The distance varies according to walking habits and is modeled as a normal distribution, with a mean of 5.82 m and a standard deviation of 2.40 m []. Additionally, is the y-coordinate of the current position .
When , the pedestrian is in Phase 2. In this phase, the walking aim is denoted as . The position is located at a distance equal to the radius of the attention field ( = 4.0 m) upstream of []. , where is the y-axis coordinate of the inner curve, and is the y-axis coordinate of the first position in Phase 2 (), when the behavior of approaching the inner curve starts [].
When and , the pedestrian is in Phase 3. During this phase, the pedestrians gradually adjusts their desired direction and align their walking aim with the turning target, denoted as . The coordinate is located at a distance of downstream from . The pedestrian’s walking aim can be expressed as , where represents the x-coordinate of the destination . The calculation method for is detailed in Equation (1).
where, and are the x-axis coordinates (m) and y-axis coordinates (m) of the initial position () in Phase 3.
When , the pedestrian enters Phase 4. In this phase, pedestrians are not influenced by TN behavior and instead engage in AA behavior. The walking aim in this phase is the destination, represented as ).
2.1.2. Path Planning for Visual Restriction (VR) Behavior
Sun, Sun, Duives & Hoogendoorn [] demonstrates that when pedestrians approach an area with a limited field of vision, the lack of visible information encourages them to adjust their trajectories to avoid potential collisions, as shown in Figure 4. If the pedestrian’s current position, denoted as , satisfies , they begin to deviate due to visual restriction (VR) behavior. The point is located a specific distance upstream from the boundary of the restricted field of vision (). The average value of is 7.55 m, with a standard deviation of 5.65 m []. The position where this deviation first occurs is identified as . The pedestrian’s intended walking direction, influenced by VR behavior, is represented as . The calculation for is provided in Equation (2), and the calculation for is detailed in Equation (3) [].
where, represents the y-axis coordinate (m) of the position where VR behavior begins. The variable denotes the y-axis coordinate (m) of the visual restriction boundary. The flow rate of pedestrians entering and exiting the building entrance, denoted as f (persons/m2), is measured in the vicinity of the entrance under the condition that falls within the range . When , the pedestrian density .
where, is the x-axis coordinate (m) of the center of visual restriction area.
Figure 4.
Path planning for visual restriction behavior.
The expected direction of VR behavior is denoted as , with representing the angle between and the boundary of the visual restriction area. Independently of VR behavior, the expected direction of pedestrian movement is represented as , and denotes the angle between and the boundary of the visual restriction area. When , the pedestrian’s walking goal is . Conversely, when , the walking target is . The VR behavior concludes when either or .
2.1.3. Path Planning for Traversing Restriction (SR) Behavior
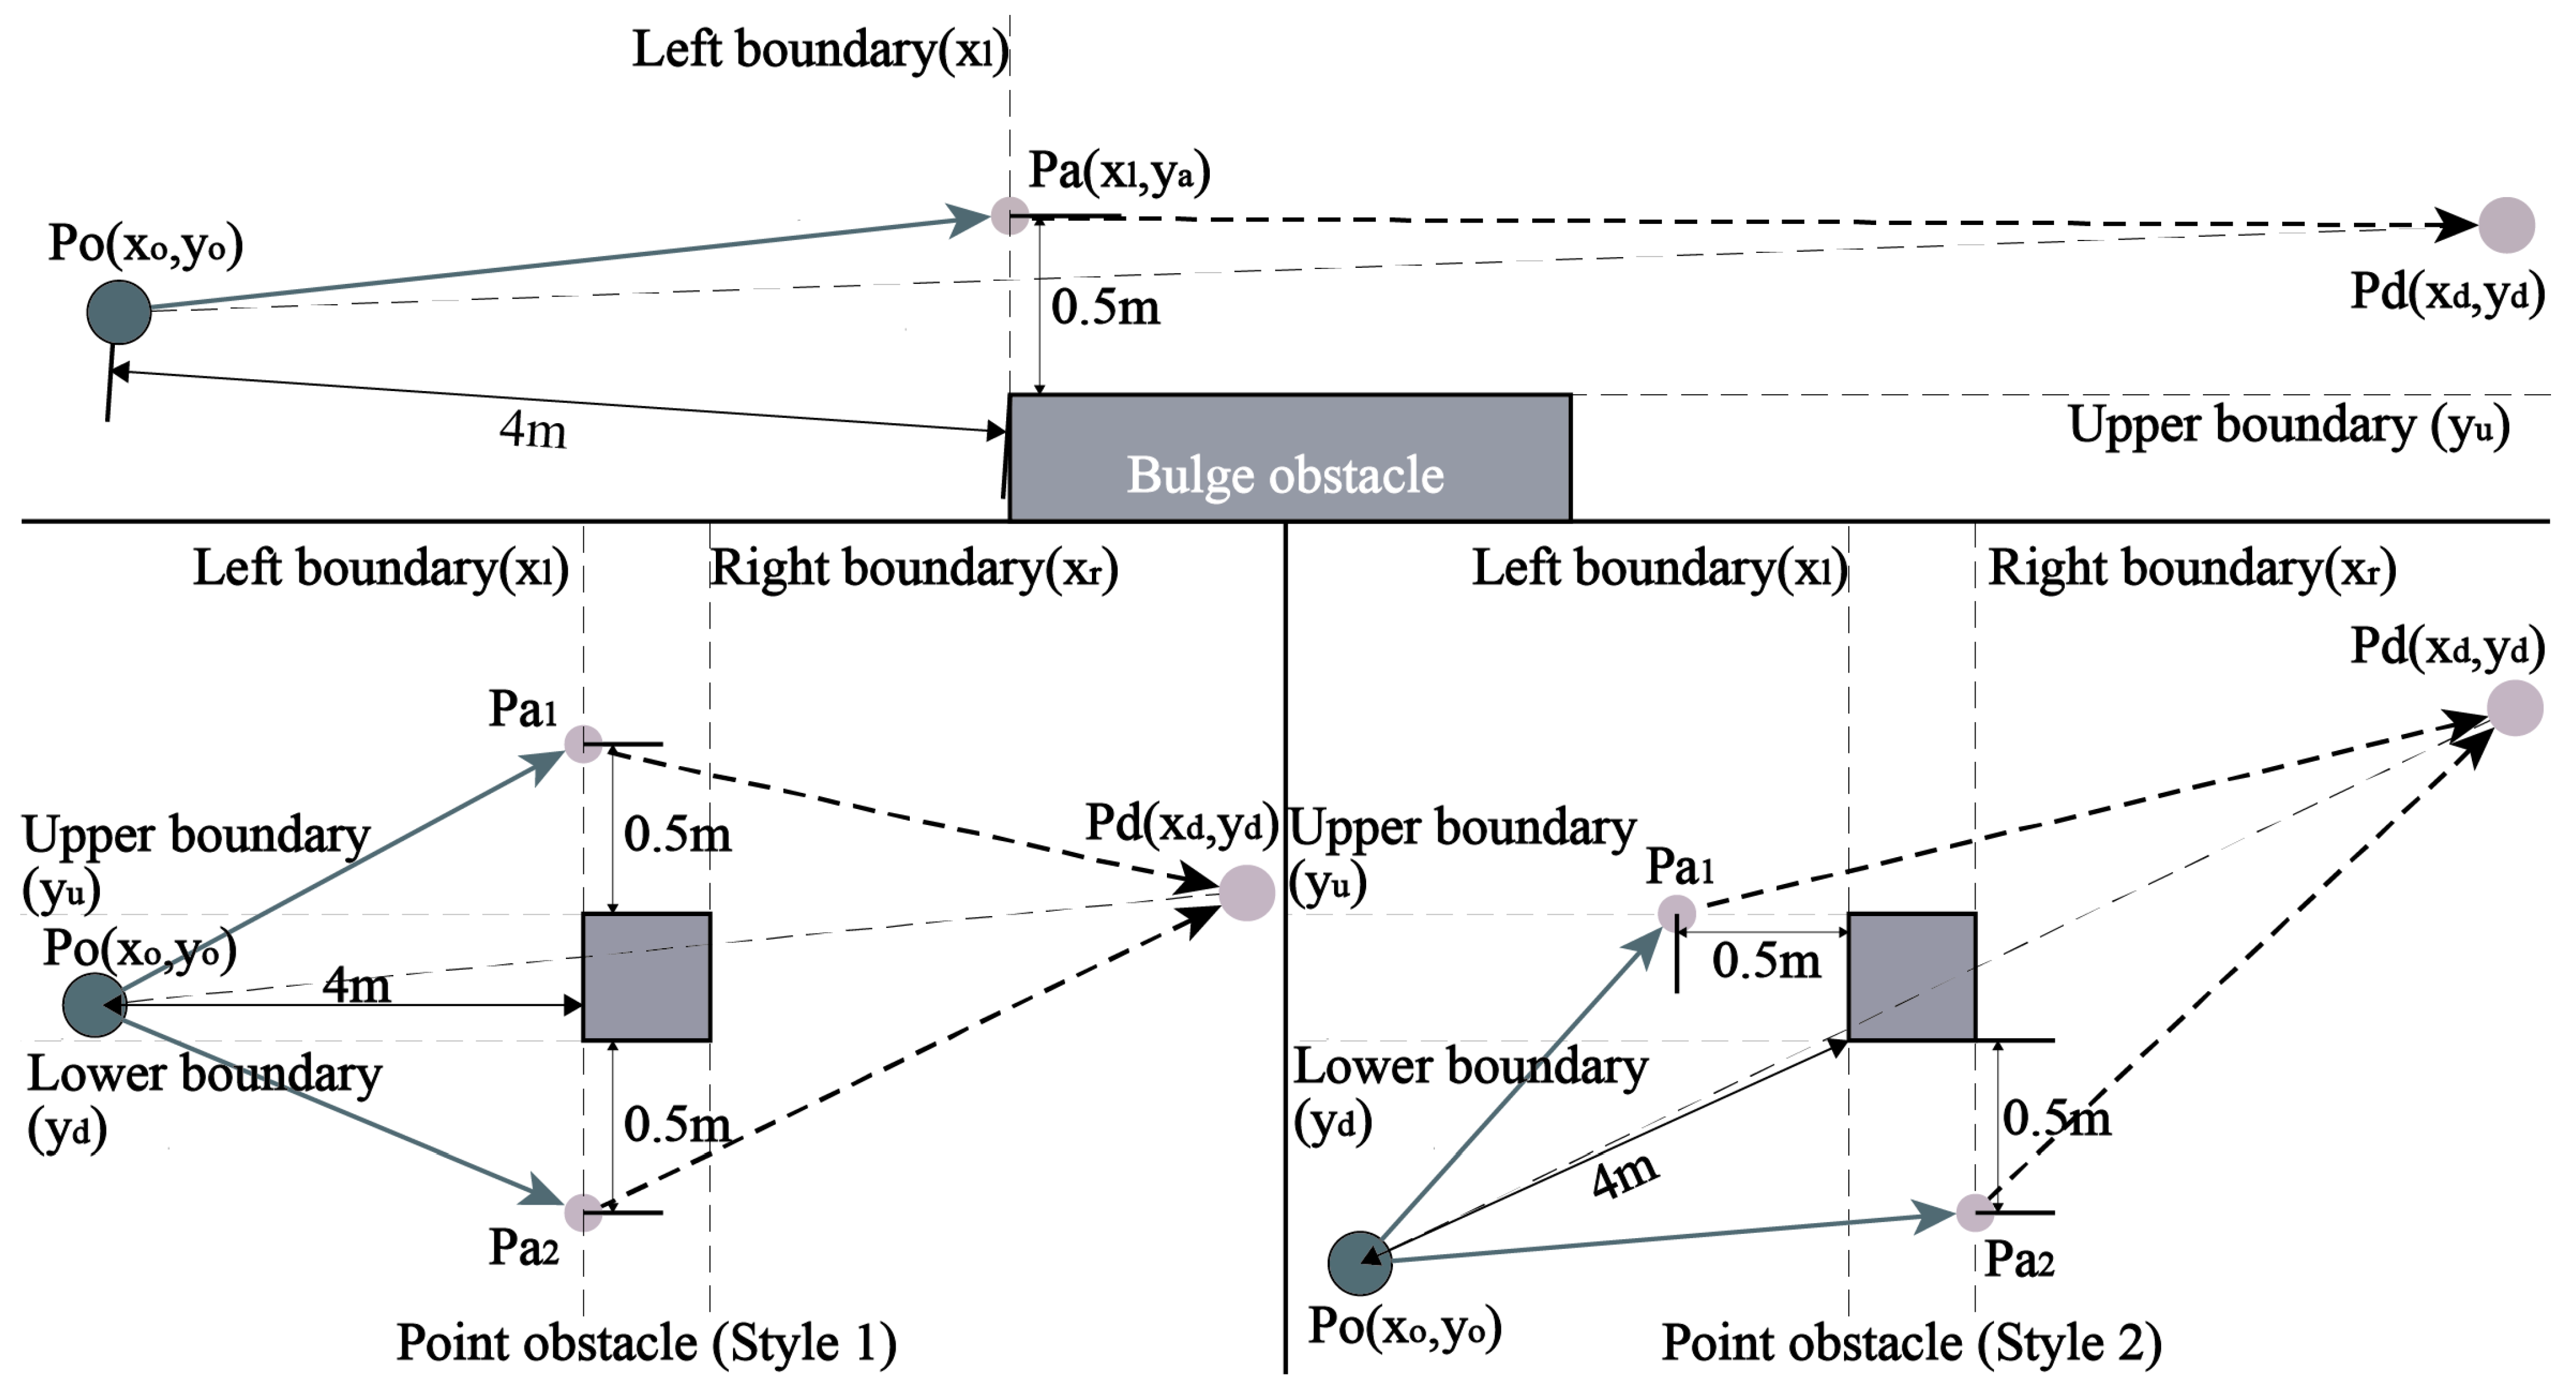
Fajen & Warren [] demonstrates that when the distance between a pedestrian’s expected path and an obstacle is less than 0.5 m, and the distance from the pedestrian to the obstacle is less than 4 m, pedestrians are likely to deviate from their path to maintain a safe distance of 0.5 m from the obstacle’s boundary. Obstacles that influence pedestrian behavior can be categorized into bulge obstacles and point obstacles, as illustrated in Figure 5.
Figure 5.
Path planning for traversing restriction behavior.
A bulge obstacle occurs when the obstacle is connected to the boundary of the corridor. Taking the condition shown in Figure 5 as an example, the pedestrian’s walking target during SR behavior is , where is the x-coordinate of the left boundary of the obstacle, and , with representing the y-coordinate of the upper boundary of the obstacle. The SR behavior concludes when .
A point obstacle is defined as an obstacle that is not connected to the corridor boundary, prompting pedestrians to detour either left or right. The typical path-planning logic involves selecting the shortest route to minimize total walking distance, leading pedestrians to choose the side with the smaller detour distance []. For instance, as illustrated in Figure 5, when pedestrians decide on a detour, there are two scenarios to consider: first, when pedestrians are positioned between the upper and lower boundaries, that is, ; and second, when pedestrians are outside these boundaries, meaning or . In both scenarios, pedestrians may opt for either or as their bypass route. The lengths of these bypass paths, denoted as and , must be calculated. If , the walking target is ; if , the walking target is .
2.2. Operational Layer Velocity Prediction Model
The social force model (SFM) is a widely used velocity prediction model at the operational layer (OL) and can be integrated with TL models to predict pedestrian flow in complex environments. However, the original SFM has not been validated for its ability to predict collective behavior [] and does not adequately account for group dynamics and walking randomness []. To address these limitations, the modified SFM proposed by Zanlungo, Ikeda & Kanda [] (SF-Z) will be used as the prediction model for OL velocity in this study.
The SF-Z model retains the fundamental structure of the original SFM while enhancing the consideration of group behavior and randomness in pedestrian behavior. Additionally, its ability to predict density distribution has been validated. The calculation method for pedestrian acceleration (a) is presented in Equation (4).
where: represents the influence of the pedestrian’s walking aim; denotes the interactions among group members; accounts for collision avoidance behaviors; reflects the impact of other attractive elements; and signifies random behavior.
The model posits that the desired direction is jointly determined by the influence of the walking aim and other attractive elements. Consequently, and can be consolidated into . Additionally, when pedestrian density is low, the randomness inherent in collision avoidance behavior allows and to be simplified to .
2.3. Abnormal Prediction Results Modification
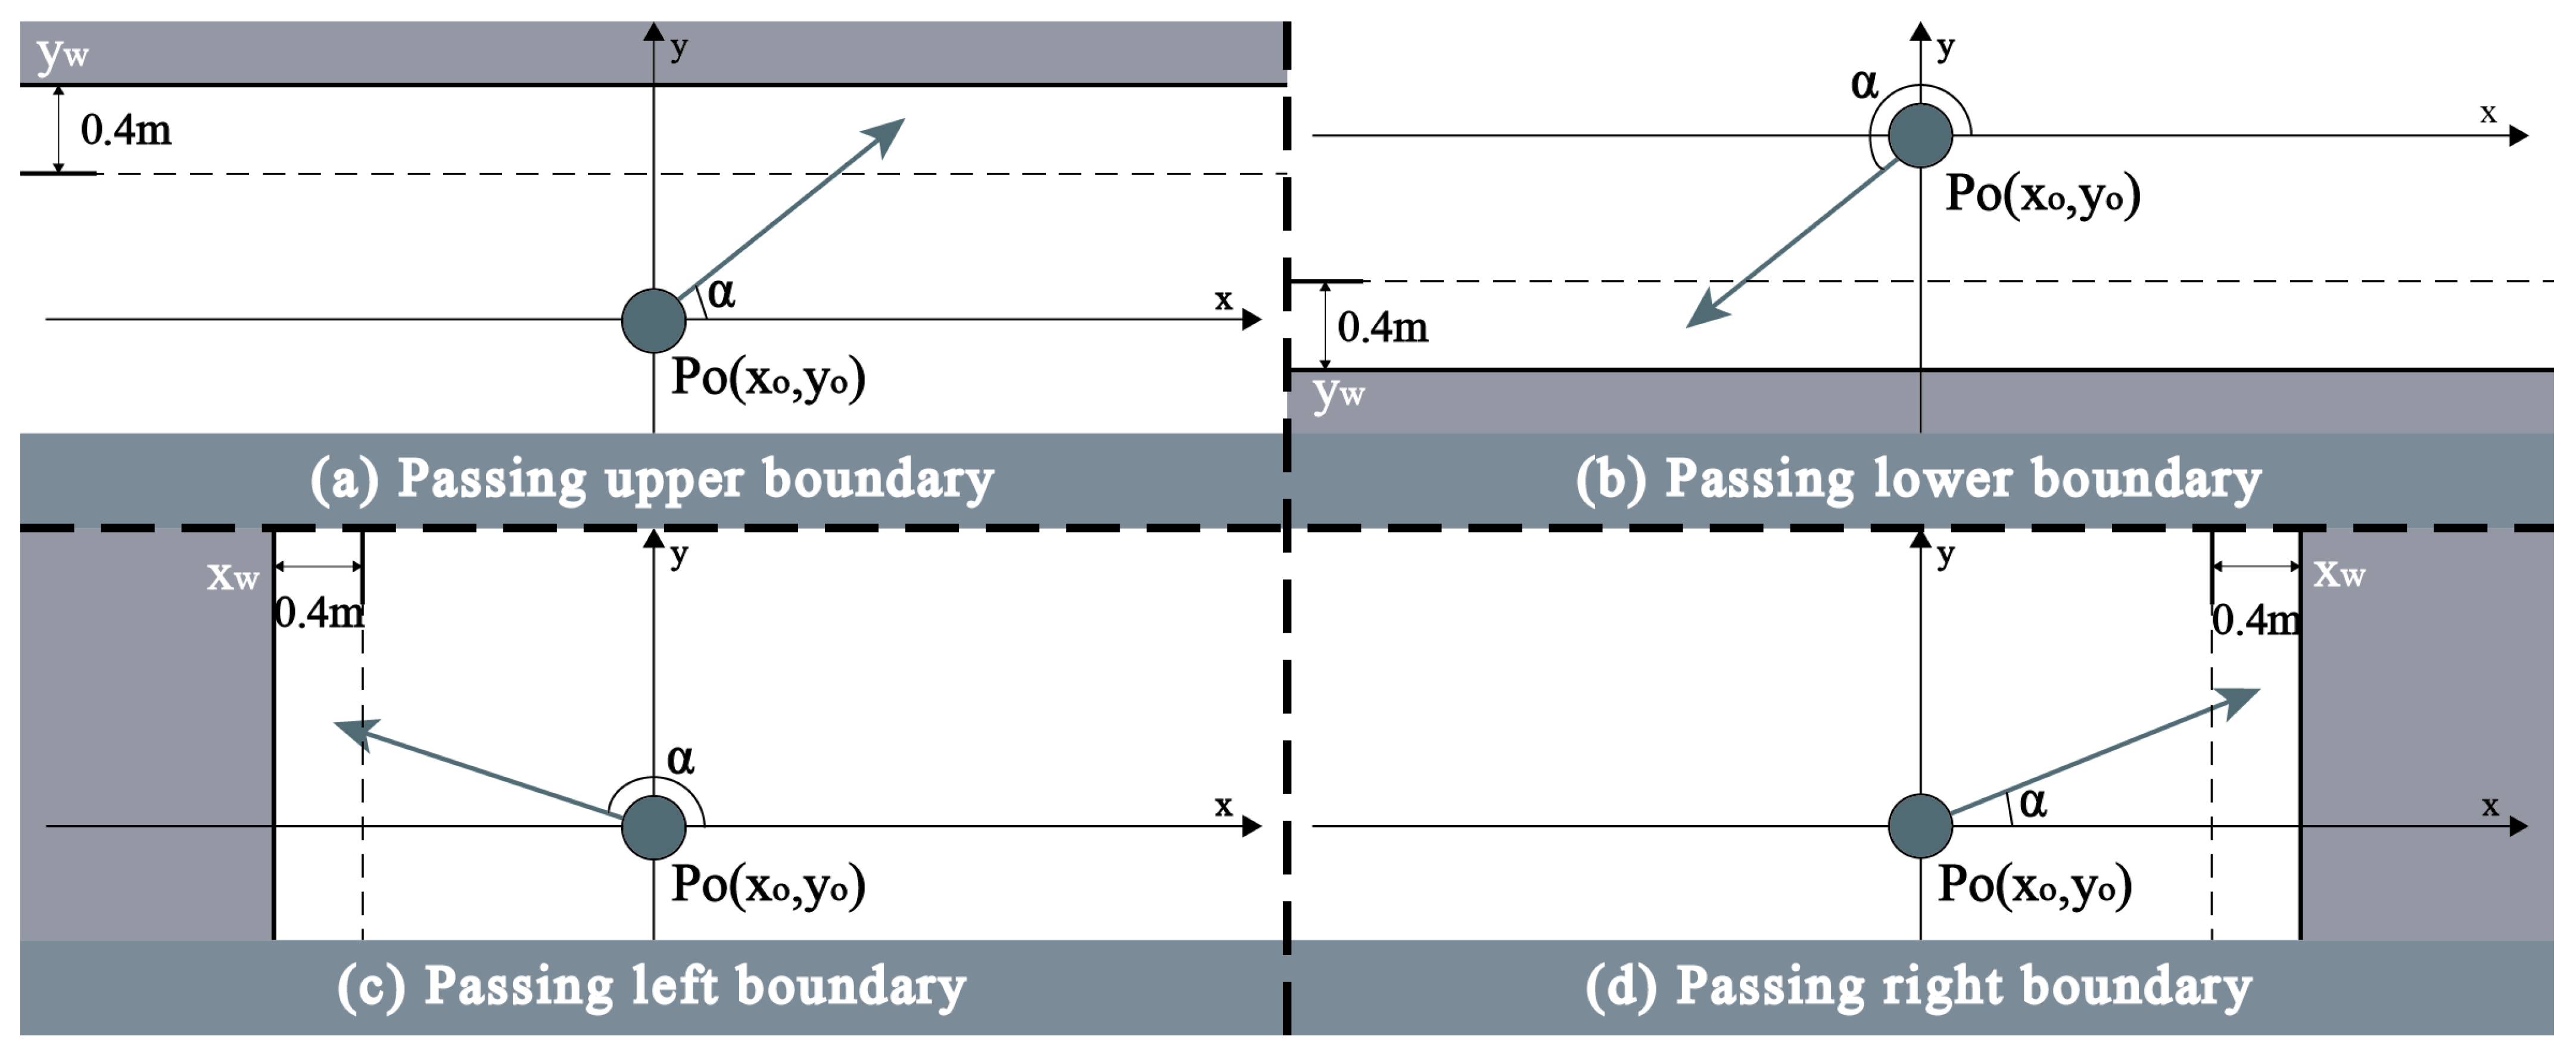
This study categorizes pedestrian interactions with boundaries into four scenarios based on their relative positions: crossing upper boundaries, lower boundaries, left boundaries, and right boundaries. According to Ma, Song, Fang, Lo & Liao [], individuals maintain a safe distance of approximately 0.4 m from space boundaries to ensure safe movement, resulting in an effective walking space of 0.4 m from the boundary. For example, when predicting a scenario involving crossing the upper boundary, let the pedestrian’s current position be , the predicted speed at the next time step be V, the direction of motion be , and the prediction time interval be , as illustrated in Figure 6. The y-coordinate of the upper boundary is represented as . If , it is assumed that the pedestrian will cross the upper boundary, necessitating an adjustment in the prediction results. During this process, the pedestrian’s walking direction remains unchanged, and the method for calculating walking speed (V) is detailed in Equation (5). The modification for crossing the lower, left, and right boundaries is analogous to that of crossing the upper boundary, as illustrated in Figure 6.
Figure 6.
Diagram of prediction results traversing the obstacles above.
3. Case Study
3.1. Data Collection
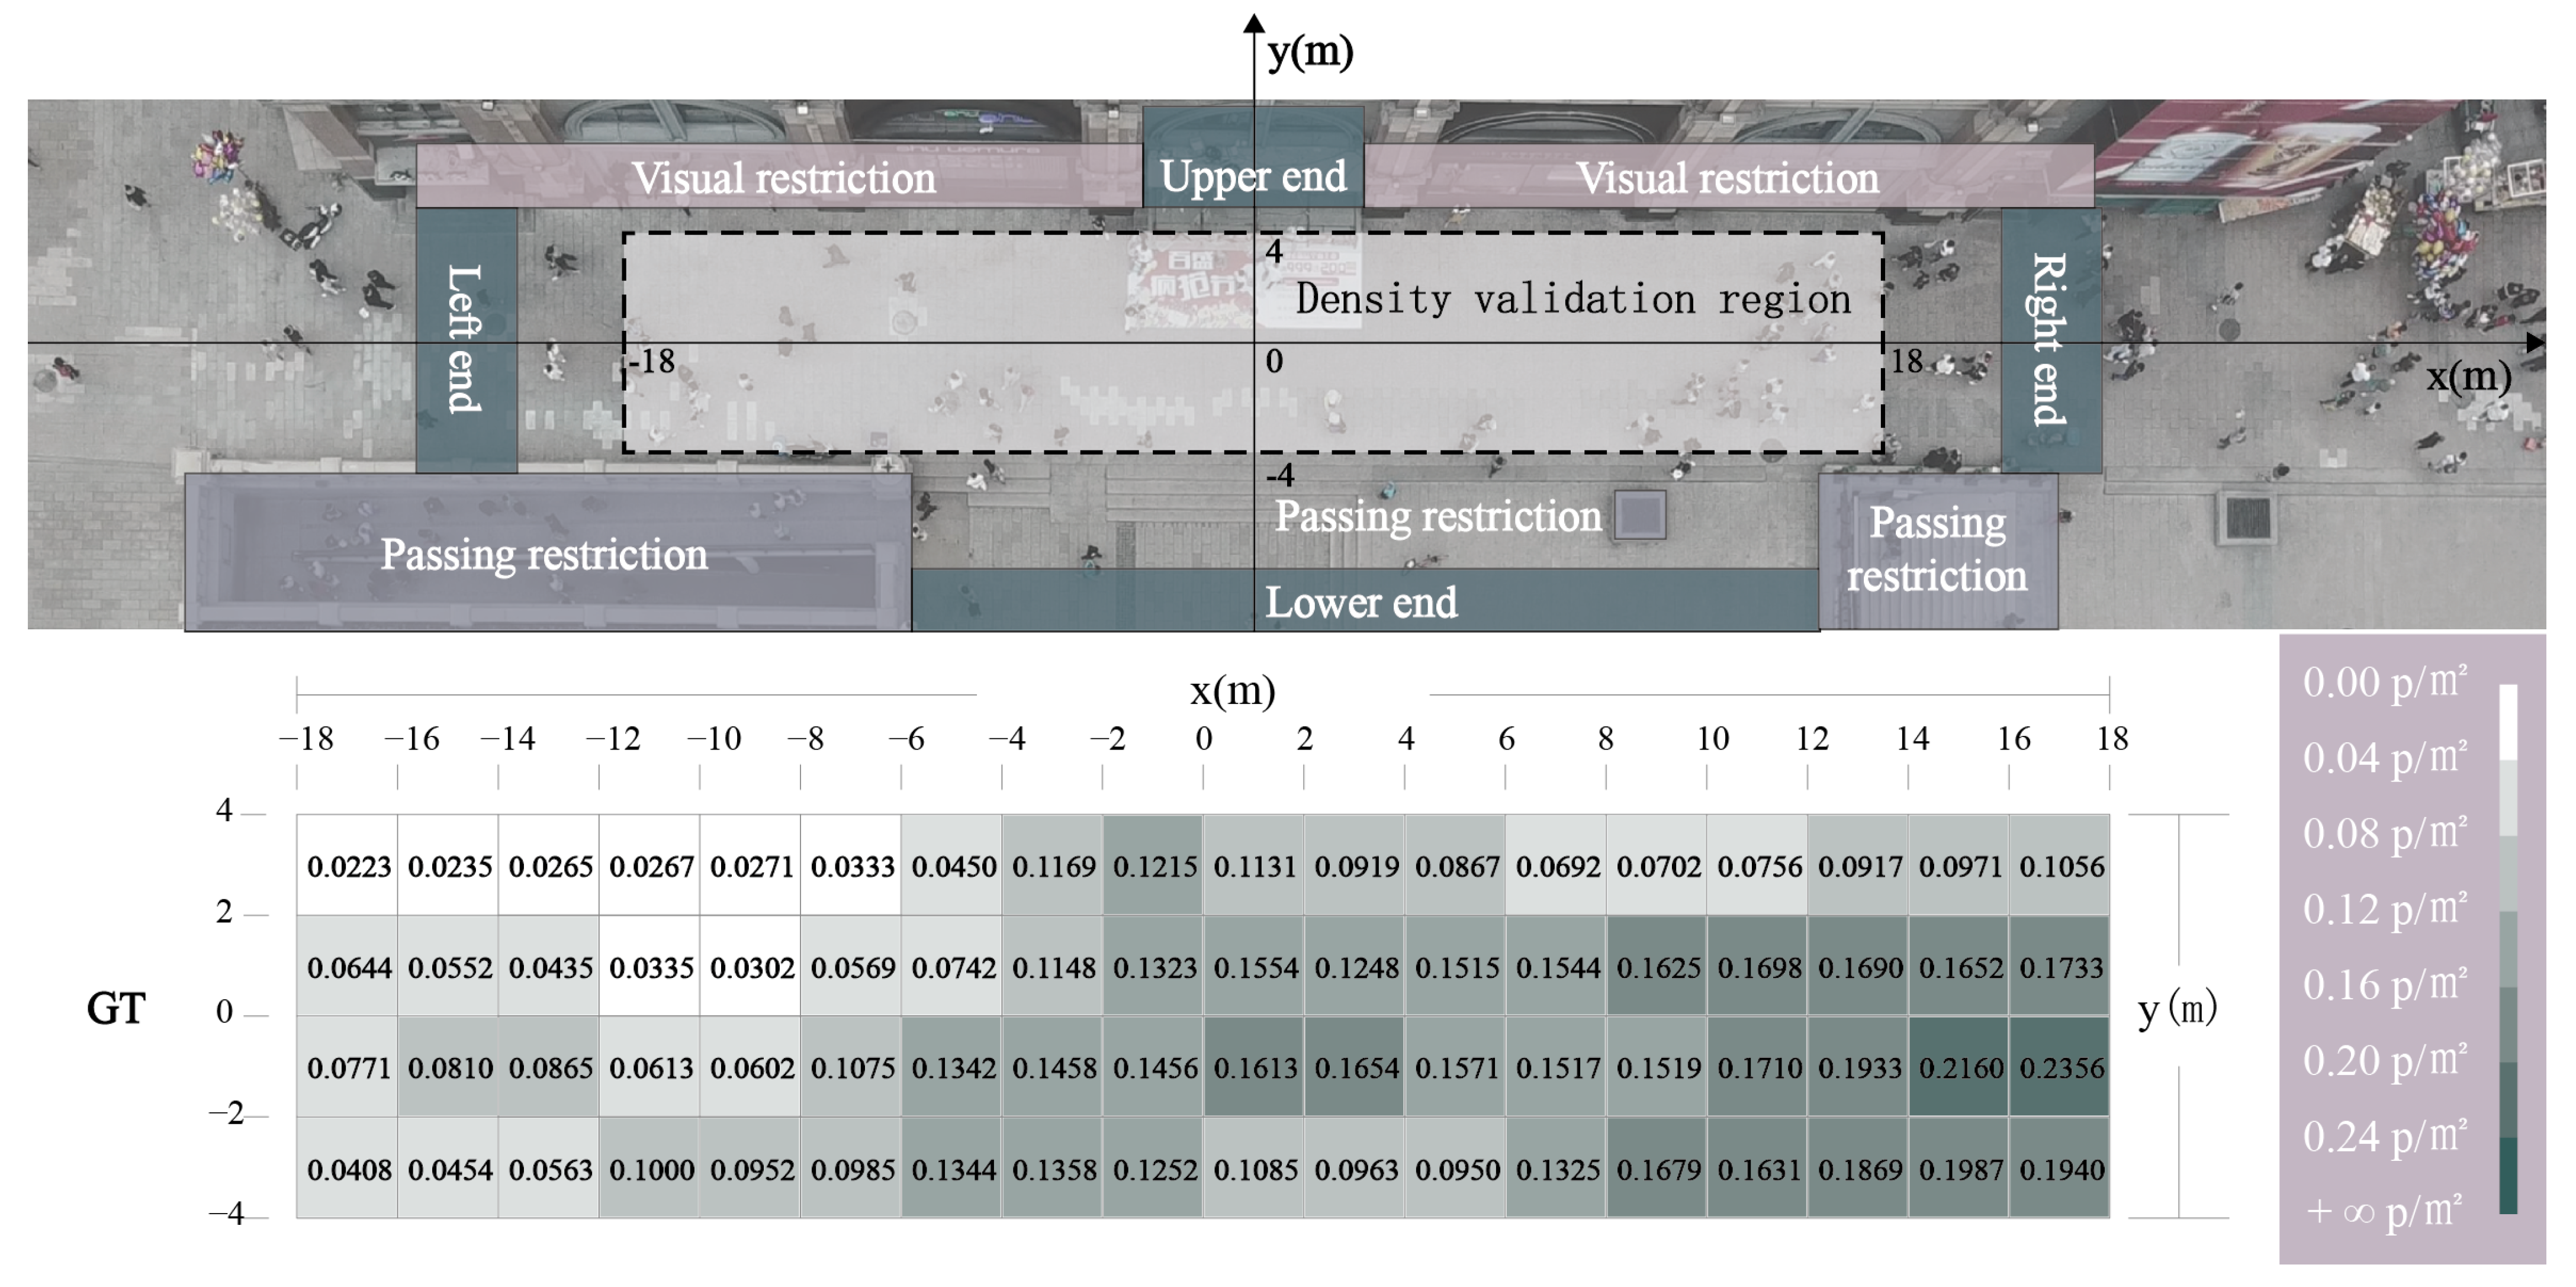
The data collection area for this study is the commercial pedestrian-only space located near the Flood Control Memorial Tower on the north side of Harbin Central Street, as illustrated in Figure 7. The data collection area is 60 m × 9 m, featuring four main entrances and exits, indicated by the green regions in the figure. Aside from these entrances and exits, the space is enclosed by building facades and railings. The density validation area, marked in white, measures 36 m in length and 8 m in width.
Figure 7.
Scene analysis on data collection area.
A video was recorded on Saturday, 1 September 2018, during a sunny day that enhanced the shopping and visiting experience in the square. The recording lasted for 10 min, from 1:45 p.m. to 1:55 p.m. The weather on the day of video recording was clear and sunny, providing ideal conditions for walking. The UAV utilized in this study is the DJI Mavic Pro (DJI, Shenzhen, China), which weighs 743 g and features a camera resolution of 2720 × 1536 pixels. It operates at a shooting frequency of 24 frames/s, with an average measurement error of approximately 0.4641 pixels (0.0182 m) every 0.5 s. During filming, the UAV flew at an altitude of 90 m, allowing it to cover the entire research area and clearly capture pedestrian movements. A total of 1565 pedestrians were recorded in the study area. Most individuals in the case study were young or middle-aged and walked normally toward their destinations. All pedestrians were labeled, and complete trajectories were extracted. The walking speed and direction were calculated using the positional differences between frames.
3.2. Trajectory Extraction
In this study, the open-source software ‘Tracker 5.0.6’, based on the Java framework, is employed to extract trajectories for all pedestrians in the research area. The origin of the coordinate system, along with the positive direction of the x-axis and the standard length, is fixed to a constant background in the video, specifically the building facades and handrails. This approach helps to further minimize the average measurement error. Due to the limited number of pixels available for each pedestrian, the coordinates extracted primarily represent the upper body (head and shoulder) positions. Given the instability of a pedestrian’s shape while walking, the software may occasionally lose track of the target during trajectory extraction []. When this occurs, manual adjustments are made to reposition the tracking target onto the target pedestrian, allowing the software to resume capturing the pedestrian’s path.
The density validation area comprises 72 grid spaces, each measuring 2 m × 2 m. The matrix shown in Figure 7 illustrates the average pedestrian density distribution, calculated from all extracted trajectories in the video using Equation (6) [].
In this context, represents the moment when pedestrian q enters grid space i, while indicates the moment pedestrian q exits that grid space. denotes the area of the grid space, and T is the computation period. The results of these calculations provide the pedestrian density distribution observed in the video, referred to as the ground truth (GT). The data reveals a general trend of high density on the right side and low density on the left. Additionally, there is a concentration of high density at the lower part of the area, while the upper part shows lower density.
4. Validation
The prediction model employed in this study consists of two layers: the tactic layer (TL) model and the operational layer (OL) model. The predictive capability of each layer is validated individually by comparing its performance with that of other models. This capability is quantified using the mean square error (MSE) between the predicted pedestrian density distribution and the ground truth (GT); a smaller MSE indicates better predictive performance. The MSE is calculated using Equation (7).
In this study, n represents the number of grid spaces, which is 72. The variable denotes the average pedestrian density of grid space i as calculated from the ground truth (GT) using Equation (6), while represents the predicted average pedestrian density for grid space i.
4.1. Tactic Layer Validation Model
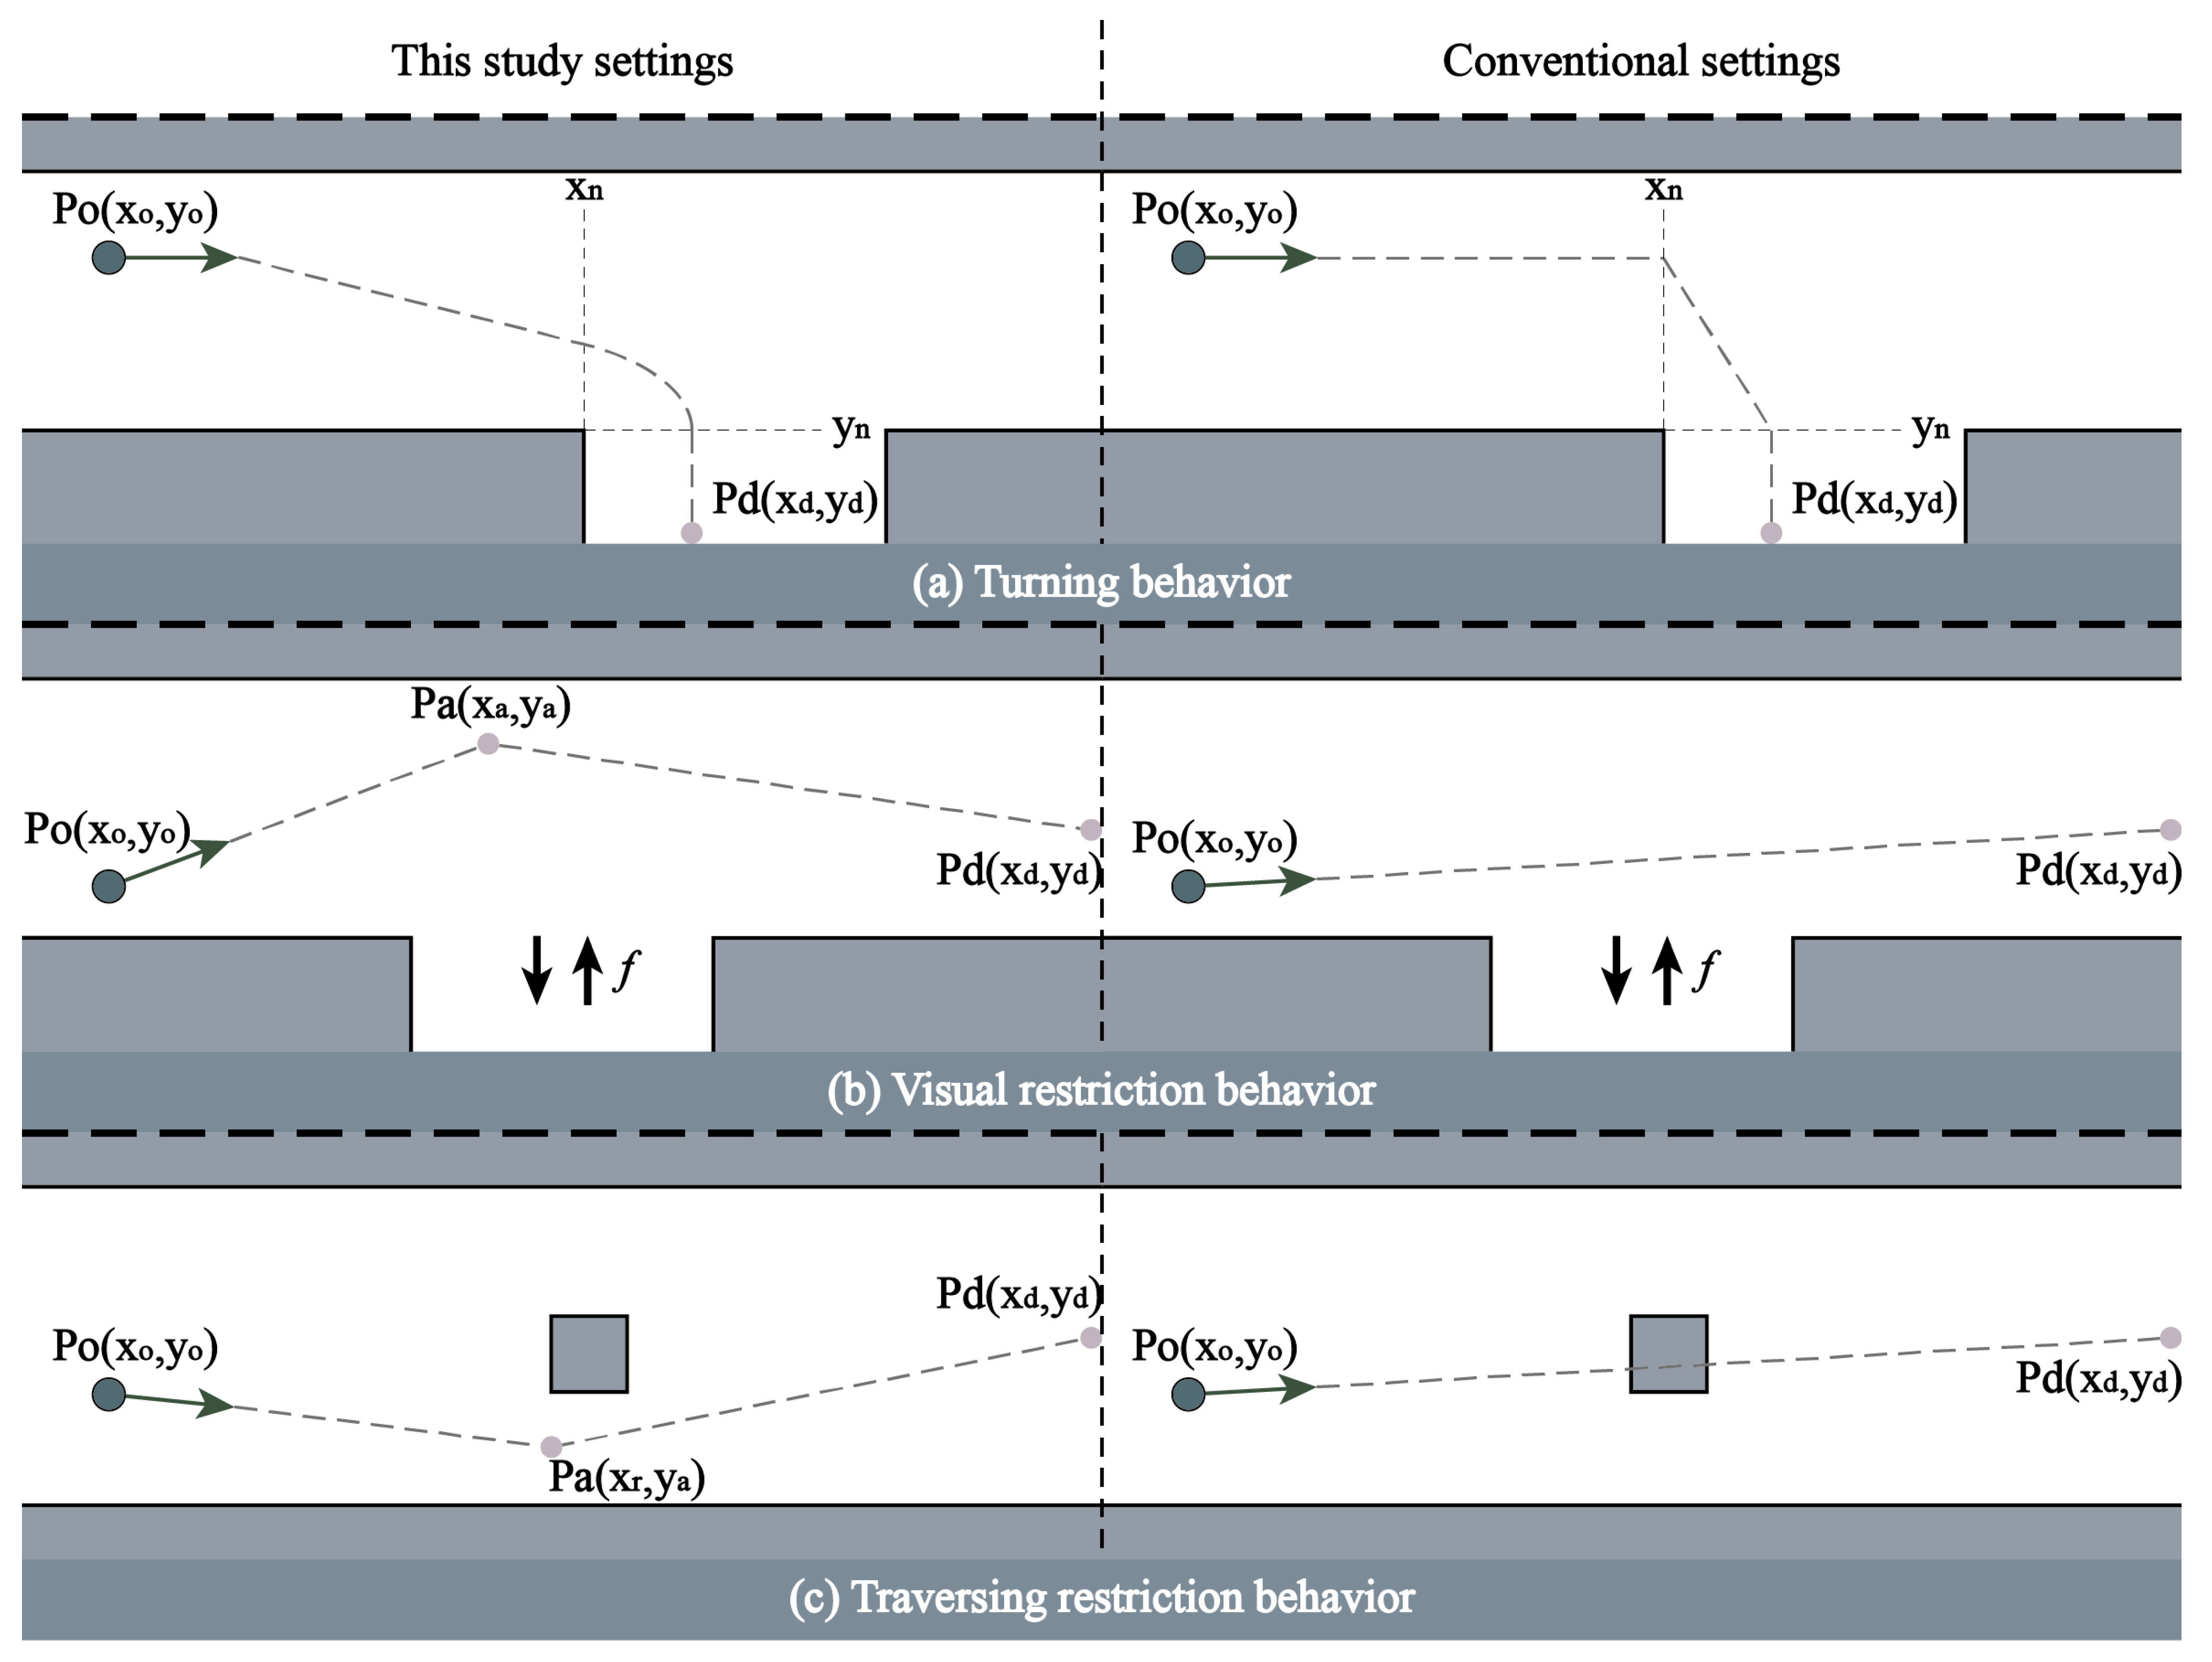
The TL validation model consists of the conventional setting (TL-R) [] and an ablation study. This study models four behaviors: AA, TN, VR, and SR, with differences between the study setting and the conventional setting compared in Figure 8. In the case of AA behavior, both the study and conventional settings are identical. For the conventional TN behavior setting [], when pedestrians need to turn, the inner curve is defined by the x-axis coordinate and the y-axis coordinate . The current position of the pedestrian is . Taking the situation illustrated in Figure 8 as an example, the conventional TN behavior involves three stages: When , the walking aim is ; when and , the walking aim is ; and when , the walking aim is . In the conventional settings for VR and SR behavior, the walking aim is directed toward the destination, with collision avoidance managed solely by the OL model.
Figure 8.
Comparison of this study setting to the general setting of the tactic layer walking behavior model.
This study incorporates TN, VR, and SR behaviors, with the tactic layer model designated as TL-TVS. The ablation study systematically replaces each of these research settings with conventional alternatives. When TN behavior is substituted, the tactic layer model becomes TL-VS. If VR behavior is replaced, the model is TL-TS. Lastly, when SR behavior is substituted, the model changes to TL-TV.
4.2. Operational Layer Validation Model
The OL validation model is a state-of-the-art social force model (SFM) whose collective behavior prediction ability is validated [].
The SFM posits that pedestrian acceleration (a) is influenced by three factors: the driving force toward their walking aim, pedestrian–environment interactions, and inter-pedestrian interactions. Building on the work of Helbing & Molnár [] and Helbing, Farkas & Vicsek [], Moussaïd, Helbing, Garnier, Johansson, Combe & Theraulaz [] further refined the model for quantifying inter-pedestrian interactions, resulting in improved predictions of collective behavior. The calculation method is detailed in Equation (8).
where: represents the driving force toward the walking aim; denotes the interaction between the pedestrian and the environment; signifies the interaction between pedestrian i and other pedestrians (j).
5. Result and Discussion
This research establishes a simulation environment using the NetLogo 6.0.2 platform. The evaluation standard for prediction accuracy is based on the MSE between the predicted results for all grid spaces and the GT. The MSE is calculated using Equation (7), with a smaller MSE indicating greater prediction accuracy.
5.1. Parameter Calibration
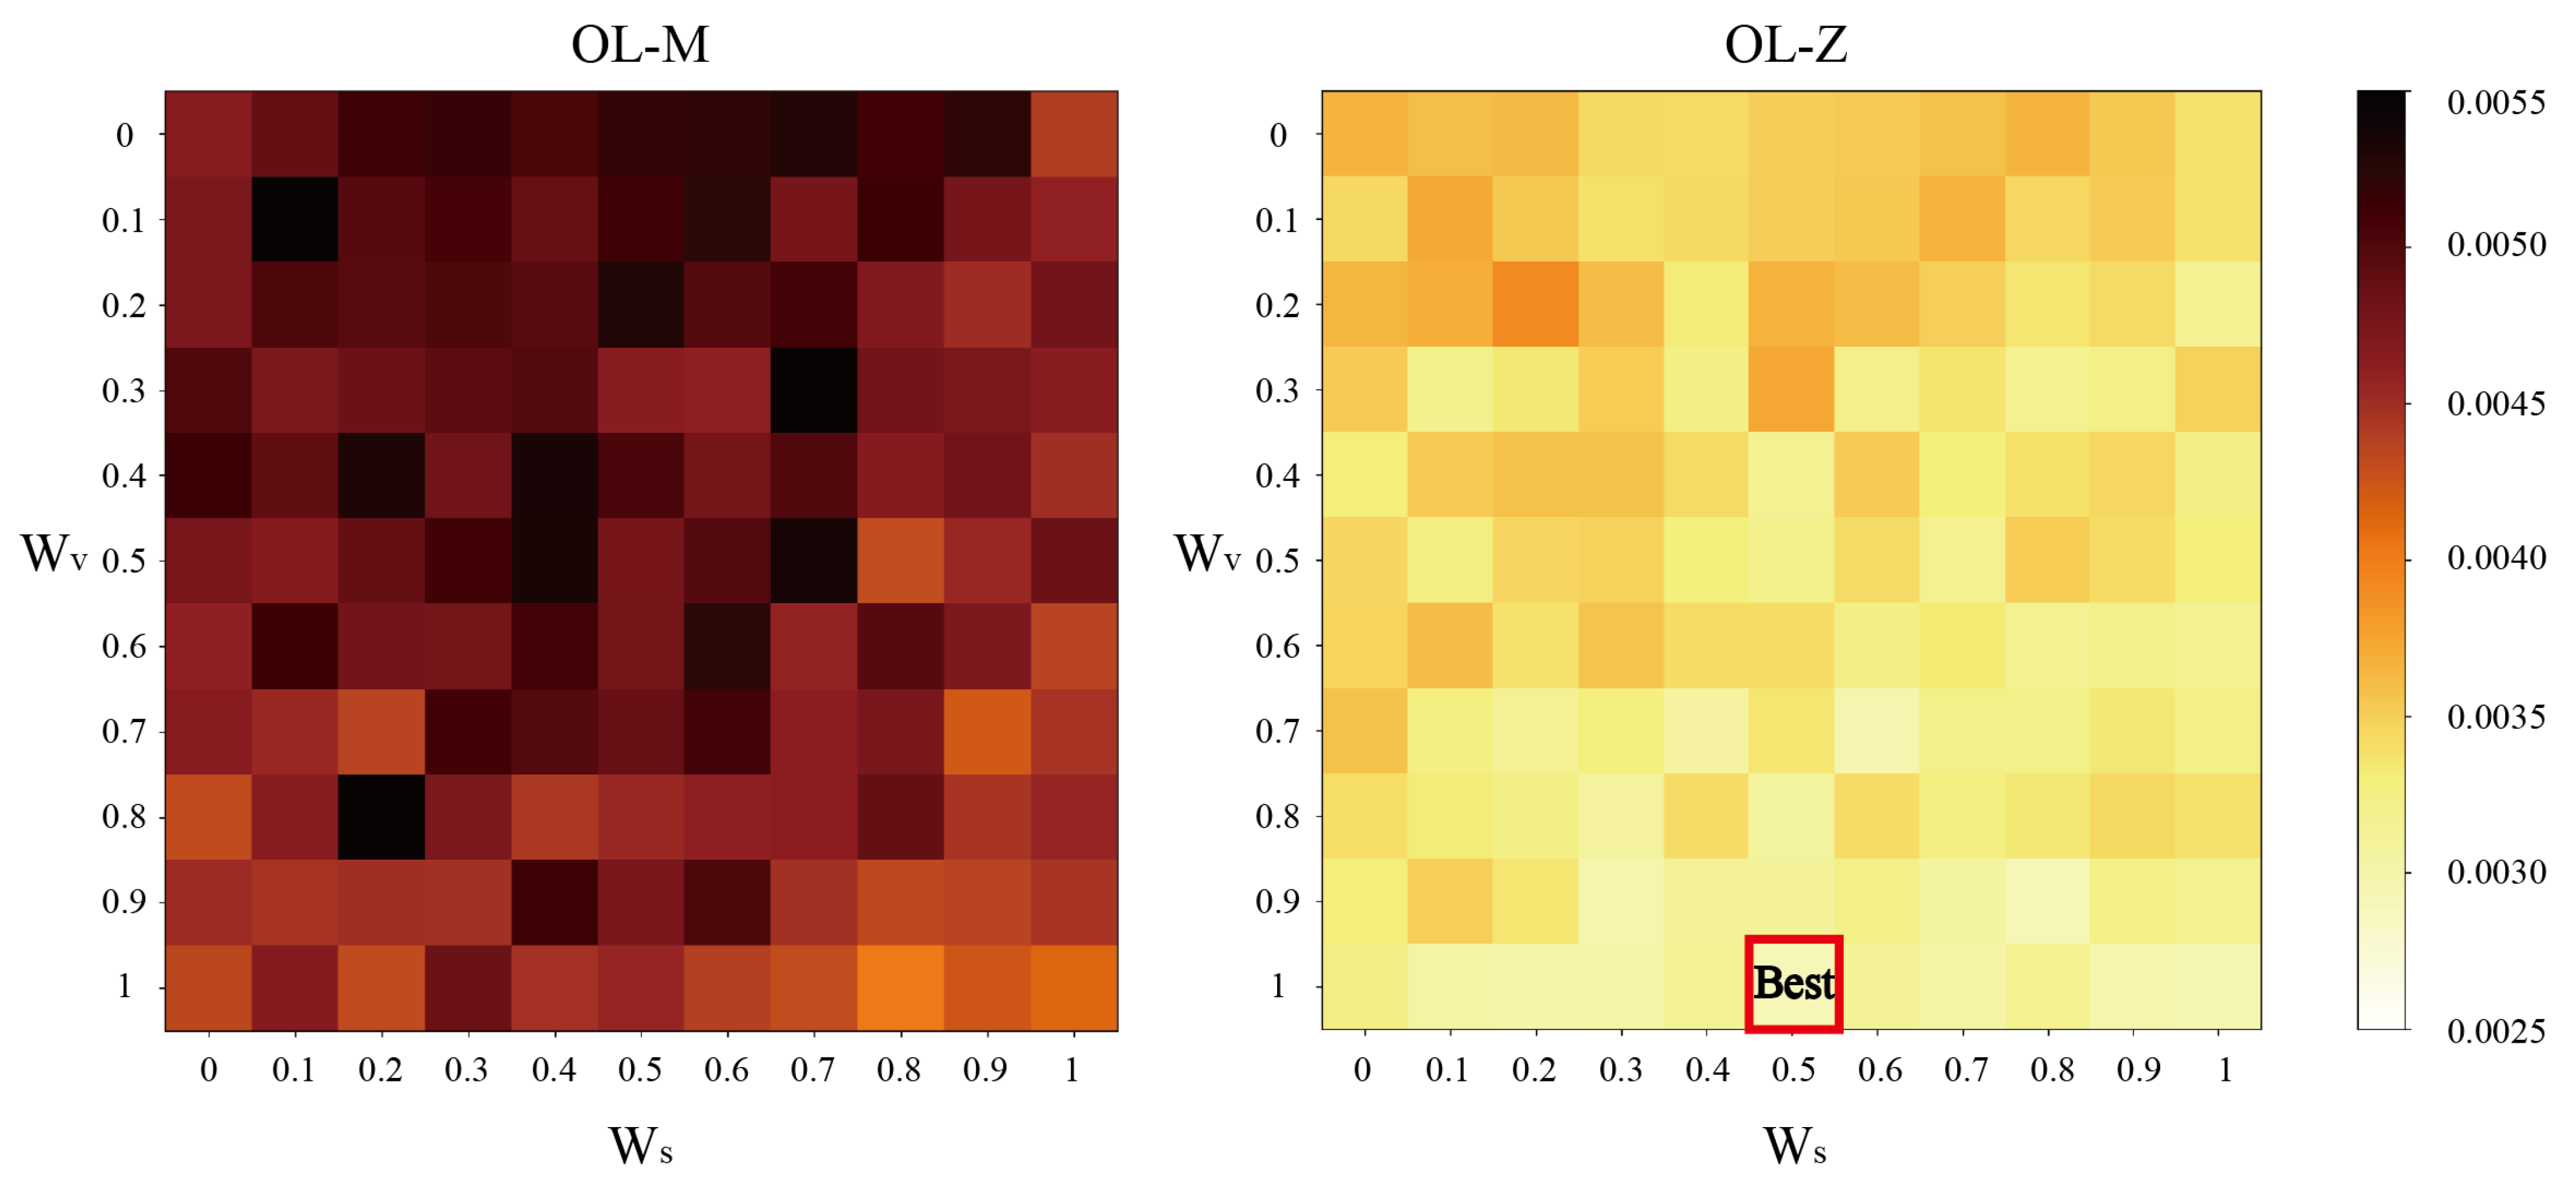
During the parameter calibration process, the two parameters representing the influences of visual restriction (VR) and spatial restriction (SR) ( and ) were further examined to determine an effective integration method for multiple spatial factors. The values of and were varied from 0 to 1 in increments of 0.1 in conjunction with OL-M and OL-Z, with the corresponding MSE for all trials displayed in Figure 9. Specifically, when is 0, the TL layer model is identified as TL-TS; when is 0, the model is TL-TV; and when both and are 0, the model is TL-T.
Figure 9.
The MSE of all parameter combinations tested.
As shown in Table 1, the prediction accuracy of the model proposed in this study (TL-TVS-OL-Z) surpasses that of other models. Notably, when is set to 1 and to 0.5, the TL-TVS-OL-Z model demonstrates the highest prediction accuracy.
Table 1.
The parameter calibration result and the MSE of the average density between the predictions and the ground truth (persons/m2).
5.2. Operational Layer Prediction Result and Error
Table 1 indicates that the prediction accuracy of all five TL models is higher when combined with the OL-Z model compared to the OL-M model, and this difference is also significant.
As illustrated in Figure 10, we compare the prediction results and errors of the TL-TVS-OL-M model with the TL-TVS-OL-Z model. This example highlights the differences between the two models. There are two main reasons for this outcome. First, the OL-Z model incorporates pedestrian grouping behavior, a critical factor influencing walking dynamics [,]. Its design ensures that the distances between pedestrians remain within a more realistic range, and the interactions within social groups mitigate abrupt changes in walking behavior, aligning closely with real-world observations. It can be noticed that the prediction result of OL-M model for pedestrian density in some areas is significantly lower than that in surrounding areas, which can be caused by the predicted abrupt changes. Second, the OL-Z model introduces randomness into walking behavior, reflecting the inherent variability of pedestrian movements. This randomness reduces the gradient of density changes in the predicted results, making them more representative of actual conditions.
Figure 10.
Comparison of the prediction results and errors of TL-TVS-OL-M and TL-TVS-OL-M models.
As shown in Figure 10, there are significant differences between prediction results predicted by OL-M and OL-Z models. This validates the importance of selecting proper operational layer models when analysing a specific kind of walking environment.
The OL-M model tends to overestimate density in the triangular area between 8∼18 m on the x-axis and −4∼−2 m on the y-axis when compared to the OL-Z model. This overestimation occurs because the OL-M model adjusts predicted walking behavior more rapidly in response to changes in the tactic layer (TL) model’s walking aim. This behavior is inconsistent with real-world observations, where group dynamics typically slow the pace of behavioral changes. Moreover, while both models exhibit similar regions of overestimation and underestimation, the discrepancies are more pronounced in the OL-M model. This indicates that while proper randomness settings may not be critical for predicting individual walking trajectories, they play a vital role in reducing prediction errors in collective scenarios.
5.3. Tactic Layer Prediction Result and Error
Table 1 demonstrates that the TL-TVS model, when combined with each OL model, effectively enhances prediction accuracy. The TL-R model exhibits the largest mean square error (MSE), highlighting the importance of the TL model in improving the predictive capability of collective walking behavior.
5.3.1. TN Behavior Model Analysis
Figure 11 illustrates the outcomes of replacing the conventional TN behavior setting with the TN behavior model proposed in this study. This facilitates a discussion of the observed differences and their underlying causes.
Figure 11.
Comparison of the prediction results and errors of TL-TVS-OL-M and TL-TVS-OL-M models TL-R-OL-Z and TL-T-OL-Z models.
The prediction results indicate that the TL-R model generates strong density gradients within the x-axis range of 10∼18 m. In this model, all pedestrians execute their turns simultaneously, leading to a sharp decline in density along the turning path. Conversely, the random starting positions of pedestrians approaching the inner curve in other models introduce variability, which reduces the density gradient.
The comparison of prediction errors reveals that the TL-R model tends to overestimate density in the region between 8∼18 m on the x-axis and −4∼−2 m on the y-axis. This overestimation likely results from the premature initiation of turning behavior, causing predicted turns to occur too quickly and accumulate in this area. Consequently, pedestrian density is underestimated in the region between 0∼8 m on the x-axis and −2∼2 m on the y-axis. In contrast, the TN behavior model used in this study accurately represents the gradual turning of pedestrians toward their intended path. This suggests that the influential area of the turning region extends beyond the corner itself, potentially reaching 4∼8 m away. Such insights are valuable for optimizing the placement of turning locations.
5.3.2. VR and SR Behavior Model Analysis
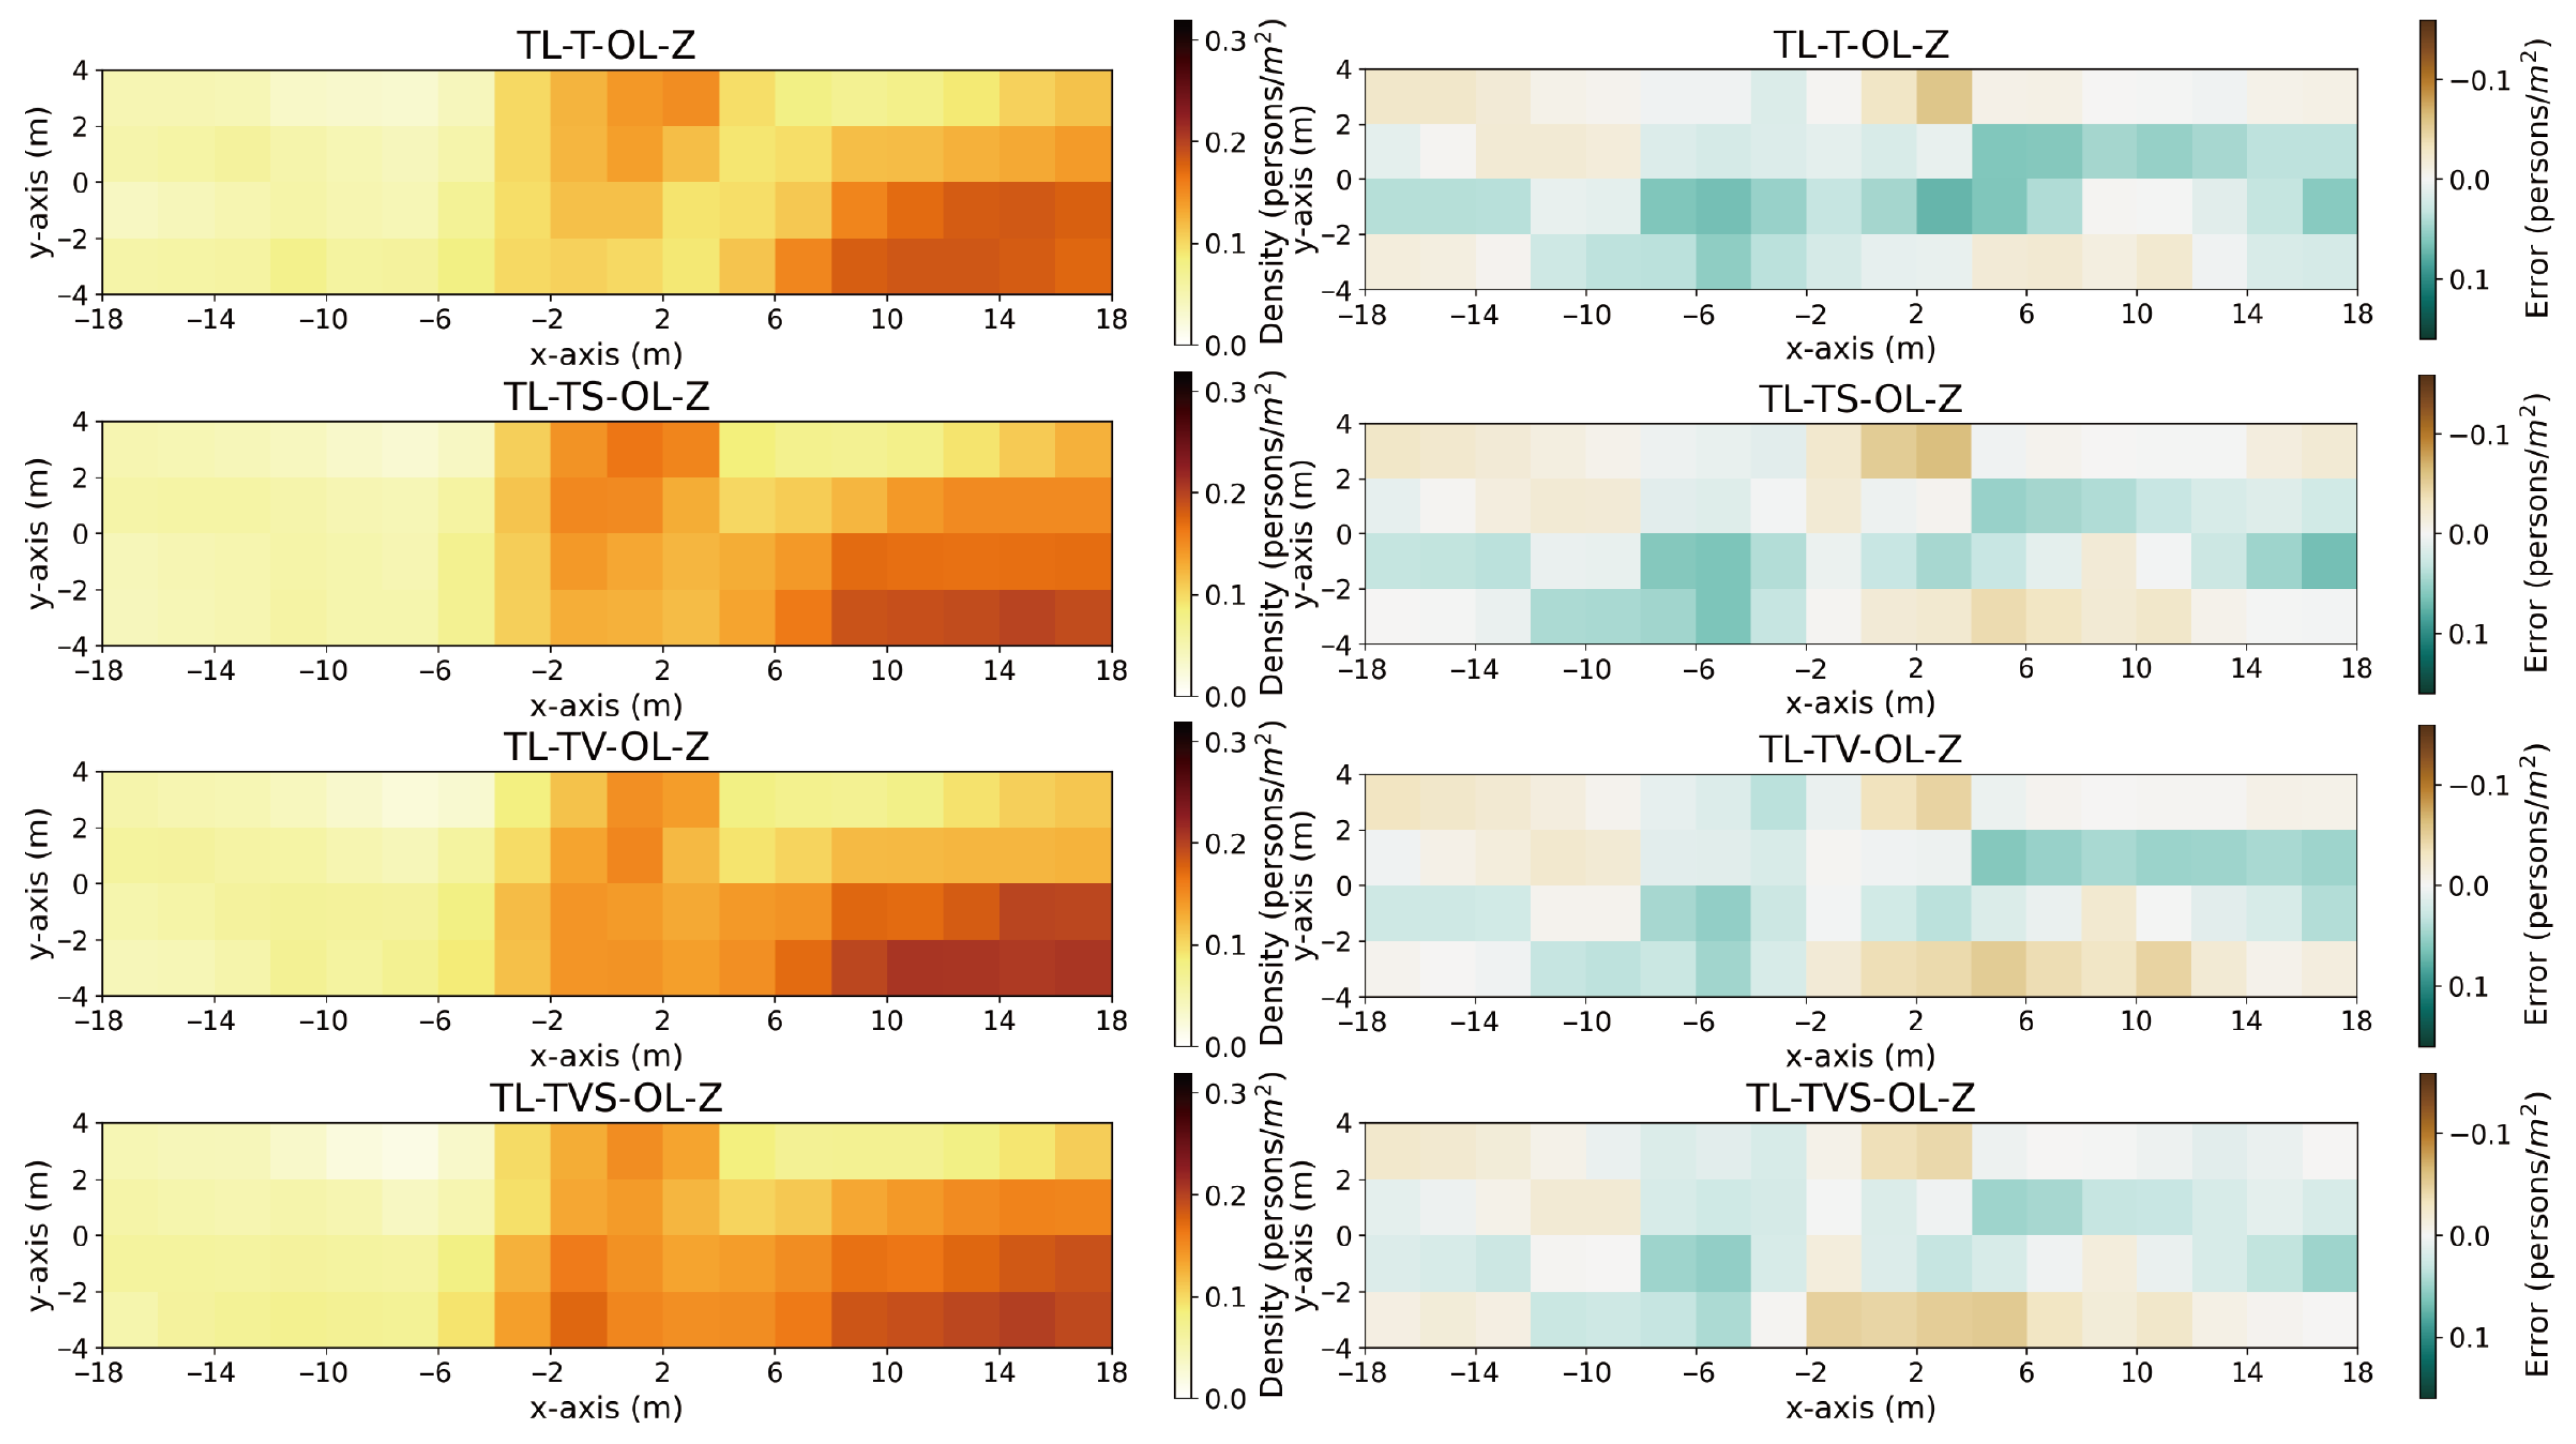
Figure 12 presents the prediction results and errors associated with incorporating VR and SR models into the TN behavior model. Notably, the TL-TVS-OL-Z model demonstrates the smallest prediction error compared to the ground truth. It is observed that prediction errors are larger near the boundaries. This can be attributed to the boundary effect, where results in these areas are more influenced by random settings than by the prediction model itself, resulting in increased errors.
Figure 12.
Comparison of the prediction results and errors of TL-TVS-OL-M and TL-TVS-OL-M models TL-T-OL-Z, TL-TS-OL-Z, TL-TV-OL-Z and TL-TVS-OL-Z models.
The prediction results indicate that the TL-T and TL-TS models exhibit a less pronounced density trend, showing smaller values at the upper part and larger values at the lower part compared to the TL-TV and TL-TVS models. This discrepancy may stem from the TL-T and TL-TS models’ inability to account for path deviations caused by pedestrian behavior near building entrances, which reduces the gradient of pedestrian density distribution and fails to accurately reflect real-world scenarios. Additionally, the comparison of prediction errors reveals that models not incorporating VR behavior (TL-R and TL-TS) tend to underestimate density in the regions of −8∼4 m on the x-axis and −2∼0 m on the y-axis, as well as −8∼−2 m on the x-axis and −4∼−2 m on the y-axis. This discrepancy likely arises from the influence of busy commercial entrances, which divert pedestrians to these areas—an effect not captured by the models. The findings suggest that pedestrians are often pushed away from building entrances, with an influential range exceeding 8 m. This information is vital for determining the locations of building entrances and designing adjacent spaces.
Furthermore, the TL-TV model predicts a high pedestrian density in the region between 6∼14 m on the x-axis and −4∼−2 m on the y-axis. In contrast, the TL-R and TL-TV models forecast a low density in the area between 4∼12 m on the x-axis and 0∼2 m on the y-axis. This discrepancy can be attributed to an obstacle located below the density validation area, which alters pedestrian trajectories. Since pedestrians in the TL-R and TL-TV models do not anticipate the presence of obstacles, they tend to cluster around them, impacting the movement of others nearby. The influence of spatial restriction (SR) behavior can mitigate the deceleration caused by the obstacle, thereby reducing this clustering tendency. The effective range of obstacles can extend up to 10 m for pedestrian density distribution, although their impact on individual walking behavior is comparatively smaller. These findings are valuable for the strategic placement of obstacles in pedestrian areas.
6. Conclusions
This study develops a pedestrian flow prediction model tailored for urban pedestrian-only spaces. The walking direction is determined by a tactic layer (TL) model that integrates multiple influencing factors. This direction is a crucial input for velocity prediction in the operational layer (OL), creating a collective behavior model for complex urban walking scenarios. When applied to Harbin Central Street, the model achieves a pedestrian density distribution prediction error of 0.0029 person/m2, which is lower than that of conventional TL models, models lacking TL behaviors, or those employing different OL models. Compared to the TL-R-OL-M model, this represents a 46.3% improvement.
For the tactic layer, a comprehensive approach that incorporates multiple factors significantly enhances prediction accuracy. Key behaviors—such as turning, visual restriction, and spatial restriction—are crucial for reflecting collective patterns. Omitting any of these factors impairs accuracy, as the environmental elements triggering them exert a broad influence on collective behavior.
For the operational layer, under natural walking conditions in pedestrian-only spaces dominated by leisurely pedestrians, incorporating group and random behaviors can delay changes in walking behavior caused by shifts in desired direction and reduce the density gradient. An operational layer that fits the application scenario can significantly enhance the prediction of collective behaviors.
In urban pedestrian-only spaces, both the tactic and operational layers are essential for accurate behavior prediction. Omitting path planning settings or using models not validated in urban environments compromises prediction accuracy.
7. Application and Future Work
This paper presents a collective behavior prediction model designed to effectively assess the use of urban pedestrian-only spaces, which are increasingly vital in daily life. The model can identify areas that are prone to overcrowding or potential hazards and explore appropriate solutions.
The model can be applied to identify critical regions for designing walking environments. When a preliminary design plan for urban pedestrian-only spaces is proposed, this model can predict pedestrian density distribution, highlighting overcrowded areas that require intervention and underutilized spaces that can be activated. The interaction principles identified in this study can assist in optimizing overcrowded conditions, while underutilized areas may be suitable for static activities []. Furthermore, when temporary obstacles need to be introduced, this model can simulate various scenarios to identify solutions that minimally disrupt the original walking conditions. Additionally, the model facilitates an analysis of unsuitable application scenarios, enabling the identification of methods to address issues by leveraging the interactions between environmental factors and collective behavior uncovered in this research.
In the future, the findings can be expanded in several ways. First, due to the limited availability of pedestrian walking data in urban pedestrian-only spaces and the challenges in extracting walking trajectories, this model has only been validated in a commercial environment. If methods for extracting walking trajectories improve or if pedestrian behavior data from other environments become available, the parameters can be adjusted to more accurately describe pedestrian density distribution in various walking environments. Second, this study aims to develop a model for predicting walking behavior without considering the function of the space, focusing solely on geometric conditions. If future research can gather sufficient data from specific types of walking environments, additional factors—such as the distribution of facilities, environmental comfort, and user characteristics—can be integrated according to the space’s function, further enhancing the model. Third, in response to sudden crowds and severe weather, the flexibility of this model enables the operational layer to be adjusted or replaced with corresponding models specifically designed to address these conditions.
Author Contributions
Conceptualization, S.S.; methodology, S.S.; software, S.S.; validation, S.S., C.S., Y.L., Y.Y. and D.Q.; formal analysis, S.S., C.S. and Y.L.; data curation, S.S.; writing—original draft preparation, S.S.; writing—review and editing, Y.L., Y.Y. and D.Q.; visualization, Y.Y. and D.Q.; supervision, C.S.; funding acquisition, S.S., C.S., Y.L., Y.Y. and D.Q. All authors have read and agreed to the published version of the manuscript.
Funding
This work was funded by the National Key Research and Development Program of China (Grant number 2024YFC3808901), National Natural Science Foundation of China (Grant number 52308089, 51878202, 52108009), Heilongjiang Natural Science Foundation (Grant No. LH2023E048) and the Fundamental Research Funds for the Central Universities (Grant No. HIT.NSFJG202230).
Data Availability Statement
The original contributions presented in this study are included in the article. Further inquiries can be directed to the corresponding authors.
Conflicts of Interest
The authors declare no conflicts of interest.
References
- Sadeghpoor, F.; Ranjbar, E.; Esmaeilinasab, M.; Valiloo, M.H.S.; Nieuwenhuijsen, M.J. Streets and stress: A pilot study on how quality and design of streets impacts on urban stress. HERD Health Environ. Res. Des. J. 2024, 17, 224–248. [Google Scholar] [CrossRef] [PubMed]
- Transportation Research Board. Highway Capacity Manual, 4th ed.; Transportation Research Board: Washington, DC, USA, 2000. [Google Scholar]
- Cepolina, E.M.; Menichini, F.; Rojas, P.G. Level of service of pedestrian facilities: Modelling human comfort perception in the evaluation of pedestrian behavior patterns. Transp. Res. Part F Traffic Psychol. Behav. 2018, 58, 365–381. [Google Scholar] [CrossRef]
- He, Y.; Chen, X.; Tian, M.; Zhang, C.; Kang, J. Research on the layout of courtyard apace in underground commercial streets. Buildings 2025, 15, 1549. [Google Scholar] [CrossRef]
- Kim, J.Y.; Kim, Y.O. Analysis of pedestrian behaviors in subway station using agent-based model: Case of Gangnam Station, Seoul, Korea. Buildings 2023, 13, 537. [Google Scholar] [CrossRef]
- Tordeux, A.; Lämmel, G.; Hänseler, F.; Steffen, B. A mesoscopic model for large-scale simulation of pedestrian dynamics. Transp. Res. Part C Emerg. Technol. 2018, 93, 128–147. [Google Scholar] [CrossRef]
- Sargoni, O.T.; Manley, E. Neighbourhood-level pedestrian navigation using the construal level theory. Environ. Plan. B Urban Anal. City Sci. 2023, 50, 2151–2170. [Google Scholar] [CrossRef]
- Yang, X.; Dong, H.; Wang, Q.; Chen, Y.; Hu, X. Guided crowd dynamics via modified social force model. Phys. A Stat. Mech. Its Appl. 2014, 411, 63–73. [Google Scholar] [CrossRef]
- Song, X.; Chen, K.; Li, X.; Sun, J.; Hou, B.; Cui, Y.; Zhang, B.; Xiong, G.; Qang, Z. Pedestrian trajectory prediction based on deep convolutional LSTM network. IEEE Trans. Intell. Transp. Syst. 2021, 22, 3285–3302. [Google Scholar] [CrossRef]
- Alahi, A.; Goel, K.; Ramanathan, V.; Li, F.; Savarese, S. Social LSTM: Human trajectory prediction in crowded spaces. In Proceedings of the IEEE Computer Society Conference on Computer Vision and Pattern Recognition, Las Vegas, NV, USA, 27–30 June 2016. [Google Scholar]
- Peng, Y.; Zhang, G.; Shi, J.; Xu, B.; Zheng, L. SRAI-LSTM: A Social Relation Attention-based Interaction-aware LSTM for human trajectory prediction. IEEE Trans. Intell. Transp. Syst. 2022, 490, 258–268. [Google Scholar] [CrossRef]
- Jiang, N.; Lee, E.W.M.; Li, X.; Yu, H.; Xie, W.; Yang, L.; Yuen, R.K.K.; Yoeh, G.H. FAM-LSTM: Predicting macroscopic pedestrian dynamics through data-driven method. IEEE Trans. Intell. Transp. Syst. 2025, 26, 7113–7126. [Google Scholar] [CrossRef]
- Huang, S.; Wei, R.; Lian, L.; Lo, S.; Lu, S. Review of the application of neural network approaches in pedestrian dynamics studies. Heliyon 2024, 10, e30659. [Google Scholar] [CrossRef]
- Lundberg, S.M.; Lee, S. A unified approach to interpreting model predictions. Adv. Neural Inf. Process. Syst. 2017, 30, 4768–4777. [Google Scholar]
- Cui, X.; Ji, J.; Bai, X. Algorithm and examples of an agent-based evacuation model. Fire 2023, 6, 11. [Google Scholar] [CrossRef]
- Lee, S.; Lee, K.; Kang, S. Study on a pedestrian simulation model of natural movement. J. Asian Archit. Build. Eng. 2013, 12, 41–48. [Google Scholar] [CrossRef]
- Hussein, M.; Sayed, T. Validation of an agent-based microscopic pedestrian simulation model in a crowded pedestrian walking environment. Transp. Plan. Technol. 2019, 42, 1–22. [Google Scholar] [CrossRef]
- Ma, L.; Brandt, S.A.; Seipel, S.; Ma, D. Simple agents-complex emergent path systems: Agent-based modelling of pedestrian movement. Environ. Plan. B Urban Anal. City Sci. 2024, 51, 479–495. [Google Scholar] [CrossRef]
- Bossowski, J.; Szandal, T.; Mazurkiewicz, J. Predicting desire paths: Agent-based simulation for neighbourhood route planning. Comput. Environ. Urban Syst. 2025, 117, 102251. [Google Scholar] [CrossRef]
- Helbing, D.; Molnár, P. Social force model for pedestrian dynamics. Phys. Rev. E 1995, 51, 4282–4286. [Google Scholar] [CrossRef]
- Johansson, A.; Helbing, D.; Shukla, P.K. Specification of the social force pedestrian model by evolutionary adjustment to video tracking data. Adv. Complex Syst. 2007, 10, 271–288. [Google Scholar] [CrossRef]
- Moussaïd, M.; Helbing, D.; Garnier, S.; Johansson, A.; Combe, M.; Theraulaz, G. Experimental study of the behavioural mechanisms underlying self-organization in human crowds. Proc. R. Soc. B Biol. Sci. 2009, 276, 2755–2762. [Google Scholar] [CrossRef]
- Sun, C.; Sun, S.; Qu, D.; Zhu, X.; Liu, Y. Modeling of pedestrian turning behavior and prediction of pedestrian density distribution. Phys. A Stat. Mech. Its Appl. 2023, 630, 129217. [Google Scholar] [CrossRef]
- Niu, H.; Zhang, Y.; Li, L.; Han, Y.; Hou, Q.; Niu, S. Analysis of the effect of obstacles on evacuation efficiency in emergencies. J. Stat. Mech. Theory Exp. 2024, 2024, 063405. [Google Scholar] [CrossRef]
- Chen, H.; Peng, F.; Huang, D.; Liu, S.; Ni, Y.; Yang, L. Experimental study on dynamics characteristic parameter of turning behavior in self-driven mechanism. Phys. A Stat. Mech. Its Appl. 2020, 549, 124497. [Google Scholar] [CrossRef]
- Fang, K.; Wang, X.; Chen, L.; Zhang, Z.; Furuya, N. Research on the correlation between pedestrian density and street spatial characteristics of commercial blocks in downtown area: A case study on Shanghai Tianzifang. J. Asian Archit. Build. Eng. 2019, 18, 233–246. [Google Scholar] [CrossRef]
- Hoogendoorn, S.P.; Bovy, P.H.L. Pedestrian route-choice and activity scheduling theory and models. Transp. Res. Part B Methodol. 2004, 38, 169–190. [Google Scholar] [CrossRef]
- Yang, G.; Pulgarin, E.J.L.; Herrmann, G. A hierarchical forecasting model of pedestrian crossing behavior for autonomous vehicle. IEEE Access 2024, 12, 9025–9037. [Google Scholar] [CrossRef]
- Zhao, Y.; Liu, H.; Gao, K. An evacuation simulation method based on an improved artificial bee colony algorithm and a social force model. Appl. Intell. 2021, 51, 100–123. [Google Scholar] [CrossRef]
- Maslow, A.H. A theory of human motivation. Psychol. Rev. 1943, 50, 370–396. [Google Scholar] [CrossRef]
- Dias, C.; Loverglio, R. Calibrating cellular automaton models for pedestrians walking through corners. Phys. Lett. A 2018, 382, 1255–1261. [Google Scholar] [CrossRef]
- Wu, X.; Yue, H.; Liu, Q.; Zhang, X.; Shao, C. Experimental analysis and simulation study on turning behavior of pedestrians in L-shaped corridor. Acta Phys. Sin. 2021, 70, 148901. [Google Scholar] [CrossRef]
- Yuan, Z.L.; Guo, R.Z.; Tang, S.J.; He, B.; Bian, L.; Li, Y. Simulation of the separating crowd behavior in a T-shaped channel based on the social force model. IEEE Access 2019, 7, 13668–13682. [Google Scholar] [CrossRef]
- Fajen, B.R.; Warren, W.H. Behavioral dynamics of steering, obstacle avoidance, and route selection. J. Exp. Psychol. Hum. Percept. Perform. 2003, 29, 343–362. [Google Scholar] [CrossRef]
- Sun, S.; Sun, C.; Duives, D.C.; Hoogendoorn, S.P. Deviation of pedestrian path due to the presence of building entrances. J. Adv. Transp. 2021, 2021, 5594738. [Google Scholar] [CrossRef]
- Zanlungo, F.; Ikeda, T.; Kanda, T. Potential for the dynamics of pedestrians in a socially interacting group. Phys. Rev. E 2014, 89, 012811. [Google Scholar] [CrossRef]
- Ma, J.; Song, W.; Fang, Z.; Lo, S.; Liao, G. TExperimental study on microscopic moving characteristics of pedestrians in built corridor based on digital image processing. Build. Environ. 2010, 45, 2160–2169. [Google Scholar] [CrossRef]
- Zhang, R.; Ou, H.; Shi, P.; Tang, P.; Xu, Y.; Wang, R. A lightweight dense pedestrian detection and tracking algorithm based on improved YOLOv8 and deep sort. Signal Image Video Process. 2025, 19, 508. [Google Scholar] [CrossRef]
- Duives, D.C.; Daamen, W.; Hoogendoorn, S.P. Quantification of the level of crowdedness for pedestrian movements. Phys. A Stat. Mech. Its Appl. 2015, 427, 162–180. [Google Scholar] [CrossRef]
- Dias, C.; Ejtemai, O.; Sarvi, M.; Burd, M. Exploring pedestrian walking through angled corridors. Transp. Res. Procedia 2014, 2, 19–25. [Google Scholar] [CrossRef]
- Helbing, D.; Farkas, I.; Vicsek, T. Simulating dynamical features of escape panic. Nature 2000, 407, 487–490. [Google Scholar] [CrossRef] [PubMed]
- Moussaïd, M.; Perozo, N.; Garnier, S.; Helbing, D.; Theraulaz, G. The walking behaviour of pedestrian social groups and its impact on crowd dynamics. PLoS ONE 2010, 5, e10047. [Google Scholar] [CrossRef]
- Sun, S.; Sun, C.; Duives, D.C.; Hoogendoorn, S.P. Neural network model for predicting variation in walking dynamics of pedestrians in social groups. Transportation 2023, 50, 837–868. [Google Scholar] [CrossRef]
- Kitade, T.; Satake, S.; Kanda, T.; Imai, M. Understanding suitable locations for waiting. In Proceedings of the 8th ACM/IEEE International Conference on Human-Robot Interaction (HRI 2013), Tokyo, Japan, 3–6 March 2013; pp. 57–64. [Google Scholar]
Disclaimer/Publisher’s Note: The statements, opinions and data contained in all publications are solely those of the individual author(s) and contributor(s) and not of MDPI and/or the editor(s). MDPI and/or the editor(s) disclaim responsibility for any injury to people or property resulting from any ideas, methods, instructions or products referred to in the content. |
© 2025 by the authors. Licensee MDPI, Basel, Switzerland. This article is an open access article distributed under the terms and conditions of the Creative Commons Attribution (CC BY) license (https://creativecommons.org/licenses/by/4.0/).