Abstract
This study assessed the impact of 39 active and passive energy efficiency measures on the energy demand of a prototype dwelling, modeled through parametric simulations in DesignBuilder across nine climatic zones in Chile, classified according to the Köppen system. Each measure was evaluated individually (single-measure scenarios); three variation levels were evaluated to quantify their relative influence on energy demand. Results indicate that passive strategies are more effective in cold and humid climates, where increasing wall insulation thickness reduced energy demand by up to 45%, and improving airtightness achieved a 43% reduction. In contrast, in tundra climates or areas with high thermal variability, some measures, such as green façades or overhangs, increased energy demand by up to 49% due to the loss of useful solar gains. In desert climates, characterized by high diurnal temperature variation, thermal mass played a more significant role: high-inertia walls without additional insulation outperformed lightweight EPS-based solutions. The findings suggest that measure selection must be climate-adapted, prioritizing high-impact passive strategies and avoiding one-size-fits-all solutions. This work provides quantitative evidence to inform residential thermal design and support climate-sensitive energy efficiency policies. This study delivers a single-measure comparative atlas; future research should integrate multi-measure optimization together with comfort/cost metrics.
1. Introduction
Globally, energy consumption in buildings accounts for more than 40% of total energy use [1,2,3,4,5]. In countries such as those in Europe and the United States, space conditioning in buildings represents up to 60% of final energy consumption, a figure exacerbated by inefficient construction practices and heating systems [6,7]. In recent decades, numerous energy efficiency measures (EEMs) have been implemented to reduce energy demand in buildings and to lower greenhouse gas (GHG) emissions associated with fossil fuel use [8,9,10]. However, the effectiveness of these EEMs has been assessed mostly within single local case studies, underscoring the need for comparative analyses that examine their performance across diverse climatic conditions [11].
Energy efficiency measures in buildings can be grouped into two main categories: active energy efficiency measures (AEMs) and passive energy efficiency measures (PEMs) [12,13]. AEMs in buildings include all technologies and systems that require a primary engine to drive heat exchange, thereby enabling the efficient distribution of energy from the source to the occupied space, with the goal of optimizing indoor comfort [10]. Within this category, four key areas are identified: efficient lighting, HVAC systems (heating, ventilation, and air conditioning), low-consumption appliances, and the integration of renewable energy sources [14,15,16]. Among these, efficient lighting stands out as the most widely adopted measure due to its high cost-effectiveness and ease of implementation, with adoption rates of 64.2% in the United States, 76.1% in China, and 81.0% in Europe [17,18]. However, its impact may decline as other energy technologies become more widespread and accessible [17,18,19]. Advanced HVAC systems, particularly those with a coefficient of performance (CoP) greater than 3, have shown uneven adoption depending on the climate and region, with implementation rates of 26.3% in the United States, 71.7% in China, and 81% in Europe [18]. In this context, Sun et al. (2018) emphasize that combining efficient HVAC systems with LED lighting represents a comprehensive strategy for reducing energy demand in buildings, especially in climates with significant thermal variation [20].
PEMs focus on improving building design and construction materials to reduce energy losses [21,22,23]. These measures include natural lighting, natural ventilation, optimization of the thermal envelope, and improvements to glazed façades [10]. One of the most effective solutions for minimizing heat loss is the implementation of thermal insulation in external walls [24]. For example, Dong et al. (2023) evaluated various thermal insulation materials and concluded that the use of expanded polystyrene (EPS) can reduce energy demand by up to 52% in cold climates [25]. Phase change materials (PCMs) have also been explored for use in walls, floors, and roofs. These materials have the capacity to store and release heat, which helps stabilize indoor temperatures and reduce heating demand [26,27]. Additionally, bioclimatic strategies such as the use of tree shading have proven effective in mitigating thermal gains during summer, reducing electricity consumption by between 3.8% and 20% [12].
In general terms, EEMs have been implemented across a variety of climatic contexts, and their effectiveness has been analyzed under specific, contrasting climate conditions. For example, Djordjevicć et al. (2023) showed that, in an urban neighborhood in Serbia with a humid continental climate, applying thermal insulation in external walls (100 mm of expanded polystyrene with a thermal conductivity of 0.035 W/m·K), along with the replacement of windows and doors with PVC frames and air chambers, reduced heating energy demand from 136.69 kWh/m2·year to 68.26 kWh/m2·year [11]. El-Darwish et al. (2017), in three educational buildings in Egypt with a hot arid climate, demonstrated that installing overhangs (0.5 m above windows to reduce solar gains during summer) reduced energy demand by 23%, while the incorporation of EPS insulation had negligible effects [28]. In residential buildings in Poland, it was found that both climatic location and insulation level strongly influence energy demand [29]. Chaturvedi et al. (2024) reported a 72% reduction in cooling consumption through multi-objective optimization, although the findings were limited to a semi-desert climate [30]. Bekele and Atakara (2023) reported a 34% reduction in energy demand by integrating passive measures specifically adapted to a Mediterranean climate [31].
Although these studies collectively highlight the influence of climate on energy performance, their evidence remains fragmented and non-comparable across contexts. Most analyses focus on single cases or isolated climates and rely on heterogeneous models, baselines, and performance metrics, limiting their comparability and transferability. Furthermore, systematic cross-climate evaluations that use a unified methodological framework are scarce, and few studies explicitly distinguish between the impacts of measures on useful and final energy demand, which is critical for understanding the mechanisms of efficiency gains (envelope versus system). In addition, EEMs are typically reported without standardized parametric ranges, preventing scalability analyses, and the literature seldom identifies counterproductive effects that can arise when a measure performs differently under contrasting climatic conditions. Consequently, there is a lack of climate-explicit, baseline-consistent, and energy-level-disaggregated assessments that consolidate EEMs into comparable parameter sets and quantify their context-dependent performance across diverse climatic zones [31,32,33].
In this context, the present study develops a unified and comparative simulation framework to assess the impact of 39 active and passive energy efficiency measures on the annual energy demand of a representative dwelling, explicitly accounting for climatic variability across the Chilean territory as a case study. A parametric approach was implemented in DesignBuilder/EnergyPlus, applying standardized boundary conditions across nine representative Köppen climates. The analysis distinguishes the effects of each measure on final and useful energy demand, linking their physical mechanisms—envelope performance versus system efficiency—to their climatic applicability. Building upon but extending beyond previous single-climate analyses, the framework enables cross-climate comparability, quantifies the impact and scalability of each measure, and identifies counterproductive effects that emerge under contrasting climatic conditions.
2. Methods
Figure 1 presents a general diagram of the methodological stages developed in this study. First, a systematic literature review was conducted to identify and select EEMs documented in the specialized literature. In parallel, a set of representative climatic scenarios was defined to capture the variability of thermal and environmental conditions across the study area. Simultaneously, a baseline case was established based on a representative dwelling, ensuring scenario comparability and isolating the specific effect of each EEM under uniform reference conditions. The selected EEMs were subsequently classified as active (AEMs) or passive (PEMs), and energy simulations were performed using the baseline dwelling to evaluate their impact on energy demand across the defined climatic scenarios.
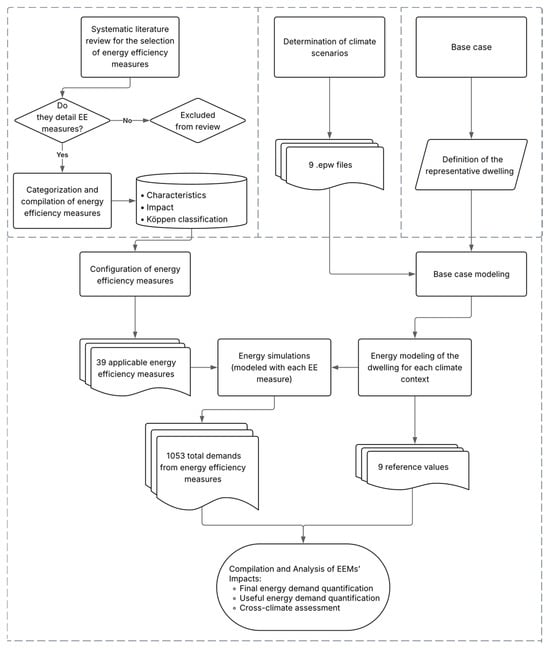
Figure 1.
Flowchart for evaluating the impact of energy efficiency measures on the case study building under different climate scenarios.
2.1. Systematic Literature Review for the Selection of Energy Efficiency Measures
To select the EEM applicable to residential buildings, a systematic literature review was conducted using an adapted version of the PRISMA protocol (Preferred Reporting Items for Systematic Reviews and Meta-Analyses). The purpose of the review was to identify, classify, and synthesize active and passive EEM reported in recent scientific literature, with a particular focus on their applicability according to climate type. The guiding research questions were as follows: What energy efficiency measures have been documented in scientific studies for application in residential buildings? And under which climatic conditions have these measures been evaluated?
The search was performed in the Web of Science (WoS) database. The following keywords were used: “energy efficiency building” in combination with “residential”, “active”, “passive”, and “energy efficiency”, employing logical operators (AND with residential and active, OR with passive and energy efficiency). To ensure an up-to-date review, the publication range was restricted to the years 2020–2024, resulting in an initial record of 354 documents.
A screening phase followed, in which titles and abstracts were reviewed to assess eligibility according to two main criteria: (i) the study addressed EEM applied to residential buildings, and (ii) it presented quantifiable results on their energy impact. Documents that did not meet these criteria were excluded from the analysis. The preselected studies were then assessed in full text to extract the implemented active or passive measures. As a result, 77 articles met the established criteria and were used as the basis for identifying and classifying EEM. The overall selection and filtering process are illustrated in Figure 2.
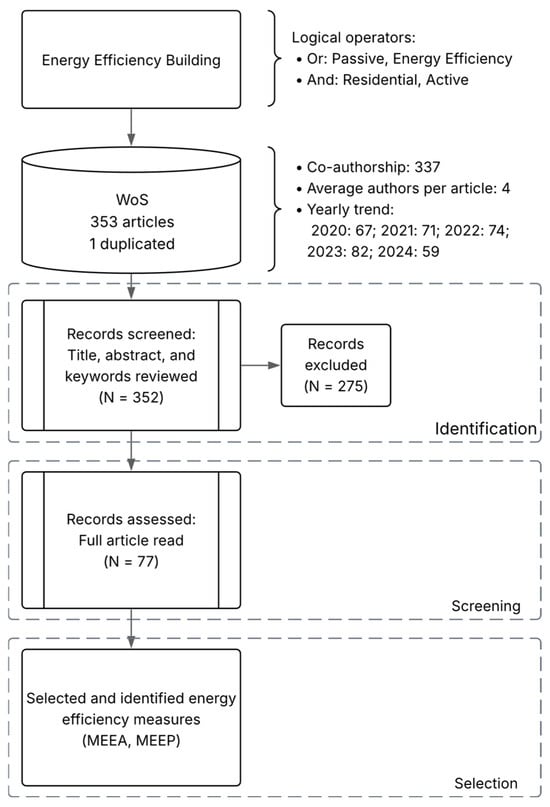
Figure 2.
Flowchart of the systematic literature review.
Measures that appeared in multiple studies were retained as distinct entries only when they incorporated complementary approaches or additional technical details, such as variations in materials, efficiency ranges, or climatic contexts. For example, window optimization was reported with distinctions in glazing type (single, double, triple), coating technologies (Low-E or inert gas), U-values, or Solar Heat Gain Coefficients (SHGC). These were consolidated into a single EEM with a defined range of characteristics. Similarly, HVAC systems were grouped according to their energy performance, considering variations in Coefficient of Performance (CoP), technology type (e.g., heat pumps or geothermal systems), and climatic application.
The final compilation was organized by similarity in technical characteristics, classification, and reported impacts, consolidating redundant entries and standardizing terminology. Only measures that could be feasibly modeled in DesignBuilder were retained for simulation. Interventions such as automated solar gain control through smart blinds were excluded due to software limitations, while others, such as renewable energy integration (e.g., photovoltaic panels), were excluded because they affect primary energy supply rather than the building’s thermal demand.
2.2. Climate Scenarios
To define the climate scenarios in this study, the Köppen climate classification was employed. This classification provides a standardized framework that facilitates comparability and transferability of conclusions in the context of energy efficiency across different world regions [34] Specific climatic characteristics of each zone, such as annual maximum and minimum temperatures, annual sunshine hours, and precipitation, were obtained from the meteorological yearbooks of the Chilean Directorate General of Civil Aeronautics (DGAC) for the years 2020, 2021, 2022, and 2023 [35,36,37,38]. This climatic characterization enables an adapted energy efficiency analysis in each defined zone. Table 1 summarizes the climate characteristics and corresponding Köppen classification [33]. Additionally, a summary of key climatic attributes is provided for each zone, including annual maximum and minimum temperatures, total sunshine hours, and the representative city selected for each case. The selected cities are Iquique, Calama, Copiapó, Valparaíso, Santiago, Valdivia, Temuco, Pucón, and Puerto Aysén. All of these cities have climate files compatible with DesignBuilder.

Table 1.
Climate classification and characteristics of the selected representative cities.
The northern cities of Iquique, Calama, and Copiapó represent desert climates (BWm and BWk), characterized by high solar radiation, low precipitation, and significant diurnal temperature variation. Iquique, with frequent cloud cover and moderate thermal amplitude, exemplifies a coastal desert (BWm), while Calama and Copiapó, both classified as cold deserts (BWk), display more extreme daily and seasonal temperature fluctuations, with minimum temperatures falling below −5 °C in Calama. Valparaíso and Santiago represent warm temperate Mediterranean climates (Csbn and Csb), with dry summers, mild winters, and moderate sunshine hours. Valparaíso features high winter cloudiness due to maritime influence (Csbn), whereas Santiago, located inland, shows greater thermal amplitude and clearer skies (Csb). Temuco, Valdivia, and Pucón were selected as representatives of humid climates with oceanic or tundra influence (Cfsb, Cfsb, ETH-W), all characterized by abundant rainfall, moderate sunshine, and low winter temperatures. These cities reflect conditions typical of southern Chile, where heating demand dominates and passive heat gains are essential for energy efficiency. Finally, Punta Arenas, located in the southernmost region, was selected as an example of a subpolar oceanic climate (Cfc). This zone presents very low temperatures year-round, limited solar radiation, and high heating demand, offering a valuable case to assess insulation and airtightness strategies under extreme cold conditions.
2.3. Representative Dwelling for the Baseline Case
The selection of a “representative dwelling” to define the baseline case was based on the Final Report on Household Energy Use, Chile 2018. This report compiled data on the construction and energy characteristics of Chilean dwellings, using a sample of 3500 households. According to the results, 38.3% of buildings in Chile are detached houses and 39.1% are semi-detached; of these, 74.3% are single-story, and in 71% of cases, they lack thermal insulation [33]. Additionally, it was determined that the average dwelling size in Chile is 47.5 m2 [39]. To adequately represent the predominant typology of Chilean housing, a one-story detached dwelling with a total floor area of 47.5 m2 was selected as the baseline case.
The internal layout of the representative dwelling includes two bedrooms, one bathroom, and a shared area that combines a kitchen, dining room, and living room (Figure 3). The height of the habitable space is 2.5 m. In addition, the layout includes a main entrance door (D1), a secondary door (D2), and six windows (W1–W6) distributed across three façades. To evaluate the impact of orientation on solar gains, one façade was intentionally left without openings, and a main orientation facing north (0°) was assumed, thereby enabling an analysis based on solar exposure boundary conditions.
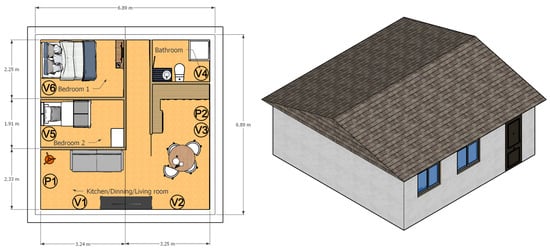
Figure 3.
Plan and isometric view of the dwelling considered as the baseline case.
The envelope of the baseline model includes 200 mm reinforced concrete walls with an internal 15 mm gypsum plaster finish and a 10 mm external cement mortar coating. The floors consist of a 120 mm reinforced concrete slab over a 100 mm gravel base. The roof structure includes 50 × 100 mm timber trusses, 100 mm of glass wool insulation, a waterproof membrane, and 5 mm asphalt shingles, complying with minimum thermal standards [33]. For reference, an infiltration rate of 2 ACH at 50 Pa is considered, along with an unobstructed site to evaluate the impact of orientation on thermal gains [40]. Table 2 presents the construction layers of the baseline envelope, along with the thermal transmittance (U-value) of each building component, as calculated in DesignBuilder using the ISO 10,292/EN 673 standard method [41].

Table 2.
Thermal characteristics of the baseline envelope.
To perform the energy simulations in DesignBuilder, it was necessary to configure the default templates for HVAC and occupancy. For this study, the HVAC system used the “PTAC with HW Heating” template with an efficiency of 85%, which is representative of individual heaters or stoves fueled by fossil fuels, as commonly used in the Chilean context [33]. The building occupancy profile was defined based on patterns of use and energy demand reported in the literature; for instance, Tran et al. (2021) noted that peak energy demand on weekdays occurs at 6:00 a.m. and between 6:00 p.m. and 9:00 p.m., corresponding to the periods of highest household activity [42]. Accordingly, bathroom use was set between 7:00 a.m. and 8:30 a.m., and sleeping periods from 9:00 p.m. onward [43]. On weekends, higher energy demand was identified due to increased occupant presence, with peaks between 8:00 a.m. and 11:00 a.m. in the morning and between 6:00 p.m. and 10:00 p.m. in the evening [42]. The thermostat settings were defined within a temperature range of 19 °C for heating and 25 °C for cooling as reported by a study conducted in Chile reporting this range as preferred by occupants in terms of thermal comfort [44].
2.4. Quantification of the Impact of EEM
The impact of each EEM was evaluated through individual energy simulations, in which each measure was applied separately to the baseline house. In each simulation, the total annual energy demand was recorded and compared to the Baseline Reference Value (BRV), which corresponds to the energy demand of the base model in each of the climate zones considered (Table 3).

Table 3.
Baseline Reference Values (BRV) of energy demand for the base case under each climate scenario.
To represent different levels of technical implementation, each EEM was evaluated under three implementation scenarios: minimum, medium, and maximum. These were defined as modified values , and , respectively, and were established based on the ranges reported in the specialized literature (Table 4). This parameterization allowed for the analysis of the model’s sensitivity to variations in the intensity of each measure, as well as for characterizing their potential effects across different climate contexts. The effect of each measure was quantified by calculating the relative variation between the modified value and the baseline reference value, using Equation (1).
where
is the percentage variation in energy demand for measure under implementation scenario .
is the modified value of energy demand (kWh/m2·year) with measure applied under implementation scenario (minimum, medium, or maximum).
To organize and interpret the results, the energy hierarchy commonly recognized in the literature (Figure 4), from primary to useful energy, was adopted [45]. This classification defines primary energy as the energy associated with the original source before losses due to conversion and distribution [46]; secondary energy as the energy converted from the original source and distributed [45]; final energy as the energy consumed within the building after transformation by active systems such as heating, cooling, or lighting [47]; and useful energy (or useful demand) as the final transformation required within the building (heat, light, movement) [48]. In this study, this classification was used as a methodological criterion to differentiate the level at which each EEM operates. Accordingly, in the Section 3, the impact of the measures is presented by distinguishing those that directly affect useful demand (such as thermal insulation, airtightness, or shading elements) from those that improve the performance of active systems and thus influence final energy consumption. Building on this framework, the results were organized into three analytical stages to ensure a consistent interpretation of the impacts across energy levels and climate types. First, the impacts of EEMs on final energy demand were quantified to assess the effect of active system improvements on total building energy consumption. Second, the analysis was extended to useful energy demand, focusing on variations driven by envelope and passive design measures that directly influence thermal loads. Finally, results were disaggregated by climatic classification, grouping cities according to representative climate types (desert, temperate, Mediterranean, tundra) to identify context-dependent performance patterns and the most effective measures for each environment. This organization enables a transparent linkage between the simulation results and the physical mechanisms through which each EEM influences building energy behavior.
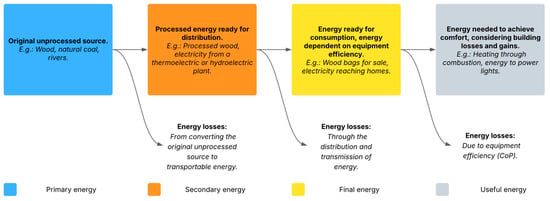
Figure 4.
Schematic representation of the energy flow levels in buildings and their associated losses.

Table 4.
Active energy efficiency measures, recorded impacts, and proposed variation levels.
Table 4.
Active energy efficiency measures, recorded impacts, and proposed variation levels.
| N° | Energy Efficiency Measure | Acronym | Description | VMMin | VMMed | VMMax | Impact | Applied Climate Type | Reference |
|---|---|---|---|---|---|---|---|---|---|
| 1 | Dynamic Insulation | DI | Insulation dynamically adjusted in response to climatic conditions; U-value range: 0.3–3.7 W/m2·K | 0.3 | 2 | 3.7 | 7–17% reduction in energy demand | BWk | [49,50,51,52] |
| 2 | HVAC System Improvements | CBG | HVAC systems such as ground-source and air-to-air heat pumps (Cop’s for heating and cooling) | h: 3, c: 3.5 | h: 4.5, c: 5 | h: 6.5, c: 7 | Significant reduction in energy consumption; 20–80% savings in heating and cooling; up to 4920 kWh/year | BWk/BWh/Csb/Cfs | [10,49,53,54,55,56,57,58,59,60,61,62,63,64,65,66,67,68,69,70,71,72,73,74,75,76,77,78,79,80,81,82,83,84,85,86,87,88,89,90,91,92,93,94,95,96] |
| CBAA | h: 2.5, c: 3 | h: 3.5, c: 4.5 | h: 5, c: 6 | ||||||
| 3 | Lighting Efficiency Improvement | PI | Replacement of conventional lighting with lower power lighting and automatic control via programmed schedules. | 3 W/m2—100 lux | 1.75 W/m2—100 lux | 0.5 W/m2—100 lux | 40–52% reduction in lighting energy demand | Applicable to all climate types. | [54,58,59,62,67,88,90,95,97,98,99,100] |
| HI | 24 h | 10 h | Schedule optimization | ||||||
| 4 | Mechanical Ventilation with Heat Recovery | ERC | Heat recovery ventilation with fixed flow rate of 0.12 m3/s and varying efficiency (50–80%) | 50% | 65% | 80% | 8.6% energy savings; 15% reduction in heating demand. | Csa/Csb/Cfb/Cfc/Dfc/Dfa | [76,85,89,91,101,102,103] |
| 5 | Use of Renewable Energy Systems | Measure that impacts primary energy | Installation of photovoltaic and solar thermal systems (capacity: 2–36 kW, efficiency up to 23.2%) | Measure that impacts primary energy. | Measure that impacts primary energy | Measure that impacts primary energy. | Up to 120% coverage of energy demand under optimal conditions; met 50–75% of DHW needs | Aw/BWh/BSh/Csb/Cfa/Cfb/Cwa | [10,51,57,58,59,61,65,66,68,70,71,72,74,75,77,78,82,83,84,87,88,90,91,92,95,96,104,105,106,107,108,109,110,111,112,113] |
| 6 | Thermal Comfort Setpoint Adjustment | TAH | Thermostat adjustment for heating and cooling; temperature range: 15.5–18.9 °C (heating) and 23.9–29.3 °C (cooling) in central HVAC systems | 15.5 °C | 17.2 °C | 18.9 °C | Up to 12.4% energy savings in heating/cooling; annual savings of 29,954 kWh | BSh/BWh/Cfa | [54,105] |
| TAC | 23.9 °C | 26.6 °C | 29.3 °C | ||||||
| 7 | Adaptive Façades | No data is extracted as it cannot be modeled in DB. | Mobile shading systems (e.g., blinds) and electrochromic glazing that adjust thermal properties (U-value) in response to environmental conditions. | No data is extracted as it cannot be modeled in DB. | No data is extracted as it cannot be modeled in DB. | No data is extracted as it cannot be modeled in DB. | Up to 20% carbon emission reduction and 50% energy savings | BWk | [109] |
3. Results
3.1. Identification and Parametrization of Energy Efficiency Measures from a Systematic Literature Review
A total of 324 energy efficiency measures (EEMs) were identified from the systematic review. These measures included both active and passive strategies applied in residential buildings across a wide range of climatic conditions. Following their classification and grouping by technical similarity, 39 representative EEMs were consolidated for subsequent simulation analysis. The grouping process combined measures with overlapping technical principles or comparable energy impacts—for example, variations of wall insulation materials, glazing configurations, or HVAC system efficiencies—resulting in a coherent and non-redundant set of categories.
Table 4 presents the active energy efficiency measures (A-EEMs), which include technological interventions such as improved HVAC systems, lighting efficiency upgrades, heat recovery ventilation, and thermostat setpoint adjustments. For each measure, the table specifies the acronym, a technical description, three variation levels (minimum, medium, and maximum), and the reported impacts, as well as the climatic contexts in which they were applied.
Table 5 summarizes the passive energy efficiency measures (P-EEMs), which focus on building envelope optimization, solar control, and natural ventilation strategies. It details measures such as solar gain control (overhangs, blinds, reflective surfaces), phase change materials (PCMs), solar chimneys, window and envelope optimization, airtightness improvements, vegetative elements, reflective roofs, and Trombe walls. Each measure is presented with its description, variation levels, impacts, and applicable climate types, ensuring transparency in how they were modeled.

Table 5.
Passive energy efficiency measures, recorded impacts, and proposed variation levels.
Table 5.
Passive energy efficiency measures, recorded impacts, and proposed variation levels.
| N° | Energy Efficiency Measure | Acronym | Description | VMMin | VMMed | VMMax | Impact | Applied Climate Type | Reference |
|---|---|---|---|---|---|---|---|---|---|
| 1 | Solar Gain Control | OVB | Implementation of shading elements such as roof and window overhangs (0.3–1 m), and blinds with differentiated solar reflectance (DSR: 0.4–0.99). | 30 cm | 65 cm | 100 cm | Cooling load reduction of 30–70%. | Aw/Am/BWk/Csb | [10,53,57,59,60,61,62,68,76,89,90,91,92,93,95,96,99,100,103,111,113,114,115,116,117,118,119] |
| OVS | 30 cm | 65 cm | 100 cm | ||||||
| DSR | 0.4 | 0.7 | 0.99 | ||||||
| 2 | Phase Change Materials | PCMW | Use of materials (e.g., Winco Enerciel 21, BioPCM M51/Q21, InfiniteRPCM21C) that absorb and release heat to stabilize indoor temperature | Winco technologies enerciel 21 | BioPCM M51/Q21 | InfiniteRPCM21C | Front-side placement with 27 °C transition temperature achieved 21.7% cooling and 19.4% heating reduction | Csa/Csb | [53,59,64,65,69,73,87,94,95,97,105,113,116,120] |
| PCMR | Winco technologies enerciel 21 | BioPCM M51/Q21 | InfiniteRPCM21C | ||||||
| 3 | Solar Chimneys | SCH | Chimney with dark/glazed surface to absorb solar radiation and induce upward airflow, enhancing natural ventilation in tall buildings (height: 3–7 m). | 3 m | 5 m | 7 m | Reduced mechanical cooling time by 95%; indoor temp reduced by up to 5 °C. | BWh/BWk/Csb/Cfs | [10,85,121] |
| 4 | Window Optimization | Uwin | Modification of window U-value via double glazing (e.g., air chamber thickness), Low-E glazing, inert gases (argon, krypton, xenon); SHGC: 0.33–0.75. | 0.6 | 2.8 | 6 | Reduced annual energy demand by 10–57%; heating savings of 15–25%, up to 2.8% in cooling; 5455 kWh and 1.2 tCO2 saved. | BSh/Csa/Csb/Cfa/Cfb,/Cfc | [57,58,59,61,62,66,67,71,73,75,76,77,78,79,82,84,87,91,93,97,98,99,101,104,105,107,108,114,122] |
| eDVH | 6 mm | 12 mm | 28 mm | ||||||
| GUV | 0.89 | 0.49 | 0.1 | ||||||
| GDVH | Argon | Xenon | Krypton | ||||||
| SHGC | 0.6 | 0.7 | 0.8 | ||||||
| 5 | Natural Ventilation | NVH | Implementation of optimized cross and natural ventilation during warm hours (10:00–16:00), by adjusting daily schedules. | 4 h | 8 h | 12 h | Reduced mechanical cooling needs by 85–95%; decreased indoor temperature by up to 5 °C; 30–40% energy savings. | BSh/BWh/Csa/Csb/Cfa/Cfb/Cfc/Dfb/Dfc | [68,87,89,96,99,102,103,111,112,113,114,115,116,117,119,121,123,124] |
| 6 | Reflective Roofs | RR | Roofs with high solar reflectance (≥0.8) to reduce cooling demand. | 0.72 | 0.8 | 0.88 | Reduced cooling demand by up to 73% in hot climates. | BWh | [111] |
| 7 | Building Orientation | BO | Orienting the building to maximize solar gain and daylighting (up to 180° rotation). | 45° | 90° | 180° | 2.5–29.58% reduction in energy demand, depending on initial orientation. | BSk/Csa/Csb/Dfa/Dfb | [58,87,115,123] |
| 8 | High-Rise Envelope Improvement | bHEI | Use of autoclaved aerated concrete blocks (AACB) with different thicknesses (270–330 mm) in tall buildings. | 270 mm | 300 mm | 330 mm | 37.53% reduction in energy demand compared with a brick-wall baseline. | Af/Am/Cfa/Cfb/Cwa | [63,121] |
| 9 | Thermal-Envelope Optimization | VUW | Addition of EPS insulation in walls and floors with variable thicknesses (20–200 mm), densities (10–45 kg m−3) and positions (exterior/mid-plane). Glass-wool insulation in the roof with variable density and placement. | 0.3 [W/m2K] | 2 [W/m2K] | 3.7 [W/m2K] | 30–50% reduction in energy demand; up to 90% under optimal conditions. Lowers annual thermal load. | BSh/BWh/Csa/Csb/Cfa/Cwa/Cfb/Dfb/Dfc/ET | [50,53,55,56,57,58,59,60,61,62,66,67,68,70,71,72,74,75,76,77,78,79,80,81,82,83,84,86,88,90,91,93,95,96,97,98,99,101,103,104,105,107,108,109,110,111,112,113,115,116,118,119,121,122,123,124] |
| eEPSW | 50 mm | 100 mm | 200 mm | ||||||
| dEPSW | 10 kg/m3 | 27.5 kg/m3 | 45 kg/m3 | ||||||
| pEPSW | Exterior | Mid-floor | Exterior | ||||||
| eEPSF | 20 mm | 110 mm | 200 mm | ||||||
| dEPSF | 10 kg/m3 | 27.5 kg/m3 | 45 kg/m3 | ||||||
| pEPSF | Exterior | Mid-floor | Exterior | ||||||
| tGWI | 0 mm | 50 mm | 200 mm | ||||||
| dGWI | 10 kg/m3 | 30 kg/m3 | 50 kg/m3 | ||||||
| pGWI | Exterior | Mid-roof | Exterior | ||||||
| 10 | Airtightness Improvement | HMD | Improving building airtightness to reduce unwanted air infiltration; ACH at 50 Pa values range from 0.21 to 0.76. | 0.21 ACH at 50 Pa | 0.49 ACH at 50 Pa | 0.76 ACH at 50 Pa | 11–19% reduction in energy demand, depending on climate; enhances thermal comfort. | BSh/BSk/BWk/BWh/Cfa/Cfb/Dfc/Dfd | [88,107] |
| 11 | Vegetative Elements | FV | Use of different types of plants (Ferns, Vines, Tradescantia and Pothos), including parameters such as vegetation height, leaf area index (LAI), and leaf reflectivity. | Ferns | Vines | Tradescantia & Pothos | 20–25% reduction in energy use for cooling. | BSh/BWk/Csa/Csb | [10,106,109] |
| 12 | Trombe Walls | MTDV | Dark walls covered on one side with glazing (3–12 mm thickness) that absorb solar heat during the day to provide passive heating. Made of concrete, with 50 cm spacing between walls. | Generic clear 3 mm | Generic clear 6 mm | Generic clear 12 mm | Improves energy efficiency during winter, with up to 20% reduction in heating demand. | Cfb/Csa/Csb/Dfb | [10,64,68,120] |
| 13 | Optical Façade Properties | ARM | Use of façade coatings with solar reflectance (SR) values ranging from 10–80%, adjusted by climate zone: 60–80% in arid/hot climates; 10–30% in cold climates. | 60% | 70% | 80% | Reduces summer solar heat gains, enhancing passive cooling. | Csa/Csb | [108] |
| BRM | 10% | 20% | 30% | ||||||
| 14 | Window-to-Wall Ratio Optimisation | WWR | Adjustment of window-to-wall ratio (WWR) to balance solar gains and thermal losses. A 20% WWR in the most favourable façade and 0% in the least helps optimise natural lighting and thermal control. | 50% | 35% | 20% | Reduced cooling load, improved thermal comfort, and minimised heat loss. | BSk/Cfa/Cfb/Cwb/Dfa/Dfb | [60,80,118,123,125] |
| 15 | Solar Buffer Space | uMS | A 0.9 m deep solar buffer zone with low-emissivity double glazing and thermally broken frames, oriented on different façades. | South façade | East façade | North façade | Improves thermal performance, especially in high solar radiation areas. Reduces active heating needs. | ET/EF | [70] |
3.2. Quantification of the Impacts of Energy Efficiency Measures on Final Energy Demand
The results of the impact of energy efficiency (EE) measures are presented in this section according to the level at which they affect final energy (Figure 5). In addition, the percentage variation obtained from the individual implementation of each previously identified measure is reported, considering the three levels of modification (VM_Min, VM_Med, and VM_Max). This allows for an assessment of the impact of each EE measure on the thermal performance of the dwelling and its final energy demand (kWh/m2·year), across the different climatic types considered in this study.
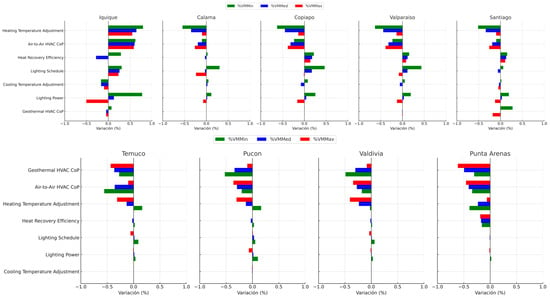
Figure 5.
Energy efficiency measures affecting final energy demand.
The results of the impact of energy efficiency measures (EEMs) on final energy demand show that adjustments to heating setpoint temperatures produce significant reductions across all cities, with decreases of up to −16.71% in Punta Arenas, −11.25% in Temuco, and −10.18% in Valdivia (Figure 5). Similarly, heat recovery system efficiency demonstrated positive effects, yielding reductions of −9.15% in Punta Arenas, −6.48% in Santiago, and −5.72% in Valparaíso, highlighting its effectiveness in areas with high heating demand [126]. In contrast, geothermal HVAC systems proved to be inefficient in warm and arid climates, with energy demand increases of 79.26% in Iquique, 54.75% in Copiapó, and 64.37% in Calama. This suggests that such systems are unsuitable for locations with low subsurface thermal variability.
Air-to-air heat pumps achieved reductions of 21.23% in Temuco, 19.28% in Valdivia, and 16.21% in Santiago, confirming that this system is more viable in cold and temperate climates compared to geothermal alternatives. Regarding lighting power efficiency, reductions of 7.40% in Iquique, 6.92% in Copiapó, and 5.54% in Santiago were observed, indicating that this measure is effective across all cities, albeit with a smaller impact than HVAC-related measures. Finally, optimization of lighting schedules led to a 77.39% increase in energy demand in Iquique, while achieving an 8.09% reduction in Copiapó. This outcome indicates that the impact of this measure depends strongly on usage patterns and the availability of natural daylight in each city [127,128].
Overall, the results indicate that the selection of energy efficiency measures (EEMs) must be tailored to local climatic conditions. In cold climates such as Punta Arenas and Temuco, heating setpoint adjustments and heat recovery efficiency are highly effective, whereas in temperate climates like Santiago and Valparaíso, air-to-air heat pumps and lighting optimization offer more balanced solutions [50]. In warm and arid climates like Iquique and Copiapó, it is essential to avoid inefficient HVAC systems such as geothermal heat pumps and instead prioritize measures like cooling temperature adjustments, which achieved reductions of up to −5.03% in Copiapó and −4.68% in Calama [20]. These findings support more targeted recommendations for optimizing final energy demand based on climatic context.
3.3. Quantification of the Impacts of Energy Efficiency Measures on Useful Energy Demand
The results for the impact of EEMs on useful energy demand are shown in Figure 6. Measures such as EPS density in walls and floors (dEPSW, dEPSF), along with reductions in U-values of windows, significantly decrease thermal demand in cold climates. In Pucón, for example, increasing the EPS wall density reduced energy demand by up to 28%, highlighting the importance of thermal insulation in heating-dominated areas.
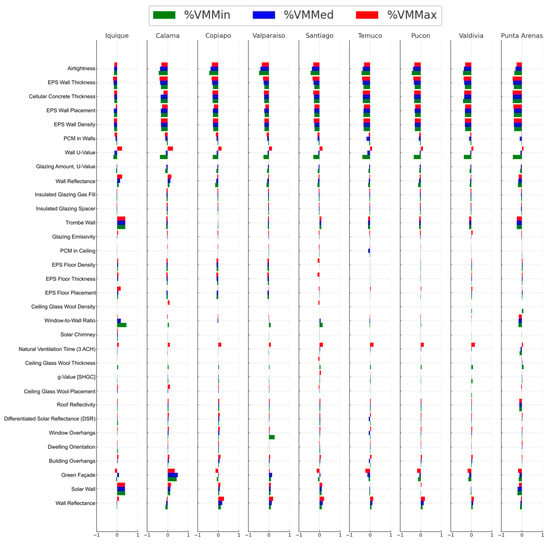
Figure 6.
Energy Efficiency Measures Affecting Useful Energy Demand.
Conversely, measures such as low wall reflectance and overhang installation on windows increase energy demand in cities with persistently low winter temperatures. In Pucón, low wall reflectance increased demand by 20.41%, while window overhangs led to a 3.90% increase, suggesting that limiting solar gains in these climates can be counterproductive. These results confirm that EEMs must be climate specific. In cold regions, the focus should be on enhancing insulation and maximizing solar heat gain, whereas in warm areas, minimizing incident solar radiation is key to reducing energy demand.
3.4. Impact of Energy Efficiency Measures on Useful Energy Demand Across Climatic Zones
3.4.1. Impact of Energy Efficiency Measures on Useful Energy Demand in Desert Climate Type “B”
In Iquique, Figure 7 and Figure 8 show that in a desert climate with frequent cloud cover (BWm), increasing the thickness of EPS in walls (eEPSM) leads to the largest reduction in total annual energy demand, from 35.34 kWh/m2·year down to a minimum of 28.69 kWh/m2·year, representing a decrease of up to 18.82%. In Calama, a city with high thermal amplitude and more extreme conditions under a cold desert climate (BWk), this same measure achieves even greater reductions, reaching up to 39.32% (from 180.47 to 109.52 kWh/m2·year) [129]. In Copiapó, characterized by a standard desert climate (BWk), reducing the wall U-value (VUM) results in a decrease of up to 26.38% in useful energy demand compared to the base case (from 89.96 to 66.22 kWh/m2·year), positioning it as one of the most efficient measures for this climatic context. However, it is observed that a high U-value (3.7 W/m2·K) increases energy consumption by up to 17% in Calama, which highlights the need to adjust the wall composition to achieve a specific U-value that avoids increased demand [15,30].
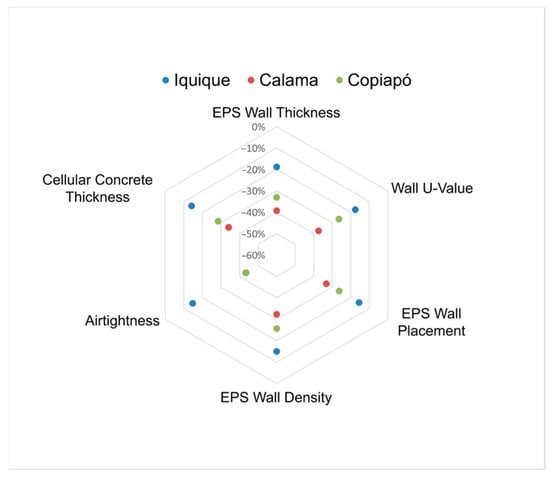
Figure 7.
Top energy-efficiency measures yielding the largest reductions in total thermal demand affecting useful energy (Desert climate, Köppen–Geiger Type “B”).
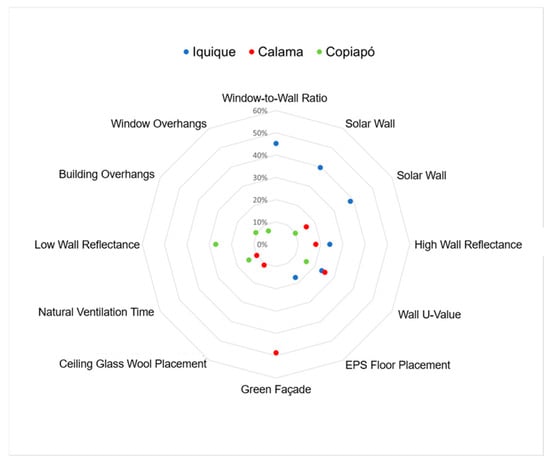
Figure 8.
Top measures yielding the largest increases in total thermal demand affecting useful energy (Desert climate, Köppen–Geiger Type “B”).
However, not all EEMs are beneficial in this context. In Copiapó, the inclusion of eaves on windows and roofs increases energy demand by up to 10.45%, suggesting that reducing solar gains can negatively impact thermal efficiency during cold periods. Similarly, differentiated solar reflectance (RSD), which was expected to lower thermal loads in hot climates, resulted in a 2.90% increase in energy demand in Copiapó (from 89.96 to 92.57 kWh/m2·year). This finding suggests that in cities with a combination of extreme temperatures and intense solar radiation, high reflectance may excessively reduce heat absorption during winter, increasing heating needs [103].
Another important example is the implementation of green façades (FV), which in Calama resulted in an increase in energy demand of up to 48.67% (from 180.47 to 268.31 kWh/m2·year). In this simulated configuration, the reduction of solar radiation incident on the envelope limited passive heating and, consequently, increased heating requirements during colder hours. It is important to note, however, that this outcome does not apply universally; the performance of green façades is strongly influenced by orientation and climate, and north-facing façades in the Southern Hemisphere may provide different results. Additionally, notable differences were observed in the effectiveness of airtightness (HMD): in Calama, it led to a 43.35% reduction in energy demand, compared to only 14.77% in Iquique. This suggests that factors such as daily thermal amplitude, wind speed, and the initial infiltration level of the building may condition the effectiveness of this EEM.
3.4.2. Impact of Energy Efficiency Measures on Useful Energy, Temperate Climate Type “Cs”
Figure 9 and Figure 10 show that, overall, one of the most effective EE measures for warm temperate climates (Cs) is reducing the thermal transmittance value of walls (VUM) [21,22]. In Valparaíso, this measure results in a reduction in energy demand from 113.22 to 83.64 kWh/m2·year, equivalent to a 26.13% decrease. In Santiago, the same measure achieves an even greater reduction, up to 29.64% (from 122.42 to 86.13 kWh/m2·year). Other measures, such as using phase change materials in walls (PCMM), prove to be more limited, with a maximum reduction of 10.88% in Valparaíso (from 113.22 to 100.90 kWh/m2·year) and 9.79% in Santiago (from 122.42 to 110.44 kWh/m2·year). On the other hand, EE measures related to solar control, such as the use of window overhangs (Aven) in Valparaíso, lead to increased energy demand, reaching up to a 27.89% increase compared to the baseline case (from 113.22 to 144.80 kWh/m2·year).
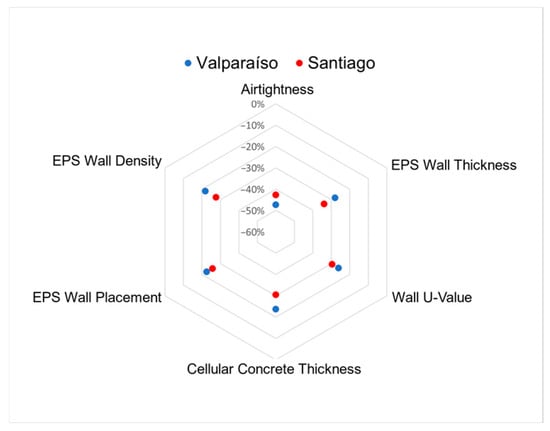
Figure 9.
Top energy-efficiency measures yielding the largest reductions in total thermal demand affecting useful energy (Temperate climate, Köppen–Geiger Type “Cs”).
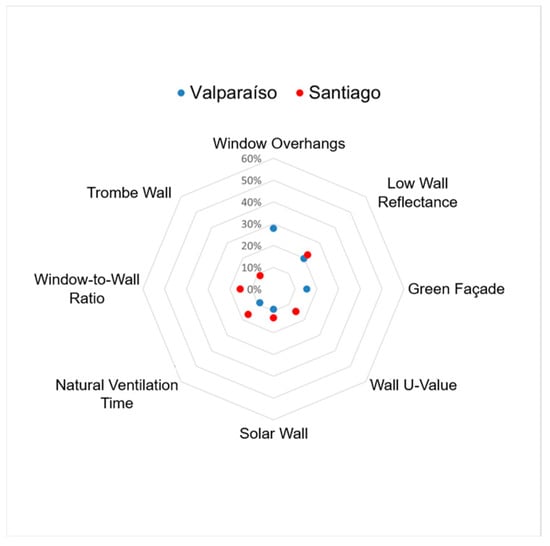
Figure 10.
Top measures yielding the largest increases in total thermal demand affecting useful energy (Temperate climate, Köppen–Geiger Type “Cs”).
Additionally, other energy efficiency measures (EEMs) showed significant effects on energy demand. Building airtightness (BAT) reduced demand by 47.32% in Valparaíso (from 113.22 to 59.64 kWh/m2·year) and by 42.74% in Santiago (from 122.42 to 60.90 kWh/m2·year), confirming its relevance for minimizing heat losses in temperate climates. The passive energy efficiency measure (PEEM) of increasing the EPS thickness in walls (eEPSW) also proved effective, with a 28.02% reduction in Valparaíso (from 113.22 to 81.50 kWh/m2·year) and 24.35% in Santiago (from 122.42 to 83.41 kWh/m2·year). However, measures such as green façades (GF) had a negative impact, increasing energy demand by 15.31% in Valparaíso (from 113.22 to 130.55 kWh/m2·year) and 9.22% in Santiago (from 122.42 to 133.69 kWh/m2·year) due to reduced solar heat gains. Similarly, the window-to-wall ratio (WWR) led to increases of 19.45% in Valparaíso (from 113.22 to 135.23 kWh/m2·year) and 14.62% in Santiago (from 122.42 to 140.31 kWh/m2·year), suggesting that a predominant southern window orientation can lead to considerable winter heat losses due to lower solar gains.
It is particularly noteworthy that architectural solutions generally regarded as beneficial, such as overhangs [24,130], resulted in increased energy demand in Valparaíso (27.89%) and moderate increases in Santiago (4.14%). This disparity could be attributed to differences in solar irradiance, prevailing orientation, and heating needs during colder seasons. It implies that measures like overhangs should be carefully designed and supplemented with advanced technologies such as dynamic solar blockers that regulate gains based on environmental conditions, accounting for site-specific factors. It is also recommended to assess more comprehensively measures like differentiated solar reflectance (DSR), which led to slight increases in energy demand in both cities (3.36% in Santiago and 3.12% in Valparaíso), indicating that seemingly beneficial interventions may not be suitable for all buildings [131].
3.4.3. Impact of Energy Efficiency Measures on Useful Energy in Mediterranean Climate Type “Cf”
Figure 11 and Figure 12 show that in Mediterranean climates, reducing the U-value in walls (VUW) is remarkably effective in Punta Arenas, decreasing energy demand by 43.71%, from 507.84 to 285.81 kWh/m2·year. This same measure also results in substantial reductions in Temuco and Valdivia, with 37.29% (from 206.34 to 129.39 kWh/m2·year) and 35.60% (from 274.83 to 176.98 kWh/m2·year), respectively [14]. In contrast, measures such as the implementation of overhangs (ROF and ROW) increase energy demand in Punta Arenas by up to 2.55% (from 507.84 to 520.81 kWh/m2·year).
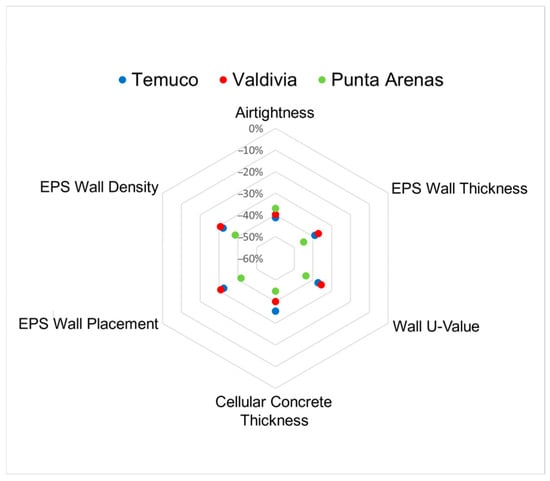
Figure 11.
Top energy-efficiency measures yielding the largest reductions in total thermal demand affecting useful energy (Mediterranean climate, Köppen–Geiger Type “Cs”).
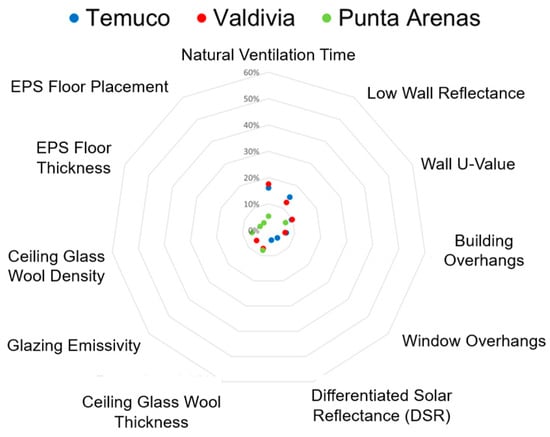
Figure 12.
Top measures yielding the largest increases in total thermal demand affecting useful energy (Mediterranean climate, Köppen–Geiger Type “Cs”).
The incorporation of phase change materials in walls (PCMW) achieves demand reductions, particularly in Temuco, reaching up to 17.57% (from 206.34 to 170.09 kWh/m2·year), while in Punta Arenas the reduction is more limited, just 10.30% (from 507.84 to 455.55 kWh/m2·year), revealing how the effectiveness of certain measures decreases as the base case energy demand increases.
Additionally, other measures were observed to have significant effects on energy demand. Building airtightness (HMD) proved to be a highly effective measure, reducing energy demand by 37.06% in Punta Arenas (from 507.84 to 323.16 kWh/m2·year), 41.34% in Temuco (from 206.34 to 121.04 kWh/m2·year), and 39.78% in Valdivia (from 274.83 to 165.50 kWh/m2·year) [50]. The importance of increasing EPS thickness in walls (eEPSW) as a thermal insulation measure was also confirmed, with reductions of up to 45.02% in Punta Arenas (from 507.84 to 279.23 kWh/m2·year), 38.95% in Temuco (from 206.34 to 125.97 kWh/m2·year), and 37.15% in Valdivia (from 274.83 to 167.78 kWh/m2·year).
Analysis of Figure 11 and Figure 12 shows that increasing natural ventilation time led to demand increases of up to 17.49% in Valdivia (from 274.83 to 323.93 kWh/m2·year), 16.06% in Temuco (from 206.34 to 239.50 kWh/m2·year), and 5.38% in Punta Arenas (from 507.84 to 534.19 kWh/m2·year). Similarly, low wall reflectance increased demand by 14.92% in Temuco (from 206.34 to 237.10 kWh/m2·year) and 12.55% in Valdivia (from 274.83 to 309.30 kWh/m2·year). High wall U-values increased demand by 9.85% in Valdivia (from 274.83 to 302.94 kWh/m2·year), 9.56% in Temuco (from 206.34 to 226.06 kWh/m2·year), and 7.05% in Punta Arenas (from 507.84 to 543.66 kWh/m2·year). Roof overhangs for buildings increased demand by 6.79% in Temuco (from 206.34 to 220.34 kWh/m2·year) and 6.37% in Valdivia (from 274.83 to 292.34 kWh/m2·year), while window overhangs caused increases of 4.43% in Temuco (from 206.34 to 215.48 kWh/m2·year). Finally, differentiated solar reflectance (DSR) showed a 3.89% increase in Temuco (from 206.34 to 214.36 kWh/m2·year), indicating that excessive control of solar radiation can reduce heat gains in winter.
These results show that energy efficiency measures should prioritize improving the thermal insulation of the building envelope [21,31] especially in cities with very high energy demands, such as Punta Arenas. The reduction achieved by improving wall U-values highlights the importance of insulating dwellings in these cold and humid climates. On the other hand, the limited effectiveness observed in implementing architectural elements such as overhangs may be explained by the fact that in climates where heating dominates over cooling, reducing solar gains can lead to higher heating demands, particularly during the coldest months.
3.4.4. Impact of Energy-Efficiency Measures on Useful Energy in Tundra Climate Type “E”
Results in Figure 13 show that, in Pucón, measures aimed at improving thermal insulation have the greatest impact on reducing energy demand in the tundra climate with summer rainfall. Among these, reducing the wall U-value (VUW) achieves a decrease of up to 33.86% relative to the base case, from 206.34 to 136.47 kWh/m2·year, when a very low U-value (0.3 W/m2·K) is implemented [132]. In contrast, architectural solutions such as window overhangs (OVS) and roof overhangs (OVB) yield counter-productive results, increasing useful energy demand by up to 1.90% for OVS (from 206.34 to 210.14 kWh/m2·year) and 6.66% for OVB (from 206.34 to 220.09 kWh/m2·year). This indicates a negative effect associated with reduced solar heat gains during cold periods. Phase-change materials in walls (PCMW) provide more limited reductions, between 4.67% and 17.57%, showing that while PCMs can contribute to efficiency in this climate [133], their impact is smaller compared with traditional insulation measures.
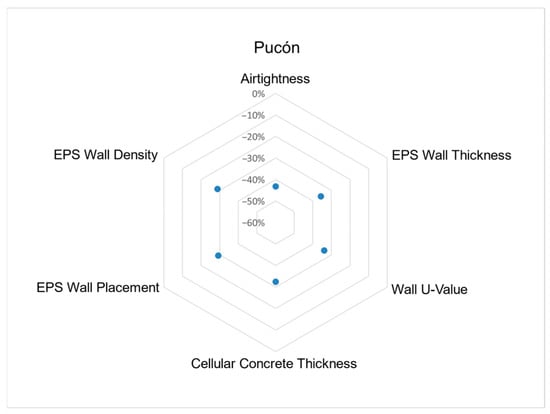
Figure 13.
Top energy-efficiency measures yielding the largest reductions in total thermal demand affecting useful energy (Tundra climate, Köppen–Geiger Type “ET”).
Building airtightness (HMD) stands out as one of the most effective solutions, reducing energy demand by up to 43.23% (from 206.34 to 117.14 kWh/m2·year), reinforcing the importance of minimizing cold air infiltration in this climate. Similarly, increasing the EPS thickness in walls (eEPSM) achieved a 32.48% reduction (from 206.34 to 131.07 kWh/m2·year), consolidating its relevance as a key alternative for enhancing thermal insulation in buildings exposed to extreme temperatures.
In Pucón, Figure 14 shows that low wall reflectance led to the largest increase in energy demand, with a 20.41% rise (from 206.34 to 248.34 kWh/m2·year). Natural ventilation time also had a significant negative impact, raising demand by 14.83% (from 206.34 to 236.00 kWh/m2·year).
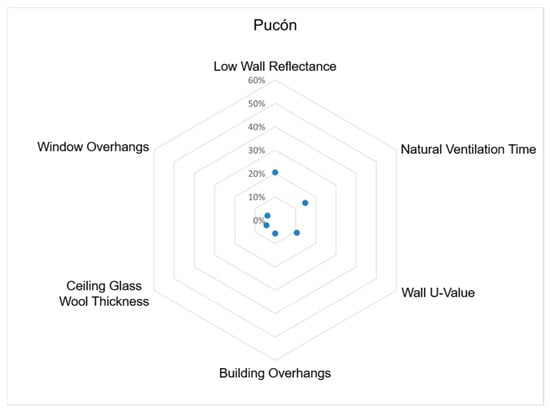
Figure 14.
Top measures yielding the largest increases in total thermal demand affecting useful energy (Tundra climate, Köppen–Geiger Type “ET”).
An increase in the U-value of walls led to a 10.65% rise in demand (206.34 to 228.32 kWh/m2·year), while the increase in glass wool thickness in the roof caused a 4.39% increase (206.34 to 215.42 kWh/m2·year).
In addition, the implementation of eaves in the building (OVB) and in windows (OVS) raised the demand by 5.66% (206.34 to 218.04 kWh/m2·year) and 3.90% (206.34 to 214.40 kWh/m2·year), respectively. These results show that, in cold climates such as Pucón, EE measures that reduce solar radiation gains can significantly increase heating needs, making it essential to assess their application according to local climatic conditions.
4. Discussion
4.1. Climatic Sensitivity and Effectiveness of EEMs
The results confirm that the effectiveness of energy efficiency measures (EEMs) varies significantly depending on the climatic context, underscoring the importance of adopting a climate-sensitive approach in building energy design. In heating-dominated climates such as Csc and Csb, passive measures, particularly thermal insulation and high-performance glazing, showed the greatest impact, reducing annual energy demand by over 40% in some scenarios. These results align with the literature, where the role of envelope performance in minimizing heat losses has been extensively documented, particularly in cold European climates [134]. However, Zhang et al. (2021) found that in temperate humid regions, envelope improvements alone may not guarantee optimal performance unless integrated with ventilation strategies, due to the influence of internal loads and humidity [135]. In climates with substantial cooling requirements, such as BSk and BWh, the integration of shading devices and natural ventilation proved more effective, supporting the relevance of bioclimatic strategies to mitigate solar gains and promote indoor thermal regulation. This is consistent with findings by Ling et al. (2024), who demonstrated that in hot-arid settings, shading and airflow dominate thermal performance outcomes, with insulation playing a secondary role [136].
Active measures, particularly the implementation of HVAC systems with a high coefficient of performance (CoP > 3), demonstrated robust energy-saving potential across most climate zones. However, their relative contribution was more pronounced in mixed or temperate climates (e.g., Cfa), where seasonal energy demand is distributed more evenly between heating and cooling needs. Similar trends were reported by Al-Homoud and Krarti (2021), who showed that high-efficiency HVAC systems significantly enhance performance in transitional climates, especially when combined with passive envelope upgrades [137]. These observations reinforce the notion that the baseline energy demand profile of each climate plays a central role in determining the relative effectiveness of AEMs and PEMs. Furthermore, the results indicate that in certain climates, the marginal benefit of specific measures diminishes once a critical threshold of building efficiency is reached. This diminishing return effect has also been noted by Nasrollahzadeh (2021), particularly in high-performance envelopes where additional insulation provides limited extra savings [138]. Such findings underscore the need for tailored combinations of strategies rather than universal prescriptions and highlight the value of context-specific assessments to guide decision-making.
4.2. Policy and Design Implications for Climate-Adaptive Strategies
The findings of this study offer practical insights for the formulation of energy policies and building design guidelines that respond to local climatic conditions. In particular, the differentiated performance of EEMs across climate zones supports the implementation of climate-adaptive frameworks in building energy codes. While several studies have highlighted the relevance of climate-based prescriptions in national or regional regulations, few have quantified the relative impact of specific EEMs across Köppen climate types [134,139]. The current study addresses this gap by providing evidence-based thresholds that can inform both regulatory standards and incentive programs. For example, in heating-dominated areas, the results suggest that mandatory improvements in the thermal envelope, such as reduced U-values or subsidies for high-performance insulation, may yield substantial reductions in energy demand. Similar proposals have been advanced stressing that aligning retrofit strategies with climate-specific thermal loads can enhance cost-effectiveness and user comfort [140]. Conversely, in warm or arid climates, policy instruments should prioritize solar control strategies, passive ventilation, and optimized shading. This is consistent with the recommendations of Ling et al. (2024), who found that passive cooling strategies outperform mechanical systems in desert-like climates when properly integrated into the building envelope and orientation [136].
Moreover, the results reinforce the importance of integrating passive and active measures rather than relying on isolated interventions. While this principle is acknowledged in international guidelines (Al-Homoud & Krarti, 2021), actual implementation often overlooks synergistic effects between envelope performance and HVAC system efficiency [137]. By quantifying the additive benefits of such combinations, this study supports integrated design approaches that should be promoted in both new construction and retrofitting programs. Policymakers may also benefit from adopting climate-specific performance thresholds when evaluating or subsidizing retrofit measures. As noted by Aqilah et al. (2025), standardized performance metrics often mask contextual variability, leading to uneven outcomes [141]. In contrast, differentiated benchmarks based on climate profiles, like those developed in this study, can help ensure that public investment targets interventions with the highest potential impact. Lastly, by offering a comparative assessment of EEMs under distinct climatic profiles, the study contributes to evidence-based decision-making for the prioritization of energy strategies under resource or budget constraints. This is particularly relevant in emerging economies, where energy demand is rising and technical guidance for climate-adaptive design remains limited. Building on these single-measure results, the discussion also allows for indicative “starter bundles” tailored to climate zones. For example, in heating-dominated areas of Patagonia, EPS insulation combined with airtightness emerges as a robust starting point, while in Mediterranean climates, air-to-air heat pumps coupled with solar-control finishes are promising. In desert climates, strategies combining high thermal mass with optimized shading could mitigate extreme daily temperature swings. These indicative bundles are not full optimization packages, but they illustrate how individual measures could be grouped as a first step toward integrated design.
4.3. Replicability and Transferability to Other Contexts
Although this study focuses on a specific case within the Chilean context, the methodological framework and core findings offer valuable foundations for broader application. The use of a standardized simulation model across Köppen climate zones strengthens the external validity of the results, enabling replication in other regions with similar climatic profiles. Comparable approaches have been employed in studies such as Wang et al. (2024), who conducted cross-climate simulations in multiple Asian cities, and Zhang et al. (2021), who evaluated the sensitivity of retrofit packages in both cold and hot zones in China [135,142]. These studies emphasize that methodologically consistent simulations, when applied to diverse climates, can generate generalizable performance patterns that inform both local and regional planning. Nonetheless, full transferability is constrained by contextual differences in construction practices, occupant behavior, and regulatory frameworks. While the present study provides an analytically controlled environment, several authors have cautioned that real-world implementation may diverge from simulated outcomes if cultural, behavioral, or technical factors are not adequately integrated (Belussi et al., 2019; Ziapour et al., 2025) [134,140]. For instance, Nasrollahzadeh (2021) highlights that user behavior alone can alter the actual energy savings of retrofitted buildings by over 20%, suggesting that the replicability of simulation-based results should always be paired with local validation [138].
Moreover, transferability is enhanced when methodological transparency and flexibility are prioritized. The parametric structure of the present model facilitates recalibration with context-specific data, enabling its use in regions where empirical evidence is scarce but climatic variability is high, such as in the Global South. In this regard, studies like Aqilah et al. (2025) and Cogul et al. (2025) advocate for simulation platforms that can adapt to varying policy, economic, and material conditions, serving as tools for comparative assessments under constrained data environments [141,143]. Ultimately, while direct extrapolation of numerical results may be limited by contextual disparities, the climate-based analytical framework presented here remains highly transferable. It offers a robust starting point for evaluating energy efficiency strategies under heterogeneous conditions and can support the formulation of context-sensitive interventions in regions undergoing rapid urban expansion or regulatory transition. It should be emphasized that this work is positioned as a broad parametric screen, providing comparative insights across nine climates. Future research could build on this atlas by coupling it with multi-objective optimization frameworks that integrate not only energy demand but also comfort and cost metrics, thereby enhancing its practical applicability for policymakers and designers.
4.4. Policy Relevance and Climate-Adaptive Planning
The findings of this study have direct implications for the formulation of energy policies and the design of climate adaptation strategies in the residential sector. As observed in recent comparative studies, the effectiveness of energy efficiency measures (EEMs) is strongly influenced by climatic conditions, yet policy frameworks often fail to incorporate this variability. For example, Talib and Joe (2025) highlight that national energy codes in Southeast Asia tend to apply uniform standards across diverse climate zones, resulting in suboptimal performance in both energy consumption and thermal comfort [139]. Similarly, Ziapour et al. (2025) argue that adaptation strategies remain insufficiently localized, especially in countries with pronounced climatic heterogeneity [140]. In this context, the climate-based evidence presented in this study supports the development of geographically differentiated policy instruments. Measures such as targeted subsidies, location-specific retrofit incentives, or differentiated U-value standards could enhance the impact and efficiency of public investment. This approach aligns with the recommendations of Al-Homoud and Krarti (2021), who propose climate-responsive codes based on typified thermal demands across the MENA region [137]. Furthermore, integrating passive strategies, such as envelope insulation or solar shading, into national adaptation frameworks could help stabilize energy demand under future climate change scenarios [136].
A critical insight from this study is that combining passive and active strategies yields greater benefits than applying isolated interventions, particularly in transitional or mixed climates [143]. Therefore, promoting integrated design practices through regulation, training, and incentives could accelerate the uptake of climate-adaptive solutions in both new construction and retrofit markets. Ultimately, by emphasizing the contextual performance of EEMs and quantifying their relative benefits across climate zones, this study contributes to a growing body of evidence advocating for climate-responsive energy planning. In rapidly urbanizing regions, especially in the Global South, this approach may be key to ensuring that mitigation and adaptation goals are jointly addressed through place-based, technically grounded strategies.
5. Conclusions
The results of this study demonstrate that the effectiveness of energy efficiency measures (EEMs) in residential buildings varies significantly depending on the climatic context. Active measures such as heating setpoint adjustments and heat recovery ventilation proved particularly effective in cold climates, with reductions of up to −16.7% and −9.0% observed in Punta Arenas and Temuco, respectively. Conversely, in warmer and arid regions like Iquique and Copiapó, geothermal HVAC systems produced substantial increases in energy demand, reaching 79.26%, 64.37%, and 54.75%, respectively. Air-to-air heat pumps, in contrast, achieved notable reductions of −21.23% in Temuco, −19.28% in Valdivia, and −16.21% in Santiago, confirming their viability in cold and temperate climates but not in arid conditions, where performance was limited, underscoring the risk of applying technologies without proper climatic evaluation. Passive measures related to insulation and airtightness also showed high potential in cold regions. For example, increasing the thickness of expanded polystyrene (EPS) insulation and reducing the U-value of the envelope led to energy demand reductions of up to −45.0% in Punta Arenas and −28.0% in Valparaíso. In the tundra-like climate of Pucón, improving airtightness yielded savings of −43.2%, highlighting the critical role of envelope performance in climates with high heating needs.
The study also identified cases where measures commonly regarded as beneficial exhibited context-dependent limitations. For instance, extended eaves and green façades reduced useful solar gains in cold and mixed climates, leading to higher heating demand. These results illustrate the importance of aligning passive strategies with local climatic and solar conditions.
This research fulfills its main objective of comparatively assessing the impact of both active and passive energy efficiency measures on the annual energy demand of a representative dwelling under the influence of nine different climatic scenarios across the Chilean territory. By employing a parametric simulation methodology using DesignBuilder/EnergyPlus, and incorporating measures selected through a systematic literature review, the study provides quantitative evidence on the climate-dependent performance of each intervention. These findings have both technical and policy implications: they support the prioritization of measures by region, such as EPS and airtightness in Patagonia versus heat pumps in Mediterranean climates, and they caution against the adoption of unsuitable technologies that may inadvertently increase energy consumption. The contribution of the study lies primarily in its comparative scope across multiple climatic zones, offering a coherent baseline for future cross-regional analyses.
Furthermore, this study advances current research on building energy efficiency by integrating, for the first time, a unified parametric simulation framework that evaluates 39 active and passive measures under consistent boundary conditions across nine representative Köppen climate zones. Unlike prior single-climate or case-specific analyses, this approach allows the systematic quantification of each measure’s climate-dependent impact on both final and useful energy demand, bridging the gap between envelope- and system-driven efficiencies. The framework consolidates fragmented evidence into a comparable and reproducible structure, enabling climate-explicit interpretation of performance patterns and supporting the development of regionally differentiated energy efficiency strategies.
Author Contributions
Conceptualization, A.M.-S. and G.A.-G.; methodology, G.A.-G. and A.M.-S.; software, G.A.-G.; validation, A.R.-R. and C.R.-H.; formal analysis, G.A.-G. and A.M.-S.; investigation, G.A.-G.; resources, A.M.-S.; data curation, G.A.-G.; writing—original draft preparation, G.A.-G. and A.M.-S.; writing—review and editing, G.A.-G., A.M.-S. and D.S.-C.; visualization, D.S-C.; supervision, A.M.-S., A.R.-R. and C.R.-H. All authors have read and agreed to the published version of the manuscript.
Funding
This research received no external funding.
Data Availability Statement
The data supporting the findings of this study are fully available within the article, particularly in the Section 3. No additional datasets were generated or analyzed beyond those presented in the manuscript.
Conflicts of Interest
The authors declare no conflicts of interest.
References
- Almomani, A.; Almeida, R.M.S.F.; Vicente, R.; Barreira, E. Critical Review on the Energy Retrofitting Trends in Residential Buildings of Arab Mashreq and Maghreb Countries. Buildings 2024, 14, 338. [Google Scholar] [CrossRef]
- Das, H.P.; Lin, Y.-W.; Agwan, U.; Spangher, L.; Devonport, A.; Yang, Y.; Drgoňa, J.; Chong, A.; Schiavon, S.; Spanos, C.J. Machine Learning for Smart and Energy-Efficient Buildings. Environ. Data Sci. 2024, 3, e1. [Google Scholar] [CrossRef]
- Cui, X.; Lee, M.; Koo, C.; Hong, T. Energy Consumption Prediction and Household Feature Analysis for Different Residential Building Types Using Machine Learning and SHAP: Toward Energy-Efficient Buildings. Energy Build. 2024, 309, 113997. [Google Scholar] [CrossRef]
- Arab, Y.; Hassan, A.S.; Al-Absi, Z.A.; Achour, H.; Witchayangkoon, B.; Qanaa, B. Retrofitting of a High-Rise Residential Building for Energy Efficiency with OTTV as an Assessment Tool. J. Adv. Res. Fluid Mech. Therm. Sci. 2023, 102, 110–119. [Google Scholar] [CrossRef]
- Camarasa, C.; Nägeli, C.; Ostermeyer, Y.; Klippel, M.; Botzler, S. Diffusion of Energy Efficiency Technologies in European Residential Buildings: A Bibliometric Analysis. Energy Build. 2019, 202, 109339. [Google Scholar] [CrossRef]
- Li, X.; Shen, C.; Yu, C.W.F. Building Energy Efficiency: Passive Technology or Active Technology? Indoor Built Environ. 2017, 26, 729–732. [Google Scholar] [CrossRef]
- Economidou, M.; Todeschi, V.; Bertoldi, P.; D’Agostino, D.; Zangheri, P.; Castellazzi, L. Review of 50 years of EU Energy Efficiency Policies for Buildings. Energy Build. 2020, 225, 110322. [Google Scholar] [CrossRef]
- Ashrafian, T. Enhancing School Buildings Energy Efficiency under Climate Change: A Comprehensive Analysis of Energy, Cost, and Comfort Factors. J. Build. Eng. 2023, 80, 107969. [Google Scholar] [CrossRef]
- Al-Habaibeh, A.; Hawas, A.; Hamadeh, L.; Medjdoub, B.; Marsh, J.; Sen, A. Enhancing the Sustainability and Energy Conservation in Heritage Buildings: The Case of Nottingham Playhouse. Front. Archit. Res. 2022, 11, 142–160. [Google Scholar] [CrossRef]
- Taherian, H.; Peters, R.W. Advanced Active and Passive Methods in Residential Energy Efficiency. Energies 2023, 16, 3905. [Google Scholar] [CrossRef]
- Djordjevicć, L.; Pekez, J.; Novaković, B.; Bakator, M.; Djurdjev, M.; Ćoćkalo, D.; Jovanović, S. Increasing Energy Efficiency of Buildings in Serbia—A Case of an Urban Neighborhood. Sustainability 2023, 15, 6300. [Google Scholar] [CrossRef]
- del Campo-Hitschfeld, M.L.; Arenas, N.; Rivera, M.; Ballesteros-Pérez, P. Application of Spectrometry for Determining the Solar Radiation of Deciduous Trees’ Shade: A Passive Energy Conservation Approach for Mediterranean Climates. Buildings 2023, 13, 1130. [Google Scholar] [CrossRef]
- Vega, M.; Llantoy, N.; Chafer, M.; Ushak, S.; Cabeza, L.F. Life Cycle Assessment of the Inclusion of Phase Change Materials in Lightweight Buildings. J. Energy Storage 2022, 56, 105903. [Google Scholar] [CrossRef]
- Matos, A.M.; Delgado, J.M.P.Q.; Guimarães, A.S. Energy-Efficiency Passive Strategies for Mediterranean Climate: An Overview. Energies 2022, 15, 2572. [Google Scholar] [CrossRef]
- Al-Tamimi, N. Passive Design Strategies for Energy Efficient Buildings in the Arabian Desert. Front. Built Environ. 2022, 7, 805603. [Google Scholar] [CrossRef]
- Nematchoua, M.K.; Vanona, J.C.; Orosa, J.A. Energy Efficiency and Thermal Performance of Office Buildings Integrated with Passive Strategies in Coastal Regions of Humid and Hot Tropical Climates in Madagascar. Appl. Sci. 2020, 10, 2438. [Google Scholar] [CrossRef]
- Al-Ghaili, A.M.; Kasim, H.; Al-Hada, N.M.; Othman, M.; Saleh, M.A. A Review: Buildings Energy Savings—Lighting Systems Performance. IEEE Access 2020, 8, 76108–76119. [Google Scholar] [CrossRef]
- Wang, R.; Feng, W.; Wang, L.; Lu, S. A Comprehensive Evaluation of Zero Energy Buildings in Cold Regions: Actual Performance and Key Technologies of Cases from China, the US, and the European Union. Energy 2021, 215, 118992. [Google Scholar] [CrossRef]
- Deng, Z.; Chen, Y.; Yang, J.; Causone, F. AutoBPS: A Tool for Urban Building Energy Modeling to Support Energy Efficiency Improvement at City-Scale. Energy Build. 2023, 282, 118992. [Google Scholar] [CrossRef]
- Sun, X.; Gou, Z.; Lau, S.S.Y. Cost-Effectiveness of Active and Passive Design Strategies for Existing Building Retrofits in Tropical Climate: Case Study of a Zero Energy Building. J. Clean. Prod. 2018, 183, 35–45. [Google Scholar] [CrossRef]
- López-Escamilla, Á.; Herrera-Limones, R.; León-Rodríguez, Á.L. Double-Skin Facades for Thermal Comfort and Energy Efficiency in Mediterranean Climate Buildings: Rehabilitating Vulnerable Neighbourhoods. Buildings 2024, 14, 326. [Google Scholar] [CrossRef]
- Zafaranchi, M.; Sozer, H. Enhancing Energy Efficiency through Hourly Assessments of Passive Interventions in Educational-Office Buildings: A Case Study in a Mediterranean Climate. Energy Rep. 2024, 11, 423–441. [Google Scholar] [CrossRef]
- Anaç, M.; Cuce, P.M.; Cuce, E. Passive Sustainability Strategies in Traditional Gaziantep Residences: A Critical Report on Historical Development. Int. J. Low-Carbon Technol. 2024, 19, 245–256. [Google Scholar] [CrossRef]
- Lebied, M.; Sick, F.; Choulli, Z.; El Bouardi, A. Improving the Passive Building Energy Efficiency through Numerical Simulation–A Case Study for Tetouan Climate in Northern of Morocco. Case Stud. Therm. Eng. 2018, 11, 125–134. [Google Scholar] [CrossRef]
- Dong, Y.; Kong, J.; Mousavi, S.; Rismanchi, B.; Yap, P.S. Wall Insulation Materials in Different Climate Zones: A Review on Challenges and Opportunities of Available Alternatives. Thermo 2023, 3, 38–65. [Google Scholar] [CrossRef]
- da Cunha, S.R.L.; de Aguiar, J.L.B. Phase Change Materials and Energy Efficiency of Buildings: A Review of Knowledge. J. Energy Storage 2020, 27, 101083. [Google Scholar] [CrossRef]
- Mousavi, S.; Rismanchi, B.; Brey, S.; Aye, L. PCM Embedded Radiant Chilled Ceiling: A State-of-the-Art Review. Renew. Sustain. Energy Rev. 2021, 151, 111601. [Google Scholar] [CrossRef]
- El-Darwish, I.; Gomaa, M. Retrofitting Strategy for Building Envelopes to Achieve Energy Efficiency. Alex. Eng. J. 2017, 56, 579–589. [Google Scholar] [CrossRef]
- Alsabry, A.; Szymański, K.; Backiel-Brzozowska, B. Analysis of the Energy, Environmental and Economic Efficiency of Multi-Family Residential Buildings in Poland. Energies 2024, 17, 2057. [Google Scholar] [CrossRef]
- Chaturvedi, P.K.; Kumar, N.; Lamba, R. Multi-Objective Optimization for Visual, Thermal, and Cooling Energy Performance of Building Envelope Design in the Composite Climate of Jaipur (India). Energy Environ. 2024, 0958305X241228513. [Google Scholar] [CrossRef]
- Bekele, M.T.; Atakara, C. Residential Building Energy Conservation in Mediterranean Climate Zone by Integrating Passive Solar and Energy Efficiency Design Strategies. Buildings 2023, 13, 1073. [Google Scholar] [CrossRef]
- Nadarajah, P.D.; Singh, M.K.; Mahapatra, S.; Pajek, L.; Košir, M. Bioclimatic Classification for Building Energy Efficiency Using Hierarchical Clustering: A Case Study for Sri Lanka. J. Build. Eng. 2024, 83, 108388. [Google Scholar] [CrossRef]
- Yáñez, C.; Fissore, A.; Leiva, A. Informe Final de Usos de La Energia De los Hogares Chile 2018. Santiago, Chile, 2019; Available online: https://www.electricas.cl/wp-content/uploads/2020/07/informe-final-usos-energia-chile-2018.pdf (accessed on 20 January 2025).
- Avendaño-Vera, C.; Martinez-Soto, A.; Marincioni, V. Determination of Optimal Thermal Inertia of Building Materials for Housing in Different Chilean Climate Zones. Renew. Sustain. Energy Rev. 2020, 131, 110031. [Google Scholar] [CrossRef]
- Dirección Meteorológica de Chile. Anuario Meteorológico 2023; Dirección Meteorológica de Chile: Santiago, Chile, 2024. Available online: https://climatologia.meteochile.gob.cl/application/publicaciones/anuario (accessed on 20 January 2025).
- Dirección Meteorológica de Chile. Anuario Meteorológico 2022; Dirección Meteorológica de Chile: Santiago, Chile, 2023. Available online: https://climatologia.meteochile.gob.cl/application/publicaciones/anuario (accessed on 20 January 2025).
- Dirección Meteorológica de Chile. Anuario Meteorológico 2021; Dirección Meteorológica de Chile: Santiago, Chile, 2022. Available online: https://climatologia.meteochile.gob.cl/application/publicaciones/anuario (accessed on 20 January 2025).
- Dirección Meteorológica de Chile. Anuario Meteorológico 2020; Dirección Meteorológica de Chile: Santiago, Chile, 2021. Available online: https://climatologia.meteochile.gob.cl/application/publicaciones/anuario (accessed on 20 January 2025).
- González-Vallejo, P.; Muñoz-Sanguinetti, C.; Marrero, M. Environmental and Economic Assessment of Dwelling Construction in Spain and Chile. A Comparative Analysis of Two Representative Case Studies. J. Clean. Prod. 2019, 208, 621–635. [Google Scholar] [CrossRef]
- Ji, Y.; Duanmu, L. Airtightness Field Tests of Residential Buildings in Dalian, China. Build. Environ. 2017, 119, 20–30. [Google Scholar] [CrossRef]
- ISO 10292; Glass in Building—Calculation of Steady-State U Values (Thermal Transmittance) of Multiple Glazing. International Organization for Standardization ISO: Geneva, Switzerland, 1994.
- Tran, L.N.; Gao, W.; Ge, J. Sensitivity Analysis of Household Factors and Energy Consumption in Residential Houses: A Multi-Dimensional Hybrid Approach Using Energy Monitoring and Modeling. Energy Build. 2021, 239, 110864. [Google Scholar] [CrossRef]
- Chen, J.; Adhikari, R.; Wilson, E.; Robertson, J.; Fontanini, A.; Polly, B.; Olawale, O. Stochastic Simulation of Occupant-Driven Energy Use in a Bottom-up Residential Building Stock Model. Appl. Energy 2022, 325, 119890. [Google Scholar] [CrossRef]
- Trebilcock, M.; Soto-Muñoz, J.; Piggot-Navarrete, J. Evaluation of Thermal Comfort Standards in Office Buildings of Chile: Thermal Sensation and Preference Assessment. Build. Environ. 2020, 183, 107158. [Google Scholar] [CrossRef]
- Ritchie, H. Primary, Secondary, Final, and Useful Energy: Why Are There Different Ways of Measuring Energy? Our World Data 2022. Available online: https://ourworldindata.org/energy-definitions (accessed on 20 January 2025).
- Isaksson, R.; Rosvall, M. Understanding Building Sustainability—The Case of Sweden. Total Qual. Manag. Bus. Excell. 2020, 36, 222–236. [Google Scholar] [CrossRef]
- Li, X. Study on the Impact of Energy Rebound Effect on Carbon Emission Reduction at Different Stages of Urbanization in China. Ecol. Indic. 2021, 120, 106983. [Google Scholar] [CrossRef]
- Shan, X.; Deng, Q.; Tang, Z.; Wu, Z.; Wang, W. An Integrated Data Mining-Based Approach to Identify Key Building and Urban Features of Different Energy Usage Levels. Sustain. Cities Soc. 2022, 77, 103576. [Google Scholar] [CrossRef]
- Sepehri, A.; Pavlak, G.S. Evaluating Optimal Control of Active Insulation and HVAC Systems in Residential Buildings. Energy Build. 2023, 281, 112728. [Google Scholar] [CrossRef]
- Kunwar, N.; Salonvaara, M.; Iffa, E.; Shrestha, S.; Hun, D. Performance Assessment of Active Insulation Systems in Residential Buildings for Energy Savings and Peak Demand Reduction. Appl. Energy 2023, 348, 121209. [Google Scholar] [CrossRef]
- He, Y.; Zhou, H.; Fahimi, F. Modeling and Demand-Based Control of Responsive Building Envelope with Integrated Thermal Mass and Active Thermal Insulations. Energy Build. 2022, 276, 112495. [Google Scholar] [CrossRef]
- Katsigiannis, E.; Gerogiannis, P.A.; Atsonios, I.; Mandilaras, I.; Founti, M. Design and Parametric Analysis of a Solar-Driven Façade Active Layer System for Dynamic Insulation and Radiant Heating: A Renovation Solution for Residential Buildings. Energies 2023, 16, 5134. [Google Scholar] [CrossRef]
- Mousavi, S.N.; Villarreal-Marroquín, M.G.; Hajiaghaei-Keshteli, M.; Smith, N.R. Data-Driven Prediction and Optimization toward Net-Zero and Positive-Energy Buildings: A Systematic Review. Build. Environ. 2023, 242, 110578. [Google Scholar] [CrossRef]
- Abdul Mujeebu, M.; Bano, F. Energy-Saving Potential and Cost-Effectiveness of Active Energy-Efficiency Measures for Residential Building in Warm-Humid Climate. Energy Sustain. Dev. 2022, 67, 163–176. [Google Scholar] [CrossRef]
- Chwieduk, D.; Chwieduk, M. Determination of the Energy Performance of a Solar Low Energy House with Regard to Aspects of Energy Efficiency and Smartness of the House. Energies 2020, 13, 3232. [Google Scholar] [CrossRef]
- Delavar, H.; Sahebi, H. A Sustainable Mathematical Model for Design of Net Zero Energy Buildings. Heliyon 2020, 6, e03190. [Google Scholar] [CrossRef]
- Gatt, D.; Caruana, C.; Yousif, C. Building Energy Renovation and Smart Integration of Renewables in a Social Housing Block Toward Nearly-Zero Energy Status. Front. Energy Res. 2020, 8, 560892. [Google Scholar] [CrossRef]
- Hajare, A.; Elwakil, E. Integration of Life Cycle Cost Analysis and Energy Simulation for Building Energy-Efficient Strategies Assessment. Sustain. Cities Soc. 2020, 61, 102293. [Google Scholar] [CrossRef]
- Lakhiar, M.T.; Sanmargaraja, S.; Olanrewaju, A.L.; Lim, C.H.; Ponniah, V.; Mathalamuthu, A.D. Energy Retrofitting Strategies for Existing Buildings in Malaysia: A Systematic Review and Bibliometric Analysis. Environ. Sci. Pollut. Res. 2024, 31, 12780–12814. [Google Scholar] [CrossRef]
- Kocagil, I.E.; Enerji, E.Y.D.V.B. Tasarımına Yönelik Parametrik Bir Model Önerisi: Ilımlı-Nemli Iklim Bölgesi. MEGARON Yıldız Tech. Univ. Fac. Archit. E-J. 2021, 16, 735–750. [Google Scholar] [CrossRef]
- Katsaprakakis, D.A.; Zidianakis, G.; Yiannakoudakis, Y.; Manioudakis, E.; Dakanali, I.; Kanouras, S. Working on Buildings’ Energy Performance Upgrade in Mediterranean Climate. Energies 2020, 13, 2159. [Google Scholar] [CrossRef]
- Teng, J.; Wang, W.; Mu, X.; Xu, C. Assessing Energy Efficiency of Green Measures for Residential Buildings: The Simulation Case of the Changchun City in China. J. Hous. Built Environ. 2021, 36, 1103–1117. [Google Scholar] [CrossRef]
- Kumar, G.; De, S.; Thakur, B. Wall and Air Conditioner Combination for the Best Energy and Economic Performance: Methodology Demonstration for High-Rise Residential Buildings. Energy Convers. Manag. 2024, 300, 117909. [Google Scholar] [CrossRef]
- Faraj, K.; Khaled, M.; Faraj, J.; Hachem, F.; Castelain, C. Phase Change Material Thermal Energy Storage Systems for Cooling Applications in Buildings: A Review. Renew. Sustain. Energy Rev. 2020, 119, 109579. [Google Scholar] [CrossRef]
- Li, Y.; Nord, N.; Xiao, Q.; Tereshchenko, T. Building Heating Applications with Phase Change Material: A Comprehensive Review. J. Energy Storage 2020, 31, 101634. [Google Scholar] [CrossRef]
- Mostafazadeh, F.; Eirdmousa, S.J.; Tavakolan, M. Energy, Economic and Comfort Optimization of Building Retrofits Considering Climate Change: A Simulation-Based NSGA-III Approach. Energy Build. 2023, 280, 112721. [Google Scholar] [CrossRef]
- Jia, X.; Zhang, H.; Yao, X.; Yang, L.; Ke, Z.; Yan, J.; Huang, X.; Jin, S. Research on Technology System Adaptability of Nearly Zero-Energy Office Buildings in the Hot Summer and Cold Winter Zone of China. Sustainability 2023, 15, 13061. [Google Scholar] [CrossRef]
- Jin, Y.; Li, J.; Wu, W. I-Yard 2.0: Integration of Sustainability into a Net-Zero Energy House. Appl. Sci. 2020, 10, 3541. [Google Scholar] [CrossRef]
- Carlucci, F.; Cannavale, A.; Triggiano, A.A.; Squicciarini, A.; Fiorito, F. Phase Change Material Integration in Building Envelopes in Different Building Types and Climates: Modeling the Benefits of Active and Passive Strategies. Appl. Sci. 2021, 11, 4680. [Google Scholar] [CrossRef]
- Chen, Y.; Chen, Z.; Wang, D.; Liu, Y.; Zhang, Y.; Liu, Y.; Zhao, Y.; Gao, M.; Fan, J. Co-Optimization of Passive Building and Active Solar Heating System Based on the Objective of Minimum Carbon Emissions. Energy 2023, 275, 127401. [Google Scholar] [CrossRef]
- Ascione, F.; De Masi, R.F.; Mastellone, M.; Ruggiero, S.; Vanoli, G.P. Improving the Building Stock Sustainability in European Countries: A Focus on the Italian Case. J. Clean. Prod. 2022, 365, 132699. [Google Scholar] [CrossRef]
- Ibrahim, H.S.S.; Khan, A.Z.; Serag, Y.; Attia, S. Towards Nearly-Zero Energy in Heritage Residential Buildings Retrofitting in Hot, Dry Climates. Sustainability 2021, 13, 13934. [Google Scholar] [CrossRef]
- Uludaş, M.Ç.; Tunçbilek, E.; Yıldız, Ç.; Arıcı, M.; Li, D.; Krajčík, M. PCM-Enhanced Sunspace for Energy Efficiency and CO2 Mitigation in a House in Mediterranean Climate. J. Build. Eng. 2022, 57, 104856. [Google Scholar] [CrossRef]
- Scherz, M.; Hoxha, E.; Maierhofer, D.; Kreiner, H.; Passer, A. Strategies to Improve Building Environmental and Economic Performance: An Exploratory Study on 37 Residential Building Scenarios. Int. J. Life Cycle Assess. 2023, 28, 828–842. [Google Scholar] [CrossRef]
- Kutty, N.; Barakat, D.; Khoukhi, M. A French Residential Retrofit toward Achieving Net-Zero Energy Target in a Mediterranean Climate. Buildings 2023, 13, 833. [Google Scholar] [CrossRef]
- Pinotti, R.; Pernetti, R.; Babich, F.; Lollini, R. Towards a Systematic Approach for Supporting the Design Process of Deep Renovation Packages Based on Prefabricated Façade Technologies. In Proceedings of the Building Simulation Conference Proceedings, Rome, Italy, 2–4 September 2019; Volume 3. [Google Scholar]
- Garriga, S.M.; Dabbagh, M.; Krarti, M. Optimal Carbon-Neutral Retrofit of Residential Communities in Barcelona, Spain. Energy Build. 2020, 208, 109651. [Google Scholar] [CrossRef]
- Cunha, F.O.; Oliveira, A.C. Comparison of NZEB Indicators for Hotel Renovations under Different European Climatic Conditions. Int. J. Low-Carbon Technol. 2021, 16, 246–257. [Google Scholar] [CrossRef]
- Mata, E.; Kihila, J.M.; Wanemark, J.; Cheng, S.H.; Harris, S.; Sandkvist, F.; Nyberg, T.; Yaramenka, K. Non-Technological and Behavioral Options for Decarbonizing Buildings—A Review of Global Topics, Trends, Gaps, and Potentials. Sustain Prod Consum 2022, 29, 529–545. [Google Scholar] [CrossRef]
- Wang, X.; Mai, X.; Lei, B.; Bi, H.; Zhao, B.; Mao, G. Collaborative Optimization between Passive Design Measures and Active Heating Systems for Building Heating in Qinghai-Tibet Plateau of China. Renew. Energy 2020, 147, 683–694. [Google Scholar] [CrossRef]
- Fidorów-Kaprawy, N.; Dudkiewicz, E. Heating Ceiling System Efficiency in Different Climate Zones. Archit. Civ. Eng. Environ. 2023, 16, 151–161. [Google Scholar] [CrossRef]
- Reis, D.C.; De Domenico, A.T.; Lopes, L.; Almeida, M. Strategies and Actions for Achieving Carbon Neutrality in Portuguese Residential Buildings by 2050. Sustainability 2023, 15, 15626. [Google Scholar] [CrossRef]
- Kim, H.; Junghans, L. Integrative Economic Framework Incorporating the Emission Trading Scheme (ETS) for U.S. Residential Energy Systems. Energy Convers. Manag. X 2022, 14, 100197. [Google Scholar] [CrossRef]
- Hee Chung, M.; Eun Kim, S.; Woo Song, Y.; Chul Park, J. Strategies for Improving Impact of Energy Renovation: A Case Study on Korean Daycare Centers. Energy Build. 2023, 284, 112844. [Google Scholar] [CrossRef]
- Serageldin, A.A.; Abdeen, A.; Ahmed, M.M.S.; Radwan, A.; Shmroukh, A.N.; Ookawara, S. Solar Chimney Combined with Earth To-Air Heat Exchanger for Passive Cooling of Residential Buildings in Hot Areas. Solar Energy 2020, 206, 145–162. [Google Scholar] [CrossRef]
- Fidorów-Kaprawy, N.; Stefaniak, Ł. Potential of CO2 Emission Reduction via Application of Geothermal Heat Exchanger and Passive Cooling in Residential Sector under Polish Climatic Conditions. Energies 2022, 15, 8531. [Google Scholar] [CrossRef]
- Li, B.; Guo, W.; Liu, X.; Zhang, Y.; Caneparo, L. The Third Solar Decathlon China Buildings for Achieving Carbon Neutrality. Buildings 2022, 12, 1094. [Google Scholar] [CrossRef]
- Ibrahim, M.; Harkouss, F.; Biwole, P.; Fardoun, F.; Ouldboukhitine, S. Building Retrofitting towards Net Zero Energy: A Review. Energy Build. 2024, 322, 114707. [Google Scholar] [CrossRef]
- Borghero, L.; Clèries, E.; Péan, T.; Ortiz, J.; Salom, J. Comparing Cooling Strategies to Assess Thermal Comfort Resilience of Residential Buildings in Barcelona for Present and Future Heatwaves. Build. Environ. 2023, 231, 110043. [Google Scholar] [CrossRef]
- Mohammadi, A.; Mousavi, S.M. Feasibility study of net-zero energy residential buildings in hot and humid climates: A case study of Iran. J. Teknol. 2022, 84, 71–91. [Google Scholar] [CrossRef]
- Liyanage, D.R.; Hewage, K.; Hussain, S.A.; Razi, F.; Sadiq, R. Climate Adaptation of Existing Buildings: A Critical Review on Planning Energy Retrofit Strategies for Future Climate. Renew. Sustain. Energy Rev. 2024, 199, 114476. [Google Scholar] [CrossRef]
- Stasi, R.; Ruggiero, F.; Berardi, U. “En-Solex”: A Novel Solar Exoskeleton for the Energy-Efficiency Retrofitting of Existing Buildings. In E3S Web of Conferences; EDP Sciences: Les Ulis, France, 2024; Volume 523. [Google Scholar]
- Cao, X.; Yao, R.; Ding, C.; Zhou, N.; Yu, W.; Yao, J.; Xiong, J.; Xu, Q.; Pan, L.; Li, B. Energy-Quota-Based Integrated Solutions for Heating and Cooling of Residential Buildings in the Hot Summer and Cold Winter Zone in China. Energy Build. 2021, 236, 110767. [Google Scholar] [CrossRef]
- Kalbasi, R.; Sedaghat, A.; Khanafer, K.; Al-Masri, A. An Experimental Study on Application of Phase Change Materials in a Portable Cabin in Wintertime of Kuwait under Active/Passive Cooling. Appl. Therm. Eng. 2024, 257, 124429. [Google Scholar] [CrossRef]
- Duan, Z.; de Wilde, P.; Attia, S.; Zuo, J. Prospect of Energy Conservation Measures (ECMs) in Buildings Subject to Climate Change: A Systematic Review. Energy Build. 2024, 322, 114739. [Google Scholar] [CrossRef]
- De León, L.; Mora, D.; Carpino, C.; Arcuri, N.; Chen Austin, M. A Reference Framework for Zero Energy Districts in Panama Based on Energy Performance Simulations and Bioclimatic Design Methodology. Buildings 2023, 13, 315. [Google Scholar] [CrossRef]
- Citadini de Oliveira, C.; Catão Martins Vaz, I.; Ghisi, E. Retrofit Strategies to Improve Energy Efficiency in Buildings: An Integrative Review. Energy Build. 2024, 321, 114624. [Google Scholar] [CrossRef]
- Senturk, A.; Ozcan, M. Nearly Zero Energy Building Design and Optimization: A Residential Building Transformation in Türkiye. Energy Explor. Exploit. 2024, 42, 997–1026. [Google Scholar] [CrossRef]
- Khalid, H.; Thaheem, M.J.; Malik, M.S.A.; Musarat, M.A.; Alaloul, W.S. Reducing Cooling Load and Lifecycle Cost for Residential Buildings: A Case of Lahore, Pakistan. Int. J. Life Cycle Assess. 2021, 26, 2355–2374. [Google Scholar] [CrossRef]
- Lim, T.; Yim, W.S.; Kim, D.D. Evaluation of Daylight and Cooling Performance of Shading Devices in Residential Buildings in South Korea. Energies 2020, 13, 4749. [Google Scholar] [CrossRef]
- Nourozi, B.; Ploskić, A.; Chen, Y.; Ning-Wei Chiu, J.; Wang, Q. Heat Transfer Model for Energy-Active Windows—An Evaluation of Efficient Reuse of Waste Heat in Buildings. Renew Energy 2020, 162, 2318–2329. [Google Scholar] [CrossRef]
- He, Y.; Chu, Y.; Zang, H.; Zhao, J.; Song, Y. Experimental and CFD Study of Ventilation Performance Enhanced by Roof Window and Mechanical Ventilation System with Different Design Strategies. Build. Environ. 2022, 224, 109566. [Google Scholar] [CrossRef]
- Tuck, N.W.; Zaki, S.A.; Hagishima, A.; Rijal, H.B.; Yakub, F. Affordable Retrofitting Methods to Achieve Thermal Comfort for a Terrace House in Malaysia with a Hot–Humid Climate. Energy Build. 2020, 223, 110072. [Google Scholar] [CrossRef]
- Ibañez Iralde, N.S.; Pascual, J.; Salom, J. Energy Retrofit of Residential Building Clusters. A Literature Review of Crossover Recommended Measures, Policies Instruments and Allocated Funds in Spain. Energy Build. 2021, 252, 111409. [Google Scholar] [CrossRef]
- Mirlohi, S.M.; Sadeghzadeh, M.; Kumar, R.; Ghassemieh, M. Implementation of a Zero-Energy Building Scheme for a Hot and Dry Climate Region in Iran (a Case Study, Yazd). Renew. Energy Res. Appl. 2020, 1, 65–74. [Google Scholar] [CrossRef]
- Saleh, Y.A.S.; Gokcen Akkurt, G.; Turhan, C. Reconstructing Energy-Efficient Buildings after a Major Earthquake in Hatay, Türkiye. Buildings 2024, 14, 2043. [Google Scholar] [CrossRef]
- Tahsildoost, M.; Zomorodian, Z.S. Energy, Carbon, and Cost Analysis of Rural Housing Retrofit in Different Climates. J. Build. Eng. 2020, 30, 101277. [Google Scholar] [CrossRef]
- Rosso, F.; Ciancio, V.; Dell’Olmo, J.; Salata, F. Multi-Objective Optimization of Building Retrofit in the Mediterranean Climate by Means of Genetic Algorithm Application. Energy Build. 2020, 216, 109945. [Google Scholar] [CrossRef]
- Fernando, D.; Navaratnam, S.; Rajeev, P.; Sanjayan, J. Study of Technological Advancement and Challenges of Façade System for Sustainable Building: Current Design Practice. Sustainability 2023, 15, 14319. [Google Scholar] [CrossRef]
- Hu, X.; Xiang, Y.; Zhang, H.; Lin, Q.; Wang, W.; Wang, H. Active–Passive Combined Energy-Efficient Retrofit of Rural Residence with Non-Benchmarked Construction: A Case Study in Shandong Province, China. Energy Rep. 2021, 7, 1360–1373. [Google Scholar] [CrossRef]
- Azimi Fereidani, N.; Rodrigues, E.; Gaspar, A.R. A Review of the Energy Implications of Passive Building Design and Active Measures under Climate Change in the Middle East. J. Clean. Prod. 2021, 305, 127152. [Google Scholar] [CrossRef]
- D’Agostino, D.; Becchio, C.; Crespi, G.; Corgnati, S.P. Assessment of Passive and Active Buildings Resilience to Gas Supply Disruption in Winter across European Climates. Sustain. Cities Soc. 2023, 92, 104461. [Google Scholar] [CrossRef]
- Ezeh, C.I.; Hong, Y.; Deng, W.; Zhao, H. High Rise Office Building Makeovers—Exploiting Architectural and Engineering Factors in Designing Sustainable Buildings in Different Climate Zones. Energy Rep. 2022, 8, 6396–6410. [Google Scholar] [CrossRef]
- Sukanen, H.; Taylor, J.; Castaño-Rosa, R.; Pelsmakers, S.; Lehtinen, T.; Kaasalainen, T. Passive Mitigation of Overheating in Finnish Apartments under Current and Future Climates. Indoor Built Environ. 2023, 32, 1372–1392. [Google Scholar] [CrossRef]
- Mahar, W.A.; Verbeeck, G.; Reiter, S.; Attia, S. Sensitivity Analysis of Passive Design Strategies for Residential Buildings in Cold Semi-Arid Climates. Sustainability 2020, 12, 1091. [Google Scholar] [CrossRef]
- Bugenings, L.A.; Kamari, A. Bioclimatic Architecture Strategies in Denmark: A Review of Current and Future Directions. Buildings 2022, 12, 224. [Google Scholar] [CrossRef]
- Rempel, A.R.; Danis, J.; Rempel, A.W.; Fowler, M.; Mishra, S. Improving the Passive Survivability of Residential Buildings during Extreme Heat Events in the Pacific Northwest. Appl. Energy 2022, 321, 119323. [Google Scholar] [CrossRef]
- Xia, D.; Xie, W.; Guo, J.; Zou, Y.; Wu, Z.; Fan, Y. Building Thermal and Energy Performance of Subtropical Terraced Houses under Future Climate Uncertainty. Sustainability 2023, 15, 12464. [Google Scholar] [CrossRef]
- Giraldo-Castañeda, W.; Czajkowski, J.D.; Gómez, A.F. Confort Térmico En Vivienda Social Multifamiliar de Clima Cálido En Colombia. Rev. Arquit. 2021, 23, 115–124. [Google Scholar] [CrossRef]
- Faraj, K.; Khaled, M.; Faraj, J.; Hachem, F.; Castelain, C. A Review on Phase Change Materials for Thermal Energy Storage in Buildings: Heating and Hybrid Applications. J. Energy Storage 2021, 33, 101913. [Google Scholar] [CrossRef]
- Raji, B.; Tenpierik, M.J.; Bokel, R.; van den Dobbelsteen, A. Natural Summer Ventilation Strategies for Energy-Saving in High-Rise Buildings: A Case Study in the Netherlands. Int. J. Vent. 2020, 19, 25–48. [Google Scholar] [CrossRef]
- Arnaoutakis, G.E.; Katsaprakakis, D.A. Energy Performance of Buildings with Thermochromic Windows in Mediterranean Climates. Energies 2021, 14, 6977. [Google Scholar] [CrossRef]
- Elnagar, E.; Köhler, B. Reduction of the Energy Demand With Passive Approaches in Multifamily Nearly Zero-Energy Buildings Under Different Climate Conditions. Front. Energy Res. 2020, 8, 545272. [Google Scholar] [CrossRef]
- Iqbal, M.; Ozaki, A.; Choi, Y.; Arima, Y. Performance Improvement Plan towards Energy-Efficient Naturally Ventilated Houses in Tropical Climate Regions. Sustainability 2023, 15, 12173. [Google Scholar] [CrossRef]
- Felipe, E.; Bustamante, W. Parámetros de Diseño y Desempeño Energético En Edificios de Clima Mediterráneo. ARQ 2012, 82, 20–23. [Google Scholar]
- Ratajczak, K.; Amanowicz, Ł.; Szczechowiak, E. Assessment of the Air Streams Mixing in Wall-Type Heat Recovery Units for Ventilation of Existing and Refurbishing Buildings toward Low Energy Buildings. Energy Build. 2020, 227, 110427. [Google Scholar] [CrossRef]
- Liu, X.; Shen, C.; Yang, H.; Wang, J. Comprehensive Investigation on Lighting and Energy-Saving Performance of Lighting/Heating Coupled Tubular Daylighting Devices Integrated with Nanofluids. Appl. Therm. Eng. 2024, 239, 122094. [Google Scholar] [CrossRef]
- Montiel-Santiago, F.J.; Hermoso-Orzáez, M.J.; Terrados-Cepeda, J. Sustainability and Energy Efficiency: Bim 6d. Study of the Bim Methodology Applied to Hospital Buildings. Value of Interior Lighting and Daylight in Energy Simulation. Sustainability 2020, 12, 5731. [Google Scholar] [CrossRef]
- Abdeen, A.; Mushtaha, E.; Hussien, A.; Ghenai, C.; Maksoud, A.; Belpoliti, V. Simulation-Based Multi-Objective Genetic Optimization for Promoting Energy Efficiency and Thermal Comfort in Existing Buildings of Hot Climate. Results Eng. 2024, 21, 101815. [Google Scholar] [CrossRef]
- Pino, A.; Bustamante, W.; Escobar, R.; Pino, F.E. Thermal and Lighting Behavior of Office Buildings in Santiago of Chile. Energy Build. 2012, 47, 441–449. [Google Scholar] [CrossRef]
- Gao, Y.; Shi, D.; Levinson, R.; Guo, R.; Lin, C.; Ge, J. Thermal Performance and Energy Savings of White and Sedum-Tray Garden Roof: A Case Study in a Chongqing Office Building. Energy Build. 2017, 156, 343–359. [Google Scholar] [CrossRef]
- Carpio, M.; Carrasco, D. Impact of Shape Factor on Energy Demand, Co2 Emissions and Energy Cost of Residential Buildings in Cold Oceanic Climates: Case Study of South Chile. Sustainability 2021, 13, 9491. [Google Scholar] [CrossRef]
- Kenzhekhanov, S.; Memon, S.A.; Adilkhanova, I. Quantitative Evaluation of Thermal Performance and Energy Saving Potential of the Building Integrated with PCM in a Subarctic Climate. Energy 2020, 192, 116607. [Google Scholar] [CrossRef]
- Belussi, L.; Barozzi, B.; Bellazzi, A.; Danza, L.; Devitofrancesco, A.; Fanciulli, C.; Ghellere, M.; Guazzi, G.; Meroni, I.; Salamone, F.; et al. A Review of Performance of Zero Energy Buildings and Energy Efficiency Solutions. J. Build. Eng. 2019, 25, 100772. [Google Scholar] [CrossRef]
- Zhang, H.; Hewage, K.; Karunathilake, H.; Feng, H.; Sadiq, R. Research on Policy Strategies for Implementing Energy Retrofits in the Residential Buildings. J. Build. Eng. 2021, 43, 103161. [Google Scholar] [CrossRef]
- Ling, H.M.; Yew, M.C.; Yew, M.K.; Saw, L.H. Analyzing Recent Active and Passive Cool Roofing Technology in Buildings, Including Challenges and Optimization Approaches. J. Build. Eng. 2024, 89, 109326. [Google Scholar] [CrossRef]
- Al-Homoud, M.S.; Krarti, M. Energy Efficiency of Residential Buildings in the Kingdom of Saudi Arabia: Review of Status and Future Roadmap. J. Build. Eng. 2021, 36, 102143. [Google Scholar] [CrossRef]
- Nasrollahzadeh, N. Comprehensive Building Envelope Optimization: Improving Energy, Daylight, and Thermal Comfort Performance of the Dwelling Unit. J. Build. Eng. 2021, 44, 103418. [Google Scholar] [CrossRef]
- Talib, A.; Joe, J. Analyzing the Overrated Performance of Model-Based Predictive Control and Energy Saving Strategies in Building Energy Management: A Review. J. Build. Eng. 2025, 101, 111909. [Google Scholar] [CrossRef]
- Ziapour, B.M.; Khodaverdizadeh, N.; Afzal, S.; Hashtroudi, A. Enhancing Building Energy Efficiency Using a Hybrid Trombe Wall with PV and Reflective Mirrors. J. Build. Eng. 2025, 111, 113376. [Google Scholar] [CrossRef]
- Aqilah, N.; Rijal, H.B.; Zaki, S.A. Indoor Thermal Environment and Effect of Air Movement on Comfort Temperature in Malaysian Naturally Ventilated Dwellings. J. Build. Eng. 2025, 104, 112151. [Google Scholar] [CrossRef]
- Wang, M.; Jia, Z.; Tao, L.; Xiang, C. Review of Dynamic Façade Typologies, Physical Performance and Control Methods: Towards Smarter and Cleaner Zero-Energy Buildings. J. Build. Eng. 2024, 98, 111310. [Google Scholar] [CrossRef]
- Çataroğlu Coğul, I.; Kazanasmaz, Z.T.; Ekici, B. A Literature Review on Sustainable Buildings and Neighborhoods in Terms of Daylight, Solar Energy and Human Factors. J. Build. Eng. 2025, 103, 111989. [Google Scholar] [CrossRef]
Disclaimer/Publisher’s Note: The statements, opinions and data contained in all publications are solely those of the individual author(s) and contributor(s) and not of MDPI and/or the editor(s). MDPI and/or the editor(s) disclaim responsibility for any injury to people or property resulting from any ideas, methods, instructions or products referred to in the content. |
© 2025 by the authors. Licensee MDPI, Basel, Switzerland. This article is an open access article distributed under the terms and conditions of the Creative Commons Attribution (CC BY) license (https://creativecommons.org/licenses/by/4.0/).
