Abstract
The rapid expansion of urban rail transit networks has raised concerns about metro-induced vibrations in over-track structures. Floor vibration isolation systems provide an adaptable and efficient mitigation strategy, offering flexibility in architectural design while enhancing vibration comfort. This study investigates the dynamic characteristics and parameter optimization of such systems under multi-point excitations. A four-degree-of-freedom (4-DOF) model is developed to analyze the dynamic behavior of the isolation floor system, revealing that the height difference between the horizontal bearing installation plane and the centroid of the isolation plate critically induces “translation–rotation” coupling. Theoretical stability analysis and finite element simulations are employed to evaluate the effects of key parameters, including the isolation plate length, number of bearings, bearing arrangement, isolation frequency, and damping ratio. The results demonstrate that increasing the number of bearings reduces floor acceleration and displacement while improving response uniformity. The optimal isolation frequency range is identified as 3–5 Hz, balancing both isolation efficacy and uniformity. Additionally, increasing the bearing damping ratio to 0.05–0.1 can comprehensively mitigate vibration responses and improve vibration uniformity. Sensitivity analysis confirms that these optimal parameters exhibit strong robustness against ±20% practical deviations, ensuring reliable performance in engineering applications. These findings provide theoretical and practical guidance for optimizing floor isolation systems in over-track buildings, contributing to the sustainable development of urban rail transit networks.
1. Introduction
With the rapid expansion of urban rail transit systems globally, the issue of metro-induced vibrations in over-track buildings has attracted significant attention. These vibrations, primarily generated by dynamic train–track interactions and propagated through soil layers to adjacent structures, can compromise structural integrity, occupant comfort, and the operational precision of vibration-sensitive equipment such as medical devices and laboratory instruments [1,2,3]. Field tests have confirmed that metro-induced vibrations are predominantly vertical, with dominant frequencies concentrated in the 10–80 Hz range. This range coincides with both the human sensitivity band (4–80 Hz) and the critical resonance frequencies of building structural components [4,5,6,7]. Consequently, developing effective vibration mitigation strategies is essential for the environmentally sustainable development of urban rail transit systems.
Among the prevalent vibration control techniques, floor vibration isolation systems have emerged as a flexible and effective solution [8,9,10,11,12]. These systems, which involve installing isolation bearings between structural slabs and building floors, can significantly mitigate metro-induced vibrations without requiring foundation modifications [13,14]. Various configurations of floor isolation systems, such as the friction pendulum system [15], the biaxial spring unit isolation system [16], and the high-damping rubber bearing system [17], have been proposed in previous studies. However, the dynamic behavior of these systems under multi-directional and multi-point excitations remains inadequately characterized, leading to discrepancies between the theoretical predictions and field performance.
Current design methodologies predominantly rely on simplified single-degree-of-freedom (SDOF) models. While these models are useful for preliminary analysis, they fail to capture the complexities of large-scale floor systems, such as spatial variations in excitation phases and amplitudes, coupled translational–rotational responses arising from asymmetric bearing arrangements, and dynamic interactions between plate flexibility and boundary conditions [18,19]. Recent studies have emphasized the importance of multi-degree-of-freedom (MDOF) models for addressing these issues [20,21]. Although MDOF models have been proposed in seismic applications [9,22], their adaptation to metro-induced vibrations remains limited, particularly in quantifying the effects of critical design parameters.
To address these limitations, this study investigates the dynamic characteristics and parameter optimization of floor vibration isolation systems under metro-induced excitations. A four-degree-of-freedom (4-DOF) analytical model is established to capture the “translation–rotation” coupling phenomenon, identifying the height difference between the bearing installation plane and the centroid of the isolation plate as the critical inducing factor. Theoretical stability analysis is conducted to quantify the effects of key parameters, including the isolation plate length, number of bearings, and bearing arrangement. Furthermore, a multi-scale modeling strategy is justified by the significant dynamic decoupling between the isolation slab and the global building structure. This approach enables efficient parameter optimization using simplified component-level models, the results of which are subsequently validated through a comprehensive and refined finite element (FE) model of the rail–trackbed–soil–over-track building–isolation floor system under realistic metro excitations. This study aims to provide both theoretical and practical guidelines for optimizing floor isolation systems in over-track buildings, thereby contributing to the environmentally sustainable development of urban rail transit systems.
2. Theoretical Analysis on Dynamic Characteristics of Floor Isolation System
2.1. SDOF Isolation System
The single-degree-of-freedom (SDOF) vibration isolation system is a foundational model in vibration isolation theory and relies on several idealized assumptions: the isolated structure is a rigid body with symmetric mass distribution, excitations act through its centroid, and vibration is confined to a single direction without coupling effects.
In SDOF systems, acceleration transmissibility (Tr) is defined as the ratio of structural acceleration amplitude to ground acceleration amplitude [23]:
where ω is the excitation frequency; ωn is the natural frequency of the isolation system; ξ is the damping ratio; and β = ω/ωn is the frequency ratio. The system exhibits three distinct characteristic zones based on β: the amplification zone (β < 1, Tr > 1), the resonance zone (β ≈ 1, Tr peaks), and the isolation zone (β > , Tr < 1) [24].
Despite its utility for preliminary analysis, the SDOF model exhibits significant limitations: it assumes single-point, single-frequency excitation; it neglects spatial variations in excitation phases and amplitudes inherent in large-scale isolation plates with multiple bearings; furthermore, it ignores multi-directional coupling effects in unidirectional vibration analysis; and finally, it disregards the influence of plate dimensions and boundary conditions on the dynamic response due to the rigid-body idealization.
2.2. MDOF Isolation System
As the number of isolation bearings increases, multiple excitation points act on the isolation floor system, causing vibration responses to transition from SDOF to an MDOF behavior. Metro-induced structural vibrations predominantly occur in horizontal and vertical directions, with vertical components exhibiting the highest energy density. A comprehensive vibration isolation system possesses six degrees of freedom, comprising translational displacements (ux, uy, uz) along the Cartesian axes (X, Y, Z) and rotational displacements (θx, θy, θz) around these axes. To analyze the impact of the height difference between the horizontal bearing installation plane and the centroid of the isolation plate, the horizontal bearings in the Y-direction are installed at the centroid height of the isolation plate, and the horizontal bearings in the X-direction are positioned at a height difference H (H ≥ 0) below the centroid of the isolation plate. Under the following assumptions, this system can be simplified to a 4-DOF coupled model (ux, uy, uz, θy). A schematic diagram is shown in Figure 1.
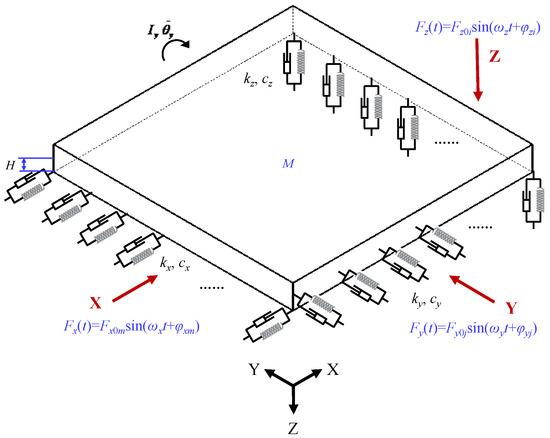
Figure 1.
Dynamic model of the 4-DOF floor vibration isolation system.
The coordinate system is defined as follows:
- Translational DOFs:
ux: positive along the X-axis; uy: positive along the Y-axis; uz: positive along the Z-axis.
- 2.
- Rotational DOFs:
θy: positive for counterclockwise rotation about the Y-axis.
- 3.
- Bearing configuration:
X-direction bearings: vertically below the centroid with a height difference H > 0.
Z-direction bearings: positioned at a horizontal distance li from the centroid (li > 0: right side; li < 0: left side).
In this study, the isolation plate is modeled as a rigid body of length 2l, mass M, and moment of inertia Iy about the Y-axis. The lumped-mass, rigid-body assumption is justified because the target isolation frequencies are significantly lower than the first flexural mode frequency of a typical concrete slab. Consequently, the behavior of the slab is dominated by rigid-body motion, rendering flexural deformations negligible for the analysis of the global dynamic response. A total of N isolation bearings are uniformly distributed along the X, Y, and Z directions. Each bearing is defined by directional stiffness kx, ky, kz, and damping coefficients cx, cy, cz. Owing to the symmetrical bearing arrangement, the horizontal distance li from each bearing to the plate centroid satisfies .
Harmonic excitations in the three translational directions are defined as
where Fx0m, Fy0j, Fz0i denote the excitation amplitudes; ωx, ωy, ωz are circular frequencies; and φxm, φyj, φzi are the phase angles.
The equations of motion are derived using Lagrange’s equations:
where T, V, D, Qj, qj represent the kinetic energy, elastic potential energy, damping dissipation function, generalized force, and generalized coordinate, respectively.
The kinetic energy of the system is
The elastic potential energy of the system is
The damping dissipation function is
The generalized forces are
Substituting Equations (6)–(9) into Lagrange’s Equation (5) yields the matrix–form equation of motion:
where the generalized coordinate is q = [ux, uy, uz, θy]T.
2.2.1. Coupled DOF Response (ux, θy)
Dynamic coupling between horizontal translation ux and rotation θy about the Y-axis arises from off-diagonal terms in the damping (C) and stiffness (K) matrices, which depend on the bearing height difference H and horizontal distances li. The coupled subsystem equations are expressed as
In matrix form:
The key parameters for the analysis are defined as
where is simplified to Nl2. Here, μ is the square of the radius of gyration; ω1 and ω3 are the characteristic frequencies in the X and Z directions; ξx and ξz are dimensionless damping ratios; λ1 is the dimensionless ratio of characteristic frequencies; λx and λz are the dimensionless excitation frequency ratios.
The impedance matrix is given by
Normalizing det(Z) by the characteristic stiffness Mω12 and Iyω12 yields the dimensionless complex function δ(λ):
where Mω12 = Nkx and Iyω12 = μMω12. Therefore, δ(λ) depends solely on the parameters λ, μ, H, l, ξx, and ξz.
Decomposing δ(λ) into its real part A(λ) and imaginary part B(λ):
where the real and imaginary parts are
δ(λ) = A(λ) + jB(λ)
The frequency response function (FRF) matrix H(λ) is the inverse of the impedance matrix Z:
With the components
Considering combined excitations in ux and θy, the composite FRFs are
The amplitudes of the FRFs are expressed as
where Ax = A(λx), Bx = B(λx), Az = A(λz), Bz = B(λz).
The phase angles are
The steady-state responses are given by
Specifically, represents the direct transmission of the X-direction excitation to horizontal translation ux; represents the coupled transmission of Z-direction excitation to ux via “translation–rotation” coupling; reflects the rotational excitation of θy induced by X-direction excitation through “translation–rotation” coupling; and corresponds to the moment transmission to θy from eccentric moments generated by Z-direction excitation. The phase factors , , , and denote the response phase lags relative to their respective excitations.
Assuming phase consistency (ϕx = φxm and ϕz = φzi), the equivalent excitation amplitudes are
where is the equivalent X-direction force amplitude, and is the equivalent Z-direction eccentric moment amplitude.
The height difference H between the horizontal bearing installation plane and the centroid of the isolation plate critically influences the “translation–rotation” (ux-θy) coupling.
- When H = 0, the height-dependent coupling terms vanish from the dynamic equations and frequency response functions. Consequently, the ux equation simplifies to an SDOF system driven solely by X-direction excitation, completely decoupled from θy. Similarly, the θy equation reduces to an SDOF system excited exclusively by the eccentric moment from Z-direction excitation, decoupled from ux. Under this condition, horizontal excitation induces only translational response ux without generating additional moments, while rotational response θy arises solely from Z-direction excitation eccentricity.
- When H ≠ 0, non-zero off-diagonal terms in the impedance matrix Z indicate dynamic “ux-θy” coupling. Horizontal excitation directly excites ux through the H11 term and generates a coupling moment FxH due to the height difference H. This moment excites θy, whose rotational velocity and displacement subsequently influence ux through coupling terms NHcx and NHkx.
Therefore, to mitigate detrimental coupling effects and simplify the system response, engineering designs should aim to achieve H = 0 by aligning horizontal bearings with the centroid plane of the isolation plate. This configuration minimizes dynamic coupling, enhances response predictability, and aligns with established structural vibration control principles.
2.2.2. Independent DOF Response (uy, uz)
Given the symmetrical bearing arrangements installed at the centroidal height, the Y-direction translation uy and Z-direction translation uz are decoupled from other degrees of freedom, allowing for independent analysis.
- Y-direction response uy
Under Y-direction excitation, the motion equation reduces to an SDOF system:
where the characteristic frequency , damping ratio , and frequency ratio are defined. Assuming phase consistency (ϕy = φyj), the equivalent excitation amplitude is .
The steady-state response is
where , .
- 2.
- Z-direction response uz
Under Z-direction excitation, the equation of motion is
where the characteristic frequency , damping ratio , and frequency ratio are defined. Assuming phase consistency (ϕz = φzi), the equivalent excitation amplitude is .
The steady-state response is
where , .
3. Numerical Analysis on the Influence of System Parameters on Vibration Isolation Performance
3.1. Theoretical Stability Analysis of Key Parameters
The horizontal translational response of the floor isolation system in the X-direction is determined by the magnitudes of the FRFs and . Similarly, the rotational response about the Y-axis depends on and . These FRF magnitudes (, , , and ) are functions of H, l, and the dimensionless parameters λx, λz, ξx, ξz, and λ1. To optimize vibration isolation performance and mitigate rotational coupling effects, a theoretical stability analysis is conducted to evaluate the parametric influence of the isolation plate length, the number of bearings, and the horizontal bearing arrangement.
3.1.1. Influence of the Isolation Plate Length
Figure 2 illustrates the influence of isolation plate length l (1, 2, 5, and 10) on FRF magnitudes under the following fixed parameters: N = 4, H = 0.4, ξx = 0.05, ξz = 0.05, μ = 0.5, and λ1 = 1.5.
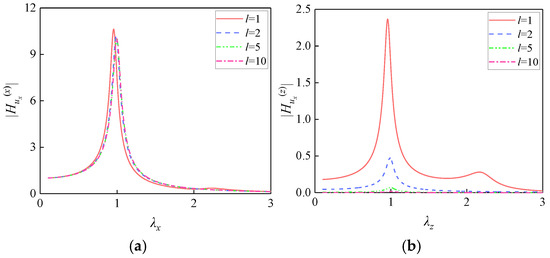
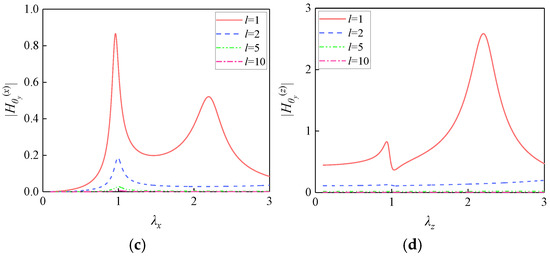
Figure 2.
Influence of isolation plate length on FRF magnitudes: (a) ; (b) ; (c) ; (d) .
The magnitude remains relatively constant, while , , and decrease as the plate length increases. As derived in Equation (22), the rotational response about the Y-axis includes rotational components induced by both X- and Z-direction excitations. Increasing the plate length raises the moment of inertia Iy, thereby amplifying the modulus of the determinant δ(λ). This amplification leads to a direct reduction in and . Physically, the enhanced inertial impedance attenuates Z-direction responses and weakens the “translation–rotation” coupling.
Similarly, the X-direction translational response comprises direct X-excitation and rotation-coupled Z-excitation components. exhibits negligible sensitivity to the plate length l, due to the cancelation of l2 terms in both the numerator and denominator of the FRF. Moreover, the dynamic equilibrium between the horizontal stiffness kx and the mass M is independent of l. In contrast, decreases with increasing plate length because the l2 term in the FRF denominator dominates the magnitude attenuation (l−2). Physically, the enhanced moment of inertia Iy suppresses rotations induced by Z-excitation (mediated through the lever arm l), thereby reducing energy transfer from rotational to translational degrees of freedom.
3.1.2. Influence of the Number of Bearings
Figure 3 illustrates the influence of the number of bearings N (2, 4, 8, and 10) on FRF magnitudes under the following fixed parameters: l = 2, H = 0.4, μ = 0.5, and λ1 = 1.5. The bearing stiffness and damping ratios are consistent with those specified in Section 3.1.1.
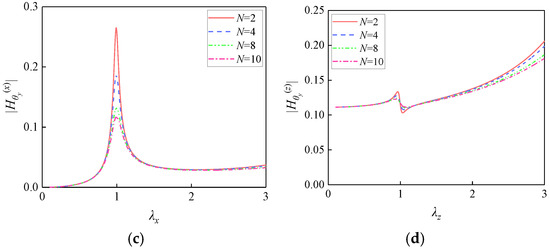
Figure 3.
Influence of the number of bearings on FRF magnitudes: (a) ; (b) ; (c) ; (d) .
Increasing the number of bearings N reduces all FRF magnitudes (, , , and ), although the rate of attenuation progressively diminishes. This reduction results from the enhanced system resistance to deformation. The increased diagonal terms Nkx and in the stiffness matrix directly suppress translational and rotational responses, while the coupling term NHkx reduces the “translation–rotation” interaction. Additionally, the increased damping coefficients Ncx and enhance energy dissipation, thereby attenuating resonant peaks. Notably, FRF magnitudes decrease significantly when N increases from 2 to 4, indicating substantially enhanced system stability. However, further increases in N yield to 8 and 10 demonstrate diminishing returns in attenuation effectiveness.
An optimal range exists for the bearing quantity, where increasing N improves system stability, but the efficiency of vibration attenuation diminishes significantly. Therefore, practical design optimization necessitates a balance between vibration isolation performance and economic constraints, guided by numerical simulations and experimental validation to avoid cost-ineffective overdesign.
3.1.3. Influence of the Bearing Arrangement
The theoretical analysis in Section 2 indicates that the height difference between the horizontal bearing installation plane and the centroid of the isolation plate induces “translation–rotation” coupling. Figure 4 illustrates the influence of the height differences H (0.2, 0.4, 0.8, and 1.6) on FRF magnitudes under fixed parameters l = 2, N = 4, ξx = 0.05, ξz = 0.05, μ = 0.5, and λ1 = 1.5.
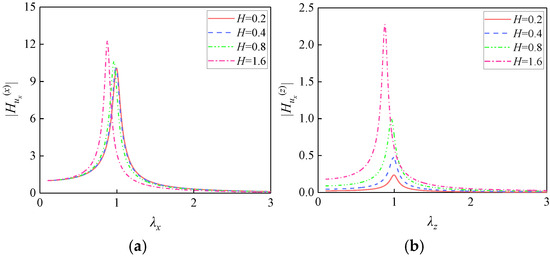
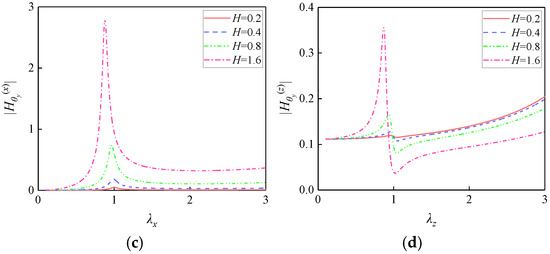
Figure 4.
Influence of the horizontal isolation bearing arrangement on FRF magnitudes: (a) ; (b) ; (c) ; (d) .
Increasing the height difference H significantly amplifies all FRF magnitudes. The coupled rotational response exhibits the most pronounced amplification, followed by the coupled translational response , the direct rotational response , and the direct translational response . An increased H enhances rotational moments, directly amplifying θy responses. The intensified rotation strengthens translational coupling through the term NHkx, thereby increasing the magnitude of ux. Moreover, the eccentric moment generated by Z-direction excitation increases with H, promoting energy transfer from rotational to translational degrees of freedom. Therefore, horizontal isolation bearings should be installed at the isolation plate centroid to minimize vibration coupling, thereby reducing “translation–rotation” interactions and optimizing isolation performance.
In summary, the dynamic response characteristics of the isolation floor system are significantly influenced by parameters such as the isolation plate length, number of bearings, and horizontal bearing arrangement. Increasing the plate length enhances rotational inertia, which attenuates , , and while maintaining a stable . Increasing the number of bearings effectively reduces all FRF magnitudes and improves system stability, although economic considerations must be balanced against isolation performance. Notably, the height difference H between the horizontal bearing installation plane and the centroid of the isolation plate intensifies “translation–rotation” coupling, amplifying all FRFs, with the rotational coupling response showing the highest sensitivity. Therefore, positioning bearings at the plate centroid is recommended to mitigate coupling effects and optimize isolation performance.
3.2. Parametric Numerical Analysis of Vibration Isolation Performance
An FE model of the vibration isolation floor system (Figure 5) was established in ABAQUS to evaluate the influence of the number of bearings, isolation frequency, and damping ratio on the vibration isolation effect. The isolation slab (8 m × 4 m × 0.15 m) was constructed from C30 concrete (ρ = 2400 kg/m3, E = 30 GPa). Given that metro-induced vibrations are predominantly vertical [24,25,26], the model was simplified by uniformly distributing vertical isolation bearings and applying only vertical excitation. The concrete slab was modeled using C3D8R elements, while vertical isolation bearings were simulated with connector elements. The harmonic excitation F = Fisin(2πfit) at a frequency of 10 Hz, which represents the lower bound of the dominant metro-induced vibration range (10–80 Hz) and is critical for human comfort, was applied to the bearings.
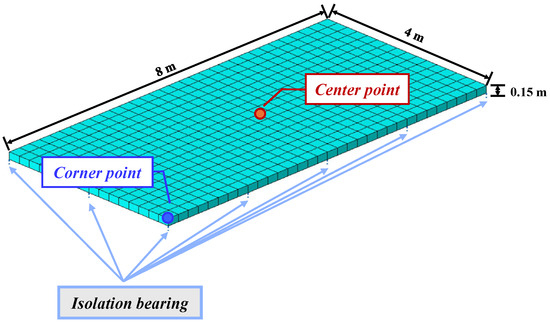
Figure 5.
FE model of the vibration isolation floor system.
The vibration isolation rate ζ is defined as [27]
where r0 and r1 are the vibration responses (acceleration or displacement) of the slab before and after isolation, respectively. The vibration isolation rate quantifies energy attenuation, with higher ζ values indicating superior isolation performance.
3.2.1. Influence of the Number of Bearings
To investigate the influence of the number of isolation bearings (N) on the dynamic response, simulations were conducted for configurations with 5, 15, and 25 bearings. The vertical isolation frequency and damping ratio were fixed at 3 Hz and 0.05, respectively. The corresponding bearing parameters are detailed in Table 1. Acceleration and displacement responses were measured at the center and corner points of the slab. The spatial distribution of isolation bearings is shown in Figure 6.

Table 1.
Parameters of isolation bearings for different numbers of bearings.
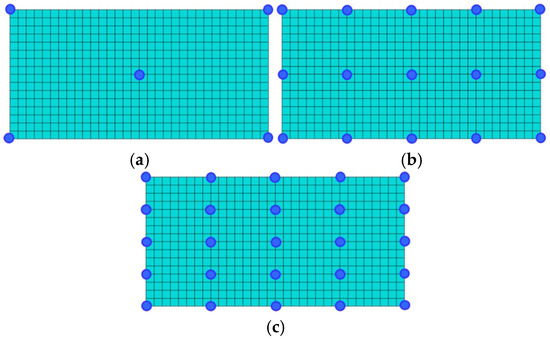
Figure 6.
Spatial distribution of isolation bearings: (a) N = 5; (b) N = 15; (c) N = 25.
Modal analysis was conducted to investigate the vibration modes of the isolation floor system with different numbers of isolation bearings. Figure 7, Figure 8 and Figure 9 illustrate the vibration modes for floors equipped with 5, 15, and 25 isolation bearings, respectively. The different colors in these figures represent the magnitude of displacement of the vibration modes. The natural frequencies of the isolation slab increase significantly with a greater number of bearings, gradually approaching the target isolation frequency. For instance, the first-order natural frequency rises from 1.49 Hz with 5 bearings to 2.54 Hz with 15 bearings, and further to 2.82 Hz with 25 bearings. This upward shift in modal frequencies indicates a substantial increase in system stiffness. Furthermore, the mode shapes demonstrate improved symmetry and decreased deformation irregularity as the number of bearings increases, confirming that a more uniform distribution of stiffness enhances the overall dynamic performance and stability of the isolation system.
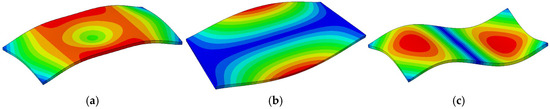
Figure 7.
Vibration modes of the isolation slab with five bearings: (a) f1 = 1.49 Hz; (b) f2 = 1.54 Hz; (c) f3 = 1.61 Hz.
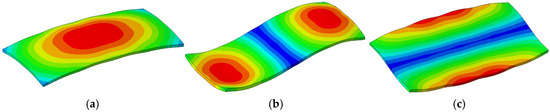
Figure 8.
Vibration modes of the isolation slab with 15 bearings: (a) f1 = 2.54 Hz; (b) f2 = 2.91 Hz; (c) f3 = 3.66 Hz.
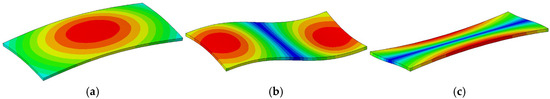
Figure 9.
Vibration modes of the isolation slab with 25 bearings: (a) f1 = 2.82 Hz; (b) f2 = 3.10 Hz; (c) f3 = 3.50 Hz.
Figure 10 illustrates the acceleration and displacement time–history curves of the isolation slab under different numbers of bearings, and Table 2 summarizes the corresponding peak response values. The dynamic response exhibits two distinct phases.
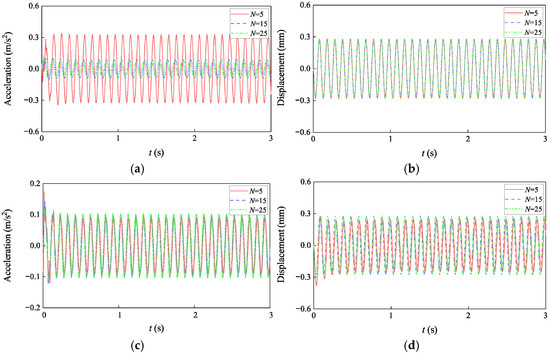
Figure 10.
Time-history curves of the isolation slab under different numbers of bearings: (a) center point acceleration; (b) center point displacement; (c) corner point acceleration; (d) corner point displacement.
Table 2.
Peak values of acceleration and displacement responses of the isolation slab under different numbers of bearings.
Transient response (t < 0.5 s): Non-periodic oscillations occur during the system transition to the steady state. These are observed at both the center and corner points and originate from the system initialization process, where unbalanced inertial and elastic forces result in the superposition of free vibration (response to initial conditions) and forced vibration (response to continuous excitation).
Steady-state response (t > 0.5 s): As transient energy is gradually dissipated by damping, the system stabilizes into consistent harmonic oscillation.
At the center point, the transient peak acceleration decreases monotonically from 0.351 m/s2 with 5 bearings to 0.130 m/s2 (a 63.0% reduction) with 15 bearings, then to 0.111 m/s2 (an additional 14.6% reduction) with 25 bearings. Similarly, the steady-state peak acceleration decreases from 0.334 m/s2 with 5 bearings to 0.093 m/s2 (a 72.2% reduction) with 15 bearings, then to 0.072 m/s2 (an additional 22.6% reduction) with 25 bearings. At the corner point, the transient peak acceleration decreases from 0.173 m/s2 with 5 bearings to 0.146 m/s2 (a 15.6% reduction) with 15 bearings, then to 0.120 m/s2 (an additional 17.8% reduction) with 25 bearings. In contrast, the steady-state peak acceleration initially increases from 0.094 m/s2 with 5 bearings to 0.104 m/s2 (a 10.6% increase) with 15 bearings, followed by a slight increase to 0.107 m/s2 (an additional 2.9% increase) with 25 bearings.
The displacement response shows greater sensitivity at the corner point than at the center. While the center point displacements remain nearly constant, the corner point transient displacement decreases significantly (by 26.3%) before stabilizing, and the steady-state displacement exhibits a 7.7% increase before reaching equilibrium.
The number of isolation bearings critically influences the uniformity of stiffness distribution. An insufficient quantity of bearings leads to stiffness discontinuities and localized deformation, whereas boundary constraints suppress vibrations at corner points. Increasing the number of bearings improves stiffness uniformity and enhances vibration energy transmission, leading to significant attenuation in the central region and reduced acceleration disparities between the center and corners. This improvement enhances the overall stability of the isolation floor system. However, once high stiffness uniformity is attained, additional bearings yield diminishing returns. Thus, an optimal design must balance performance with cost efficiency to avoid unnecessary resource expenditure.
3.2.2. Influence of Isolation Frequency
The natural frequency of a vibration isolation system is a key parameter that governs the transmission of vibration energy. By adjusting the ratio of the structural natural frequency (ωn) to the excitation frequency (ω), the transmission and attenuation characteristics of vibration can be effectively controlled. To investigate the effect of isolation frequency on the dynamic response of the isolation slab, simulations were conducted for three cases: ωn = 3, 10, and 20 Hz. In each case, the isolation slab was supported by 15 bearings with a constant damping ratio of 0.05. The corresponding bearing parameters are detailed in Table 3.
Table 3.
Parameters of isolation bearings for different isolation frequencies.
Modal analysis also demonstrates the significant influence of isolation frequency on the dynamic behavior of the isolation floor system. As shown in Figure 11, Figure 12 and Figure 13, at an isolation frequency of 3 Hz, the isolation slab exhibits lower natural frequencies (2.54 Hz, 2.91 Hz, and 3.66 Hz), with deformation modes primarily characterized by global flexural deformation. This suggests uniform energy distribution and no significant local stress concentration. When the isolation frequency increases to 10 Hz, the natural frequencies rise to 5.99 Hz, 6.12 Hz, and 6.64 Hz, and the deformation modes become more complex, exhibiting more significant twisting and localized deformation. At 20 Hz, the natural frequencies further increase to 7.35 Hz, 7.35 Hz, and 7.45 Hz, and the deformation further evolves into highly localized and asymmetric distortion. These observations confirm that lower isolation frequencies promote beneficial flexibility for vibration isolation, while higher frequencies restrict deformation, but may lead to localized deformation and reduced isolation effectiveness.

Figure 11.
Vibration modes of the isolation slab with isolation frequency of 3 Hz: (a) f1 = 2.54 Hz; (b) f2 = 2.91 Hz; (c) f3 = 3.66 Hz.
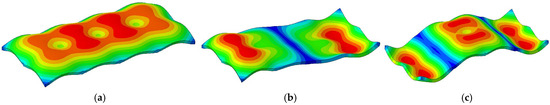
Figure 12.
Vibration modes of the isolation slab with isolation frequency of 10 Hz: (a) f1 = 5.99 Hz; (b) f2 = 6.12 Hz; (c) f3 = 6.64 Hz.
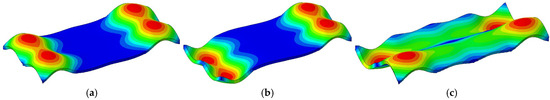
Figure 13.
Vibration modes of the isolation slab with isolation frequency of 20 Hz: (a) f1 = 7.35 Hz; (b) f2 = 7.35 Hz; (c) f3 = 7.45 Hz.
Figure 14 illustrates the acceleration and displacement time–history curves of the isolation slab under different isolation frequencies, and Table 4 summarizes the corresponding peak response values. When ωn = 3 Hz (ω/ωn = 3.33), the system operates in the isolation zone, resulting in minimal acceleration response; when ωn = 10 Hz (ω/ωn = 1.0), resonance occurs, leading to significant amplification of the acceleration response; and when ωn = 20 Hz (ω/ωn = 0.5), the system enters the amplification zone, producing an acceleration higher than that in the isolation zone, but considerably lower than under resonance.
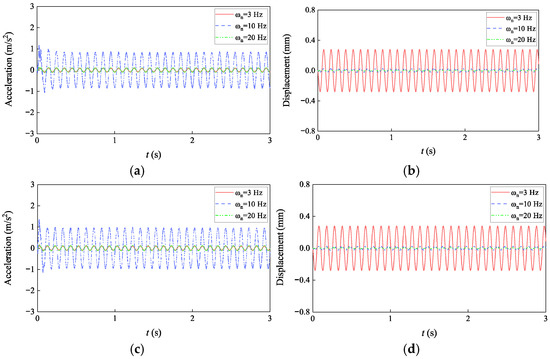
Figure 14.
Time-history curves of the isolation slab under different isolation frequencies: (a) center point acceleration; (b) center point displacement; (c) corner point acceleration; (d) corner point displacement.
Table 4.
Peak values of acceleration and displacement responses of the isolation slab under different isolation frequencies.
As the isolation frequency increases, the displacement at both the center and corner points decreases substantially. Specifically, the displacement decreases from 0.28 mm at 3 Hz to 0.026 mm at 10 Hz (a 90.7% reduction), and further drops to 0.007 mm at 20 Hz (an additional 73.1% reduction relative to 10 Hz).
Effective vibration control necessitates strict avoidance of the resonance zone (ω/ωn ≈ 1.0) and the selection of an appropriate isolation frequency according to structural sensitivity to dynamic excitations. Acceleration-sensitive structures [28] (e.g., precision instruments and medical equipment) are highly susceptible to vibration-induced acceleration; even small accelerations can impair measurement accuracy or induce defects in sensitive components, thereby requiring low-frequency isolation to sustain low-acceleration environments. In contrast, displacement-sensitive structures [29] (e.g., large-span spatial structures and pressure vessels) are primarily affected by vibration-induced displacements, as excessive displacements may cause fatigue damage, connection loosening, or instability. Consequently, vibration control for such structures must focus on enhancing stiffness to preserve geometric integrity and structural fatigue resistance.
3.2.3. Influence of Bearing Damping Ratio
The damping ratio of isolation bearings is another critical parameter affecting the vibration isolation performance. To evaluate its influence on the dynamic response of the isolation slab, simulations were conducted for a slab supported by 15 bearings with a fixed isolation frequency of 3 Hz, considering three damping ratios: ξ = 0.02, 0.05, and 0.1. The corresponding bearing parameters are detailed in Table 5.
Table 5.
Parameters of isolation bearings for different damping ratios.
Figure 15 illustrates the acceleration and displacement time–history curves of the isolation slab under different damping ratios, and Table 6 summarizes the corresponding peak values.
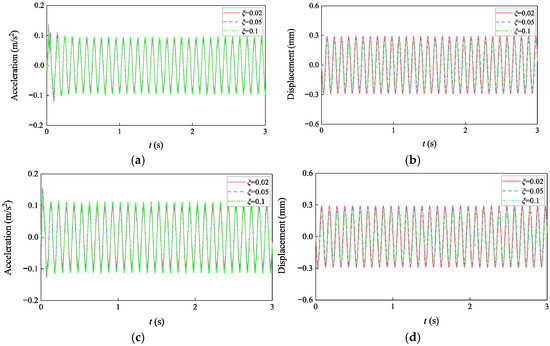
Figure 15.
Time-history curves of the isolation slab under different damping ratios: (a) center point acceleration; (b) center point displacement; (c) corner point acceleration; (d) corner point displacement.
Table 6.
Peak values of acceleration and displacement responses of the isolation slab under different damping ratios.
During the transient response, increasing the damping ratio from 0.02 to 0.1 reduces the acceleration at the center point from 0.138 m/s2 to 0.115 m/s2 (a 16.7% reduction), and at the corner point from 0.154 m/s2 to 0.139 m/s2 (a 9.7% reduction). Enhanced damping significantly improves the energy dissipation capacity of the isolation system, accelerating vibration attenuation and effectively suppressing peak transient accelerations at both locations, thereby reducing short-term dynamic impacts on the structure.
In contrast, during the steady-state phase, acceleration response increases with higher damping ratios. The center point acceleration rises by 14.9% (from 0.087 m/s2 to 0.100 m/s2), and the corner point acceleration increases by 19.6% (from 0.097 m/s2 to 0.116 m/s2). Although increased damping facilitates faster attenuation of transient vibrations, it also enhances vibration transmissibility under steady-state conditions, particularly within the isolation zone, resulting in amplified steady-state acceleration responses.
On the other hand, displacement response decreases under both transient and steady-state conditions as the damping ratio increases. For the transient response, center point displacement decreases from 0.30 mm to 0.25 mm (a 16.7% reduction), and corner point displacement decreases from 0.29 mm to 0.24 mm (a 17.2% reduction). A similar trend is observed in the steady-state response, with displacements at the center and corner points decreasing by the same percentages. This reduction is primarily attributed to enhanced energy dissipation capacity. Higher damping ratios continuously dissipate vibration energy, thereby suppressing displacement amplitudes. As a result, increased damping effectively limits vibration-induced displacements, which is particularly important for structures requiring strict displacement control.
4. Vibration Isolation Performance of Floor Isolation Systems Under Metro-Induced Vibrations in Over-Track Buildings
4.1. Numerical Modeling
The development of the full-scale FE model is predicated on the fundamental dynamic decoupling between the local isolation slab and the global building modes, a justified assumption given their frequency separation (0.4 Hz for the global structure versus 3–10 Hz for the isolation slab). This separation, supported by modal orthogonality and perturbation theory, ensures that the parametric trends identified from the component-level analyses (Section 2 and Section 3) are intrinsic to the isolation system and remain valid when integrated into the full-scale buildings. Thus, the primary role of this comprehensive model is to validate these optimized parameters under realistic conditions and to confirm the absence of detrimental scale effects or modal interactions.
A three-dimensional FE model of the rail–trackbed–soil–over-track building–isolation floor system was developed in ABAQUS (Figure 16). The dynamic response of the model was analyzed using the dynamic/explicit procedure. The substructure comprised two levels below the platform, with heights of 9.0 m and 6.0 m for Levels −2 and −1, respectively. The superstructure consisted of eight floors above the platform, each with a uniform height of 3.2 m. The platform measured 34.0 m × 34.0 m, with thicknesses of 1.2 m and 1.6 m. Above the platform, the floor slabs measured 20.0 m × 20.0 m and were 200 mm thick. Columns in the substructure (below the platform) had a cross-section of 1.0 m × 1.0 m, whereas those in the superstructure (above the platform) measured 0.8 m × 0.8 m. Each floor included 25 uniformly distributed structural columns. The concrete grade utilized was C30. The isolation slab was positioned parallel to the floor slabs on the second to eighth floors, with a thickness of 100 mm. Cartesian connector elements were used to simulate the isolation bearings, with the upper end connected to the isolation slab and the lower end connected to the floor slabs. The reinforced concrete elements of the over-track buildings were modeled using eight-node linear brick elements (C3D8R). The structural damping was set to 0.02, and an element size of 0.5 m was adopted for the over-track buildings. The soil–pile interaction was simulated using embedded constraints.
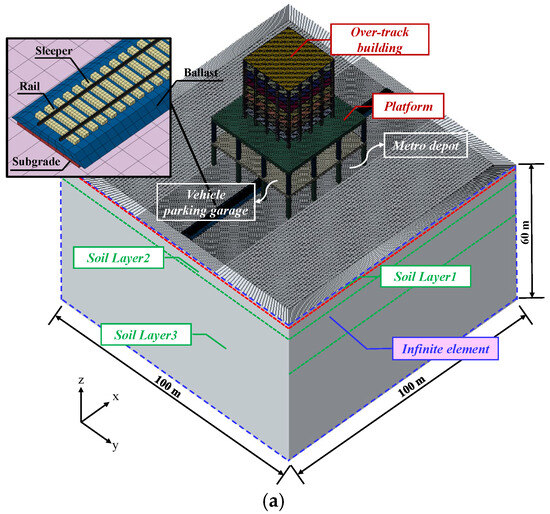
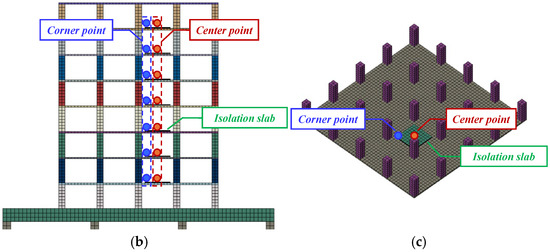
Figure 16.
The rail–trackbed–soil–over-track building–isolation floor system model: (a) overall model of the over-track building; (b) overall model of the isolation floor system; (c) local model of the isolation slab.
The soil was modeled with dimensions of 100 m × 100 m × 60 m (length × width × height), and an element size of 0.12 m. To ensure modeling accuracy, the element size was set to less than 1/10 of the minimum shear wavelength [30,31]. In areas distant from the track, the element size was increased to 1.0 m to improve computational efficiency. Based on statistical and geotechnical drilling data, the soil was modeled as three homogeneous layers, with their mechanical properties listed in Table 7 [32]. Given the small displacements induced by metro vibrations, an elastic constitutive model with eight-node linear brick elements (C3D8R) was employed [33]. Although this elastic–ideal assumption is generally sufficient for the current low-strain state, the comprehensive parameters in Table 7 are retained for future non-linear or elasto-plastic extensions. To simulate the semi-infinite nature of the soil and minimize spurious wave reflections at model boundaries, infinite elements (CIN3D8) were applied [34]. The total simulation time for the dynamic analysis was 50 s, with a time increment of 0.001 s [35]. The acceleration, displacement, Fourier amplitude, and vibration level responses were calculated at the center point of the floor slab of the non-isolated structure, as well as at the center point and corner point of the isolation slab.
Table 7.
Material properties of the soil.
The trackbed model consisted of sleepers, ballast, and subgrade. The rails (50 kg/m U71Mn steel) were connected to the sleepers through fasteners, while the remaining substructures were interconnected using tie constraints. The material properties of the rail and trackbed components are listed in Table 8.
Table 8.
Material properties of the rails and trackbed components, adapted from [32].
The metro-induced vibrations were simulated using a numerical approach calibrated with field test data via dynamic inversion [32,36]. Following the methodology proposed by Hung et al. [3], the train loads were modeled as multiple cosine functions with random phase angles. This approach simplifies the wheel–rail interaction by representing train loads as a series of sinusoidal forces with different amplitudes and frequencies at the wheel–rail contact interface.
The moving train load is mathematically expressed as [32]
where F(t) is the load from a single train wheel at time t; θi is the phase angle; φ(i) is the force amplitude at frequency i; n is the number of frequencies considered; and p is the axle load of the train. The loading process is implemented in ABAQUS using the VDLOAD subroutine.
In this study, the over-track building was assumed located in the throat area of a metro depot, where the train speed was set to 15 km/h, the maximum permitted speed in that area. This speed selection is based on the field tests from our previous study that confirmed that 15 km/h represents the typical and governing operational condition in the throat area of metro depot due to safety constraints. Focusing on this specific speed allows for an in-depth investigation of the most critical vibration scenario in this environment. Iterative calibration ensured good agreement between simulation results and experimental data in both the time and frequency domains [32]. A detailed quantitative comparison of the simulation results with the field test data, demonstrating close agreement in both time and frequency domains, is provided in reference [32]. As this load modeling approach has been validated in previous studies, further details are omitted for brevity.
4.2. Influence of Key Parameters of the Isolation System on Metro-Induced Vibration Isolation
4.2.1. Influence of the Number of Bearings
To investigate the influence of the number of bearings (N) on the dynamic response of the isolation slab, simulations were conducted with a fixed vertical isolation frequency of 3 Hz and a damping ratio of 0.05. Three configurations (N = 4, 9 and 25) were analyzed, and the corresponding bearing parameters are presented in Table 9.
Table 9.
Parameters of isolation bearings under different numbers of bearings.
As shown in Figure 17, before isolation, structural responses including acceleration, displacement, spectral acceleration, and vibration levels increase with floor height. After isolation, vibration responses demonstrate improved uniformity across different floor levels, with the height-amplification effect significantly attenuated. Furthermore, increasing the number of bearings effectively reduces inter-story response variations and enhances the overall vibration uniformity.
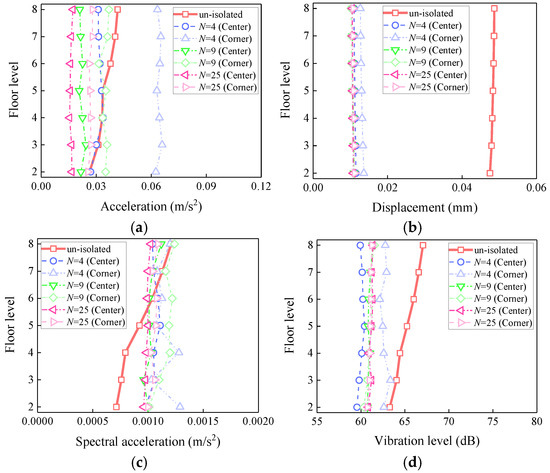
Figure 17.
Influence of the number of bearings on the vibration response of the isolation slab: (a) peak acceleration; (b) peak displacement; (c) peak Fourier amplitude; (d) maximum vibration level.
As shown in Table 10, the acceleration response of the isolation slab decreases significantly with an increasing number of bearings. At the center point, increasing N from 4 to 9 decreases the peak acceleration from 0.0338 m/s2 to 0.0244 m/s2 (a 27.8% reduction), while further increasing N to 25 results in 0.0173 m/s2 (a total reduction of 48.8%). Corner accelerations remain higher than center values, but the difference diminishes with larger N, from 0.0287 m/s2 (N = 4) to 0.0125 m/s2 (N = 9) and 0.0106 m/s2 (N = 25). This confirms that an insufficient number of bearings induces edge amplification effects, whereas increasing N promotes system uniformity by mitigating such discrepancies.
Table 10.
Vibration responses of the isolation slab under different numbers of bearings.
The isolation slab exhibits superior displacement control compared to acceleration, with isolation rates exceeding 72% at both center and corner points. When N increases from 4 to 25, the displacement reduction improves from 76.39% to 78.03% at the center and from 72.07% to 77.00% at the corner. Notably, the number of bearings has minimal influence on displacement performance under a constant isolation frequency.
The Fourier amplitude trends are consistent with time-domain results, showing improved reduction with higher N. Specifically, the Fourier amplitude reduction at the center increases from 8.33% (N = 4) to 16.67% (N = 25), while the corner points transition from amplification (−8.33%) to isolation (8.33%), confirming enhanced isolation effectiveness.
Insertion loss (L = VAL1-VAL2) [32], defined as the difference between non-isolated (VAL1) and isolated (VAL2) vibration acceleration levels, quantifies the effectiveness of vibration mitigation. The insertion loss difference between center and corner points decreases substantially with increasing N; for example, 2.94 dB (N = 4), 0.20 dB (N = 9), and 0.10 dB (N = 25). This indicates that a higher number of bearings significantly improves response uniformity by reducing localized vibration discrepancies.
Figure 18 shows the Fourier amplitude spectra of the isolation slab under different numbers of bearings. With the isolation frequency fixed at 3 Hz, spectral peaks consistently appear at this frequency. The non-isolated structure exhibits broadband vibration energy in the 10–30 Hz range, while the isolated structure demonstrates significant attenuation above 10 Hz, confirming effective suppression of high-frequency vibration transmission. Conversely, low-frequency components near 3 Hz are amplified due to targeted energy transfer. Increasing N shifts the spectral response from broadband to narrowband, with N = 25 producing the sharpest spectral peak and lowest amplitude.
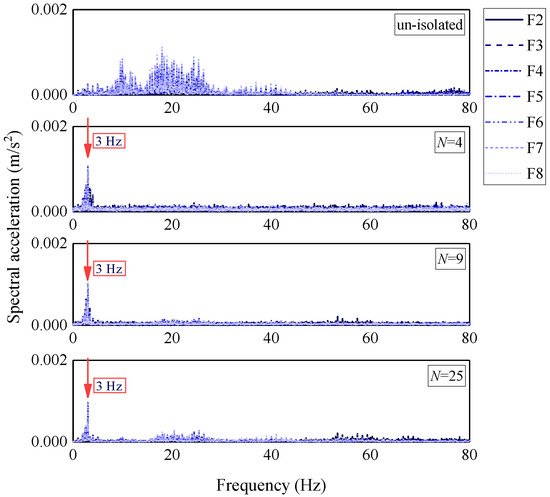
Figure 18.
Vertical Fourier amplitude spectra of the center point of the isolation slab under different numbers of bearings.
4.2.2. Influence of Isolation Frequency
To investigate the influence of isolation frequency (ωn) on the dynamic response of the isolation slab, simulations were conducted with 25 bearings installed beneath the slab and a fixed damping ratio of 0.05. Three configurations (ωn = 3, 5, and 10 Hz) were analyzed, and the corresponding bearing parameters are presented in Table 11.
Table 11.
Parameters of isolation bearings under different isolation frequencies.
Figure 19 presents the first-order vibration mode of the over-track building with isolation slabs of different isolation frequencies. The first-order vibration modes of the floor with isolation frequencies of 3 Hz, 5 Hz, and 10 Hz all exhibit a global flexural deformation pattern of the superstructure, which is mainly determined by the building’s structural layout. The first-order natural frequencies corresponding to isolation frequencies of 3 Hz, 5 Hz, and 10 Hz are 0.403 Hz, 0.404 Hz, and 0.405 Hz, respectively.
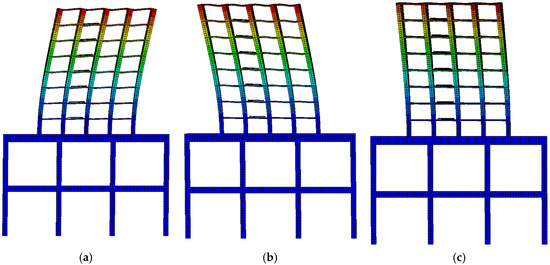
Figure 19.
First-order vibration mode of the over-track building with isolation slabs: (a) ωn = 3 Hz; (b) ωn = 5 Hz; (c) ωn = 10 Hz.
As shown in Figure 20, the dynamic response of the isolation slab exhibits significant variation with different levels of isolation frequency. At 3 Hz, optimal vibration suppression is achieved for acceleration, Fourier amplitude, and vibration levels, with the most gradual increase rate across floor heights. At 5 Hz, the responses increase significantly, and height-dependent amplification becomes more pronounced, demonstrating diminished isolation efficacy. At 10 Hz, heightened stiffness may shift the system toward resonance, resulting in a marked amplification of responses, particularly on the upper floors of the structure.
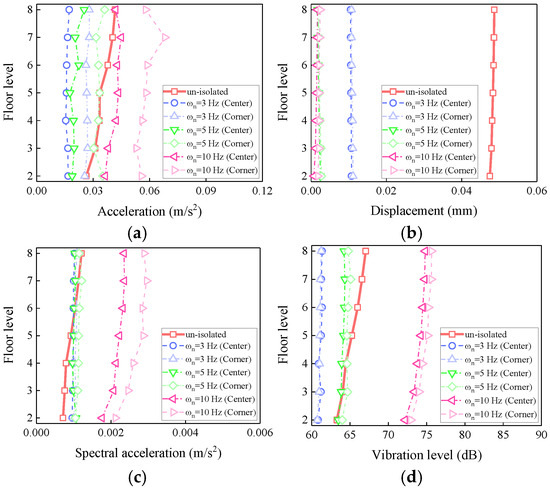
Figure 20.
Influence of the isolation frequency on the vibration response of the isolation slab: (a) peak acceleration; (b) peak displacement; (c) peak Fourier amplitude; (d) maximum vibration level.
As shown in Table 12, the acceleration response exhibits a sharp increase with elevated isolation frequency, potentially resulting in vibration amplification. When the isolation frequency is raised from 3 Hz to 5 Hz, the peak acceleration at the center point increases from 0.0173 m/s2 to 0.0252 m/s2, corresponding to a 45.7% increase, while the isolation rate declines from 58.51% to 39.57%. At 10 Hz, the acceleration attains 0.0449 m/s2, exceeding that of the non-isolated structure by 7.67%. Notably, the corner point acceleration persistently surpasses that of the center point, suggesting a diminished spatial uniformity at higher frequencies.
Table 12.
Vibration responses of the isolation slab under different isolation frequencies.
In contrast, displacement demonstrates an inverse trend, showing increasing isolation rates with higher isolation frequencies. At 3 Hz, the displacement isolation rates at the center and corner points are 78.03% and 77.00%, respectively. These values rise to 94.87% and 94.46% at 5 Hz, and further to 96.51% and 95.07% at 10 Hz. However, this apparent improvement at 10 Hz is attributed primarily to the restraining effect of high stiffness rather than energy dissipation, indicating that the isolation system fails to function effectively.
The Fourier amplitude follows a similar trend to the time-domain results. At 3 Hz, the isolation rate at the center is 16.67%, which declines to 8.33% at 5 Hz, and becomes −100.00% at 10 Hz. The effect is even more severe at the corners, where the isolation rate deteriorates to −150.00% at 10 Hz.
Similarly, the insertion loss decreases with increasing isolation frequency, while the difference between the center and corner points increases. At 3 Hz, the insertion losses are 5.7 dB (center) and 5.8 dB (corner), indicating near-uniform isolation (a 0.1 dB difference). At 5 Hz, the values drop to 2.72 dB and 1.95 dB (a 0.77 dB difference), indicating reduced effectiveness and increased non-uniformity. At 10 Hz, insertion losses become negative (−7.76 dB and −8.61 dB), confirming the complete failure of the isolation system.
Figure 21 demonstrates that the isolation frequency plays a critical role in governing vibration energy distribution. At 3 Hz, the vibration energy is predominantly concentrated at the target frequency, effectively converting broadband energy into the isolation band and significantly attenuating vibrations within the 10–30 Hz range. The 5 Hz configuration retains energy concentration but exhibits a broader bandwidth. However, at 10 Hz, the peak amplitude rises markedly, and isolation performance degrades across the 10–30 Hz range. Higher frequencies further broaden the bandwidth and promote energy accumulation, thereby inducing system instability. In summary, the 3 Hz frequency is optimal for acceleration-sensitive structures, whereas 5 Hz is more suitable for displacement-sensitive applications. Frequencies exceeding 10 Hz should be avoided due to the potential for detrimental vibration amplification.
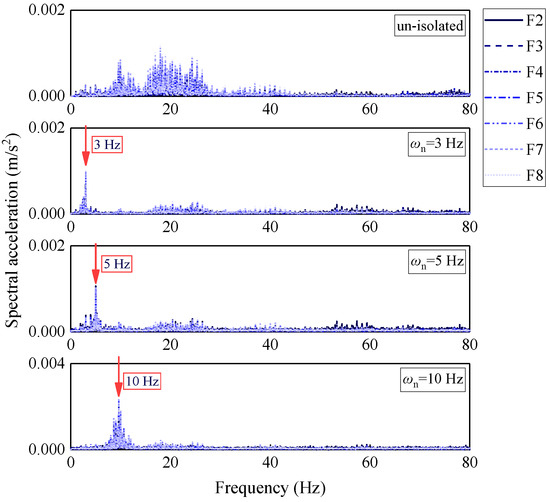
Figure 21.
Vertical Fourier amplitude spectra of the center point of the isolation slab under different isolation frequencies.
4.2.3. Influence of Bearing Damping Ratio
To investigate the influence of the damping ratio (ξ) of vibration isolation bearings on the dynamic response of the isolation slab, simulations were conducted with 25 bearings installed beneath the slab and a fixed isolation frequency of 3 Hz. Three configurations (ξ = 0.02, 0.05, and 0.1) were analyzed, and the corresponding bearing parameters are presented in Table 13.
Table 13.
Parameters of isolation bearings under different damping ratios.
As shown in Figure 22, increasing the damping ratio consistently reduces all responses across all floors, with the most significant isolation observed on the middle and upper floors. Notably, a substantial improvement occurs when ξ increases from 0.02 to 0.05, while further increasing it to 0.1 yields only marginal additional benefits.
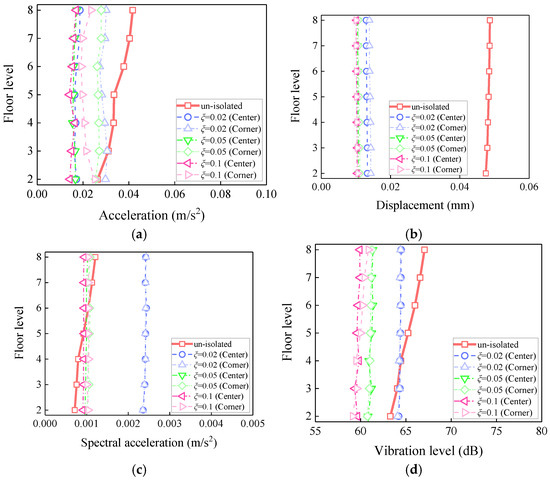
Figure 22.
Influence of the damping ratio on the vibration response of the isolation slab: (a) peak acceleration; (b) peak displacement; (c) peak Fourier amplitude; (d) maximum vibration level.
On the middle and upper floors, higher damping ratios lead to a notable reduction in vibration energy accumulation. These floors are predominantly affected by higher-order modal responses, which are associated with greater vibration velocities [37]. Since damping force is proportional to vibration velocity [38], increasing the damping ratio enhances the ability to dissipate the kinetic energy of these modes, thereby significantly attenuating responses at elevated levels.
As shown in Table 14, the acceleration responses at both the center and corner points exhibit a continuous decrease with increasing damping ratios. Specifically, when ξ increases from 0.02 to 0.1, the center point acceleration decreases from 0.0186 m/s2 to 0.0170 m/s2, with the isolation rate increasing from 55.40% to 59.23%. Similarly, the corner point acceleration decreases from 0.0301 m/s2 to 0.0251 m/s2, with the isolation rate increasing from 27.82% to 39.81%. Although the corner consistently exhibits higher acceleration, the difference between the two points narrows from 0.0115 m/s2 at ξ = 0.02 to 0.0081 m/s2 at ξ = 0.1, representing a 29.6% reduction, indicating improved spatial uniformity.
Table 14.
Vibration responses of the isolation slab under different damping ratios.
Displacement responses exhibit a similar trend. As ξ increases from 0.02 to 0.1, the center point displacement decreases from 0.0133 mm to 0.0104 mm, corresponding to an isolation rate increase from 72.69% to 78.64%. At the corner, displacement declines from 0.0143 mm to 0.0106 mm, with the isolation rate increasing from 70.64% to 78.23%. Moreover, the difference in isolation rates between the center and corner also diminishes as damping increases.
The Fourier amplitude also decreases gradually with increasing damping ratios. At ξ = 0.02, the amplitudes at the center and corner points are 0.0017 m/s2 and 0.0016 m/s2, respectively, corresponding to negative isolation rates of −41.67% and −33.33%. At ξ = 0.05, the amplitudes decrease to 0.0010 m/s2 and 0.0011 m/s2, with isolation rates improving to 16.67% and 8.33%, respectively. A further increase to ξ = 0.1 reduces the amplitudes to 0.0009 m/s2 and 0.0010 m/s2, with isolation rates reaching 25% and 16.67%.
Similarly, the vibration level insertion loss increases with higher damping. At ξ = 0.02, the insertion losses are 2.58 dB (center) and 2.63 dB (corner), which increase to 5.70 dB and 5.80 dB at ξ = 0.05, and further to 7.12 dB and 6.20 dB at ξ = 0.1.
Figure 23 shows the Fourier amplitude spectra of the isolation slab under different damping ratios. In all cases, the vibration energy is concentrated at 3 Hz, confirming effective energy targeting. As ξ increases, the peak amplitude at 3 Hz gradually decreases, accompanied by an energy reduction in higher frequency bands. These findings provide practical guidance for selecting optimal damping ratios in engineering applications. A range of 0.05–0.1 is recommended to balance performance and cost, as this ensures effective vibration isolation, while avoiding diminishing returns and excessive damping-related expenses.
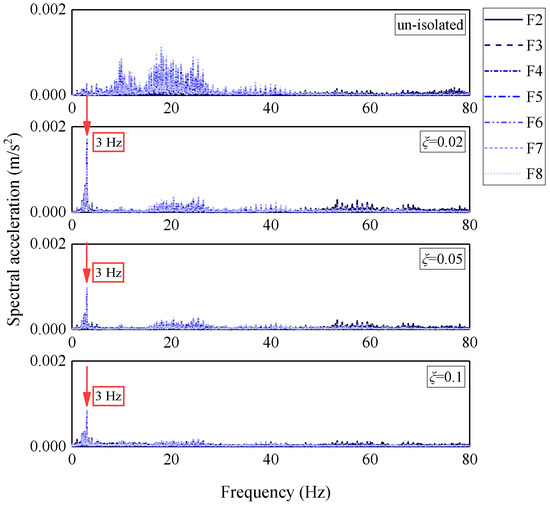
Figure 23.
Vertical Fourier amplitude spectra of the center point of the isolation slab under different damping ratios.
4.3. Parametric Sensitivity Analysis for Robustness of Isolation Systems
This section presents a parametric sensitivity analysis to evaluate the robustness of the isolation performance when key design parameters (number of bearings, isolation frequency, damping ratio) deviate from their identified optimal values (N = 25, ωn = 3 Hz, ξ = 0.05). These optimal values were selected to balance vibration mitigation efficacy, structural response uniformity, and economic feasibility. Three deviation scenarios were defined for each parameter, reflecting the typical tolerances encountered in practical engineering applications.
4.3.1. Sensitivity to Deviations in the Number of Bearings
The influence of deviations in the number of isolation bearings was quantified by analyzing configurations with N = 20 (18% reduction) and N = 30 (20% increase). The corresponding bearing parameters are detailed in Table 15.
Table 15.
Bearing parameters for the sensitivity analysis of the number of bearings.
The results summarized in Table 16 demonstrate a high robustness against variations in N. For a reduction to N = 20, only marginal performance degradation is observed. The acceleration isolation rate at the center point decreases by less than 3% relative to the optimum, while the displacement isolation rate remains high at 77.82%, representing a mere 0.21% reduction. A slight decrease in spectral acceleration isolation and a minor deviation in insertion loss occur, and the core functionality is fully preserved without indications of performance instability. For an increase to N = 30, further additions yield diminishing marginal gains. The acceleration isolation rate improves by only approximately 2.6%, and improvements in other metrics are similarly negligible. This outcome aligns with the diminishing marginal gains observed in Section 4.2. These findings confirm that the recommended N = 25 lies within a stable design range. Minor deviations in construction or design are unlikely to compromise isolation effectiveness, while over-design provides limited benefit.
Table 16.
Vibration responses of the isolation slab for sensitivity analysis of bearing numbers.
4.3.2. Sensitivity to Deviations in Isolation Frequency
The sensitivity of the system to deviations in isolation frequency was assessed for ωn = 2.5 Hz (16.7% reduction) and ωn = 3.5 Hz (16.7% increase). The corresponding bearing parameters are detailed in Table 17.
Table 17.
Bearing parameters for the sensitivity analysis of isolation frequency.
As presented in Table 18, the system exhibits notable performance stability around the recommended frequency. For ωn = 2.5 Hz, lowering the isolation frequency does not induce degradation; instead, it slightly enhances the acceleration isolation, as the system operates further within the isolation zone. Displacement control is effectively maintained. Conversely, for ωn = 3.5 Hz, increasing the frequency produces a predictable and gradual performance decline. The acceleration isolation rate at the center point decreases by 4.3%. Crucially, the degradation is gradual rather than abrupt. This analysis confirms that the value of 3 Hz is not a critical point, but lies within a stable range. Practical deviations in achieving the target frequency during manufacturing or installation are therefore unlikely to lead to performance failure.
Table 18.
Vibration responses of the isolation slab for sensitivity analysis of isolation frequency.
4.3.3. Sensitivity to Deviations in Bearing Damping Ratio
The impact of damping ratio deviations was investigated for ξ = 0.04 (20% reduction) and ξ = 0.06 (20% increase), with parameters detailed in Table 19.
Table 19.
Bearing parameters for the sensitivity analysis of bearing damping ratio.
The results in Table 20 confirm the robustness of the system to variations in damping within the analyzed range. For a reduction to ξ = 0.04, the diminished energy dissipation capacity leads to an expected decrease in acceleration isolation. The spectral response is amplified, and insertion loss decreases, which underscores the role of damping in resonant control. Conversely, for an increase to ξ = 0.06, further increases in yield show a minimal benefit for acceleration isolation, illustrating the diminishing returns, and displacement control improves only marginally. This analysis demonstrates that while the damping ratio significantly influences the system response, the value of ξ = 0.05 represents a robust optimum. Deviations of ±20% do not precipitate abrupt performance loss, ensuring predictable behavior under practical conditions.
Table 20.
Vibration responses of the isolation slab for sensitivity analysis of bearing damping ratio.
5. Practical Implementation Challenges
5.1. Bearing Installation
The installation accuracy of isolation bearings is critical because it directly influences the “translation–rotation” coupling effect and the overall isolation performance. Theoretical analysis confirms that a height difference of H = 0 effectively eliminates detrimental coupling. However, in practice, centroid localization is often compromised by non-uniform material distribution in concrete slabs and inherent construction tolerances in bearing positioning. To minimize these effects, low-height elastic bearings are recommended to reduce unintended eccentricity. Their installation requires high-precision surveying, real-time leveling, and strict quality control throughout the process. Furthermore, employing a sufficient number of bearings ensures uniform stiffness distribution and helps avoid localized deformation, thereby enhancing system reliability.
5.2. Cost Considerations
Cost-effectiveness necessitates a trade-off between isolation performance and economic feasibility. Although high-damping rubber bearings incur a 30–50% higher manufacturing cost than standard rubber bearings, primarily because of advanced material formulations and precision processing, they offer significant long-term benefits. These include improved occupant comfort, enhanced protection of vibration-sensitive equipment, reduced fatigue-induced damage from both seismic and metro-induced vibrations, and lower maintenance costs over the structure’s lifespan. Consequently, life-cycle cost analysis is essential to quantify operational savings and optimize functional performance, as it integrates initial manufacturing costs, maintenance expenses, and residual value.
5.3. Maintenance Requirements
Continuous metro-induced vibrations cause the cumulative degradation of isolation bearings, necessitating a systematic maintenance regime. Although high-quality rubber or pendulum bearings are designed for service lives of 50–60 years under optimal maintenance, periodic inspections and potential replacements need to be planned. Routine visual inspections at 3–5-year intervals are recommended, whereas annual inspections are advisable for buildings above high-frequency metro lines. Critical indicators for bearing replacement include visible cracking, permanent deformation, loss of damping characteristics, or significant deviation from the designed isolation frequency. A comprehensive maintenance log should be established to track bearing performance over time, including acceleration responses and displacement data from on-site monitoring systems.
5.4. Potential Practical Problems
Several practical issues may arise during the service life of the system. The long-term aging of high-damping rubber bearings and the progressive wear of sliding surfaces can change the isolation frequency, necessitating a robust design that accommodates gradual performance changes. Bearings must be protected from environmental threats such as fire, moisture, and chemical exposure, all of which can degrade material properties and impair functionality. Corrosion-resistant metallic enclosures or other protective covers are typically required to mitigate these risks. Additionally, the design must account for rare extreme events, including strong seismic ground motions or impacts from maintenance equipment. The incorporation of mechanical displacement limits is recommended to prevent excessive displacements and structural damage.
6. Conclusions
The rapid growth of urban rail transit networks has exacerbated vibrations in over-track buildings, prompting a growing demand for flexible floor isolation systems as effective mitigation solutions. This study conducted a comprehensive investigation into the dynamic behavior and parameter optimization of such systems under complex excitation conditions. By developing MDOF dynamic models through dimensionless analysis, performing theoretical stability analyses, and conducting refined FE simulations, this study identified key mechanisms and quantified the generalizable influence of critical parameters on isolation performance. The main conclusions are as follows:
- (1)
- A 4-DOF model (ux, uy, uz, θy) was established to analyze the dynamic behavior of the isolation floor system under multi-point excitations. The height difference (H) between the horizontal bearing installation plane and the centroid of the isolation plate was identified as a critical factor inducing significant “translation–rotation” coupling. When H = 0, the system becomes decoupled, simplifying response prediction and improving isolation efficiency.
- (2)
- Dimensionless theoretical analysis demonstrated that the dynamic response of the isolation floor system is strongly influenced by key parameters, including the plate length, number of bearings, and bearing arrangement. Increasing the plate length enhances the moment of inertia, which amplifies rotational inertial impedance and reduces both rotational and coupled translational responses. Additional bearings improve system stiffness and damping, effectively lowering all FRF magnitudes and enhancing stability. However, this effect diminishes beyond an optimal bearing quantity, indicating a trade-off between performance and cost. A larger H amplifies “translation–rotation” coupling and substantially increases all FRF magnitudes, particularly the coupled rotational response. Optimal stability is achieved when bearings are located at the centroid of the isolation plate.
- (3)
- Parametric FE simulations further elucidated the influence of key parameters. Increasing the number of bearings promotes uniform stiffness, thereby reducing the overall acceleration and mitigating differences between central and corner points. However, the marginal benefit declines beyond 25 bearings. The isolation frequency dictates energy transmission: operation within the 3–5 Hz isolation band minimizes acceleration, rendering the system suitable for acceleration-sensitive applications. Conversely, higher frequencies could shift the system into the amplification zone, significantly elevating acceleration. Higher damping ratios enhance energy dissipation, effectively attenuating transient acceleration and displacement, though they slightly increase steady-state acceleration due to increased transmissibility in the isolation zone.
- (4)
- A coupled FE model of the rail–trackbed–soil–over-track building–isolation floor system was established to evaluate the isolation performance under realistic metro-induced vibrations. Simulations confirmed that the isolation floor system effectively reduces vibration transmission, resulting in spatially uniform responses across different floor levels. Increasing the number of bearings lowers acceleration and spectral responses and minimizes spatial variation between center and corner points. The analysis indicates that isolation frequencies of 3–5 Hz maximize efficacy, while a damping ratio of 0.05–0.1 provides comprehensive response suppression and spatial uniformity, representing an optimal performance–cost balance. Sensitivity analysis further demonstrates that the proposed parameter ranges exhibit strong robustness against practical deviations of ±20%, thereby ensuring reliable performance despite typical manufacturing and installation tolerances. These optimized parameter ranges are derived from generalized trends and are recommended as design guidelines for such systems in various over-track buildings.
- (5)
- Our findings elucidate the critical mechanism of “translation–rotation” coupling induced by the height difference H, providing a generalized analytical method beyond simplified SDOF models. The identified optimal parameters offer practical and robust design guidelines for vibration control in over-track buildings, enhancing their sustainable development. We also acknowledge certain limitations that point to valuable future research directions, including the following:
- While the current model primarily addresses harmonic and metro-induced vibrations, future work should incorporate multi-physics analyses, including combined loads from wind, human activities, and building equipment, to fully validate the system’s robustness under complex real-world operational conditions.
- The analysis assumed linear elastic material behavior for isolation bearings under low-strain vibrations. Investigating their long-term performance, including the potential effects of aging on high-damping rubber bearings, wear in sliding surface systems, and the impact of these factors on the isolation performance over the structure’s lifespan is crucial for life-cycle assessment and maintenance planning.
- Although the rigid-body assumption for the slab is justified for the target global response, a more detailed investigation coupling rigid-body modes with local flexural deformations of the slab could provide insights into high-frequency vibration transmission and localized responses, which would be beneficial for applications with strict vibration criteria.
- Exploring hybrid or semi-active control strategies that integrate the isolation system with tuned mass dampers (TMDs) or adaptive damping mechanisms could further enhance adaptability across a broader frequency range and under varying load conditions.
- Large-scale or full-scale experimental testing under well-controlled conditions is highly recommended to further corroborate the numerical findings and theoretical models presented in this study.
Author Contributions
Conceptualization: F.L.; methodology: M.J., F.L., Y.S., R.Z., Y.C., W.H. and Y.Z.; investigation: M.J.; writing—original draft preparation: M.J.; writing—review and editing: F.L.; supervision: Y.S., R.Z., Y.C., W.H. and Y.Z. All authors have read and agreed to the published version of the manuscript.
Funding
This research was funded by the Zhejiang Provincial Department of Housing and Urban-Rural Development Foundation, grant number 2024K381, and the China Machinery Engineering Corporation Youth Development Foundation, grant number QNJJ-PY-2024-10.
Data Availability Statement
The data presented in this study are available on request from the corresponding author.
Conflicts of Interest
Author Ming Jing, Feng Lu and Weidong Huang were employed by the company China United Engineering Co., Ltd. Author Yibo Shi was employed by the company Hangzhou Metro Development Group Co., Ltd. Author Yifeng Zhao was employed by the company Beijing Building Construction Research Institute Co., Ltd. The remaining authors declare that the research was conducted in the absence of any commercial or financial relationships that could be construed as a potential conflict of interest.
References
- Connolly, D.; Giannopoulos, A.; Forde, M.C. Numerical modelling of ground-borne vibrations from high-speed rail lines on embankments. Soil Dyn. Earthq. Eng. 2013, 46, 13–19. [Google Scholar] [CrossRef]
- Shao, Z.P.; Bai, W.; Dai, J.W.; Yu, H.; Tong, Y.M. Monitoring and analysis of railway-induced vibration and structure-borne noise in a transit oriented development project. Structures 2023, 57, 105097. [Google Scholar] [CrossRef]
- Hung, H.H.; Chen, G.H.; Yang, Y.B. Effect of railway roughness on soil vibrations due to moving trains by 2.5D finite/infinite element approach. Eng. Struct. 2013, 57, 254–266. [Google Scholar] [CrossRef]
- Sanayei, M.; Kayiparambil, P.A.; Moore, J.A.; Brett, C.R. Measurement and prediction of train-induced vibrations in a full-scale building. Eng. Struct. 2014, 77, 119–128. [Google Scholar] [CrossRef]
- Zou, C.; Wang, Y.; Moore, J.A.; Sanayei, M. Train-induced field vibration measurements of ground and over-track buildings. Sci. Total Environ. 2017, 575, 1339–1351. [Google Scholar] [CrossRef] [PubMed]
- Cao, Z.L.; Guo, T.; Zhang, Z.Q.; Li, A.Q. Measurement and analysis of vibrations in a residential building constructed on an elevated metro depot. Measurement 2018, 125, 394–405. [Google Scholar] [CrossRef]
- Tao, Z.Y.; Zou, C.; Wang, Y.M.; Wu, J. Vibration transmission within low-rise buildings above metro depot throat areas. J. Vib. Control 2023, 29, 1105–1116. [Google Scholar] [CrossRef]
- Liang, Q.H.; Zhou, Y.; Wang, D.Y.; Luo, W.; Li, J.; He, Z.M. Shaking table test of vertical isolation performances of super high-rise structure under metro train-induced vibration. J. Build. Eng. 2024, 82, 108323. [Google Scholar] [CrossRef]
- Bin, P.; Harvey, P.S., Jr. A dual-mode floor isolation system to achieve vibration isolation and absorption: Experiments and theory. J. Sound Vib. 2022, 525, 116757. [Google Scholar] [CrossRef]
- Sheng, T.; Bian, X.C.; Xiao, C.; Liu, G.B.; Li, Y. Experimental study on a geosynthetics isolator for the base vibration isolation of buildings neighboring metro transportation. Geotext. Geomembr. 2021, 49, 1066–1078. [Google Scholar] [CrossRef]
- Sheng, T.; Shi, W.X.; Shan, J.Z.; Hong, X.C.; Bian, G.B.; Liu, Y. Base isolation of buildings for subway-induced environmental vibration: Field experiments and a semi-analytical prediction model. Struct. Des. Tall Spec. 2020, 29, e1798. [Google Scholar] [CrossRef]
- Wang, C.H.; Wang, J.; Chen, H.; Ou, J.P. Mitigating train-induced building vibrations with rubber bearings designed for horizontal earthquake isolation. J. Build. Eng. 2024, 89, 109251. [Google Scholar] [CrossRef]
- Gidaris, I.; Taflanidis, A.; Lopez-Garcia, D.; Mavroeidis, G.P. Multi-objective risk-informed design of floor isolation systems. Earthq. Eng. Struct. Dyn. 2016, 45, 1293–1313. [Google Scholar] [CrossRef]
- Zhao, C.; Shi, D.; Zheng, J.; Niu, Y.; Wang, P. New floating slab track isolator for vibration reduction using particle damping vibration absorption and bandgap vibration resistance. Constr. Build. Mater. 2022, 336, 127561. [Google Scholar] [CrossRef]
- Lu, L.Y.; Lee, T.Y.; Juang, S.Y.; Yeh, S.W. Polynomial friction pendulum isolators (PFPIs) for building floor isolation: An experimental and theoretical study. Eng. Struct. 2013, 56, 970–982. [Google Scholar] [CrossRef]
- Cui, S.L.; Bruneau, M.; Kasalanati, A. Seismic response case study of isolated floor system having special biaxial spring units. J. Struct. Eng. 2016, 142, 05016002. [Google Scholar] [CrossRef]
- Fayyadh, N.K.; Hejazi, F. Hybrid rubber-concrete isolation slab system with various shape factors for structures subjected to horizontal and vertical vibrations. Struct. Des. Tall Spec. Build. 2023, 32, e1995. [Google Scholar] [CrossRef]
- Xiang, P.; Nishitani, A. Seismic vibration control of building structures with multiple tuned mass damper floors integrated. Earthq. Eng. Struct. Dyn. 2014, 43, 909–925. [Google Scholar] [CrossRef]
- Kuo, K.A.; Papadopoulos, M.; Lombaert, G. The coupling loss of a building subject to railway induced vibrations: Numerical modelling and experimental measurements. J. Sound Vib. 2019, 442, 459–481. [Google Scholar] [CrossRef]
- Song, Y.S.; Sun, X.T. Modeling and dynamics of a MDOF isolation system. Appl. Sci. 2017, 7, 393. [Google Scholar] [CrossRef]
- Charalampakis, A.E.; Tsiatas, G.C.; Tsopelas, P. A mass-reduction design concept for seismic hazard mitigation. Earthq. Eng. Struct. Dyn. 2020, 49, 301–314. [Google Scholar] [CrossRef]
- Liu, S.; Warn, G.P. Seismic performance and sensitivity of floor isolation systems in steel plate shear wall structures. Eng. Struct. 2012, 42, 115–126. [Google Scholar] [CrossRef]
- Clough, R.W.; Penzien, J. Dynamics of Structures; Computers and Structures, Inc.: Walnut Creek, CA, USA, 2003. [Google Scholar]
- Ruzicka, J.E.; Derby, T.F. Derby, Influence of Damping in Vibration Isolation; Naval Research Laboratory, U.S. Department of Defense: Washington, DC, USA, 1971. [Google Scholar]
- Li, X.M.; Chen, Y.K.; Zou, C.; Wu, J.H.; Shen, Z.X.; Chen, Y. Building coupling loss measurement and prediction due to train-induced vertical vibrations. Soil Dyn. Earthq. Eng. 2023, 164, 107644. [Google Scholar] [CrossRef]
- Zhu, Z.H.; Wang, L.D.; Costa, P.A.; Bai, Y.; Yu, Z.W. An efficient approach for prediction of subway train-induced ground vibrations considering random track unevenness. J. Sound Vib. 2019, 455, 359–379. [Google Scholar] [CrossRef]
- Han, Q.H.; Jing, M.; Lu, Y. Shaking table tests on the seismic response of truss structure with air spring-FPS three-dimensional isolation bearing. Earthq. Eng. Struct. Dyn. 2023, 52, 4964–4986. [Google Scholar] [CrossRef]
- Zhang, W.; Che, J.X.; Shu, H.; Bai, Y.M.; Liu, X.Y.; Wu, J.L.; Chen, W.D. Stewart-inspired vibration isolation mechanisms for precision equipment: Current status and future research trend. Mech. Mach. Theory 2025, 214, 106153. [Google Scholar] [CrossRef]
- Liu, Z.H.; Sun, L.M.; Chen, L.; Damatty, A.E. Dynamic analysis of long-span bridges with vibration control systems: A novel reduced-order model and comparative study. Eng. Struct. 2025, 333, 120066. [Google Scholar] [CrossRef]
- Qu, S.; Yang, J.; Feng, Y.; Peng, C.; Zhao, S.; Zhai, W. Ground vibration induced by maglev trains running inside tunnel: Numerical modelling and experimental validation. Soil Dyn. Earthq. Eng. 2022, 157, 107278. [Google Scholar] [CrossRef]
- Cheng, Y.; Lu, K.Y.; Huang, Q.J.; Ding, F.; Song, C.Y. Environmental microvibration analysis method for vibration isolation research in high-precision laboratories. Buildings 2024, 14, 1215. [Google Scholar] [CrossRef]
- Jing, M.; Lu, F.; Chen, Y.; Li, Y.; Gao, S.L.; Zhang, R.J. Research on the vibration response and control technologies for buildings above the metro depot. J. Build. Eng. 2025, 109, 112908. [Google Scholar] [CrossRef]
- Li, X.; Chen, Y.; Zou, C.; Chen, Y. Train-induced vibration mitigation based on foundation improvement. J. Build. Eng. 2023, 76, 107106. [Google Scholar] [CrossRef]
- Ren, Y.; Qu, S.; Yang, J.; Li, Q.; Zhu, B.; Zhai, W.; Zhu, S. An efficient three-dimensional dynamic stiffness-based model for predicting subway train-induced building vibrations. J. Build. Eng. 2023, 76, 107239. [Google Scholar] [CrossRef]
- Otsubo, M.; O’Sullivan, C.; Shire, T. Empirical assessment of the critical time increment in explicit particulate discrete element method simulations, Comput. Comput. Geotech. 2017, 86, 67–79. [Google Scholar] [CrossRef]
- Salehi, M.; Bagherzadeh, S.A.; Fakhari, M. Experimental detection of train wheel defects using wayside vibration signal processing. Struct. Health Monit. 2023, 22, 3286–3301. [Google Scholar] [CrossRef]
- Domenico, M.D.; Ricc, P.; Verderame, G. Floor spectra for bare and infilled reinforced concrete frames designed according to Eurocodes. Earthq. Eng. Struct. Dyn. 2021, 50, 3577–3601. [Google Scholar] [CrossRef]
- Algamati, M.; Al-Sakkaf, A.; Bagchi, A. Energy dissipation technologies in seismic retrofitting: A review. Civ. Eng. 2025, 6, 23. [Google Scholar] [CrossRef]
Disclaimer/Publisher’s Note: The statements, opinions and data contained in all publications are solely those of the individual author(s) and contributor(s) and not of MDPI and/or the editor(s). MDPI and/or the editor(s) disclaim responsibility for any injury to people or property resulting from any ideas, methods, instructions or products referred to in the content. |
© 2025 by the authors. Licensee MDPI, Basel, Switzerland. This article is an open access article distributed under the terms and conditions of the Creative Commons Attribution (CC BY) license (https://creativecommons.org/licenses/by/4.0/).