
Impact of Lighting Conditions on Emotional and Neural Responses of International Students in Cultural Exhibition Halls


Abstract
1. Introduction
- (1)
- Identify lighting conditions that enhance emotional engagement and cultural appreciation;
- (2)
- Explore EEG-based markers corresponding to positive affective and cognitive responses;
- (3)
- Construct predictive models that can guide lighting design in intercultural exhibition environments.
2. Literature Review
3. Materials and Methods
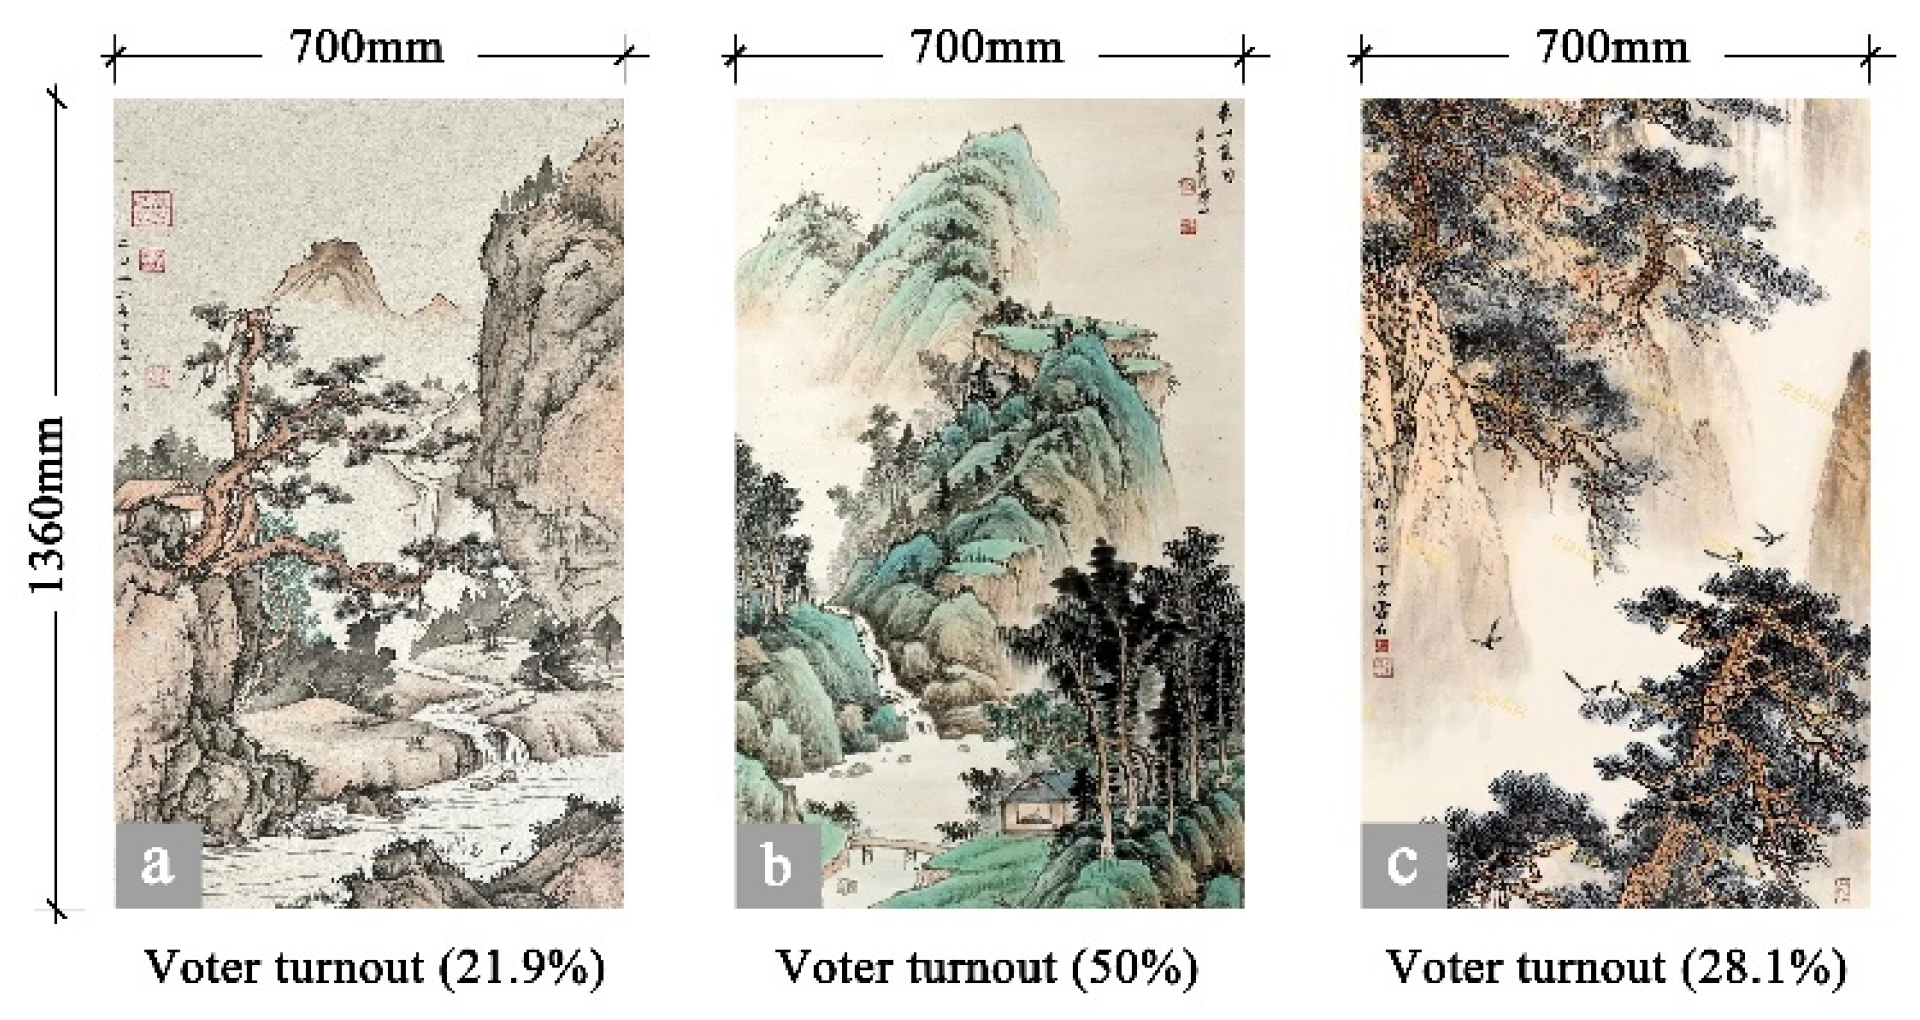
3.1. Subjects and Paintings
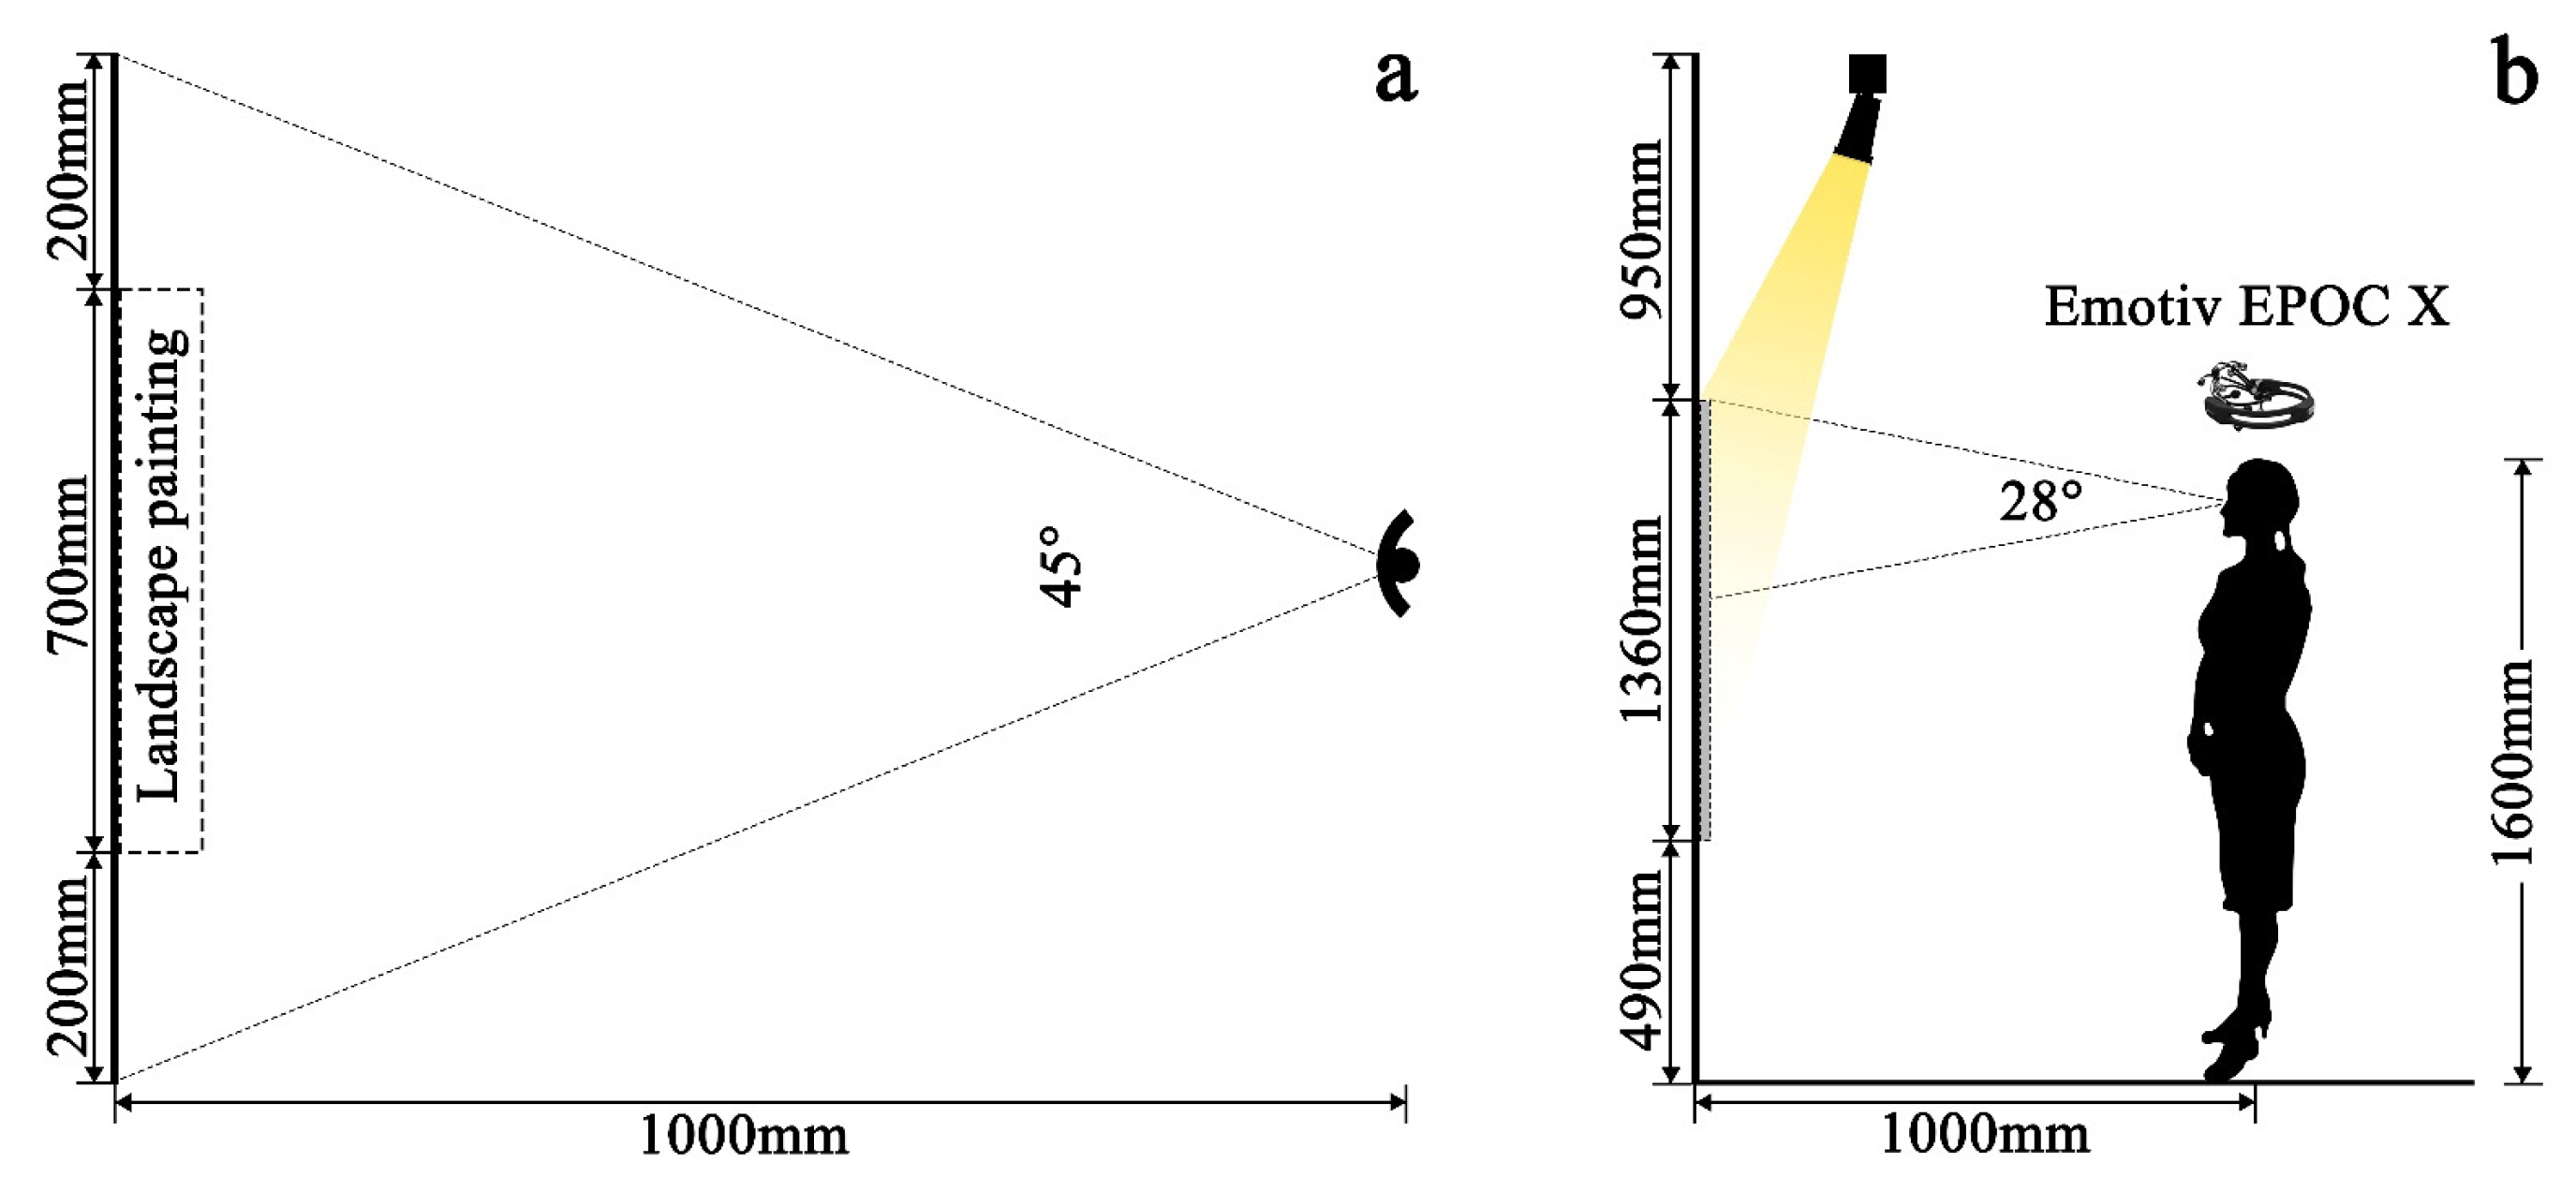
3.2. Experimental Environment and Equipment
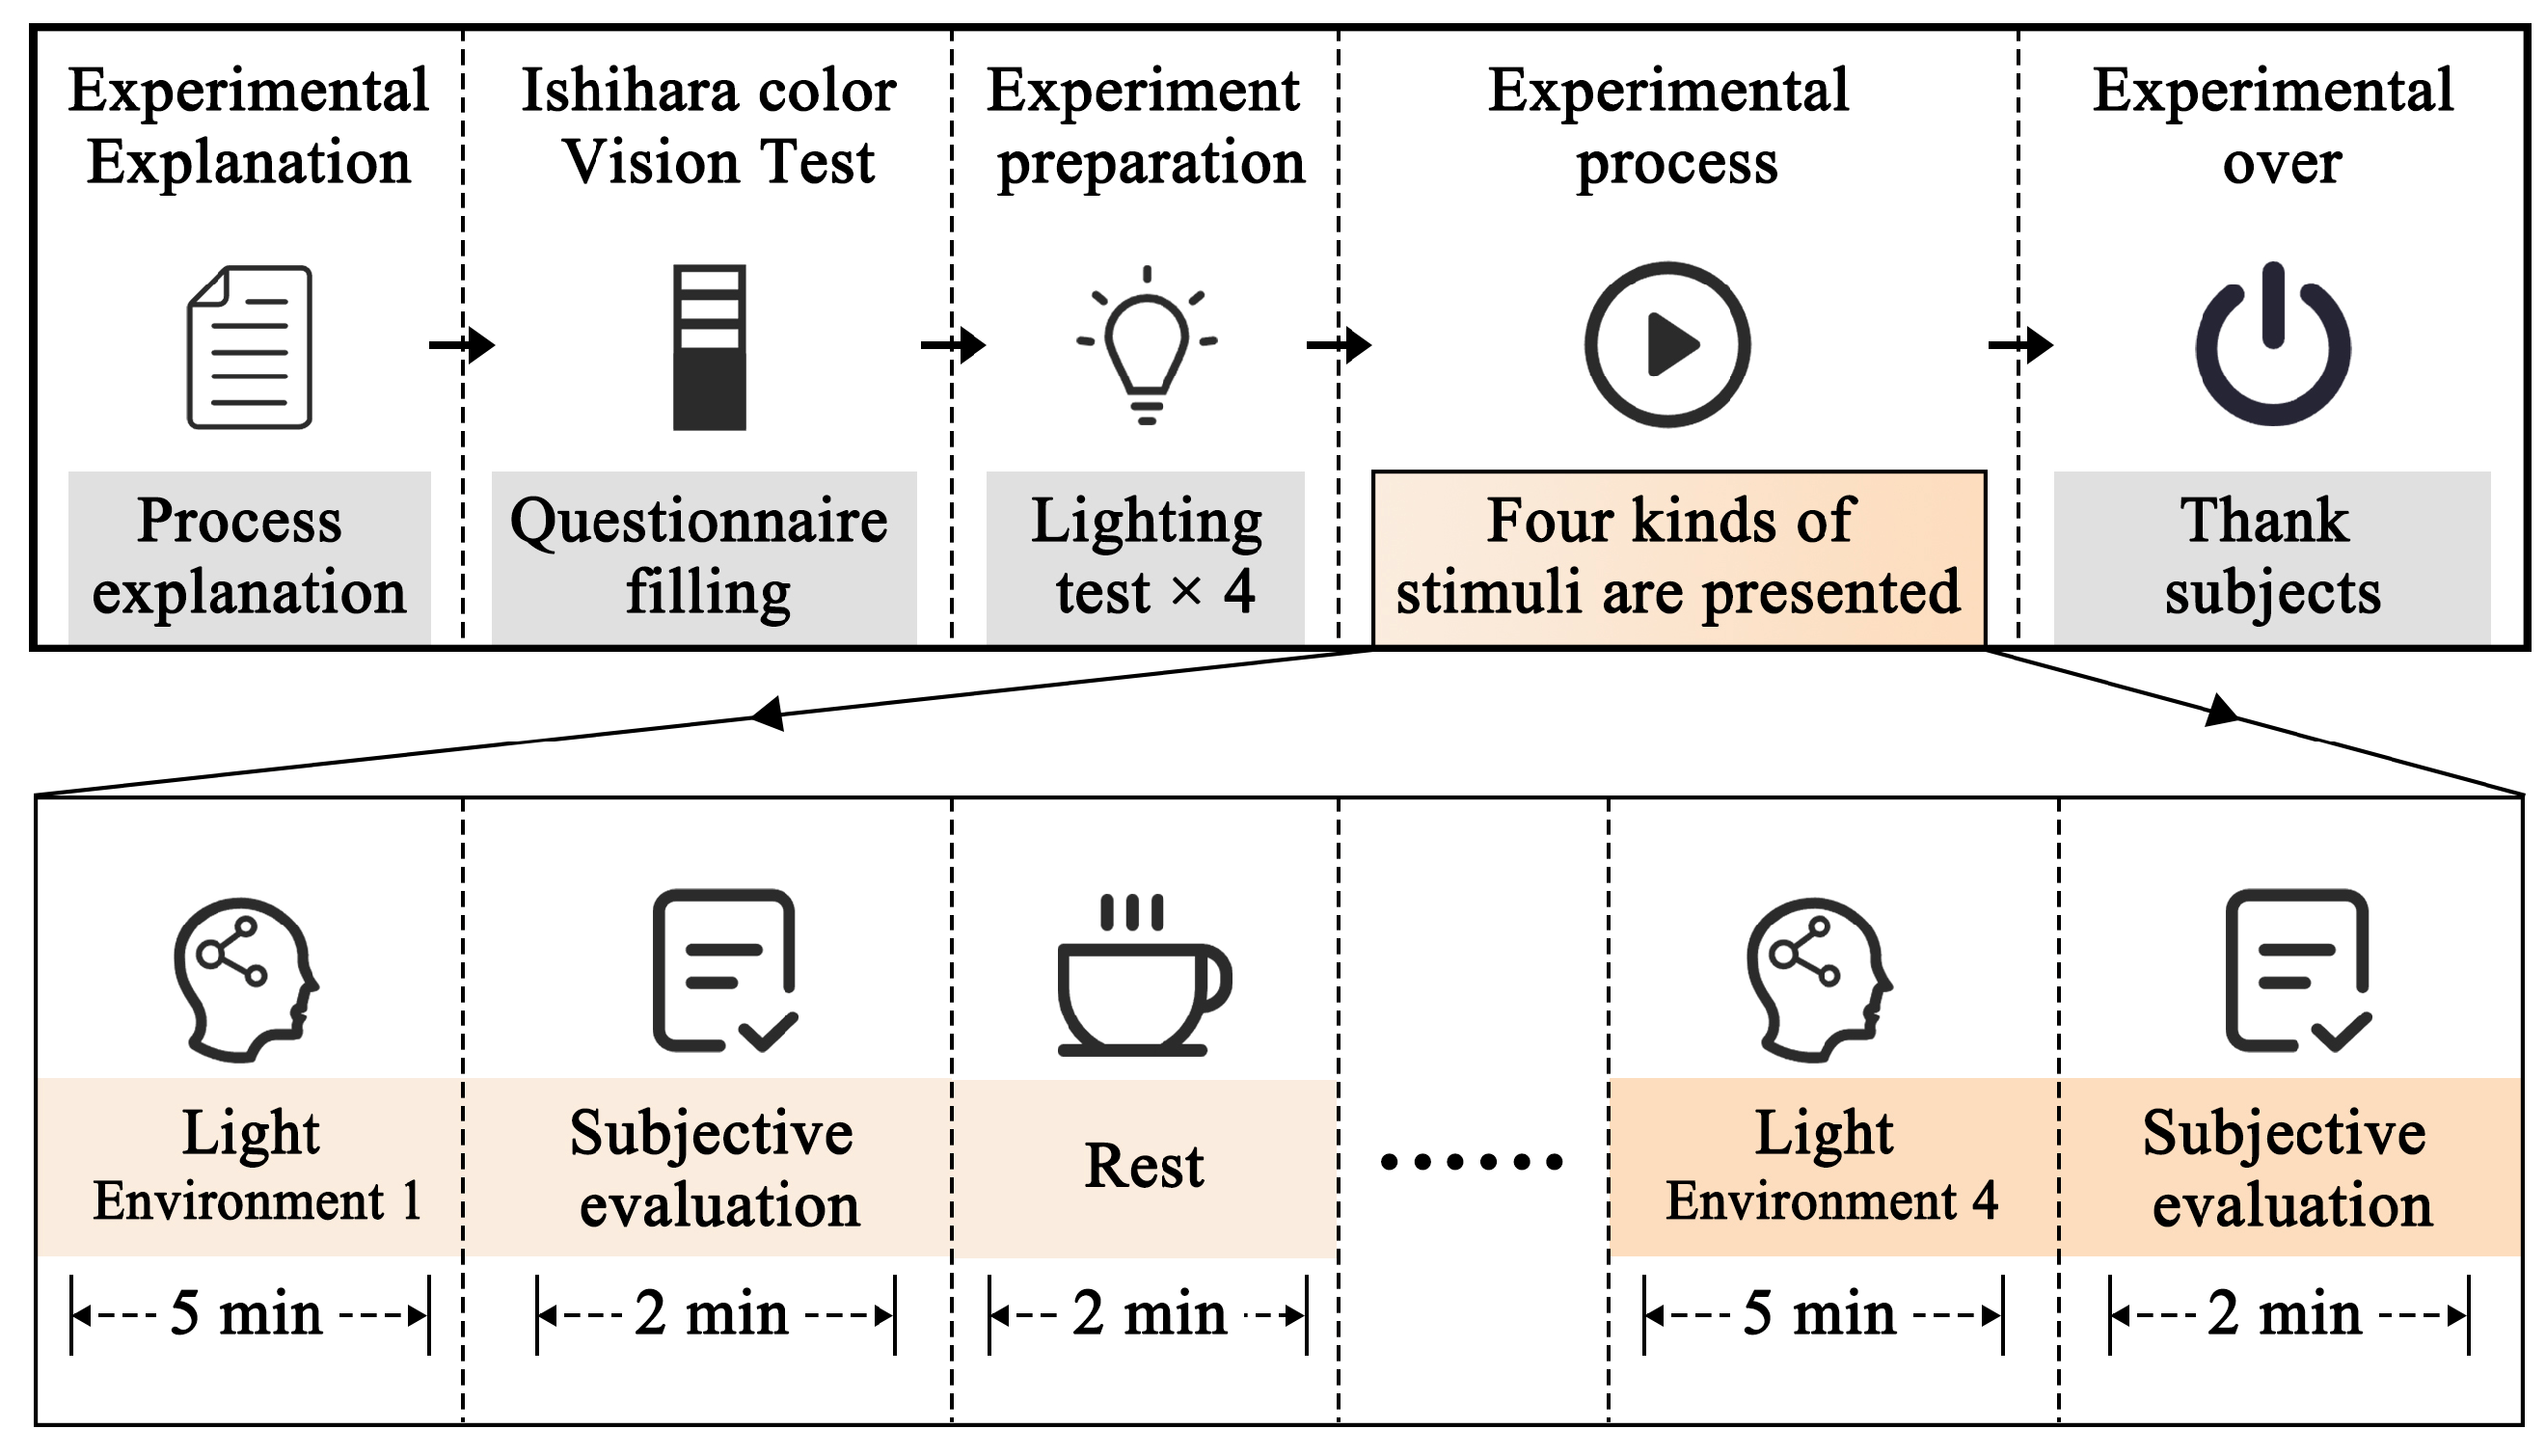
3.3. Program
3.4. Construction of Subjective and Objective Models
4. Results
4.1. The Influence of Academic Major on Perceptual Word Pairs
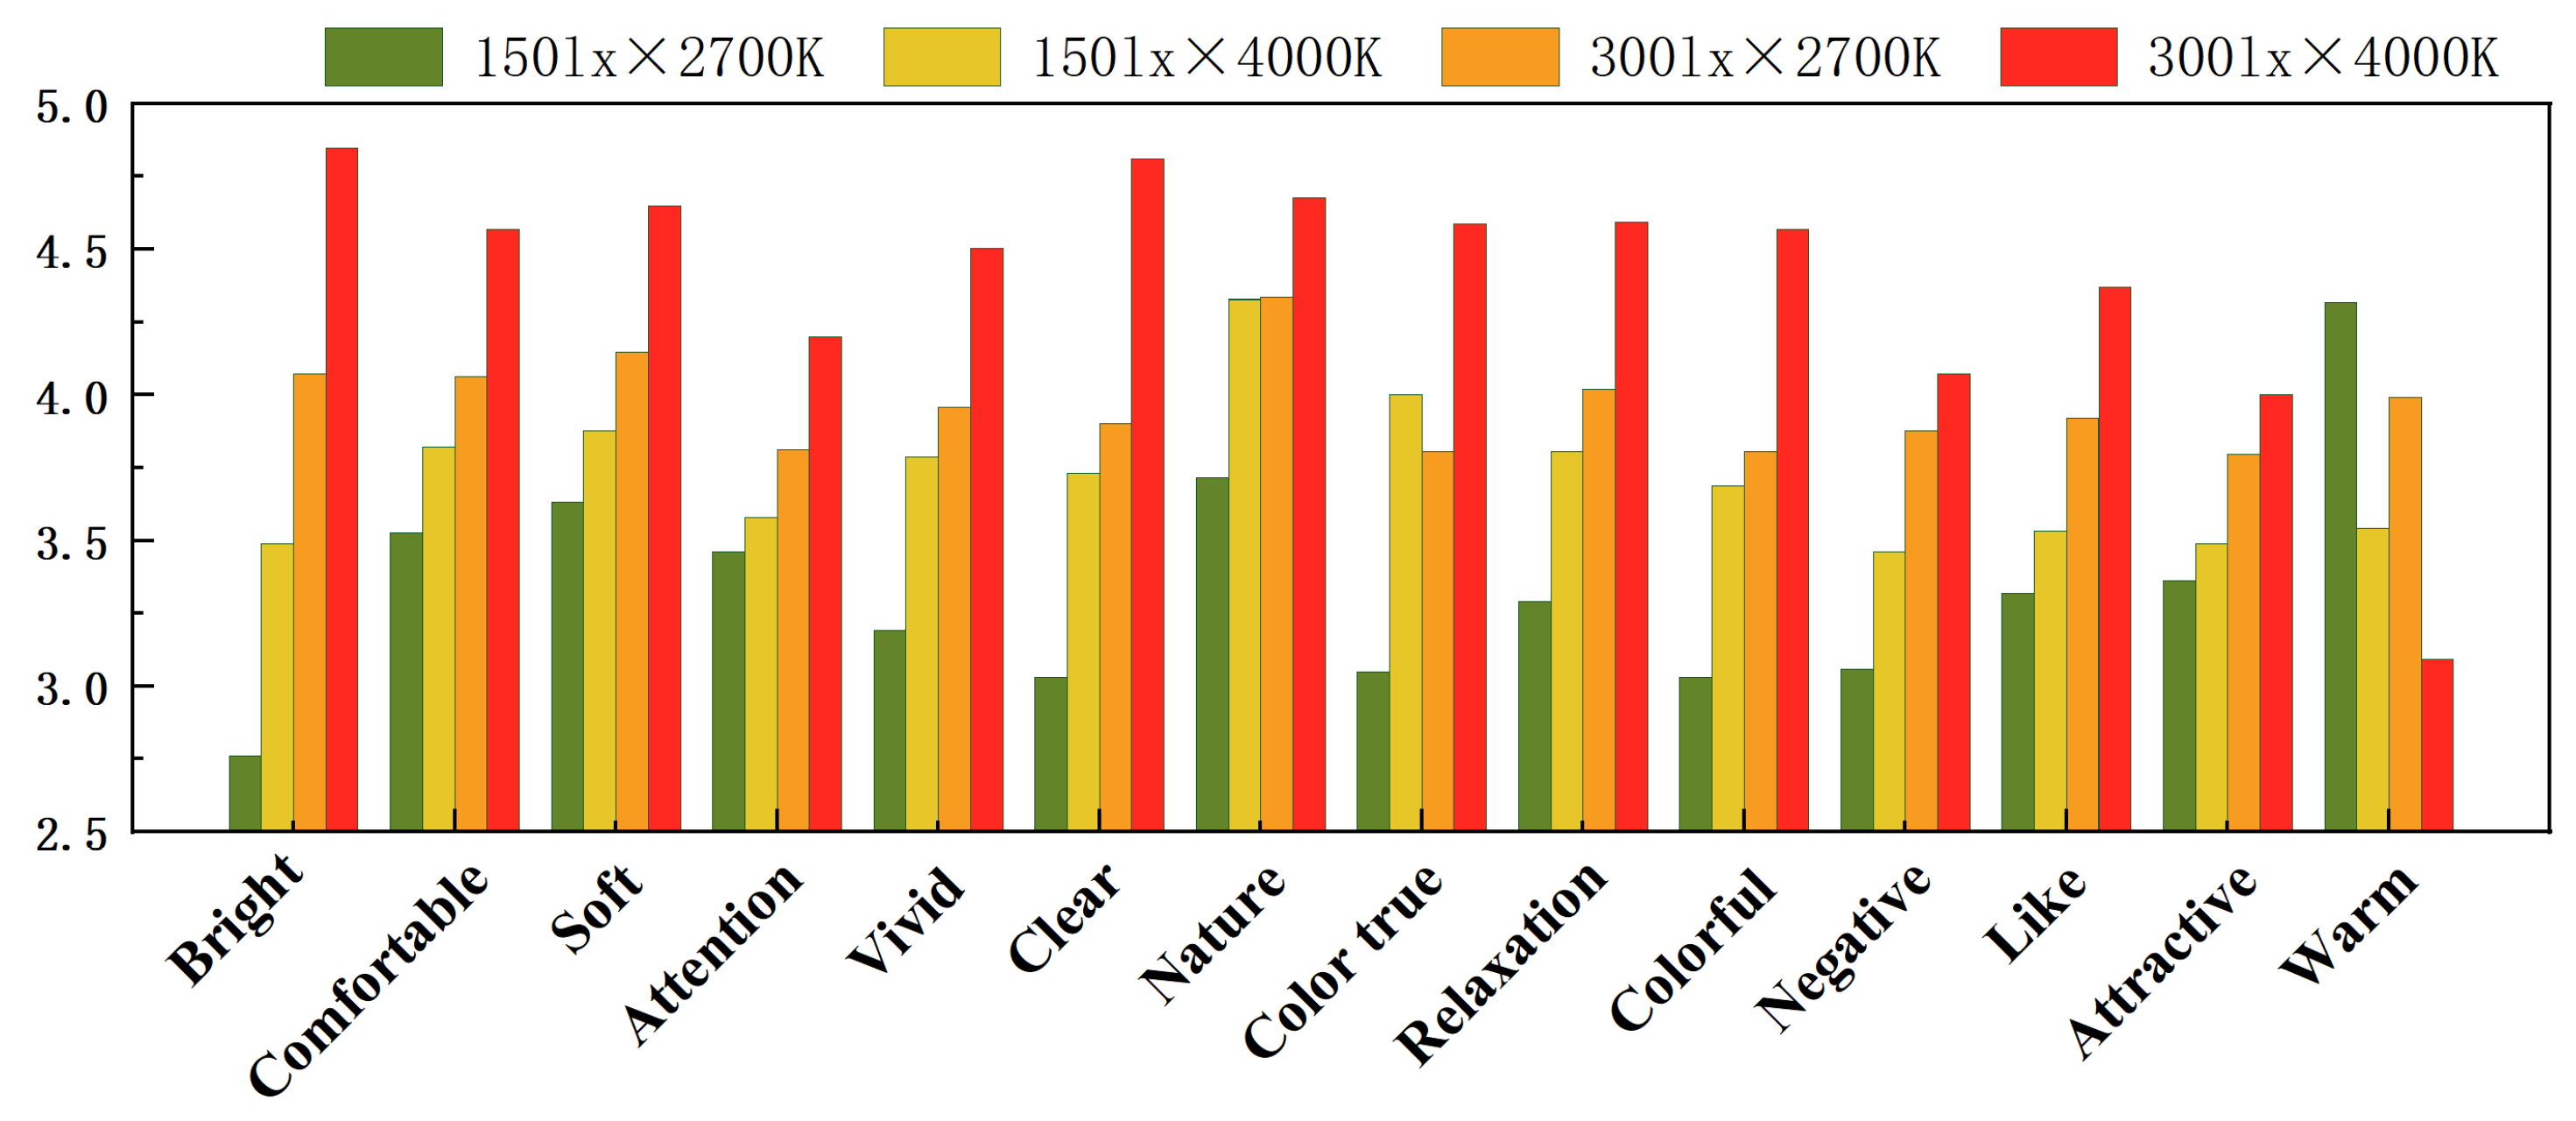
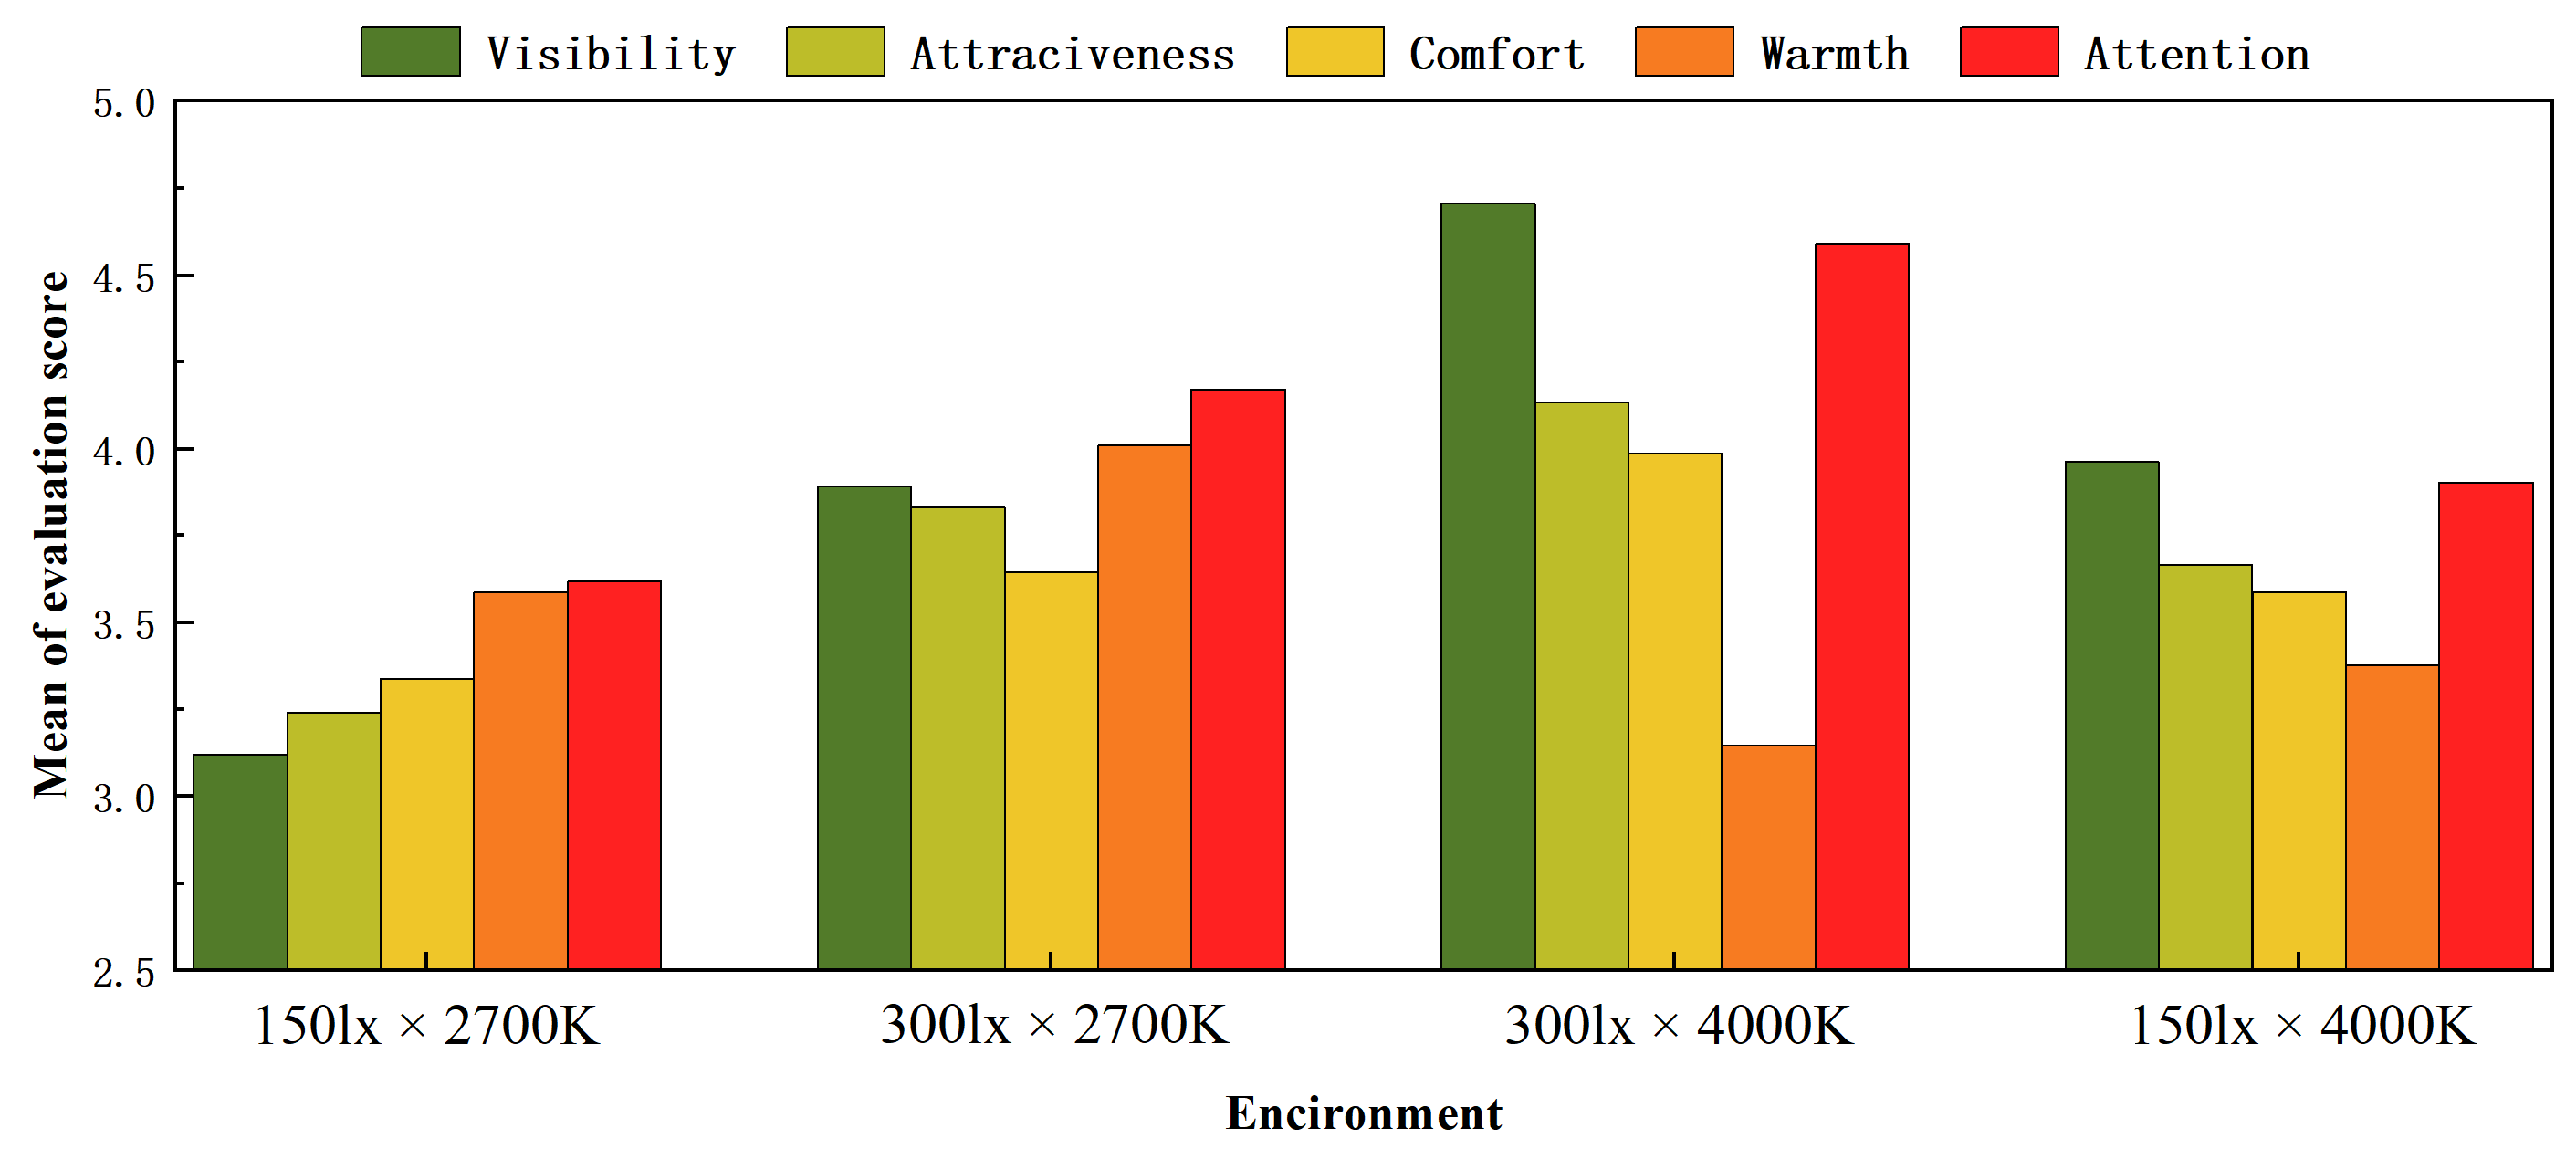
4.2. The Influence of Lighting Environment on Perceptual Responses
4.3. Factor Analysis of Emotional and Cognitive Dimensions
4.4. Comfort
4.5. Construction of Subjective and Objective Models
4.6. Qualitative Analysis
In the brighter and whiter light, I was able to focus more easily on the fine details of the painting. It felt like a real museum, and I didn’t get distracted.
The soft, warm light reminded me of home. I wasn’t thinking too much—I just enjoyed looking at the painting in a quiet mood.
I felt emotionally connected to the brushwork and composition, especially under warmer light. It was easier to appreciate the artistic meaning and the rhythm of the ink.
I was more curious about how the light was set up than the painting itself. The environment was interesting, but I didn’t think too much about the artwork.
5. Discussion
5.1. The Theoretical and Practical Significance of This Research
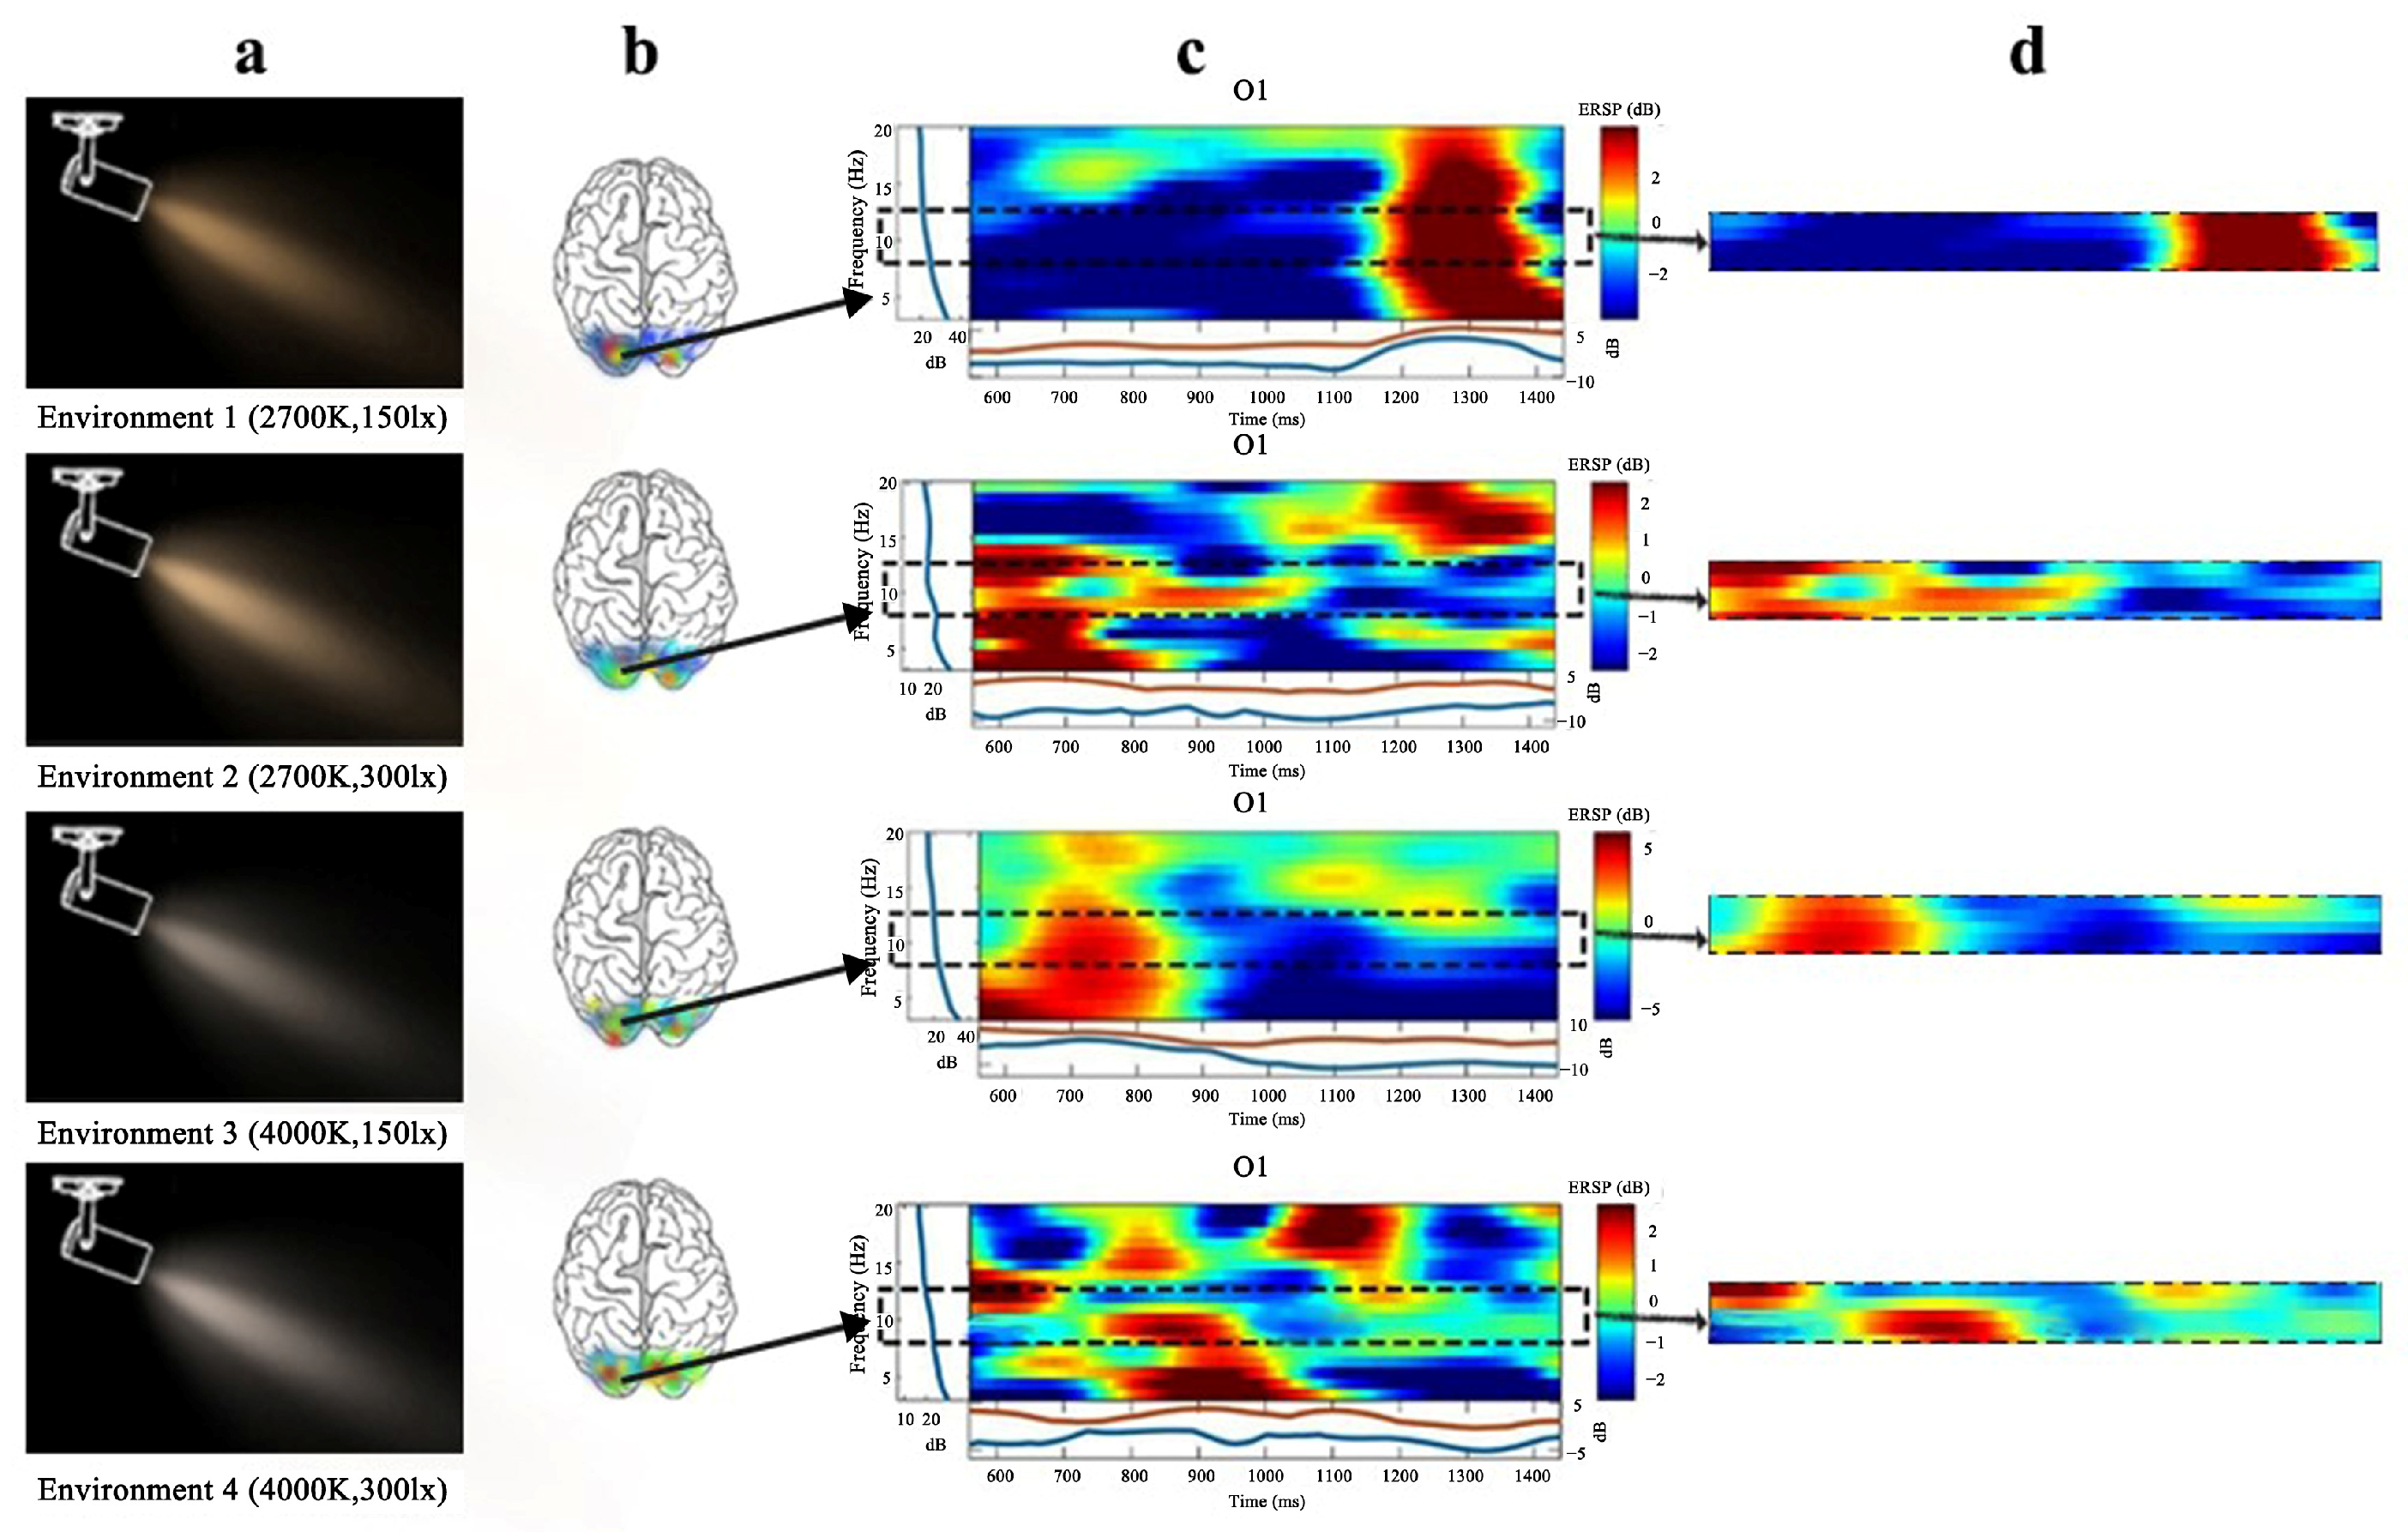
5.2. Subjective Perception and Neural Mechanisms
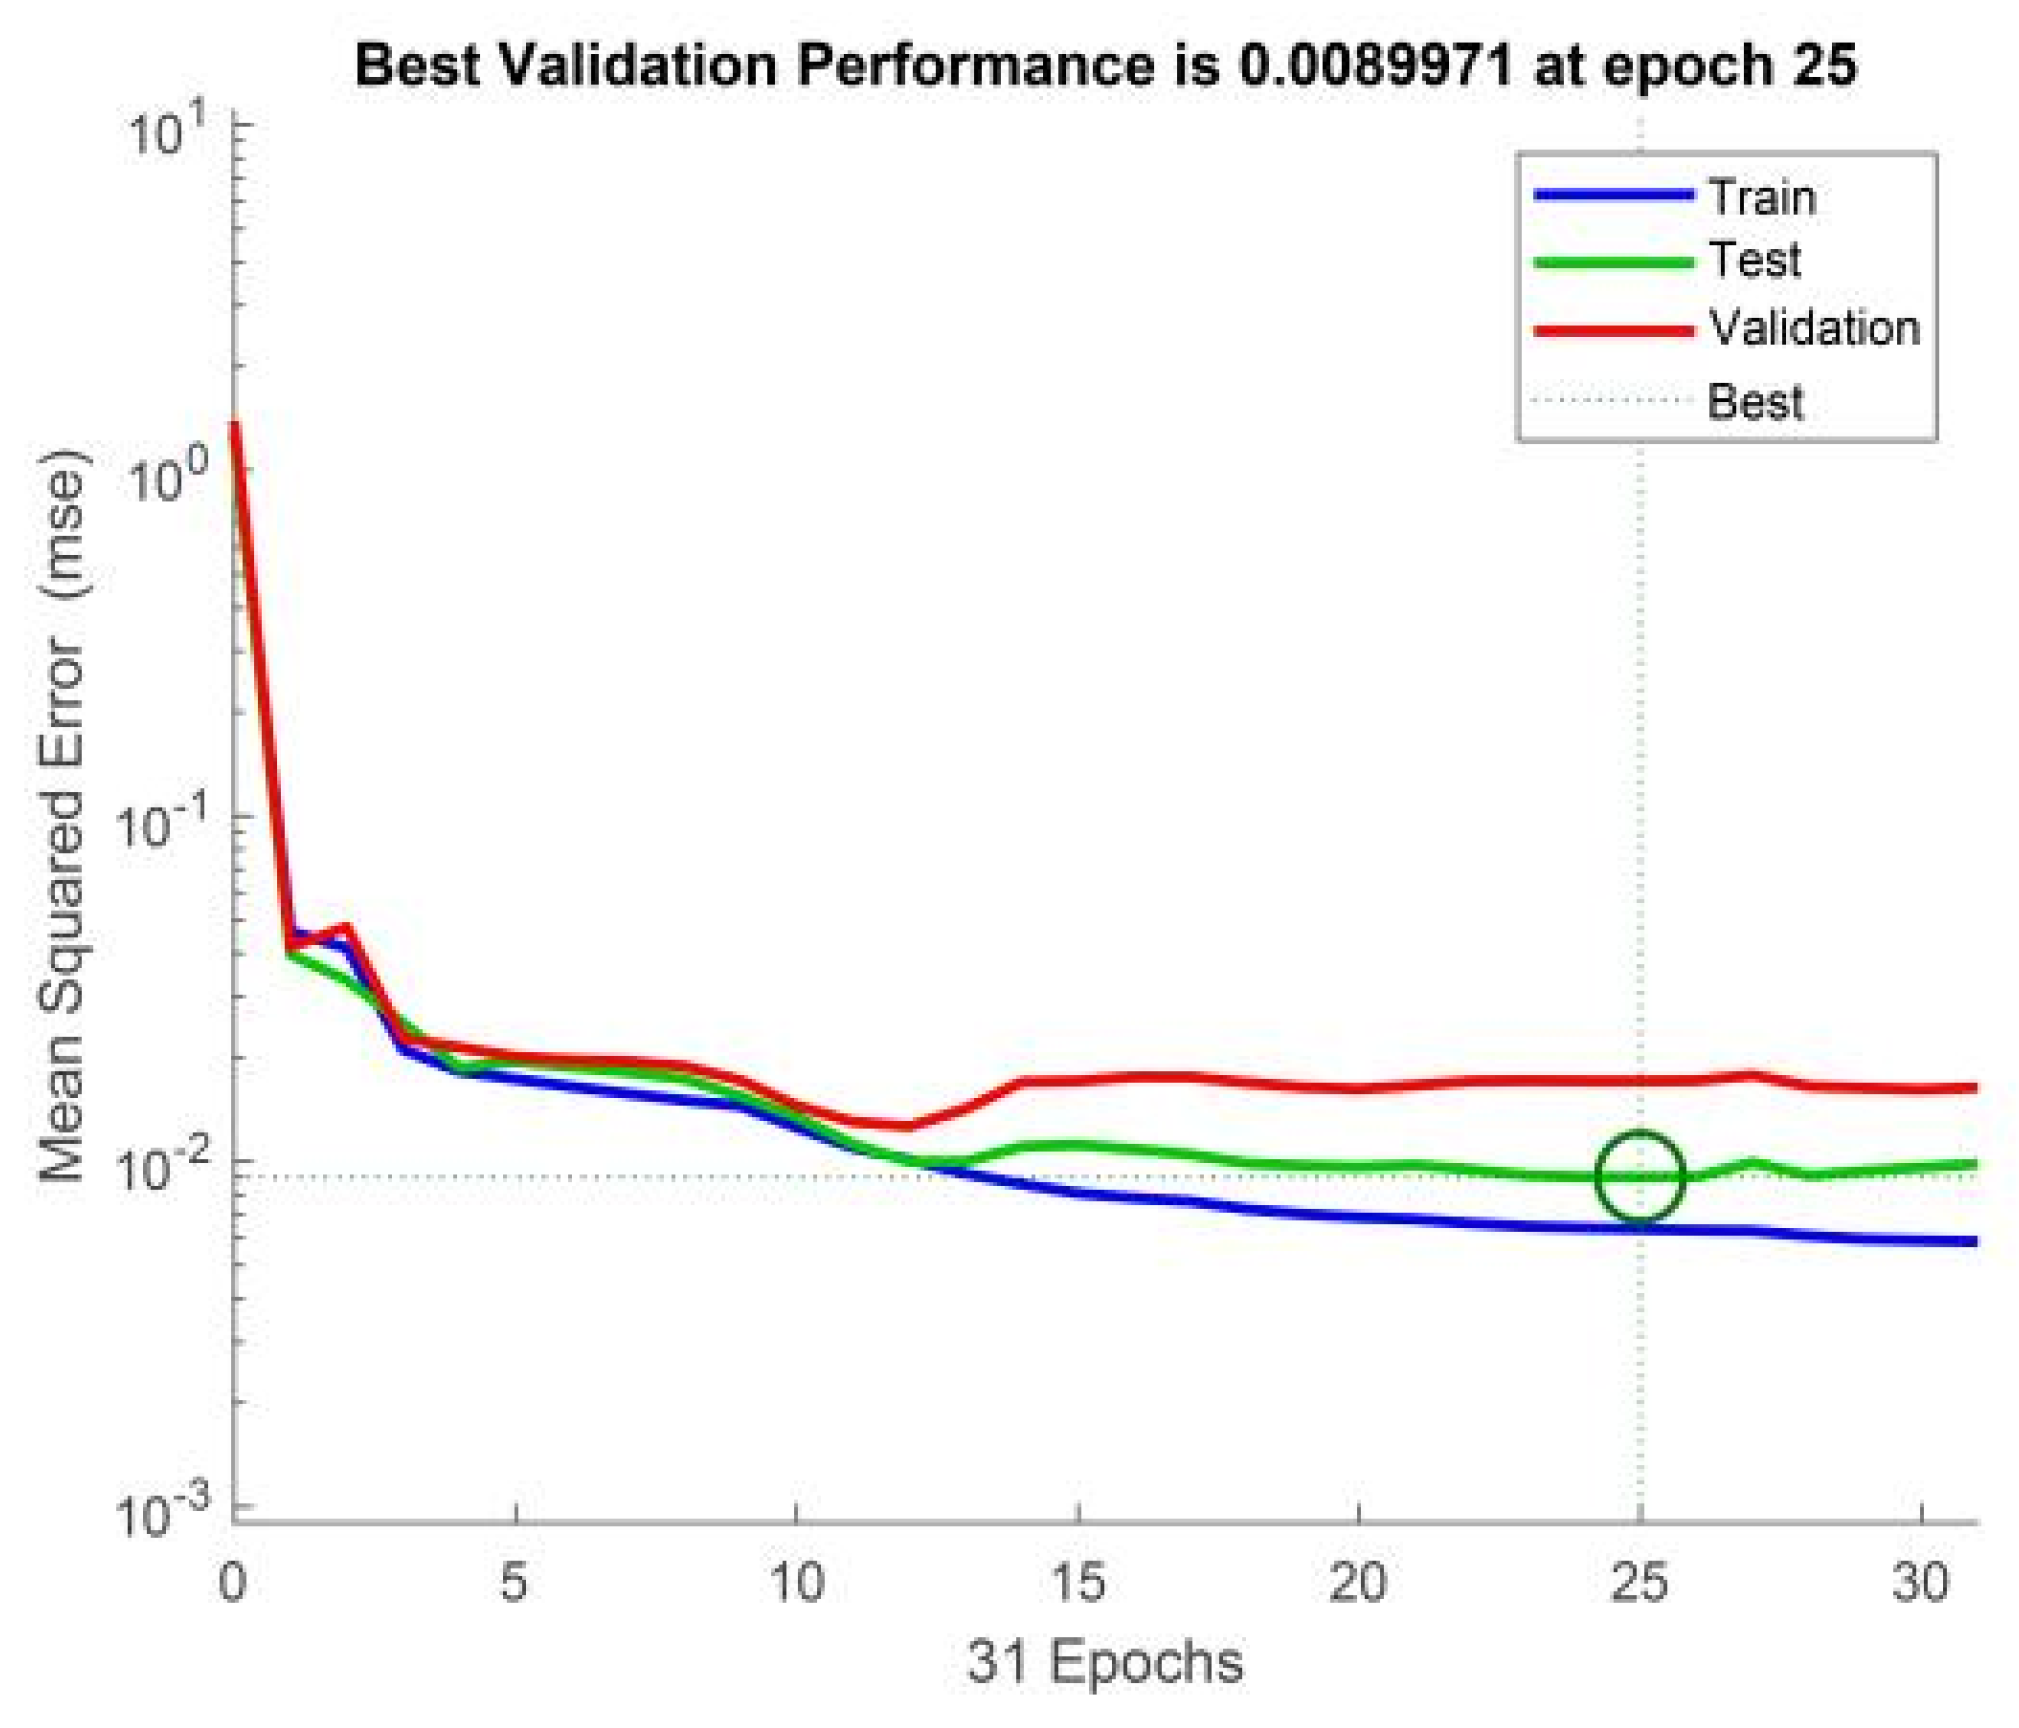
5.3. The Value and Potential of the Prediction Model
5.4. Limitations and Future Directions
6. Conclusions
Author Contributions
Funding
Institutional Review Board Statement
Informed Consent Statement
Data Availability Statement
Acknowledgments
Conflicts of Interest
Abbreviations
| EEG | Electroencephalogram |
| BP | Back-Propagation Neural Network |
| XGBoost | eXtreme Gradient Boosting |
| RF | Random Forest |
| LSSVM | Least-Squares Support Vector Machine |
References
- Baron, R.A.; Rea, M.S.; Daniels, S.G. Effects of indoor lighting (illuminance and spectral distribution) on the performance of cognitive tasks and interpersonal behaviors: The potential mediating role of positive affect. Motiv. Emot. 1992, 16, 1–33. [Google Scholar] [CrossRef]
- Girard, J.; Villa, C.; Brémond, R. Modelling the Probability of Discomfort Due to Glare at All Levels: The Case of Outdoor Lighting. LEUKOS 2002, 19, 368–388. [Google Scholar] [CrossRef]
- Dissanayake, E. “Aesthetic Primitives”: Fundamental Biological Elements of a Naturalistic Aesthetics. Aisthesis. Prat. Linguaggi E Saperi Dell’estetico 2015, 8, 6–24. [Google Scholar] [CrossRef]
- Cheng, Z.; Bu, X.; Wang, Q.; Yang, T.; Tu, J. EEG-based emotion recognition using multi-scale dynamic CNN and gated transformer. Sci. Rep. 2024, 14, 31319. [Google Scholar] [CrossRef] [PubMed]
- Scuello, M.; Abramov, I.; Gordon, J.; Weintraub, S. Museum lighting: Optimizing the illuminant. Color Res. Appl. 2004, 29, 121–127. [Google Scholar] [CrossRef]
- Li, Y.; Ru, T.; Chen, Q.; Qian, L.; Luo, X.; Zhou, G. Effects of illuminance and correlated color temperature of indoor light on emotion perception. Sci. Rep. 2021, 11, 14351. [Google Scholar] [CrossRef]
- Knez, I. Effects of indoor lighting on mood and cognition. J. Environ. Psychol. 1995, 15, 39–51. [Google Scholar] [CrossRef]
- Vartanian, O.; Skov, M. Neural correlates of viewing paintings: Evidence from a quantitative meta-analysis of functional magnetic resonance imaging data. Brain Cogn. 2014, 87, 52–56. [Google Scholar] [CrossRef]
- Peng, G.; Ahmad Zahari, Z. Exploring Contemporary Visualization of Traditional Chinese Arts: Relationship Between Calligraphy Elements and Visual Communication Effects. Humanit. Soc. Sci. Lett. 2024, 12, 985–1008. [Google Scholar] [CrossRef]
- Siniscalco, A.; Bellia, L.; Marchesi, L. Teaching Lighting Design for Cultural Heritage in the Digital and Pandemic Era: Experiencing New and Old Techniques. Heritage 2021, 4, 3731–3748. [Google Scholar] [CrossRef]
- Klimesch, W. EEG α and θ oscillations reflect cognitive and memory performance: A review and analysis. Brain Res. Rev. 1999, 29, 169–195. [Google Scholar] [CrossRef] [PubMed]
- Koelstra, S.; Mühl, C.; Soleymani, M.; Lee, J.-S.; Yazdani, A.; Ebrahimi, T.; Pun, T.; Nijholt, A.; Patras, I. DEAP: A database for emotion analysis using physiological signals. IEEE Trans. Affect. Comput. 2012, 3, 18–31. [Google Scholar] [CrossRef]
- Ren, H.; Zheng, Z.; Zhang, J.; Wang, Q.; Wang, Y. Electroencephalography (EEG)-Based Comfort Evaluation of Free-Form and Regular-Form Landscapes in Virtual Reality. Appl. Sci. 2024, 14, 933. [Google Scholar] [CrossRef]
- Dernie, D. Exhibition Design; Laurence King: London, UK, 2006. [Google Scholar]
- Roppola, T. Designing for the Museum Visitor Experience; Rout LEDge: London, UK, 2013. [Google Scholar]
- Kottasz, R. Understanding the Influences of Atmospheric Cues on the Emotional Responses and Behaviors of Museum Visitors. J. Nonprofit Public Sect. Mark. 2011, 16, 95–121. [Google Scholar] [CrossRef]
- Berns, R.S. Designing White-Light LED Lighting for the Display of Art: A Feasibility Study. Color Res. Appl. 2011, 36, 324–334. [Google Scholar] [CrossRef]
- Cuttle, C. Damage to Museum Objects Due to Light Exposure. Light. Res. Technol. 1996, 28, 1–9. [Google Scholar] [CrossRef]
- Kruithof, A.A. Tubular Luminescence Lamps for General Illumination. Philips Technol. Rev. 1941, 6, 65–96. [Google Scholar]
- Hurlbert, A.; Cuttle, C. New museum lighting for people and paintings. Leukos 2020, 16, 1–5. [Google Scholar] [CrossRef]
- Rea, M.S.; Figueiro, M.G. Light as a circadian stimulus for architectural lighting. Light. Res. Technol. 2018, 50, 497–510. [Google Scholar] [CrossRef]
- Richardson, E.; Woolley, E.; Yurchenko, A.; Thickett, D. Assessing the impact of LED lighting on the stability of selected yellow paint formulations. Leukos 2019, 16, 67–85. [Google Scholar] [CrossRef]
- Schielke, T. Interpreting art with light: Museum lighting between objectivity and hyperrealism. Leukos 2019, 16, 7–24. [Google Scholar] [CrossRef]
- Vienot, F.; Durand, M.L.; Mahler, E. Kruithof’s Rule Revisited Using LED Illumination. J. Mod. Opt. 2009, 56, 1433–1446. [Google Scholar] [CrossRef]
- Bao, J.; Song, X.; Li, Y.; Li, D.; Wang, X. Effect of lighting illuminance and colour temperature on mental workload in an office setting. Sci. Rep. 2021, 11, 15284. [Google Scholar] [CrossRef] [PubMed]
- Chen, H.S.; Chou, C.J.; Luo, H.W.; Luo, M.R. Museum Lighting Environment: Designing a Perception Zone Map and Emotional Response Models. Light. Res. Technol. 2016, 48, 589–607. [Google Scholar] [CrossRef]
- Zhao, G.Z.; Song, J.J.; Ge, Y.; Liu, Y.; Yao, L.; Wen, T. Advances in Emotion Recognition Based on Physiological Big Data. J. Comput. Res. Dev. 2016, 53, 80–92. [Google Scholar]
- Boyce, P. Illumination. In Handbook of Human Factors and Ergonomics; Salvendy, G., Ed.; John Wiley & Sons, Inc.: Hoboken, NJ, USA, 2006; pp. 643–669. [Google Scholar]
- Wang, Y.; Qin, Y.; Guo, Z. Research on EEG Voltage Changes Based on Light Stimulation at Different Flicker Frequencies. Chin. J. Med. Phys. 2014, 31, 5184–5187. [Google Scholar]
- Busch, N.A.; Debener, S.; Kranczioch, C.; Engel, A.K.; Herrmann, C.S. Size Matters: Effects of Stimulus Size, Duration and Eccentricity on the Visual Gamma-Band Response. Clin. Neurophysiol. 2004, 115, 1810–1820. [Google Scholar] [CrossRef]
- Johannes, S.; Munte, T.F.; Heinze, H.J.; Mangun, G.R. Luminance and Spatial Attention Effects on Early Visual Processing. Brain Res. Cogn. Brain Res. 1995, 2, 189–205. [Google Scholar] [CrossRef]
- Shieh, K.K.; Chen, M.H. Effects of Display Medium and Luminance Contrast on Concept Formation and EEG Response. Percept. Mot. Ski. 2005, 100, 943–954. [Google Scholar] [CrossRef]
- Mathes, B.; Fahle, M. The Electrophysiological Correlate of Contour Integration Is Similar for Color and Luminance Mechanisms. Psychophysiology 2004, 41, 620–625. [Google Scholar] [CrossRef]
- Boon, M.Y.; Chan, K.Y.; Chiang, J.; Milston, R.; Suttle, C. EEG A Rhythms and Transient Chromatic and Achromatic Pattern Visual Evoked Potentials in Children and Adults. Doc. Ophthalmol. 2011, 122, 99–113. [Google Scholar] [CrossRef] [PubMed]
- Momose, K. Determination of the Chromatic Contrast Responses Using Wavelet Analysis of Visual Evoked Potentials. In Proceedings of the IEEE Engineering in Medicine and Biology 27th Annual Conference, Shanghai, China, 31 September 2005. [Google Scholar] [CrossRef]
- Noguchi, H.; Sakaguchi, T. Effect of Illuminance and Color Temperature on Lowering of Physiological Activity. Appl. Hum. Sci. 1999, 18, 117–123. [Google Scholar] [CrossRef] [PubMed]
- Lin, C.; Lin, K.; Ko, L.; Liang, S.-F.; Kuo, B.-C.; Chung, I.-F. Nonparametric Single-Trial EEG Feature Extraction and Classification of Driver’s Cognitive Responses. EURASIP J. Adv. Sig Process. 2008, 2008, 849040. [Google Scholar] [CrossRef]
- Resalat, S.N.; Saba, V. A practical method for driver sleepiness detection by processing the EEG signals stimulated with external flickering light. Signal Image Video Process. 2015, 9, 1751–1757. [Google Scholar] [CrossRef]
- Deng, M.; Wang, X.; Menassa, C.C. Measurement and prediction of work engagement under different indoor lighting conditions using physiological sensing. Build. Environ. 2021, 203, 108098. [Google Scholar] [CrossRef]
- Byoung, K.M.; Young, C.J.; Eosu, K.; Jin, Y.P. Bright Illumination Reduces Parietal EEG A Activity During a Sustained Attention Task. Brain Res. 2013, 1538, 83–92. [Google Scholar]
- Dockree, P.M.; Kelly, S.P.; Foxe, J.J.; Reilly, R.B.; Robertson, I.H. Optimal Sustained Attention Is Linked to the Spectral Content of Background EEG Activity: Greater Ongoing Tonic A (Approximately 10 Hz) Power Supports Successful Phasic Goal Activation. Eur. J. Neurosci. 2007, 25, 900–907. [Google Scholar] [CrossRef]
- Yoto, A.; Katsuura, T.; Iwanaga, K.; Shimomura, Y. Effects of Object Color Stimuli on Human Brain Activities in Perception and Attention Referred to EEG A Band Response. J. Physiol. Anthropol. 2007, 26, 373–379. [Google Scholar] [CrossRef]
- Maher, A.M.; Kirkup, L.; Swift, P.; Martin, D.; Searle, A.; Tran, Y.; Craig, A. Effect of Luminance Level on Electroencephalogram A-Wave Synchronization. Med. Biol. Eng. Comput. 2001, 39, 672–677. [Google Scholar] [CrossRef]
- Kurki, H.K.; Ginter, J.K.; Stock, J.T.; Pfeiffer, S. Body size estimation of small-bodied humans: Applicability of current methods. Am. J. Phys. Anthropol. 2010, 141, 169–180. [Google Scholar] [CrossRef]
- Elkadi, H.; Al-Maiyah, S.; Fielder, K.; Kenawy, I.; Martinson, D.B. The regulations and reality of indoor environmental standards for objects and visitors in museums. Renew. Sustain. Energ. Rev. 2021, 152, 111653. [Google Scholar] [CrossRef]
- Kozaki, T.; Koga, T.; Kato, T. The effect of luminance level on visual performance during exposure to high dynamic range images. Displays 2018, 52, 52–58. [Google Scholar]
- Shi, J.; Zhang, N.; Wang, W.; Zhang, M.; Cai, G.; Gao, W. The effect of the preferred illuminance on dynamic features of the brain activity during reading. J. Build. Eng. 2025, 103, 112064. [Google Scholar] [CrossRef]
- Luo, H.W.; Chou, C.-J.; Chen, H.-S.; Luo, M.R. Museum lighting with LEDs: Evaluation of lighting damage to contemporary photographic materials. Light. Res. Technol. 2019, 51, 417–431. [Google Scholar] [CrossRef]
- Park, J.Y.; Min, B.; Jung, Y.; Pak, H.; Jeong, Y.-H.; Kim, E. Illumination influences working memory: An EEG study. Neuroscience 2013, 247, 386–394. [Google Scholar] [CrossRef] [PubMed]
- Felix, C.; Iain, D.G.; Danae, S.F. EEG Functional Connectivity, Heartrate Synchrony, and Eye Movements Reveal Distinct Components Within Narrative Engagement and Immersion. J. Cogn. Neurosci. 2025, 1–22. [Google Scholar] [CrossRef]
- Gao, H.; Wang, Z.; Zhu, D.; Zhang, C.; Zou, N. Research on the influence of lighting mode and CCT on the lighting design of art museum based on subjective experiment. AIP Adv. 2020, 10, 125024. [Google Scholar] [CrossRef]
- Yu, N.; Lv, Y.; Liu, X.; Jiang, S.; Xie, H.; Zhang, X.; Xu, K. Impact of Correlated Color Temperature on Visitors’ Perception and Preference in Virtual Reality Museum Exhibitions. Int. J. Environ. Res. Public Health 2023, 20, 2811. [Google Scholar] [CrossRef]
- Zhou, A.; Pan, Y. Effects of indoor lighting environments on paper reading efficiency and brain fatigue: An experimental study. Front. Built. Environ. 2023, 9, 1303028. [Google Scholar] [CrossRef]
- Shin, Y.; Woo, S.; Kim, D.; Kim, J.; Kim, J.-J.; Park, J.Y. The effect on emotions and brain activity by the direct/indirect lighting in the residential environment. Neurosci. Lett. 2015, 584, 28–32. [Google Scholar] [CrossRef]
- Llinares, C.; Castilla, N.; Higuera-Trujillo, J.L. Do Attention and Memory Tasks Require the Same Lighting? A Study in University Classrooms. Sustainability 2021, 13, 8374. [Google Scholar] [CrossRef]
- Peng, Y.; Lin, Y.; Fan, C.; Xu, Q.; Xu, D.; Yi, S.; Zhang, H.; Wang, K. Passenger overall comfort in high-speed railway environments based on EEG: Assessment and degradation mechanism. Build. Environ. 2022, 210, 108711. [Google Scholar] [CrossRef]


| Illumination (lx) | 2700 k, 150 lx | 2700 k, 300 lx | 4000 k, 150 lx | 4000 k, 300 lx |
|---|---|---|---|---|
| 1 | 113.5 | 255.7 | 132.5 | 239.7 |
| 2 | 125.0 | 319.9 | 132.9 | 238.1 |
| 3 | 151.6 | 309.3 | 167.8 | 312.4 |
| 4 | 134.8 | 265.7 | 146.0 | 270.3 |
| 5 | 136.4 | 280.8 | 151.1 | 271.5 |
| Illuminance uniformity | 0.858158 | 0.893182 | 0.907161 | 0.893769 |
| No. | Negative Words–Positive Words | Scores | Categories |
|---|---|---|---|
| 1 | Bright/dark | 6–1 | Appearance |
| 2 | Clear/fuzzy | 6–1 | |
| 3 | Natural/unnatural | 6–1 | |
| 4 | Color true/unreal | 6–1 | |
| 5 | Vivid/not vivid | 6–1 | |
| 6 | Warm/cold | 6–1 | |
| 7 | Colorful/monotone | 6–1 | |
| 8 | Comfortable/uncomfortable | 6–1 | perception |
| 9 | Nervousness/relaxation | 6–1 | |
| 10 | inattention/attention | 6–1 | |
| 11 | Negative/positive | 6–1 | |
| 12 | Dazzling/soft | 6–1 | |
| 13 | Like/dislike | 6–1 | |
| 14 | Attractive/unattractive | 6–1 |
| Engineering | Art | t | p | |
|---|---|---|---|---|
| M ± SD | M ± SD | |||
| Bright/dark | 3.76 ± 1.038 | 3.83 ± 0.994 | −0.381 | 0.704 |
| Comfortable/uncomfortable | 4.04 ± 0.953 | 4.08 ± 0.671 | −0.271 | 0.787 |
| Dazzling/soft | 4.00 ± 0.977 | 4.17 ± 0.763 | −1.484 | 0.140 |
| attention/inattention | 3.88 ± 0.923 | 3.38 ± 0.904 | 3.083 | 0.003 |
| Vivid/not vivid | 3.93 ± 0.886 | 3.80 ± 0.777 | 0.853 | 0.395 |
| Clear/fuzzy | 3.9 ± 0.872 | 3.75 ± 0.895 | 1.504 | 0.135 |
| Nature/unnatural | 4.29 ± 0.774 | 4.22 ± 0.691 | 0.594 | 0.554 |
| Color true/unreal | 3.97 ± 0.930 | 3.83 ± 0.924 | 0.558 | 0.405 |
| Nervousness/relaxation | 4.16 ± 0.840 | 3.88 ± 0.885 | 1.826 | 0.07 |
| Colorful/monotone | 3.82 ± 0.961 | 3.70 ± 0.869 | 0.758 | 0.449 |
| Negative/positive | 3.50 ± 0.954 | 3.73 ± 0.899 | −1.418 | 0.159 |
| Like/dislike | 3.69 ± 1.040 | 3.88 ± 1.010 | −1.057 | 0.292 |
| Attractive/unattractive | 3.60 ± 0.979 | 3.73 ± 0.918 | −0.774 | 0.44 |
| Warm/cold | 3.59 ± 1.136 | 3.57 ± 0.929 | 0.657 | 0.512 |
| 0 | 1 (39.78%) | 2 (11.26%) | 3 (8.24%) | 4 (7.34%) | 5 (6.02%) |
|---|---|---|---|---|---|
| Meaning | Visibility | Attractiveness | Comfort | Warm | Attention |
| Bright | 0.711 | 0.240 | 0.176 | 0.210 | −0.172 |
| Vivid | 0.656 | 0.151 | 0.327 | 0.299 | −0.022 |
| Clear | 0.776 | 0.215 | 0.071 | 0.217 | 0.008 |
| Nature | 0.738 | 0.044 | −0.028 | −0.009 | 0.257 |
| Lively | 0.794 | 0.221 | 0.051 | −0.117 | 0.142 |
| Colorful | 0.689 | 0.368 | 0.138 | 0.121 | 0.067 |
| Active | 0.355 | 0.673 | 0.249 | 0.064 | −0.170 |
| Favorite | 0.297 | 0.781 | 0.338 | 0.047 | −0.006 |
| Attractive | 0.147 | 0.892 | −0.008 | 0.055 | 0.079 |
| Comfort | 0.489 | 0.246 | 0.698 | −0.084 | −0.035 |
| Soft | 0.231 | 0.138 | 0.799 | −0.114 | −0.116 |
| Relax | −0.206 | 0.098 | 0.658 | 0.202 | 0.285 |
| Warm | 0.210 | 0.083 | −0.031 | 0.898 | 0.089 |
| Attentive | 0.210 | 0.083 | −0.031 | 0.898 | 0.089 |
| Engineering | Art | t | p | |
|---|---|---|---|---|
| M ± SD | M ± SD | |||
| α power | 0.2498 ± 0.08416 | 0.2797 ± 0.6603 | 2.068 | 0.043 |
| 2700 k × 150 lx | 2700 k × 300 lx | 4000 k × 150 lx | 4000 k × 300 lx | F | p | |
|---|---|---|---|---|---|---|
| M ± SD | M ± SD | M ± SD | M ± SD | |||
| α power | 0.1967 ± 0.0284 | 0.2701 ± 0.3522 | 0.2534 ± 0.3013 | 0.3402 ± 0.484 | 42.32 | 0.00 |
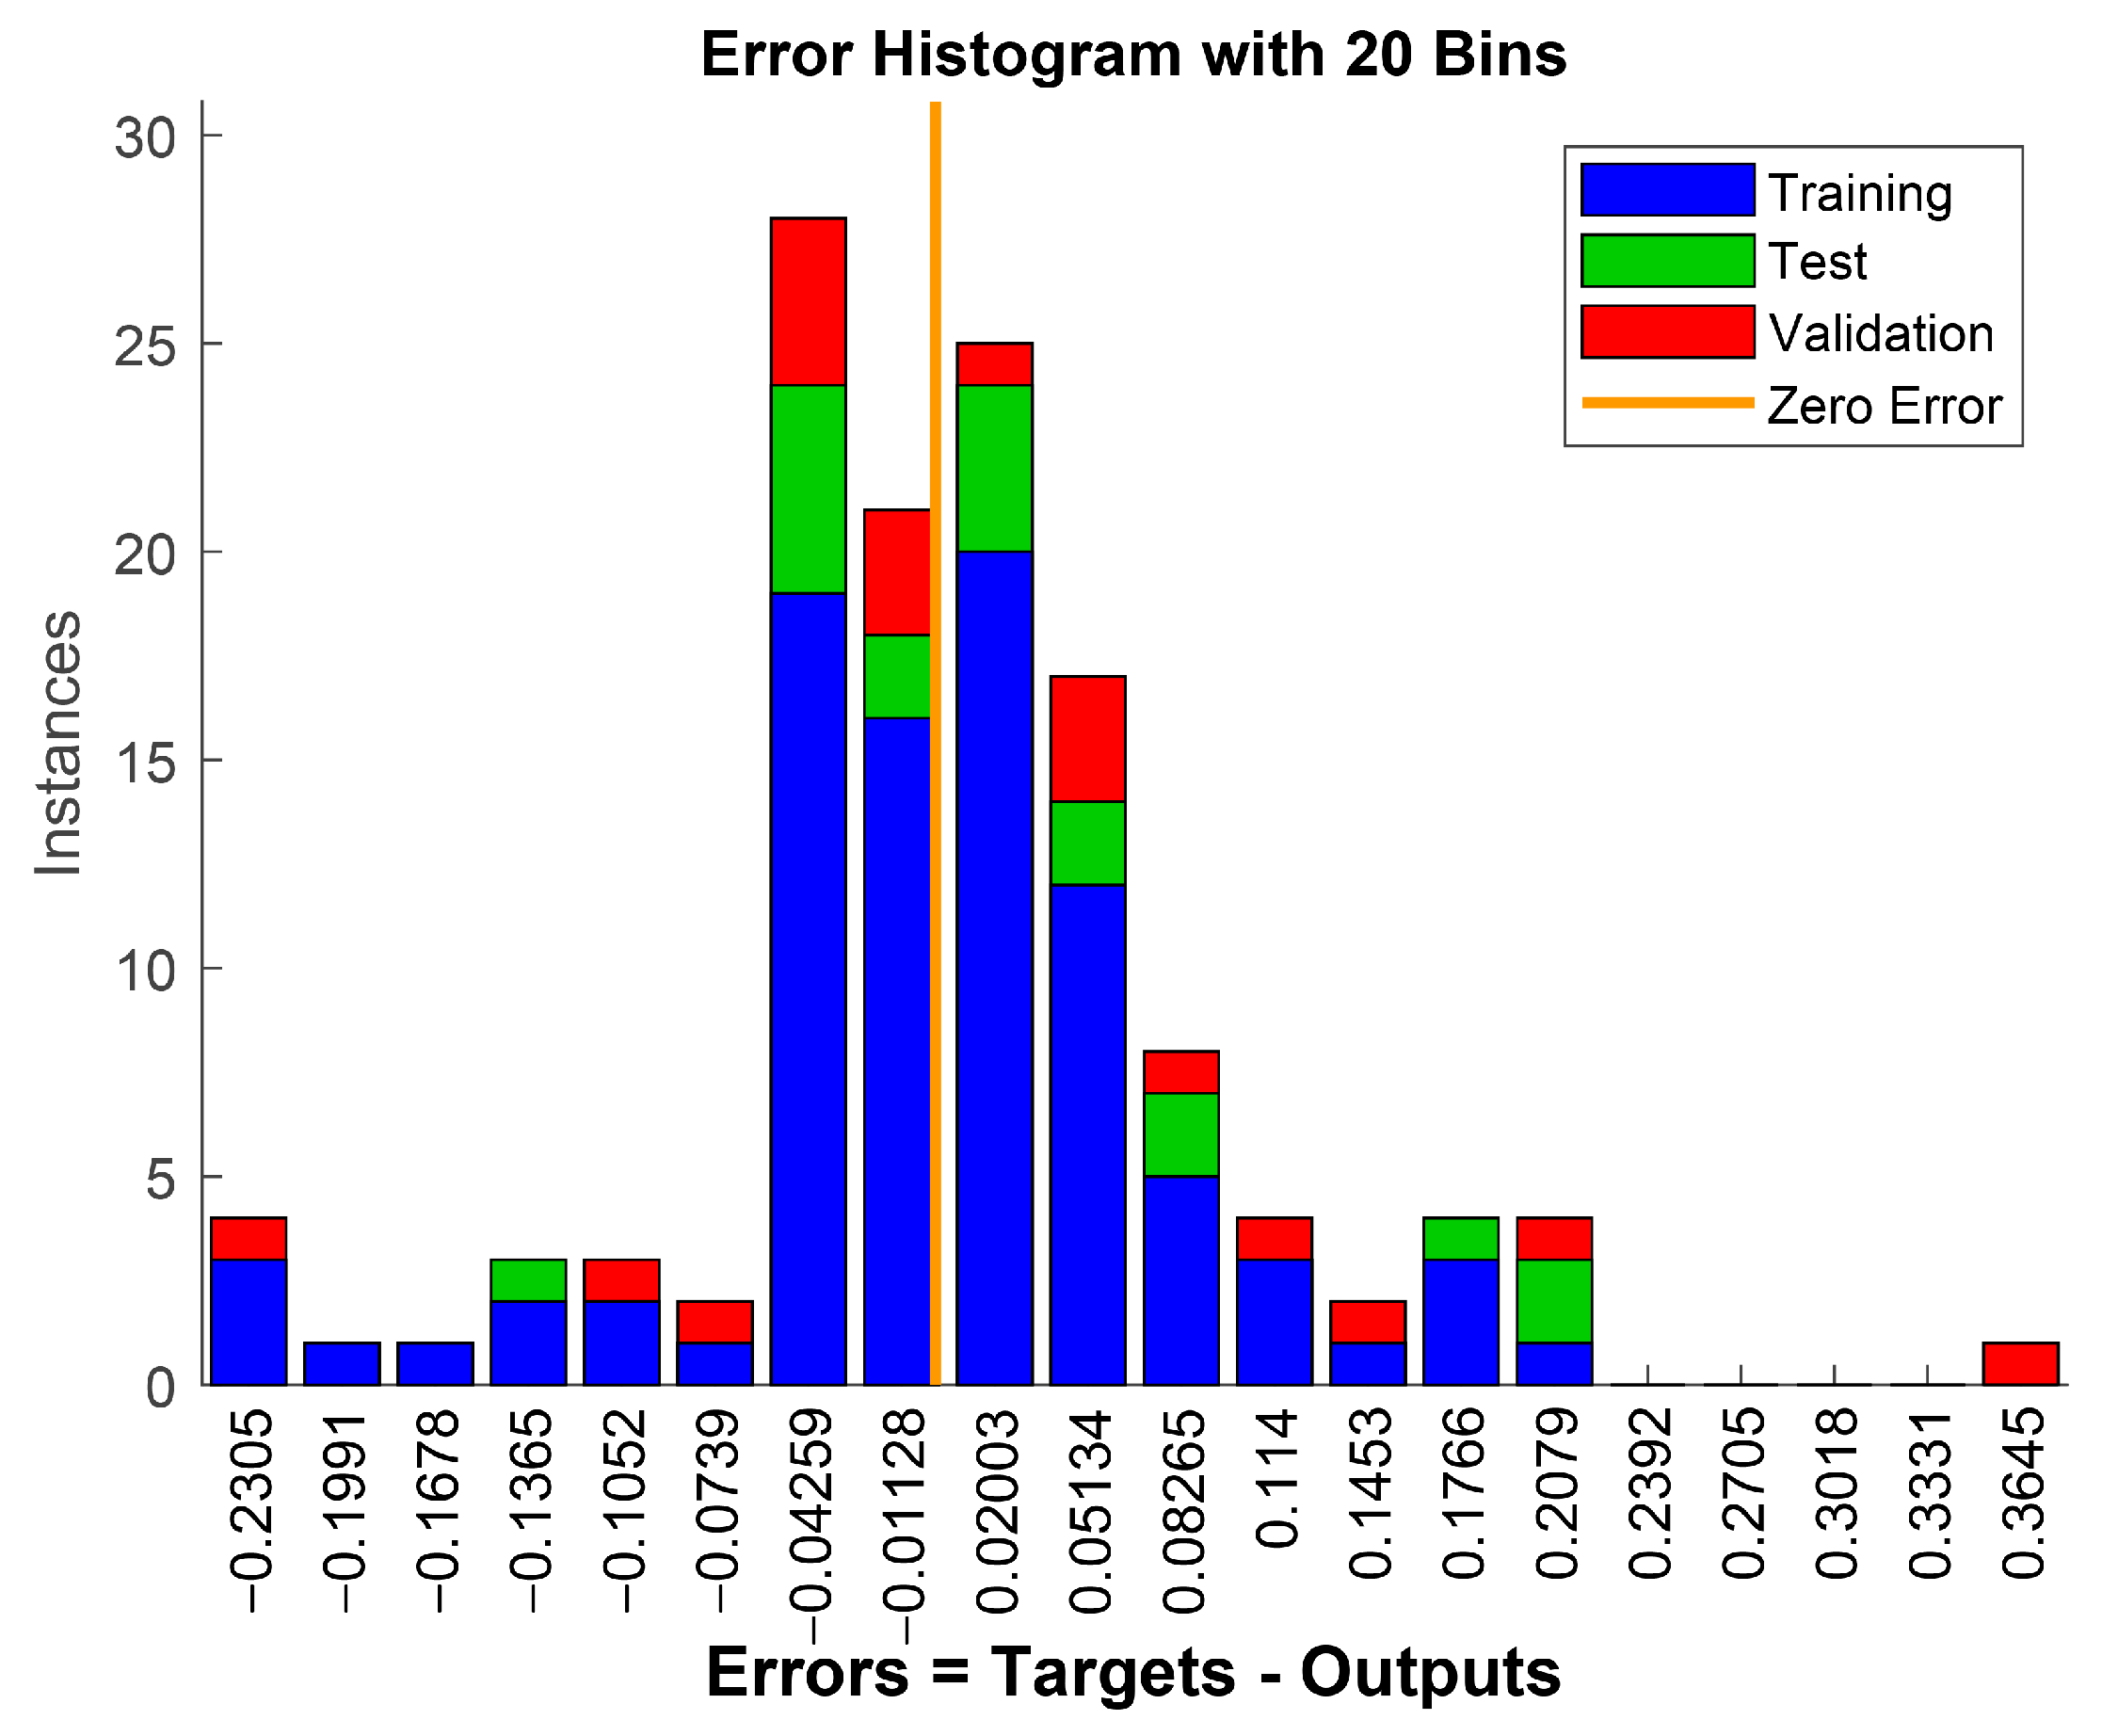
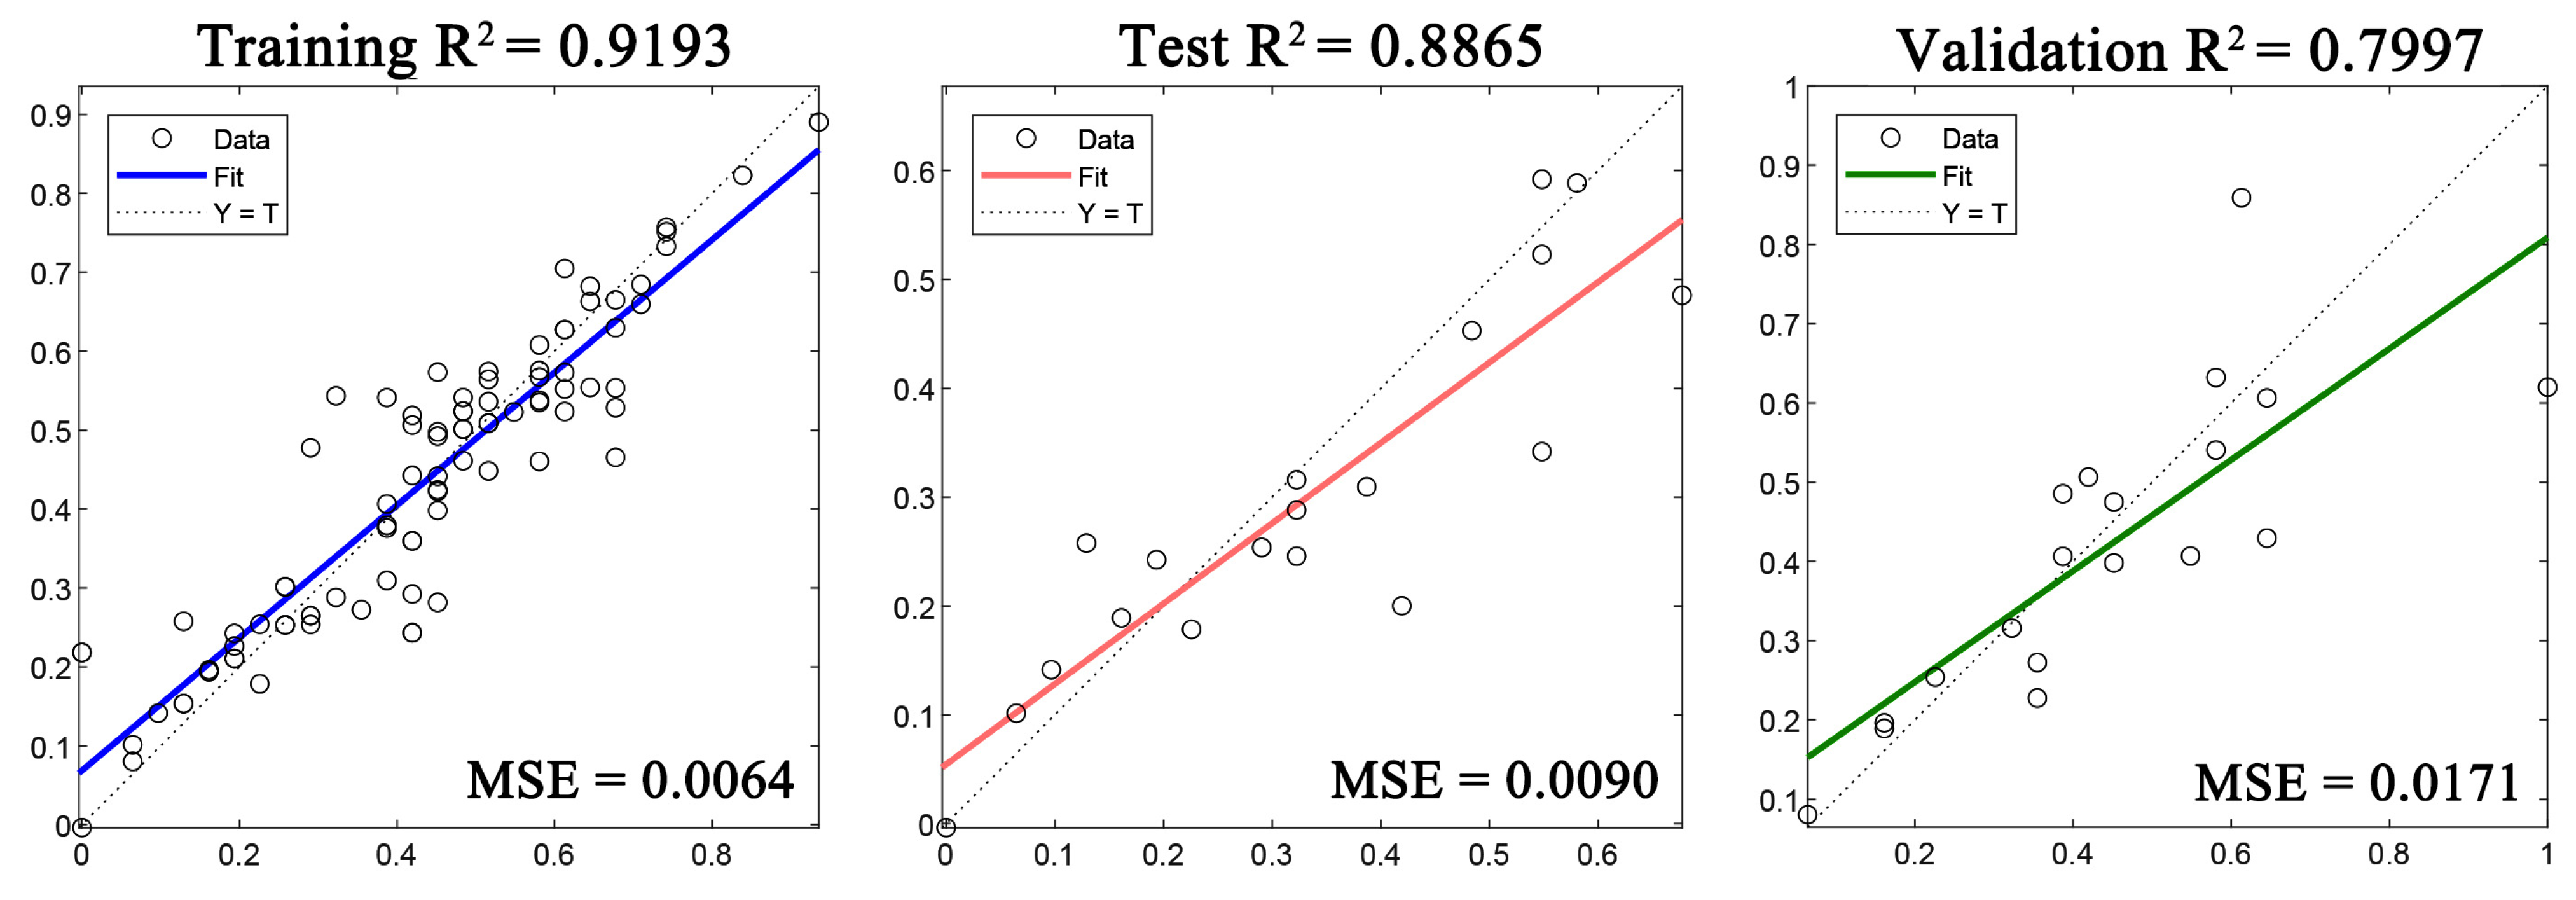
| Model | Subset | R2 | MAE | MSE |
|---|---|---|---|---|
| BP | Training Set | 0.9193 | 0.0638 | 0.080 |
| Test Set | 0.8862 | 0.0758 | 0.095 | |
| Validation Set | 0.7997 | 0.1045 | 0.131 | |
| RF | Training Set | 0.9059 | 0.0632 | 0.0945 |
| Test Set | 0.8055 | 0.0828 | 0.1298 | |
| Validation Set | 0.6811 | 0.1496 | 0.2059 | |
| XGBoost | Training Set | 0.9120 | 0.0656 | 0.0988 |
| Test Set | 0.7475 | 0.0804 | 0.1218 | |
| Validation Set | 0.6951 | 0.1000 | 0.1712 | |
| LSSVM | Training Set | 0.8994 | 0.0702 | 0.1023 |
| Test Set | 0.7042 | 0.1242 | 0.1870 | |
| Validation Set | 0.6443 | 0.1338 | 0.2110 |
Disclaimer/Publisher’s Note: The statements, opinions and data contained in all publications are solely those of the individual author(s) and contributor(s) and not of MDPI and/or the editor(s). MDPI and/or the editor(s) disclaim responsibility for any injury to people or property resulting from any ideas, methods, instructions or products referred to in the content. |
© 2025 by the authors. Licensee MDPI, Basel, Switzerland. This article is an open access article distributed under the terms and conditions of the Creative Commons Attribution (CC BY) license (https://creativecommons.org/licenses/by/4.0/).
Share and Cite
Zhao, X.; Wang, Z.; Zhang, T.; Liu, T.; Yu, H.; Wang, H. Impact of Lighting Conditions on Emotional and Neural Responses of International Students in Cultural Exhibition Halls. Buildings 2025, 15, 2507. https://doi.org/10.3390/buildings15142507
Zhao X, Wang Z, Zhang T, Liu T, Yu H, Wang H. Impact of Lighting Conditions on Emotional and Neural Responses of International Students in Cultural Exhibition Halls. Buildings. 2025; 15(14):2507. https://doi.org/10.3390/buildings15142507
Chicago/Turabian StyleZhao, Xinyu, Zhisheng Wang, Tong Zhang, Ting Liu, Hao Yu, and Haotian Wang. 2025. "Impact of Lighting Conditions on Emotional and Neural Responses of International Students in Cultural Exhibition Halls" Buildings 15, no. 14: 2507. https://doi.org/10.3390/buildings15142507
APA StyleZhao, X., Wang, Z., Zhang, T., Liu, T., Yu, H., & Wang, H. (2025). Impact of Lighting Conditions on Emotional and Neural Responses of International Students in Cultural Exhibition Halls. Buildings, 15(14), 2507. https://doi.org/10.3390/buildings15142507