Abstract
The construction industry, particularly in road projects, faces pressing challenges related to environmental sustainability and cost management. As road construction contributes significantly to environmental degradation and demands large-scale investments, there is an urgent need for innovative solutions that balance environmental impact with economic feasibility. Despite advancements in building technologies and energy-efficient materials, accurate and reliable predictions for environmental load and construction costs during the planning and design stages remain limited due to insufficient data systems and complex project variables. This study explores the application of machine-learning techniques to predict environmental loads and construction costs in road projects, using a dataset of 100 national road construction cases in the Republic of Korea. The research employs multiple regression analysis, regression tree models, and case-based reasoning (CBR) to estimate these critical parameters at both the planning and design stages. A novel aspect of this research lies in its comparative analysis of different machine-learning models to address the challenge of limited and non-ideal data environments, offering valuable insights for enhancing predictive accuracy despite data scarcity. The results reveal that while regression models perform better in the design stage, achieving error rates of 12% for environmental load estimation and 23% for construction costs, the case-based reasoning model outperforms others in the planning stage, with a 15.9% average error rate for environmental load and 19.9% for construction costs. These findings highlight the potential of machine-learning techniques to drive environmentally conscious and economically sound decision-making in construction, despite data limitations. However, the study also identifies the need for larger, more diverse datasets and better integration of qualitative data to improve model accuracy, offering a roadmap for future research in sustainable construction management.
1. Introduction
The construction industry plays a significant role in global economic development, but it also faces increasing pressure due to its substantial environmental impact. Road projects, in particular, are notorious for their high levels of energy consumption, greenhouse gas emissions, and resource depletion. As such, it is essential to integrate sustainable practices into the planning and design stages of road construction. However, despite the growing focus on environmental preservation and cost efficiency, the construction industry still grapples with significant challenges related to estimating environmental impacts and costs. Accurate and reliable prediction methods are crucial for decision-makers aiming to minimize environmental degradation while ensuring cost-effective project execution. The need for advanced predictive models that balance these competing objectives has never been greater.
Accurately estimating construction costs for large-scale projects, which require substantial resources, is critical for efficient investment and budget management [1]. Construction projects, due to their complexity, scale, and specialized nature, present more intricate cost structures compared to manufacturing projects, making cost prediction a challenging task [2]. Early-stage cost estimation, using basic project details, is vital as it can help manage costs when potential reductions are higher, although the largest expenditures occur during construction [3]. Historically, public construction projects in the Republic of Korea used detailed models prepared during the design phase for cost estimation; however, this approach has limitations for effective budget management. Cost estimation is crucial for both the government and the construction industry, as efficient cost prediction is necessary for the optimal use of national budgets in public projects and for securing profitable orders in the construction sector [4]. In the Republic of Korea, existing road construction cost models, based on frameworks like the “Road Work Handbook” and “Preliminary Feasibility Study Guidelines,” estimate costs using topographic maps and unit construction costs from similar road designs [5]. However, these models rely on linear predictions based on road length and fail to consider factors like road grade, topography, and regional conditions, leading to limited prediction accuracy. Additionally, averaging construction costs from previous years does not account for the time value of money. The government has also made significant strides in reducing the environmental load in construction, especially in the context of greenhouse gas emissions. The 2009 Framework Act on Low Carbon, Green Growth set a target for reducing emissions by 37% by 2030, and the construction industry, as a major emitter, plays a key role in meeting these goals [6]. Programs like emissions trading and the use of Life Cycle Assessment (LCA) methods have been implemented to help reduce the environmental impact of construction activities, including carbon emissions, pollution, and resource use. The introduction of the Green Building Certification System (G-SEED) has further promoted sustainability in the construction sector, with thousands of buildings certified for their environmental performance.
To address these challenges, the Ministry of Land, Infrastructure, and Transport (MLIT [7]) has designated advanced technologies, including the construction of high-quality SOC (Social Overhead Capital) facilities, renewable energy applications, and environmentally friendly materials, as key national long-term projects to be implemented by 2035. In addition, IoT (Internet of Things) and artificial intelligence (AI) have been identified as core technologies [7]. AI, in particular, aims to simulate human cognitive processes like learning and reasoning, and operates based on machine learning [8,9,10,11,12,13,14,15]. Machine learning, which analyzes large, unstructured, and nonlinear datasets, is the methodology central to this study.
However, a key challenge remains: securing a mature, large-scale database that is critical for machine-learning applications. A survey by the National Information Society Agency (Figure 1) reveals that the absence of necessary data systems and insufficient awareness about the importance of big data hinder the development of a comprehensive big data infrastructure across all industries in the Republic of Korea.
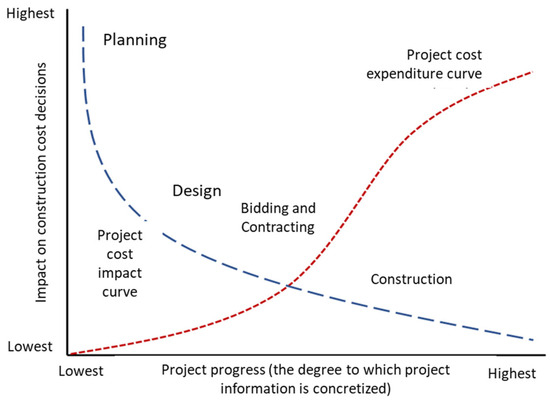
Figure 1.
Project Cost Expenditure and Impact Curve by Construction Project Stage.
To address these barriers and implement the Ministry’s solutions, it is essential to first establish a robust big data environment. However, given the current limitations, there is a pressing need for machine-learning research that can be applied even in less-than-ideal data environments. An estimated budget of 11 trillion won is expected to be invested in cutting-edge technologies for SOC facilities (IBK ERI, 2019), with machine-learning methodologies being compared and analyzed.
Most Life Cycle Assessment (LCA) tools for buildings overlook or inadequately calculate the environmental impacts during the construction phase. While only a few studies address these impacts, some have made strides in this area. Ochoa et al. (2005) assessed the costs and environmental impacts of various construction materials and operations [16]. Sharrard et al. (2008) [17] updated the 1997 I/O Table with 2002 data to reanalyze the work of Ochoa et al. (2005). Guggemos and Horvath (2006) evaluated the impacts of temporary materials and equipment in commercial building construction [18]. Bilec et al. (2010) expanded this by considering not only construction equipment use but also its manufacturing and maintenance [3]. Additionally, Kiani and Nasrollahzadeh (2023) [19] proposed a fuzzy logic model for predicting seismic fragility curves of RC frames, combining decision-tree-based rule extraction with Mamdani fuzzy inference. Using 200 LHS-generated structural models, their method effectively captured uncertainty in damage and construction quality scenarios. This interpretable AI approach aligns with our study’s goal of applying robust models in complex, data-limited construction environments.
To assess the environmental performance of a construction project, the data typically used are the type and quantity of equipment recorded in work logs (Ahn [2]), which are central to most LCA studies (Bilec et al., 2006 [3]; Cass & Mukherjee, 2010 [4]). However, these logs often lack detailed information on equipment efficiency and usage time, limiting the accuracy of environmental evaluations. To address this, this research has been conducted to explore optimal equipment combinations for minimizing environmental impacts.
The primary aim of this study is to bridge this gap by applying machine learning to simultaneously estimate both environmental load and construction costs at the planning and design stages of road projects. This dual focus allows for a comprehensive approach to sustainability in road construction, where both cost and environmental factors are considered in the decision-making process. Moreover, by analyzing the results of various machine-learning models, the research aims to identify the most effective technique for road construction projects in a data-scarce environment. Ultimately, this study seeks to contribute to the development of more accurate, efficient, and sustainable predictive models that can be applied to real-world construction projects, particularly in the context of road development in the Republic of Korea.
This study applies machine learning to estimate environmental load and construction costs during the planning and design stages of road projects, focusing on preliminary capacity assessments, route planning, and design details. Despite using a dataset of only 100 standard road cases, the research aims to identify an effective machine-learning approach to advance cost-effective and environmentally friendly road projects. The environmental load of materials was calculated using a full-cycle evaluation, focusing on earthworks such as excavation, drainage, and paving. A detailed database was created, including process information, quantities, and construction costs. Various machine-learning methods, including multiple regression analysis, regression trees, and case-based reasoning, were used to optimize variable selection using statistical techniques like Mallow’s Cp, BIC, and modified R2. The models were validated against the American Association of Cost Engineers’ acceptable error range of −20% to +30%. While existing research often separates environmental and economic analysis, this study combines both in a machine-learning model capable of estimating environmental load and cost, using minimal data. The findings provide valuable insights for decision-making in road project planning and design, contributing to more sustainable and economically viable construction practices.
2. Database Collection and Analysis
To estimate environmental load and construction costs, data from 100 national road construction projects in the Republic of Korea were collected. The databases for both the planning and design stages were developed by referencing completion reports, project details, and detailed design data for each case.
The planning stage database encompasses a range of key variables pertinent to road construction. These variables include Administrative District, Road Height (m), Road Grade (%), Topography, Design Speed (km/h), Type of Construction, Road Length (m), Road Area (m2), Pavement Thickness (cm), Number of Lanes, and Road Width (m). These parameters define the fundamental characteristics of road construction projects during the planning phase.
The design-stage dataset includes various construction activities and associated materials, each measured in specific units. For earthworks, the volume of operations such as excavation, earth moving, soil ripping, blasting, and ceramic transport are recorded in cubic meters (m3), along with other activities including dump transport, road construction, and land reclamation. Drainage operations are quantified by the lengths of side holes and horizontal drain pipes (m), while the volumes of underground tunnels, VR halls, wing walls, and concrete pouring are also measured in cubic meters (m3). The materials dataset includes items such as the frost protection layer and Ascon packaging, with the frost protection layer recorded in cubic meters (m3) and the Ascon layers—such as understratum, middle layer, and surface—measured in tons (tons). Additionally, formwork, rebar processing and assembly, and ladder worker operations are documented in cubic meters (m3) and tons (tons), respectively, reflecting both the scale and labor involved in these construction processes.
2.1. Planning Stage Database Construction Information
The 100 cases used in this study were selected from actual road construction projects conducted between 2016 and 2021 across different regions of the Republic of Korea. The sample includes both new construction and expansion works, and covers a range of road types—national highways, regional roads, and city arterials. The projects were intentionally chosen to represent geographical and functional diversity, allowing the results to reflect broader trends in Korean road construction practices. Table 1 presents the distribution of these projects across various administrative districts. The distribution is as follows: Gyeonggi-do with 19 cases (19%), Gyeongbuk and Chungnam with 15 cases each (15%), Gyeongnam and Jeonnam with 13 cases each (13%), Jeonbuk with 12 cases (12%), and Chungbuk with 9 cases (9%). Additionally, Gangwon and Jeju had 3 and 1 case(s), respectively.

Table 1.
Administrative district distribution status of collection cases.
Table 2 outlines the distribution of key information related to the planning stage of the collected road projects. The road height distribution is as follows: 41 cases (41%) with a road height between 5 and 10 m, 29 cases (29%) with a road height below 5 m, 22 cases (22%) with a road height between 10 and 15 m, and 8 cases (8%) with a road height above 15 m. In terms of road grade, National Road 2 accounted for 54% of the cases, and 63% of the projects had a design speed of 80 km/h. Regarding construction type, 55% of the projects were new construction, while 45% involved expanded paving.
Table 2.
Status of main design information of collection cases.
The statistical analysis of the collected data reveals that most road projects were characterized by a road height of 10 m or less, were located on National Route 2, had a design speed of 80 km/h, and involved new construction rather than expanded paving.
2.2. Design Phase Database Construction Information
The types of work involved in a road construction project can vary depending on the specific case. However, common tasks typically include earthwork, slope safety work, drainage work, paving work, traffic facility safety work, and auxiliary work. Among these, earthwork, drainage work, and paving work represent over 80% of both the total construction cost and the environmental load. As such, these categories were selected as the primary focus for constructing the design phase database.
In this study, “environmental load” refers to the total environmental impact score derived from the Korean Eco-Indicator system. This composite metric accounts for multiple impact categories, including GHG emissions, material and energy consumption, resource depletion, and pollution (air, water, soil), providing a holistic measure of environmental performance.
The sub-works associated with each work type were compiled into a comprehensive database for analysis. While there is significant potential for developing a high-performing model using all sub-works, this approach is inefficient as it demands considerable time and resources. Moreover, the inclusion of sub-works that do not exhibit a clear linear relationship between environmental load and construction cost may introduce noise into the model, potentially impairing its performance from a machine-learning perspective.
To enhance the efficiency and effectiveness of the model, sub-works that are most relevant to the relationship between environmental load and construction cost were selected. Consequently, this study focused on work types with high environmental impact and construction cost, and a design-stage database was created that includes relevant quantity information. Table 3 outlines the types of work used to build the design phase database.
Table 3.
Types of work used to build the design phase database.
Given the limited size of the dataset (17 and 22 cases for planning and design stages, respectively), overfitting control was a priority. In the multiple regression models, we applied statistical criteria (adjusted R2, Mallows’ Cp, and BIC) to limit variable count. For regression trees, we used depth restriction and cost-complexity pruning. For CBR, small k values (5) were chosen to avoid hypersensitivity. Additionally, all models were evaluated using a hold-out validation approach (80/20 split), and RT models included internal validation via pruning procedures. These steps collectively reduce the risk of overfitting despite the small sample size as shown in Table 4.
Table 4.
Overfitting Control Strategy per Model.
3. Machine-Learning Models
Recent studies also demonstrate the growing application of machine learning in civil engineering. Taheri et al. [20] used gradient boosting to evaluate mortar durability under acidic conditions, while Tanguler-Bayramtan et al. [21] applied Monte Carlo simulations to assess the environmental performance of alternative types of cement. Mohammadi et al. [22] employed neural networks for seismic demand prediction, and David et al. [23] compared mechanics-based and machine-learning models for estimating shear strength in concrete beams. These examples highlight the value of data-driven methods in addressing complex engineering problems.
Among the machine-learning techniques applied in this study, multiple regression analysis and regression tree models are supervised learning methods. These models require labeled training data, where the input variables and corresponding output values (environmental load and construction costs) are known, allowing the algorithms to learn patterns and predict outcomes. In contrast, case-based reasoning is a type of instance-based learning that relies on retrieving and adapting solutions from similar past cases rather than explicit model training, which distinguishes it from classical supervised learning paradigms. Prior to model training, all numerical input variables were normalized using min-max scaling to a [0, 1] range. This step ensured consistency in input scales across diverse units (e.g., area in m2, emissions in tons of CO2, Eco-points (the composite score from the Republic of Korea’s environmental impact index), preventing bias in model training and maintaining numerical stability across all algorithms.
3.1. Multiple Regression Analysis
3.1.1. Planning Stage Multiple Regression Analysis Model Construction
Regression analysis, a widely utilized technique for model construction, is based on the least squares method and is effective in predicting quantitative outcomes. Many machine-learning techniques build upon regression models, and for this study, a multiple regression model was developed. Before constructing the model, it is essential to understand the relationships between the variables, as this helps to assess the potential issue of multicollinearity, which arises when there are strong correlations between variables [24,25,26,27,28,29,30].
Table 5 presents the results of the correlation analysis between the dependent and independent variables. The analysis reveals a strong negative correlation between design speed and road grade (−0.81). This relationship is likely to negatively impact the reliability of the multiple regression model in future predictions. The correlations between the other variables were relatively weak, and these findings are further supported by the visual representation in Figure 2.
Table 5.
Analysis of correlation between planning stage variables.
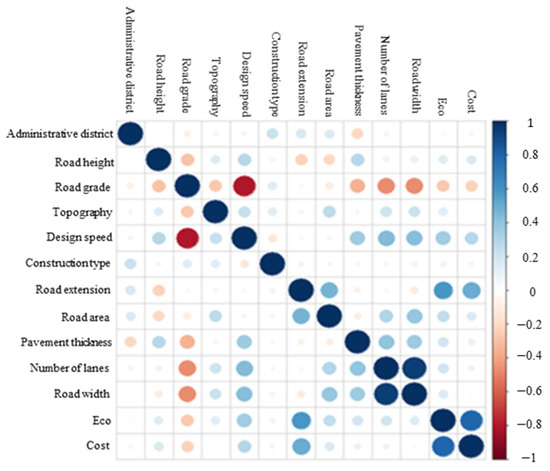
Figure 2.
Visualization of planning stage correlations.
Variable selection plays a crucial role in constructing a regression model. While adding a variable generally reduces the residual sum of squares (RSS) and increases the R2 value, this does not always improve the model’s fit or predictive performance; in some cases, it may even decrease performance. There are two main methods for variable selection in regression models: forward stepwise selection and backward stepwise regression. In forward stepwise selection, the process starts with a model that includes no variables, and variables are added one by one, which minimizes the RSS. Conversely, backward stepwise regression starts with all variables included and sequentially removes the least useful ones. However, these methods can lead to biased models with narrower confidence intervals due to the overfitting risk. To address this issue, the best subsets regression method was used. This method involves evaluating all possible variable combinations and selecting the one with the lowest residual sum of squares. For this, a multiple regression model including all variables is initially constructed. Table 6 summarizes the models for environmental load and construction costs, where both models show statistically significant p-values at a 5% level. However, with R2 values ranging from 0.43 to 0.55, their predictive performance is expected to be low. Given the low R2 values, it is reasonable to apply the best subsets regression analysis to improve the model.
Table 6.
Planning stage multiple regression analysis model information including all variables.
To enhance the multiple regression model, the ‘regsubsets’ function from the ‘leaps’ library in R was employed for the best subsets regression method. This function identifies the optimal combination of variables that minimizes the RSS across all possible combinations. Both multiple regression models identified the same maximum number of combinations, which was 8. In the context of regression models, the explanatory power of the model tends to improve as the number of variables increases, leading to a reduction in the RSS value and an increase in the R2 statistic [31]. These changes may indicate improved predictive performance. However, this approach also carries the risk of incorporating irrelevant variables that are not directly related to the dependent variable, potentially reducing the model’s accuracy. Therefore, it is critical to carefully select the most appropriate variables for inclusion in the model. The optimal variable combination was determined using various statistical techniques, including Mallows’ Cp, Bayesian Information Criteria (BIC), and the Adjusted R2 [32].
- Mallows’ Cp:
- BIC (Bayesian Information Criterion):
- Adjusted R2:
In the best subsets regression analysis of the environmental load multiple regression model during the planning stage, the optimal number of variables selected by the various statistical techniques was as follows: Mallow’s Cp selected 5 variables, BIC identified 3 variables, and the Adjusted R2 technique identified 7 variables. For the construction cost multiple regression model in the planning stage, the optimal number of variables for each technique was Mallow’s Cp identified four variables, BIC identified three variables, and the Adjusted R2 technique identified five variables. The specific variables selected by each statistical technique for both models are shown in Figure 3 and Table 7, Table 8 and Table 9 below.
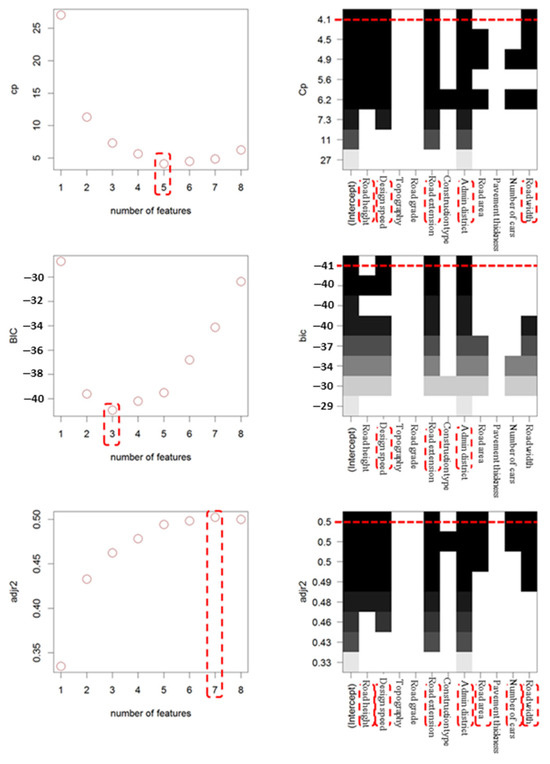
Figure 3.
Optimal variables by statistical technique of best subset regression analysis (The red dashed lines indicate the optimal number of features based on model selection criteria).
Table 7.
Optimal Variables by Statistical Technique for Best Subset Regression Analysis in the Planning Stage.
Table 8.
Planning Stage Environmental Load Multiple Regression Model Variable Combination Information.
Table 9.
Planning stage construction cost multiple regression model variable combination information.
Each multiple regression model was constructed using the variable subsets derived from the best subset regression analysis method, and the models’ performances, including those based on all variables, were compared using R2. The results are presented in the following Table 10 and Table 11.
Table 10.
Results of prediction performance of multiple regression model for environmental load at planning stage.
Table 11.
Results of the multiple regression model prediction performance for construction costs at the planning stage.
R2, which measures the proportion of variance explained by a model, ranges from 0 to 1, with higher values indicating a better model fit. However, R2 has a key limitation: it invariably increases when additional variables are included, even if these variables do not meaningfully improve the model. To address this issue, Modified R2 is used to compare models with different numbers of variables. Unlike R2, Modified R2 adjusts for the sample size and the number of variables, providing a more accurate measure of model performance.
From the tables, it is evident that Mallows’ Cp, which utilizes a modified variable selection technique, produces a more suitable model compared to the model that includes all variables. To evaluate the predictive performance of the models for environmental load and construction costs, we assessed 10 verification cases. The results show that the error rate increased in the following order: Mallows’ Cp, BIC, Modified R2, and models using all variables.
For the construction cost model, the standard deviation of R2 for the Mallows’ Cp-based model was 5% higher than that of the BIC model. However, when applying the evaluation criteria for R2 and Modified R2, the models based on Mallows’ Cp performed better than the BIC-based model. This suggests that with further analysis, the Mallows’ Cp model could potentially achieve superior performance compared to the BIC model. Although the Mallows’ Cp-based model performed well, it still did not meet the recommended estimation error rate of −20% to +30% as suggested by the American Institute of Estimators.
3.1.2. Design-Stage Multiple Regression Analysis Model Construction
The process of constructing a multiple regression analysis model in the design stage followed the same procedure as in the planning stage. Initially, the issue of multicollinearity between the independent and dependent variables was assessed. Table 12 and Figure 4 present the correlation analysis table and visualization for the variables involved in building the multiple regression model at the design stage. The analysis revealed several variables with strong correlations, including dump transport-soil (0.85), dump transport-ripening rock (0.73), formwork-concrete pouring (0.74), rebar processing and assembly-concrete pouring (0.92), rebar processing and assembly-formwork (0.71), scaffolding-construction length (0.75), scaffolding-concrete pouring (0.91), scaffolding-rebar processing and assembly (0.83), and environmental load-construction length (0.72). It is anticipated that these strong correlations may negatively affect the reliability of the multiple regression model. However, this issue is expected to be mitigated through the subsequent best subset regression analysis.
Table 12.
Correlation analysis between design-stage variables.
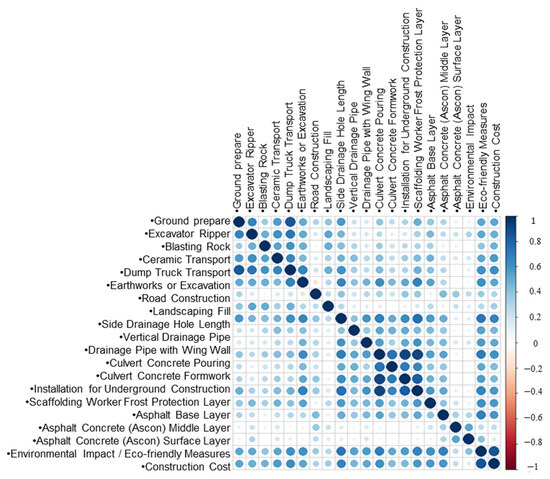
Figure 4.
Visualization of design phase correlations.
After conducting the best subsets regression analysis, the results revealed that the maximum number of variables that could be combined, while minimizing the RSS, was 8 for both the environmental load estimation model and the construction cost estimation model. The optimal number of variables derived from each statistical technique—Mallows’ Cp, BIC, and Modified R2—was also 8 for both models, as illustrated in Figure 5.
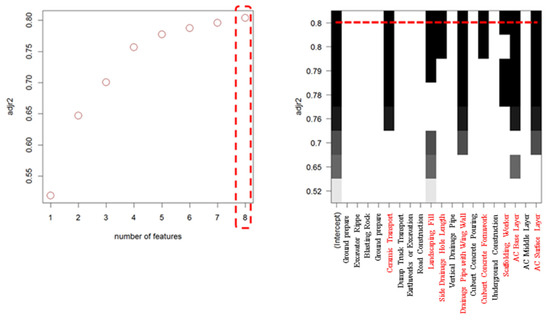
Figure 5.
Optimal variables by statistical technique of best subset regression analysis at design-stage environmental load multiple regression model (The red dashed lines indicate the optimal number of features based on model selection criteria).
For the construction cost model in the planning stage, the number of optimal variables was 7 for Mallows’ Cp, 6 for BIC, and 8 for Modified R2, as shown in Figure 4, Figure 5 and Figure 6. The specific variable names selected by each statistical technique for both models are presented in Table 13 and Table 14.
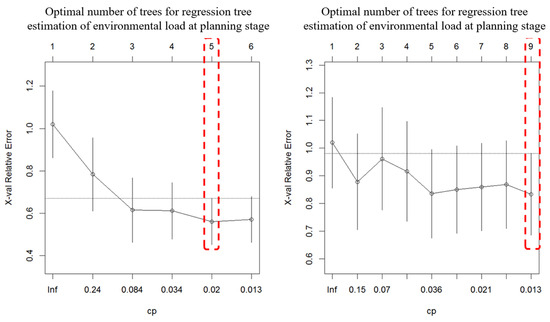
Figure 6.
Tree size of the regression tree model for estimating environmental load and construction cost at the planning stage (The red dashed lines indicate the optimal number of features based on model selection criteria).
Table 13.
Design-stage multiple regression analysis model information including all variables.
Table 14.
Optimal variables by statistical technique for design-stage best subset regression analysis.
Each multiple regression model was constructed using the variables selected by each statistical technique from the best subset regression analysis. The results for each model, along with the modified multiple regression model that included all variables, were compared using R2 and are presented in Table 15.
Table 15.
Design-stage environmental load multiple regression model variable combination information.
To select a suitable model for estimating environmental load and construction costs, we evaluated the prediction performance using verification cases. Table 16 and Table 17 summarize the error rates of the multiple regression models for each approach based on 10 verification cases.
Table 16.
Design-stage environmental load multiple regression model prediction performance results.
Table 17.
Design-stage construction cost multiple regression model prediction performance results.
The results from the multiple regression models for environmental load and construction costs at the design stage indicate that, for environmental load estimation, the model derived from the best subset analysis demonstrated a reduced error rate and standard deviation when compared to the model that included all variables. For the construction cost estimation, the error rate and standard deviation decreased in the following order: models using all variables, Adjusted R2, BIC, and Mallows’ Cp.
3.2. Regression Tree
The tree structure model consists of interconnected decision nodes, similar to a flow chart. These decision nodes represent choices regarding attributes, and they branch out into further nodes that determine the next set of attributes [33,34]. The tree concludes with leaf nodes, which represent the outcomes resulting from the combination of decisions made along the way.
The core concept behind this tree-based technique is to iteratively divide variables, with each division aimed at minimizing the RSS. Rather than dividing the entire dataset, only the lower part of the previously divided tree is further split. This top-down process is referred to as ‘recursive division.’ The algorithm used in this process focuses on reducing the RSS as much as possible at each step, without considering future divisions that might yield better results. Consequently, this can lead the tree to branch unnecessarily, which results in low bias but high variance. To address this, the tree should initially be constructed in its full form and then pruned or optimized to an ideal size, which represents the optimal combination of variables.
For the regression tree models, the available dataset at each stage was divided into training and validation subsets using an 80/20 split ratio. Specifically, 80% of the data was randomly assigned to model training, and the remaining 20% was used as a validation set to assess generalization performance. The random split was conducted with stratification to preserve the distribution of target variables (environmental load and cost).
3.2.1. Planning Stage Regression Tree Model
In this study, the regression tree models were implemented using the ‘rpart’ function from the ‘party’ library in R. The planning stage database was used as input, and the ‘rpart’ function was executed to generate the models. The error values for each variable split are presented in Table 18. Two separate regression tree models were constructed independently, one for estimating environmental load and the other for estimating construction costs.
Table 18.
Planning stage regression tree splitting error results.
In Table 18, the term CP refers to the complexity parameter, and n-split denotes the number of splits applied to the tree model. The term rel error represents a relative error, while xerror and xstd refer to the average error and standard deviation, respectively, obtained through 10-Fold Cross Validation (where “10” is represented by the Roman numeral X).
For the regression tree model estimating environmental load during the planning stage, the lowest average error (56%) and standard deviation (11%) were achieved when the tree was split 4 times. For the model estimating construction costs, the lowest average error (83%) and standard deviation (15%) occurred when the tree was split 8 times.
Figure 6 illustrates the relative error according to tree size, with error bars derived from the regression tree splitting error during the planning stage. The horizontal line in the center of the figure represents the upper limit of the minimum standard error. The lowest error for estimating environmental load occurred when the tree size was 5 (split 4 times), while the lowest error for estimating construction costs was achieved with a tree size of 9 (split 8 times). By applying the optimal number of splits for each model through the ‘prune’ function, the model with the minimum average error was constructed, as shown in Figure 7.
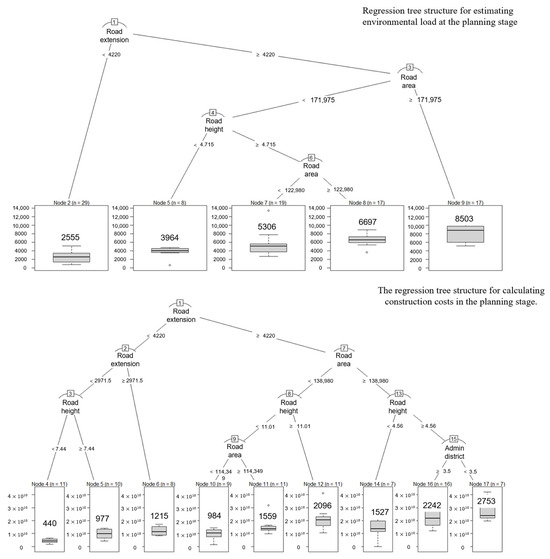
Figure 7.
Visualization of the regression tree structure for estimating environmental load and construction cost at the planning stage.
In the regression tree for environmental load estimation during the planning stage, cases with a road length of less than 4220 m were estimated to have an environmental load of 2555 Eco-points (Node 2). For cases where the road length was 4220 m or more, a road area under 171,975 m2, and a road height of 4.715 m or less, the estimated environmental load was 3964 Eco-points (Node 5). In instances where the road height exceeded 4.715 m and the road area was 122,980 m2 or less, the estimated environmental load was 5306 Eco-points (Node 7). For cases where the road area exceeded 122,980 m2, the environmental load increased to 6697 Eco-points (Node 8). Additionally, cases with a road length under 4220 m and a road area under 171,975 m2 had an environmental load of 8503 Eco-points (Node 9). These values represent the average environmental load for the cases corresponding to each node.
The regression tree for environmental load estimation during the planning stage uses four partitioning criteria, with the estimated environmental loads categorized into the following values: 2555 Eco-points, 3964 Eco-points, 5306 Eco-points, 6697 Eco-points, and 8503 Eco-points. Similarly, the regression tree for estimating construction costs during the planning stage employs eight partitioning criteria, with estimated costs falling into categories such as 4.40 billion won, 9.97 billion won, and up to 27.53 million won.
Table 19 summarizes the prediction performance of the regression trees for environmental load and construction costs at the planning stage based on 10 verification cases. The environmental load estimation regression tree showed a prediction performance with an average error rate of 36.7% and a standard deviation of 53.7%. The construction cost estimation regression tree demonstrated a prediction performance with an average error rate of 28.3% and a standard deviation of 19.2%.
Table 19.
Results of regression tree prediction performance for environmental load and construction cost estimation at the planning stage.
3.2.2. Design-Stage Regression Tree Model
The process of constructing the regression tree model in the design stage followed the same procedure as in the planning stage. As shown in Table 20, for the regression tree model estimating environmental load in the design stage, the lowest average error (59%) occurred when the variables were divided once. The standard deviation (15%) was lowest when the variables were split 5 times. For the regression tree model estimating construction costs in the design stage, the lowest average error (68%) was observed when the variables were split 3 times, and the standard deviation (12%) was lowest when the variables were split between 1 and 6 times.
Table 20.
Design-stage regression tree splitting error results.
Figure 8 illustrates the relative error according to tree size, with error bars representing the design-stage regression tree splitting error. For the environmental load estimation regression tree in the planning stage, the lowest error was achieved when the tree size was 6 (split 5 times). For the construction cost estimation regression tree in the planning stage, the lowest error was achieved when the tree size was 4 (split 3 times). Consequently, for model construction, the number of splits for the design-stage environmental load estimation regression tree was determined to be 5, while the number of splits for the construction cost estimation regression tree was determined to be 3.
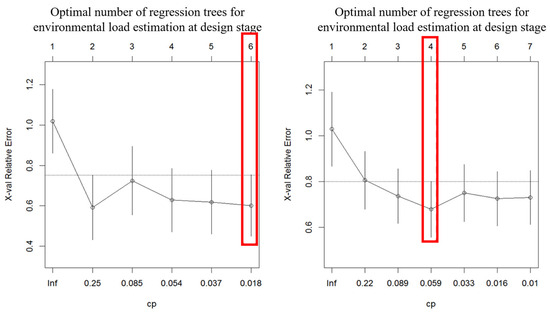
Figure 8.
Tree size of the regression tree model for estimating environmental load and construction cost at the design stage.
Table 21 presents the verification results for the prediction performance of the design phase environmental load and construction cost regression trees, based on 10 verification cases. The results indicate that the design phase environmental load estimation regression tree achieved an average error rate of 28% with a standard deviation of 19%. In contrast, the design phase construction cost estimation regression tree demonstrated a prediction performance with an average error rate of 23% and a standard deviation of 13%.
Table 21.
Results of regression tree prediction performance for environmental load and construction cost estimation at the design stage.
3.3. Case-Based Reasoning
In the planning stage of a road project, the optimal route and construction method are selected through a decision-making process. Traditionally, economic feasibility was the primary criterion for decision-making. However, with the growing concern over environmental pollution, environmentally friendly construction has increasingly become a critical decision-making factor.
Case-based reasoning (CBR) involves four key steps: the retrieval step, where similar past cases are searched; the reuse step, where retrieved cases are applied to the new problem; the revising step, where the most similar cases are modified to account for the characteristics of the current problem; and the retaining step, where the derived solutions are stored back into the case database for future reference. This iterative process improves the model’s accuracy over time [35,36].
In this study, the similarity between the variables of the input case and the query case is calculated using the nearest neighbor extraction method. Subsequently, a weighted value is calculated, considering the degree of influence of each variable on the target value. The similarity score is then computed, as shown in the Equation below. The cases with the highest similarity scores are selected, and the target value for the new case is estimated through a weighted average based on these scores [37,38].
where:
- = Similarity score of the query case
- = New case
- = Query case
- = Weight of the variable
In this study, the weighted values of variables are derived using the genetic algorithm of Excel’s Solver. The case-based inference model was constructed using the Excel Solver library, and the parameter information is shown in Table 22.
Table 22.
Key parameter settings used to build a case-based reasoning model.
Table 23 summarizes the results of the environmental load and construction cost estimation using the case-based reasoning model in the planning stage. The average error rate for the case-based reasoning model in estimating environmental load was 15.9%, with a standard deviation of 8.6%, indicating its prediction performance. For estimating construction costs, the average error rate was 19.9%, and the standard deviation was 10.1%, reflecting the model’s prediction accuracy.
Table 23.
Case-based reasoning prediction performance results for estimating construction costs and environmental loads at the planning stage.
Table 24 summarizes the results of environmental load and construction cost estimation using the case-based reasoning model in the design phase. The average error rate for the case-based reasoning model in estimating environmental load was 45.2%, with a standard deviation of 25.5%, indicating its prediction performance. For estimating construction costs, the average error rate was 33.0%, and the standard deviation was 24.5%, reflecting the model’s accuracy in prediction.
Table 24.
Case-based reasoning prediction performance results for design-stage construction cost and environmental load estimation.
Table 25 outlines the key parameters and assumptions defined for each model across both the planning and design stages. To ensure fair comparison and reduce bias, consistent preprocessing steps (e.g., normalization) and error metrics were used. The parameters were chosen based on either statistical criteria (for regression), tree pruning techniques, or similarity-based retrieval logic (for CBR), and then empirically tested using independent verification cases. These configurations help maintain modeling transparency and ensure reproducibility.
Table 25.
Assumed Parameters and Settings for Each Machine-Learning Model.
4. Results and Discussions
4.1. Results
The construction industry today faces complex challenges, including environmental degradation and low productivity. Among these, road projects are particularly significant due to their large budgets and substantial environmental impact, which can greatly affect both the local region and society at large. This study applied multiple regression analysis MRA, RT, and CBR to identify models best suited for estimating environmental load and construction cost during the planning and design stages. As shown in Figure 9, the model fit criteria for each stage were applied according to the ±20% to +30% error range suggested by the American Institute of Estimators. For the planning stage, an error rate threshold of 30% was set, while the design stage was set at 20%.
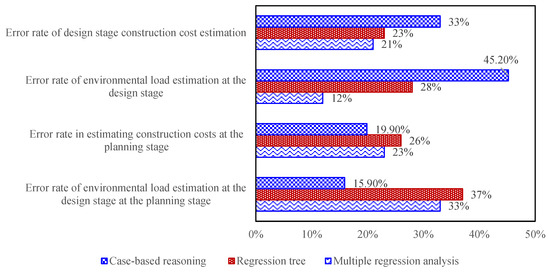
Figure 9.
Error Rates of Environmental Load and Construction Cost Estimation Models at the Planning and Design Stages.
In the planning stage, the MRA model for estimating construction costs performed well, with an error rate of 23%, which is within the acceptable error range for early-stage cost estimation (±20% to +30%). CBR showed a slightly lower error rate of 19.9%, while RT had the highest error rate at 26%. Although CBR’s error rate was marginally lower, MRA still demonstrated competitive performance, effectively capturing the relationships between construction variables such as material, labor, and equipment costs. RT, despite its decision-tree structure, exhibited relatively higher error rates, likely due to its difficulty in managing the finer granularity of data involved in cost estimation.
As the project progressed to the design stage, the complexity of the variables increased, making accurate predictions more challenging. In this phase, MRA emerged as the most accurate model for estimating environmental load, with an error rate of 12%. This highlights MRA’s ability to handle the increasing complexity of road project designs, which involve factors like road width, gradient, and material composition that influence the overall environmental impact.
In comparison, RT exhibited a higher error rate of 28%, and CBR showed the highest error rate of 45.2%. The significant performance drop of CBR in the design stage can be attributed to its reliance on historical case data, which may not be as applicable to the more nuanced design decisions made during the later stages of road construction. RT, while effective at partitioning data into decision nodes, faced challenges in managing the broader variability present in design-level decisions. These limitations suggest that more sophisticated regression techniques, such as MRA, are better suited for handling the increased complexity of environmental load estimation in the design phase.
In the design stage, RT and MRA performed relatively similarly in estimating construction costs. RT’s error rate was 23%, while MRA showed a slightly lower error rate of 21%. This suggests that RT has gained proficiency in handling the complex, multivariate relationships typical in the design stage, but still falls short compared to MRA, which seems better equipped to manage a broader range of variables and higher levels of complexity. CBR, however, displayed a higher error rate of 33% in this phase, indicating its reduced effectiveness when integrating multiple variables beyond historical case data.
The increase in error rate for CBR could also reflect its struggles with the rising number of variables and their interactions during the design phase, where specific decisions regarding construction methods, materials, and technologies need to be considered.
The comparative analysis of the models across both the planning and design stages reveals several key insights. CBR excelled in the planning stage for both environmental load and construction cost estimation, showing the lowest error rates. However, as the project advanced to the design stage, CBR faced significant challenges with both environmental load and cost estimations, highlighting the difficulties of using a case-based model in more complex, data-intensive scenarios. On the other hand, MRA consistently delivered the most accurate predictions in the design stage, with lower error rates than both RT and CBR for environmental load and construction cost estimation. This suggests that, despite the relative simplicity of MRA, it is better equipped to handle the increased complexity of the design phase, where multiple, interrelated variables must be considered.
RT, although effective in the planning phase for environmental load and construction cost estimations, showed limitations as the dataset grew more complex. The higher error rates observed in the design stage reflect RT’s difficulty in capturing the intricate relationships between variables effectively. Nonetheless, RT still offers promise in managing large datasets and serves as a useful alternative when simplicity is preferred.
The planning stage models show Error Rates ranges of 15.9–45.0% for environmental load and construction costs. While these values exceed typical engineering design-stage accuracy thresholds, they are within the accepted range for early feasibility assessments in the Republic of Korea, where ±30% to ±50% variability is considered normal due to limited available data. Compared to conventional estimation methods (e.g., historical averages, unit-cost-based macros), the proposed models improve consistency and provide a data-driven foundation for pre-design evaluations under uncertainty.
Overall, the results of this study demonstrate that machine-learning models can be effectively employed for estimating environmental load and construction costs in road projects. MRA proved to be the most accurate model during the design phase, while CBR was highly effective in the planning stage. However, due to its performance degradation in the design stage, CBR’s applicability may be limited in more complex projects. RT, while beneficial in certain contexts, showed inconsistent results across stages. This study emphasizes the importance of model selection based on the project phase, suggesting that MRA may be the most versatile model for both planning and design stages in future road construction projects.
4.2. Discussions
A comparison with recent studies confirms that our model performance is within the expected range as shown in Table 26. Xiao et al. (2023) [35] reported MAPE values between 14.60% and 19.74% using advanced CBR models on a large dataset (11,000 simulated and 1610 real cases). Our CBR results (MAPE = 16–20%) align well despite limited data, indicating robustness. Similarly, Kiani and Nasrollahzadeh (2023) [19] used fuzzy decision-tree models on 200 probabilistic simulations to predict seismic fragility, emphasizing pruning and input structure—principles also applied in our regression trees. These parallels reinforce the validity of our ML-based approach under constrained conditions.
Table 26.
Summary of methodologies and performance from related AI-based construction studies.
Prior to modeling, the dataset was reviewed for missing or inconsistent entries. Projects with critical missing fields (e.g., cost, area, CO2 emissions) were excluded. For non-critical gaps, median imputation was applied within grouped project types (e.g., by road class). This two-step cleaning process ensured consistency while avoiding bias from arbitrary replacements. While some degree of model bias is still possible due to the limited sample size, validation on independent cases showed stable performance, indicating that the influence of such bias is controlled.
The developed models are designed to assist planners during early-stage project evaluation where detailed design data is not yet available. For example, the multiple regression models can be applied using basic input variables such as road length, type, and cross-sectional area—information typically available in feasibility studies. The regression tree model offers decision rules in a flowchart-like structure, enhancing transparency and interpretability. Meanwhile, the CBR model allows planners to retrieve similar past projects using a simple input form, helping guide rough cost or environmental estimates.
5. Conclusions
This study successfully applied machine-learning models—specifically multiple regression analysis, regression tree models, and case-based reasoning—to estimate both environmental load and construction costs in road projects. Despite the limitations of using a dataset containing only 100 standard road cases, the findings demonstrate that machine-learning models can offer valuable predictive insights for sustainable road construction.
The quantitative results indicate that, in the planning stage, the case-based reasoning model outperformed the other models in estimating both environmental load and construction costs, with average error rates of 15.9% for environmental load and 19.9% for construction costs. In contrast, multiple regression analysis showed higher average error rates: 26.0% for construction cost estimation and 37.0% for environmental load estimation. The regression tree model exhibited average error rates of 36.7% for environmental load and 28.3% for construction cost estimation.
In the design stage, multiple regression analysis emerged as the most accurate model, with error rates of 12% for environmental load and 23% for construction costs. This was in comparison to the regression tree and case-based reasoning models, which showed higher error rates of 28% for environmental load and 33% for construction costs, respectively.
A key insight from this study was the importance of selecting the right variables for model performance. Variables such as road height, design speed, road area, and road width were found to significantly influence both environmental load and cost estimates. To optimize the selection of these variables, the study employed techniques like Mallows’ Cp, Bayesian Information Criteria (BIC), and modified R2. This approach led to improved model accuracy, with the best subset regression analysis identifying five key variables for environmental load estimation and four for cost estimation during the planning stage, which resulted in more accurate models compared to those that included all variables.
Although the models were developed using Korean road project data, the underlying methodology and multi-model framework can be adapted to international contexts with appropriate localization of cost structures, environmental impact factors, and construction practices. This opens opportunities for broader application in global sustainable infrastructure planning.
Despite the promising results from the machine-learning models, limitations were noted. The small dataset (comprising 100 road cases) and the absence of qualitative data on factors such as client preferences, surrounding area characteristics, and construction methods were identified as key limitations. Expanding the dataset and incorporating qualitative data could further enhance the robustness and predictive power of the models.
Funding
This research was supported by Basic Science Research Program through the National Research Foundation of Korea (NRF) funded by the Ministry of Education (RS-2021-NR066174).
Data Availability Statement
Dataset available on request from the authors.
Conflicts of Interest
The author declares no conflicts of interest.
References
- Ahn, C. An Integrated Framework for Sustainable Construction Processes: Understanding and Managing the Environmental Performance of Construction Operations. Ph.D. Thesis, University of Illinois at Urbana-Champaign, Champaign, IL, USA, 2012; p. 141. [Google Scholar]
- Ahn, C.R.; Lee, S. Importance of Operational Efficiency to Achieve Energy Efficiency and Exhaust Emission Reduction of Construction Operations. J. Constr. Eng. Manag. 2013, 139, 404–413. [Google Scholar] [CrossRef]
- Bilec, M.M.; Ries, R.J.; Matthews, H.S. Life-Cycle Assessment Modeling of Construction Processes for Buildings. J. Infrastruct. Syst. 2010, 16, 199–205. [Google Scholar] [CrossRef]
- Cass, D.; Mukherjee, A. Calculation of Greenhouse Gas Emissions for Highway Construction Operations by Using a Hybrid Life-Cycle Assessment Approach: Case Study for Pavement Operations. J. Constr. Eng. Manag. 2011, 137, 1015–1025. [Google Scholar] [CrossRef]
- Noh, K.S.; Baek, J.D. Suggestions of the Construction and Management for Sustainable Highways. Ecol. Resilient Infrastruct. 2016, 3, 156–161. [Google Scholar] [CrossRef][Green Version]
- Park, M.C.; Lee, S.H.; Shin, S.W. Case Study of Economic Efficiency Evaluation about Green Residential Complex in Korea. Adv. Mater. Res. 2014, 935, 34–37. [Google Scholar] [CrossRef]
- MOLIT (Ministry of Land, Infrastructure & Transport). Molit Statistics System. 2017. Available online: https://www.molit.go.kr/english/USR/WPGE0201/m_36859/DTL.jsp (accessed on 15 April 2025).
- Xu, Y.; Zhou, Y.; Sekula, P.; Ding, L. Machine Learning in Construction: From Shallow to Deep Learning. Dev. Built Environ. 2021, 6, 100045. [Google Scholar] [CrossRef]
- Dawood, T.; Zhu, Z.; Zayed, T. Machine Vision-Based Model for Spalling Detection and Quantification in Subway Networks. Autom. Constr. 2017, 81, 149–160. [Google Scholar] [CrossRef]
- Liu, J.; Liu, F.; Zheng, C.; Fanijo, E.O.; Wang, L. Improving Asphalt Mix Design Considering International Roughness Index of Asphalt Pavement Predicted Using Autoencoders and Machine Learning. Constr. Build. Mater. 2022, 360, 129439. [Google Scholar] [CrossRef]
- Xu, C.; Chen, X.; Zeng, Q.; Cai, M.; Zhang, W.; Yu, B. A Framework of Integrating Machine Learning Model and Pavement Life Cycle Assessment to Optimize Asphalt Mixture Design. Constr. Build. Mater. 2025, 469, 140481. [Google Scholar] [CrossRef]
- Liu, J.; Liu, F.; Wang, L. Automated, Economical, and Environmentally-Friendly Asphalt Mix Design Based on Machine Learning and Multi-Objective Grey Wolf Optimization. J. Traffic Transp. Eng. (Engl. Ed.) 2024, 11, 381–405. [Google Scholar] [CrossRef]
- Li, Y.; Zou, Z.; Zhang, J.; He, Y.; Huang, G.; Li, J. Refined Evaluation Methods for Preventive Maintenance of Project-Level Asphalt Pavement Based on Confusion-Regression Model. Constr. Build. Mater. 2023, 403, 133105. [Google Scholar] [CrossRef]
- Nguyen, H.L.; Tran, V.Q. Data-Driven Approach for Investigating and Predicting Rutting Depth of Asphalt Concrete Containing Reclaimed Asphalt Pavement. Constr. Build. Mater. 2023, 377, 131116. [Google Scholar] [CrossRef]
- Raza, M.S.; Sharma, S.K. Optimizing Porous Asphalt Mix Design for Permeability and Air Voids Using Response Surface Methodology and Artificial Neural Networks. Constr. Build. Mater. 2024, 442, 137513. [Google Scholar] [CrossRef]
- Ochoa, L.; Hendrickson, C.; Matthews, H.S. Economic Input-Output Life-Cycle Assessment of U.S. Residential Buildings. J. Infrastruct. Syst. 2002, 8, 132–138. [Google Scholar] [CrossRef]
- Sharrard, A.L.; Matthews, H.S.; Ries, R.J. Estimating Construction Project Environmental Effects Using an Input-Output-Based Hybrid Life-Cycle Assessment Model. J. Infrastruct. Syst. 2008, 14, 327–336. [Google Scholar] [CrossRef]
- Guggemos, A.A.; Horvath, A. Decision-Support Tool for Assessing the Environmental Effects of Constructing Commercial Buildings. J. Archit. Eng. 2006, 12, 187–195. [Google Scholar] [CrossRef]
- Kiani, H.; Nasrollahzadeh, K. Fuzzy Logic Approach for Seismic Fragility Analysis of RC Frames with Applications to Earthquake-Induced Damage and Construction Quality. Structures 2023, 55, 1122–1143. [Google Scholar] [CrossRef]
- Taheri, A.; Azimi, N.; Oliveira, D.V.; Tinoco, J.; Lourenço, P.B. Integrating Experimental Analysis and Gradient Boosting for the Durability Assessment of Lime-Based Mortar in Acidic Environment. Buildings 2025, 15, 408. [Google Scholar] [CrossRef]
- Tanguler-Bayramtan, M.; Aktas, C.B.; Yaman, I.O. Environmental Assessment of Calcium Sulfoaluminate Cement: A Monte Carlo Simulation in an Industrial Symbiosis Framework. Buildings 2024, 14, 3673. [Google Scholar] [CrossRef]
- Mohammadi, A.; Karimzadeh, S.; Yaghmaei-Sabegh, S.; Ranjbari, M.; Lourenço, P.B. Utilising Artificial Neural Networks for Assessing Seismic Demands of Buckling Restrained Braces Due to Pulse-like Motions. Buildings 2023, 13, 2542. [Google Scholar] [CrossRef]
- David, A.B.; Olalusi, O.B.; Awoyera, P.O.; Simwanda, L. Suitability of Mechanics-Based and Optimized Machine Learning-Based Models in the Shear Strength Prediction of Slender Beams Without Stirrups. Buildings 2024, 14, 3946. [Google Scholar] [CrossRef]
- Pérez-Acebo, H.; Linares-Unamunzaga, A.; Rojí, E.; Gonzalo-Orden, H. IRI Performance Models for Flexible Pavements in Two-Lane Roads until First Maintenance and/or Rehabilitation Work. Coatings 2020, 10, 97. [Google Scholar] [CrossRef]
- Liu, C.; Chong, X.; Qi, C.; Yao, Z.; Wei, Y.; Zhang, J.; Li, Y. Numerical Investigation of Thermal Parameter Characteristics of the Airfield Runway Adherent Layer in Permafrost Region of Northeast China. Case Stud. Therm. Eng. 2022, 33, 101985. [Google Scholar] [CrossRef]
- Liu, Y.; Gao, Y.; Shi, D.; Zhuang, C.; Lin, Z.; Hao, Z. Modelling Residential Outdoor Thermal Sensation in Hot Summer Cities: A Case Study in Chongqing, China. Buildings 2022, 12, 1564. [Google Scholar] [CrossRef]
- Dong, Q.; Huang, B.; Richards, S.H. Calibration and Application of Treatment Performance Models in a Pavement Management System in Tennessee. J. Transp. Eng. 2015, 141, 04014076. [Google Scholar] [CrossRef]
- Polo-Mendoza, R.; Martinez-Arguelles, G.; Peñabaena-Niebles, R. Environmental Optimization of Warm Mix Asphalt (WMA) Design with Recycled Concrete Aggregates (RCA) Inclusion through Artificial Intelligence (AI) Techniques. Results Eng. 2023, 17, 100984. [Google Scholar] [CrossRef]
- Tarefder, R.A.; White, L.; Zaman, M. Neural Network Model for Asphalt Concrete Permeability. J. Mater. Civ. Eng. 2005, 17, 19–27. [Google Scholar] [CrossRef]
- Lanning, S.; Mallek, J. Factors Influencing Information Literacy Competency of College Students. J. Acad. Librariansh. 2017, 43, 443–450. [Google Scholar] [CrossRef]
- Krzywinski, M.; Altman, N. Points of Significance: Multiple Linear Regression. Nat. Methods 2015, 12, 1103–1104. [Google Scholar] [CrossRef]
- Feng, X.; Ning, Z.; Mao, Y.; Yang, Y.; Yang, X. Mechanical Damage Characteristics of CR/PPA Composite Modified Asphalt Pavement under Multi-Factor Coupling Effect in the Seasonally Frozen Region. Case Stud. Constr. Mater. 2023, 19, e02296. [Google Scholar] [CrossRef]
- Lee, S.Y.; Le, T.H.M.; Kim, Y.M. Prediction and Detection of Potholes in Urban Roads: Machine Learning and Deep Learning Based Image Segmentation Approaches. Dev. Built Environ. 2023, 13, 100109. [Google Scholar] [CrossRef]
- Foroutan Mirhosseini, A.; Tahami, S.A.; Hoff, I.; Dessouky, S.; Ho, C.H. Performance Evaluation of Asphalt Mixtures Containing High-RAP Binder Content and Bio-Oil Rejuvenator. Constr. Build. Mater. 2019, 227, 116465. [Google Scholar] [CrossRef]
- Xiao, X.; Skitmore, M.; Yao, W.; Ali, Y. Improving Robustness of Case-Based Reasoning for Early-Stage Construction Cost Estimation. Autom. Constr. 2023, 151, 104777. [Google Scholar] [CrossRef]
- Lu, Y.; Yin, L.; Deng, Y.; Wu, G.; Li, C. Using Cased Based Reasoning for Automated Safety Risk Management in Construction Industry. Saf. Sci. 2023, 163, 106113. [Google Scholar] [CrossRef]
- Okudan, O.; Budayan, C.; Dikmen, I. A Knowledge-Based Risk Management Tool for Construction Projects Using Case-Based Reasoning. Expert Syst. Appl. 2021, 173, 114776. [Google Scholar] [CrossRef]
- Liu, J.; Li, H.; Skitmore, M.; Zhang, Y. Experience Mining Based on Case-Based Reasoning for Dispute Settlement of International Construction Projects. Autom. Constr. 2019, 97, 181–191. [Google Scholar] [CrossRef]
Disclaimer/Publisher’s Note: The statements, opinions and data contained in all publications are solely those of the individual author(s) and contributor(s) and not of MDPI and/or the editor(s). MDPI and/or the editor(s) disclaim responsibility for any injury to people or property resulting from any ideas, methods, instructions or products referred to in the content. |
© 2025 by the author. Licensee MDPI, Basel, Switzerland. This article is an open access article distributed under the terms and conditions of the Creative Commons Attribution (CC BY) license (https://creativecommons.org/licenses/by/4.0/).