1. Introduction
Tibetan Buddhism has developed over several centuries in China, beginning with the initial introduction of Buddhism during the Turpan period, reaching its peak development from the 13th to the 19th centuries, and continuing with ongoing cultural integration from the 20th century to the present [
1]. Tibetan Buddhism has become an integral part of ethnic culture and social life, and the architecture of Tibetan Buddhist temples, as a key cultural carrier, plays a significant role in religious rituals, educational transmission, and social communication. The architectural form and spatial layout of these temples [
2] reflect the cosmology, religious rituals, beliefs, and lifestyles of local people. Therefore, the study of temple architecture is crucial for the preservation and transmission of Tibetan Buddhist culture. However, previous research has primarily focused on the cultural history of religion and the evolution of architectural forms [
3]. The application of modern technologies in the study of ancient architecture is still in its exploratory stage [
4].
Building simulation began to develop in the 1970s [
5], and this technology has rapidly advanced in terms of improving simulation quality and integrating more knowledge [
6]. The greatest challenge in building simulation lies in addressing increasingly complex geometric spaces [
7,
8], as well as performing simulations over extended time spans [
9,
10,
11]. In the past decade, a significant amount of research in building simulation has focused on bridging the performance gap of buildings [
12,
13,
14], particularly on energy consumption simulation and thermal environment simulation [
15], with the goal of improving the intrinsic performance of buildings [
16], such as optimizing energy use and comfort through building control systems. In the last five years, the application of building simulation has been further refined, approaching reality and having a direct impact. For example, the integration of external equipment calculations has directly improved the efficiency of building energy systems [
17]. Moreover, simulation technology is gradually permeating architectural design, offering new methods for optimizing contemporary building designs [
18,
19,
20].
In addition to optimizing modern building design, building simulation has been widely applied to energy efficiency studies across different climate regions. For instance, customized weather data has been used in energy consumption simulations to achieve high-performance buildings tailored to various climate zones [
21]. Additionally, various computational models have been applied to optimize climate data parameters in building simulations [
22,
23]. The selection of climate data has also become a critical factor in energy simulations. Initially, the most representative urban microclimate parameters were used as inputs for building energy simulations [
24]. Subsequently, comprehensive coupling strategies between climate and building simulation models have been developed, all aiming to achieve the most realistic building simulation results [
25]. This evolution highlights that building simulation technology has become an efficient and widely used tool in architectural design across different climate regions [
26]. Facing the challenges of climate change, building simulation is playing an increasingly important role in retrofitting existing buildings. As simulation research continues to expand, its applications not only enhance modern building performance but also contribute significantly to sustainable adaptation strategies and improved climate resilience in architecture [
27].
In the study of historic buildings, the application of building simulation technology initially focused on the conservation of ancient structures [
28]. Early efforts were mainly centered on basic assessments of acoustics and thermal performance [
29,
30], but gradually expanded to include fluid dynamics simulations. For example, researchers predicted wind pressure distribution at different locations of Chinese pagodas, demonstrating that it is both sensible and feasible to construct CFD geometric models using Revit and to predict wind pressure using the Realizable k-epsilon turbulence model. The study aimed to evaluate wind effects and structural safety in high-rise timber towers through wind simulation technologies [
31]. Another study analyzed the wind-induced vibration of the traditional Drum Tower in Nanjing, China, using computational fluid dynamics (CFD) methods to explore the architectural and structural characteristics of traditional Chinese wooden buildings [
32]. These studies have helped visualize the interactions between historic buildings and their surrounding environments, supporting the development of more scientific conservation and restoration strategies. In addition, research on the thermal comfort of historic buildings has steadily progressed [
33]. For instance, one study utilized a digital twin platform combined with year-round sensor data from various monitoring points. By applying an adaptive thermal comfort model, it established a linear relationship between indoor neutral temperature and outdoor air temperature, facilitating the modernization of historic urban areas [
34]. Over time, simulation technology has begun to merge with traditional cultural studies [
35,
36]. In recent years, as the scope of simulation tools continues to expand, their application in historic building research has increased significantly [
37,
38]. For example, a study on three representative mosques along the Silk Road [
39] systematically reviewed their structural systems and construction techniques. It used Ladybug Tools 1.7.0 to comprehensively analyze the thermal and wind environments of mosque architecture, identifying green building strategies worth promoting. Simultaneously, research on the energy consumption of historic buildings has also progressed [
40,
41]. A representative example is a study on a historic masonry structure located in southern Poland, in which field measurements were used to assess energy performance and recommend improvements for indoor comfort [
42].
Although these studies have made important explorations of ancient architecture through simulation technologies, such as using simulation analysis to assess the construction techniques of mosques along the Silk Road, exploring the impact of architectural layouts on wind environments, and optimizing the reuse of historical districts through comfort simulations, there is still a lack of in-depth research on the relationship between architectural spatial forms and indoor-outdoor thermal and wind environments. Specifically, the performance differences brought about by the spatial layouts of ancient buildings and the potential application of these layouts in modern design remain underexplored.
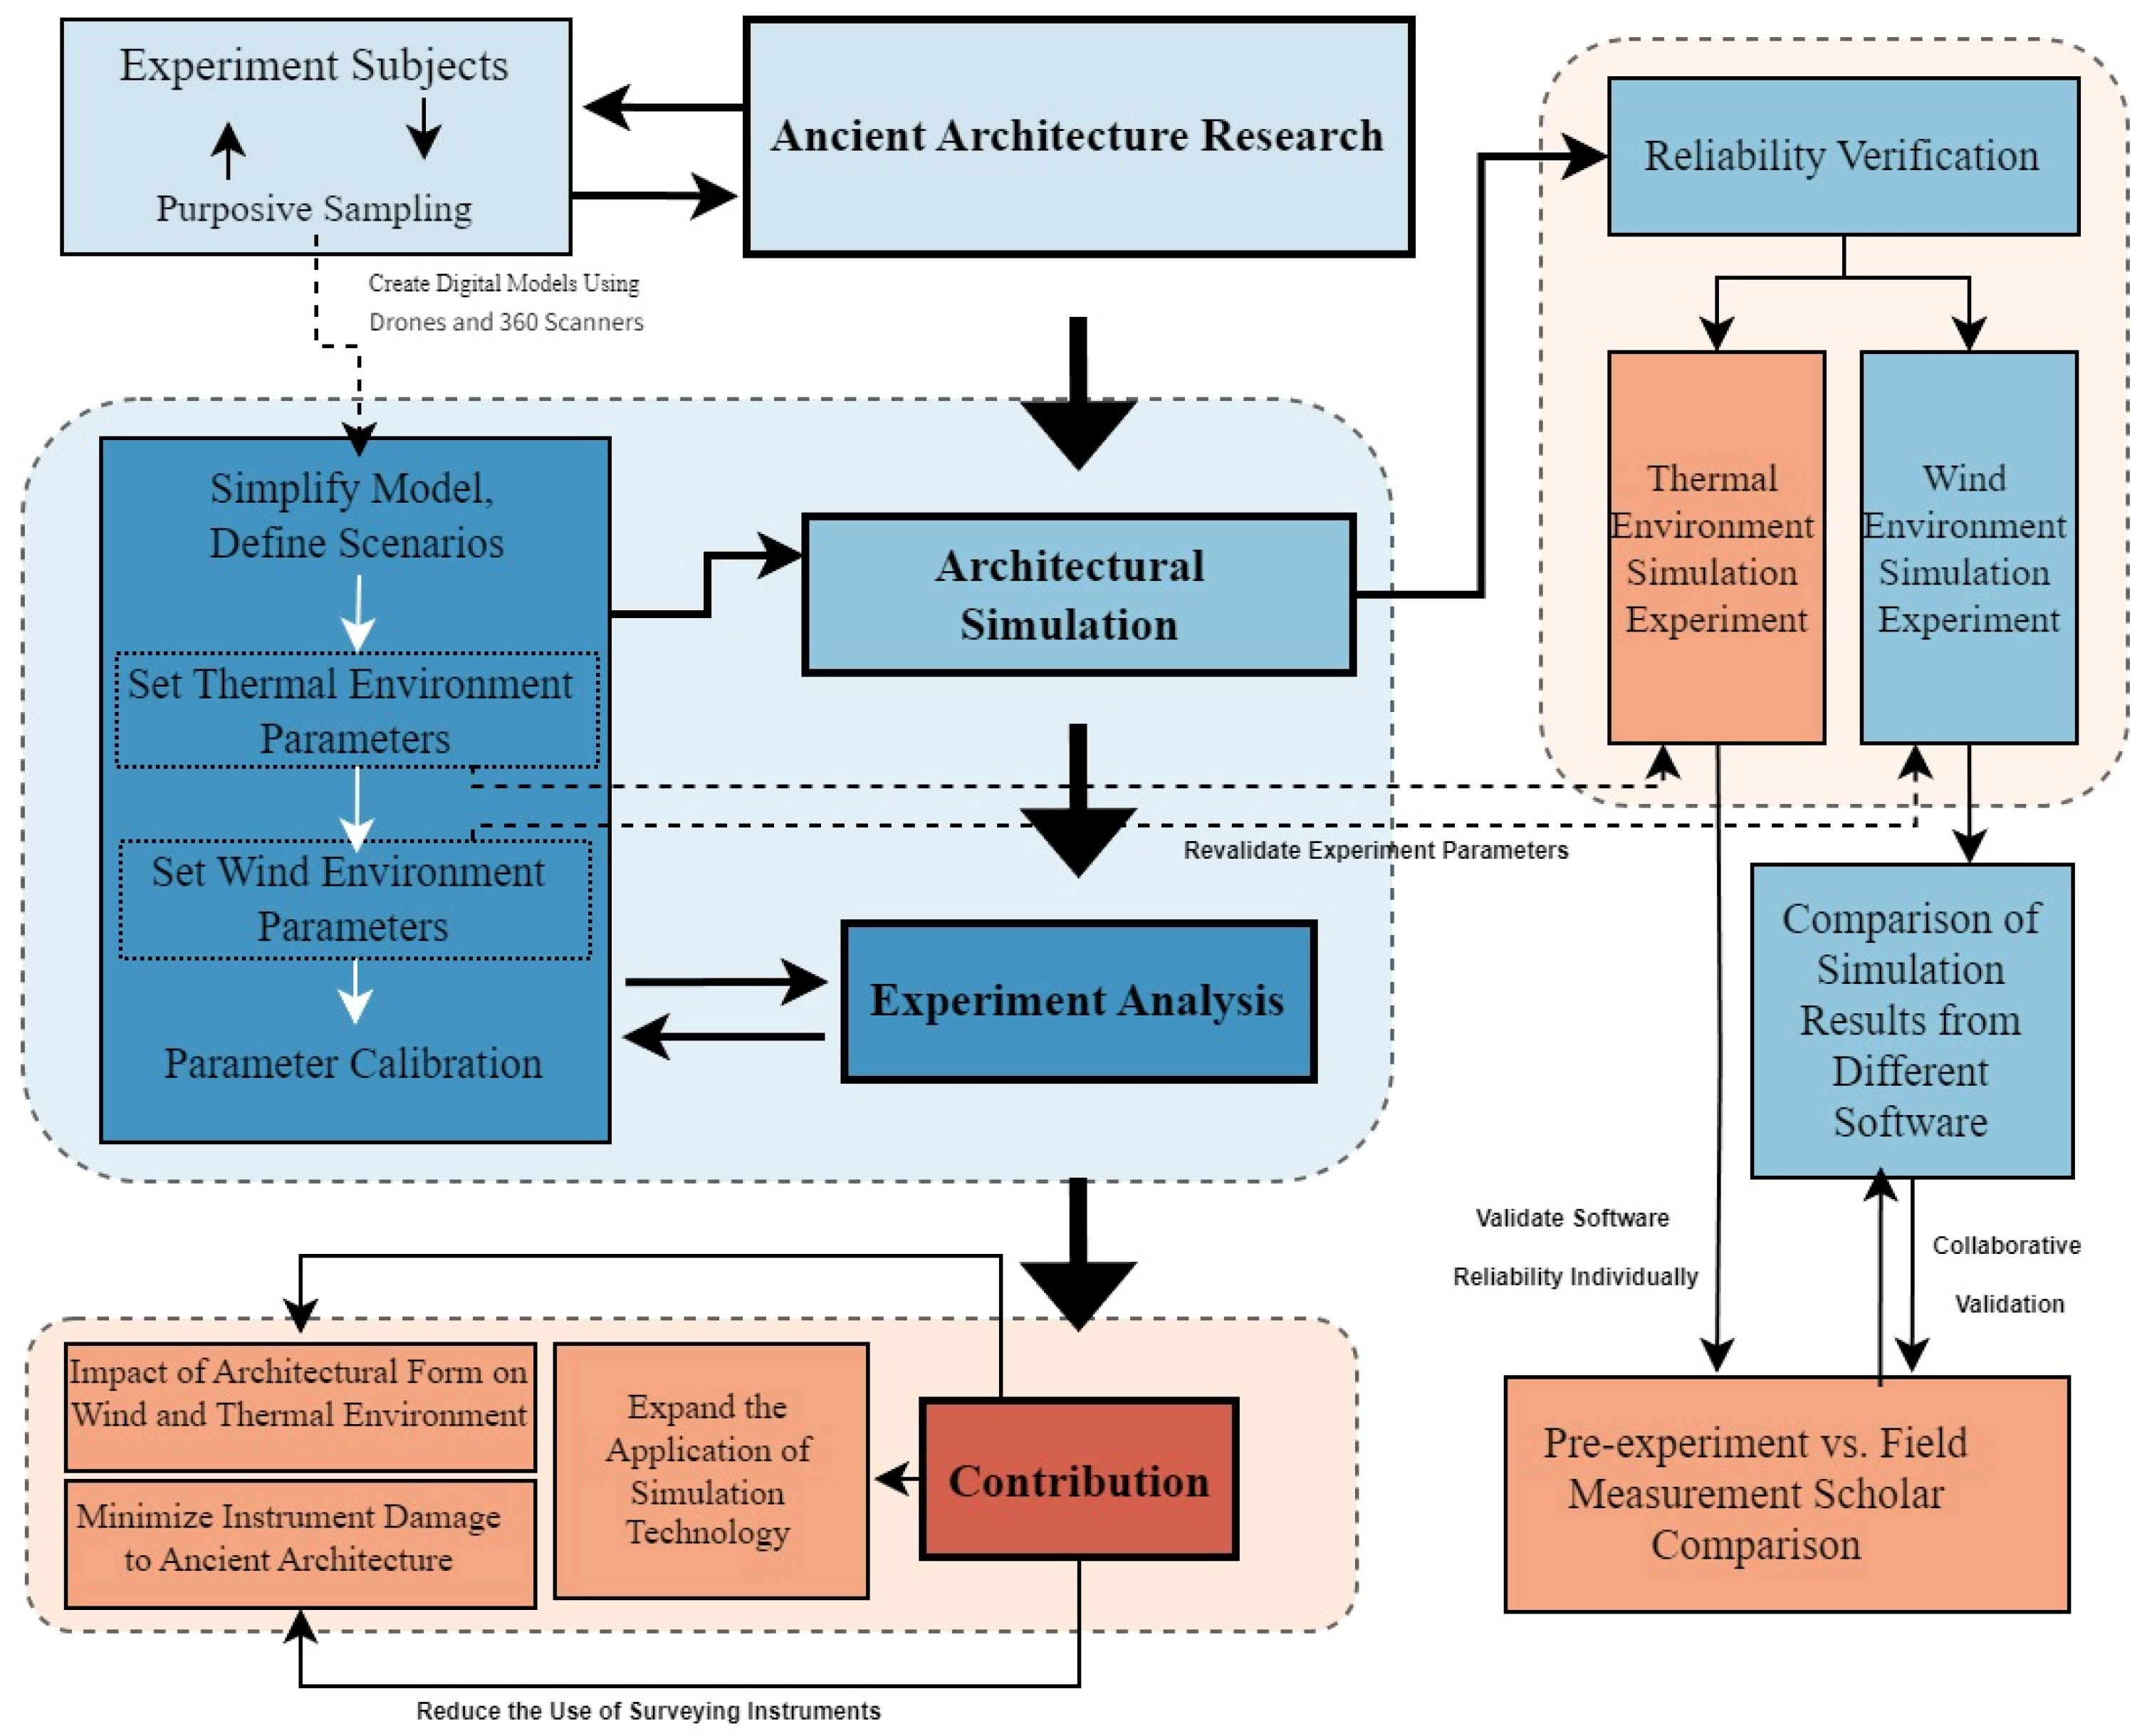
In this study, a simulation analysis of typical spatial layouts of temples is conducted. The study comprises four main stages: the fundamental research phase, the experimental simulation phase, the experimental validation phase, and the result analysis phase, as outlined in
Figure 1. The structure of the main text is as follows:
Section 2 introduces the selected simulation software, input parameters, and evaluation criteria, establishing the methodological foundation of this study.
Section 3 presents and describes the simulation results.
Section 4 discusses the results and analyzes their practical implications, while also providing suggestions for future research.
Section 5 summarizes the main findings of the study. The key innovations of this study include:
Simulating the thermal and wind environments of typical spatial layouts to explore the interaction between the wind and thermal environments.
Conducting a comparative analysis of the advantages and disadvantages exhibited by various spatial layouts, and proposing strategies for their application in modern design.
The research conclusions provide new insights for the deepening and improvement of modern architectural design concepts. They also offer scientific foundations for the renovation and expansion of ancient buildings, while expanding the application field of emerging technologies such as building simulations.
2. Simulation Analysis Method
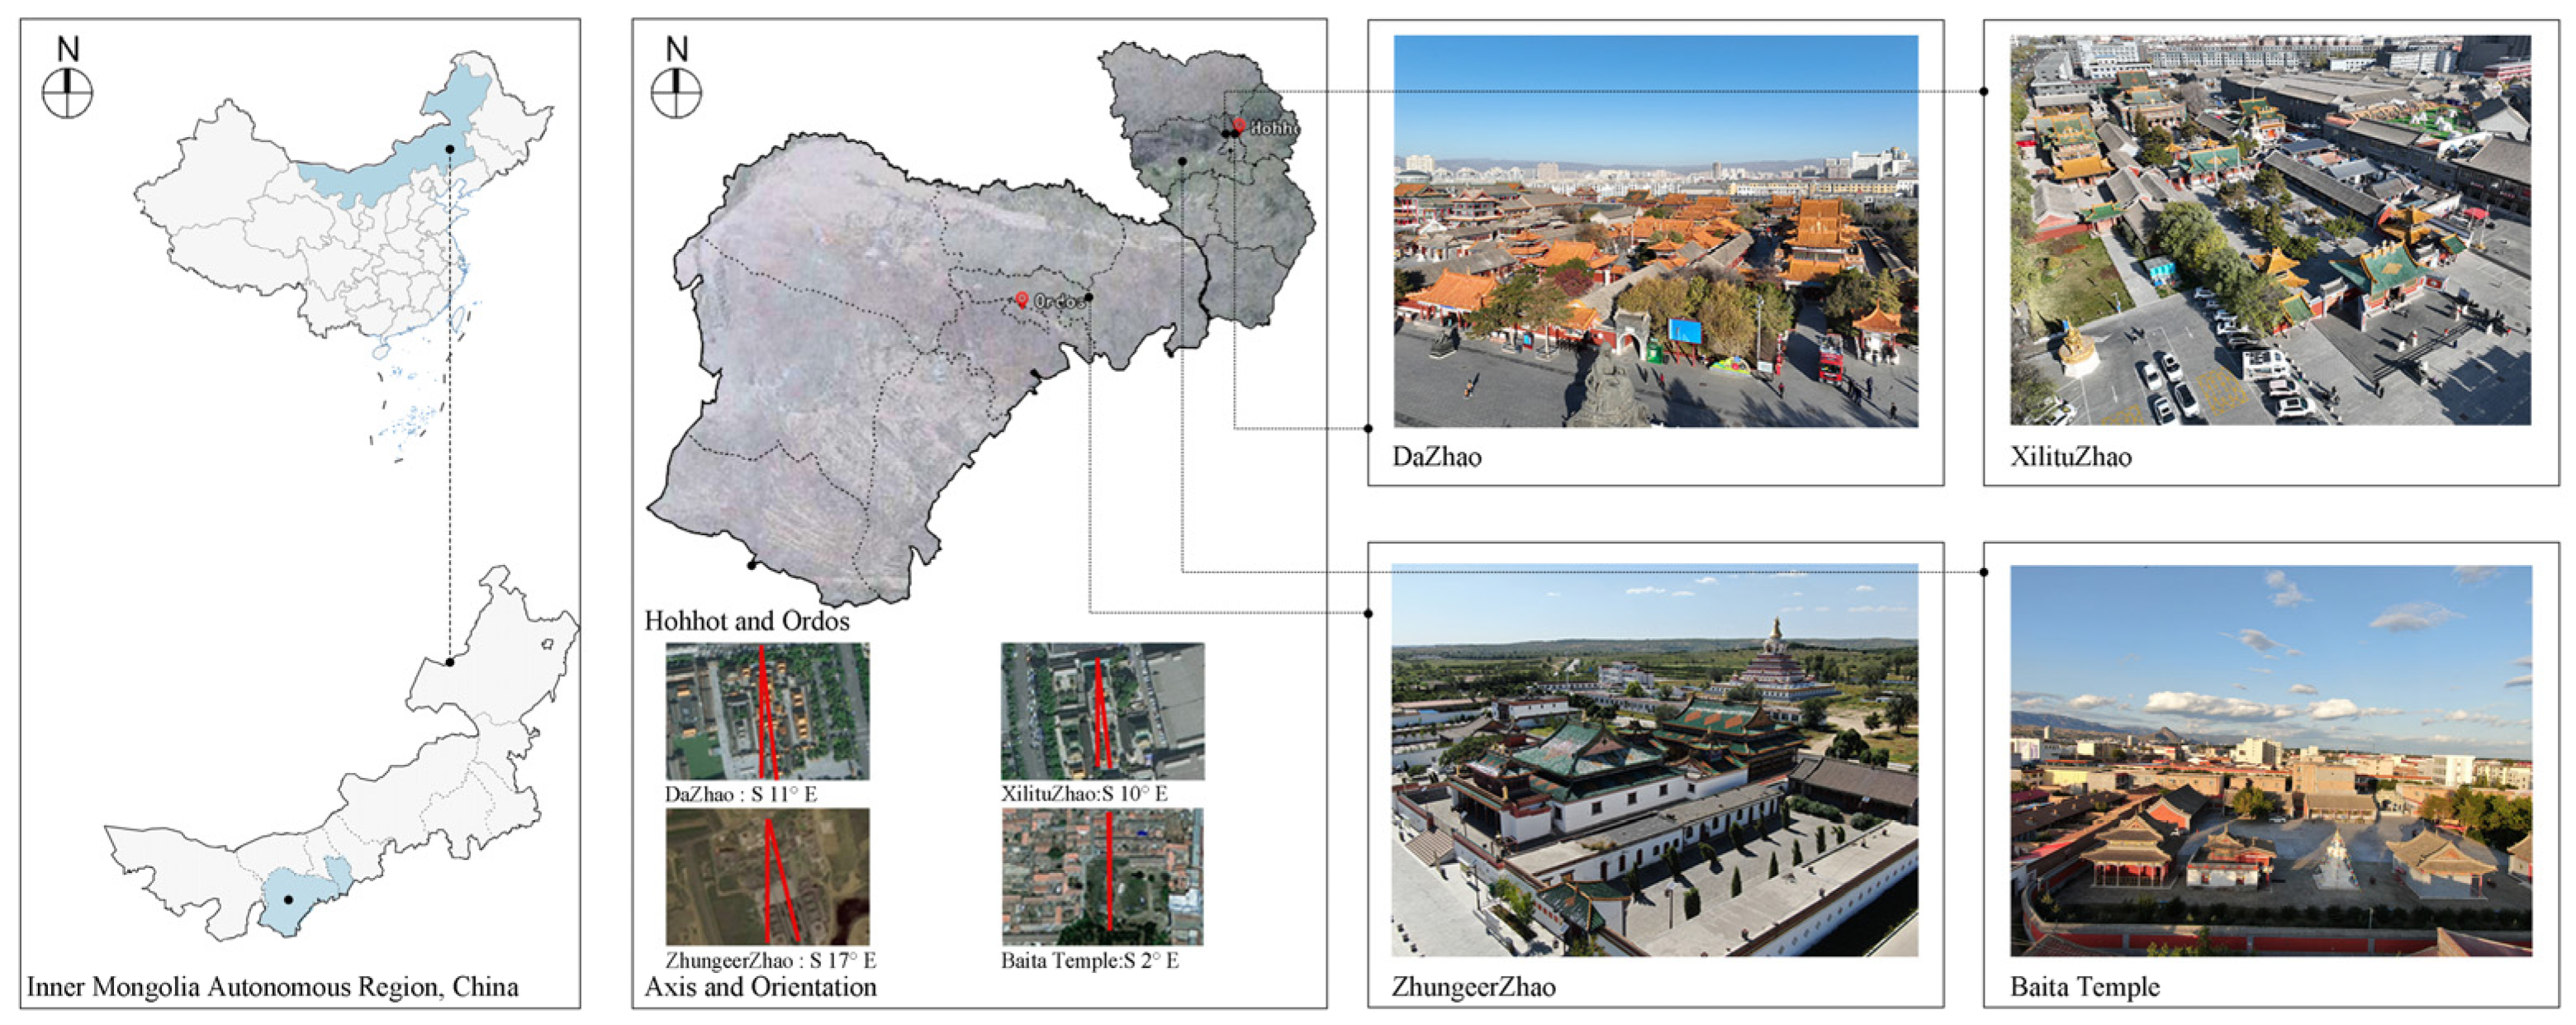
Sino-Tibetan temples are mainly distributed in the central and western plains of Inner Mongolia, which fall within the cold climate zone. Influenced by historical and cultural elements, these temples have developed a unique spatial layout. In cold climate zones, winter is characterized by low temperatures, where indoor thermal conditions are primarily affected by insulation systems rather than spatial layout. Additionally, doors and windows remain closed throughout the winter. In contrast, summer has a mild climate, high visitor flow, and strong natural winds. The spatial layout of these temples eliminates the need for mechanical ventilation and cooling systems while creating a comfortable wind-thermal environment. Therefore, this study focuses on summer simulations. Furthermore, as the building materials are essentially the same, material differences were not considered in this simulation.
Ladybug Tools is a highly integrated environmental simulation platform that includes core modules such as Honeybee and Butterfly, and is widely used for the combined analysis of thermal and wind environments in buildings. Honeybee supports multi-dimensional simulations including thermal comfort, energy consumption, and radiation, while Butterfly, built on OpenFOAM 2.3.0, enables high-precision wind environment modeling. It can accurately evaluate wind speed distribution, ventilation paths, and wind pressure characteristics around buildings, making it well-suited for complex terrains or traditional architectural clusters. The tool is particularly effective for modeling complex or non-standard building types, such as traditional Sino-Tibetan temples, as it allows flexible control over building geometry, construction materials, occupant behavior, and system parameters, ensuring targeted and accurate simulations. Compared with commercial software like Autodesk CFD or DesignBuilder—which require cross-platform operations—Ladybug Tools enables integrated thermal and wind environment simulations within a unified modeling environment, avoiding errors and inefficiencies caused by data conversion or redundant input. Its open-source nature, transparency, and strong visualization capabilities make it especially suitable for research applications and performance analysis of traditional architecture, where high precision and modeling flexibility are essential.
2.1. Simulation Objects
The evolution of Sino-Tibetan temples in the grassland region can be divided into four historical periods: the “Early Period—Reform or Borrowing,” the “Development Period—Dominated by Han Style,” the “Mature Period—Dominated by Tibetan Style,” and the “Late Period—No Innovations or Changes” [
43]. This study focuses primarily on the second and third periods, during which architectural forms gradually became more standardized, gradually distancing themselves from the formalistic influences of earlier temple architecture and ceasing to serve as direct representations of the ideal world [
44]. The architecture of this period is primarily distributed across the central and western plains of Inner Mongolia, specifically within the geographical range of Hohhot and Ordos. And the main halls of these four temples all face south, with a deviation of no more than 20° due to the influence of the terrain. (
Figure 2). Under the combined influences of geography, climate, and functional demands, the architectural form evolved into a “three-section” structure, with a spatial sequence consisting of “porch—scripture hall—Buddha hall” [
45]. However, this evolution did not entail complete reconstruction but rather the extension of the originally independent Buddha hall into a three-section design [
46]. Consequently, different methods of expansion led to various expressions of the main hall structure. Based on extensive field research and purposive sampling, this study categorizes and samples the forms of typical Sino-Tibetan temples in the central and western regions of Inner Mongolia [
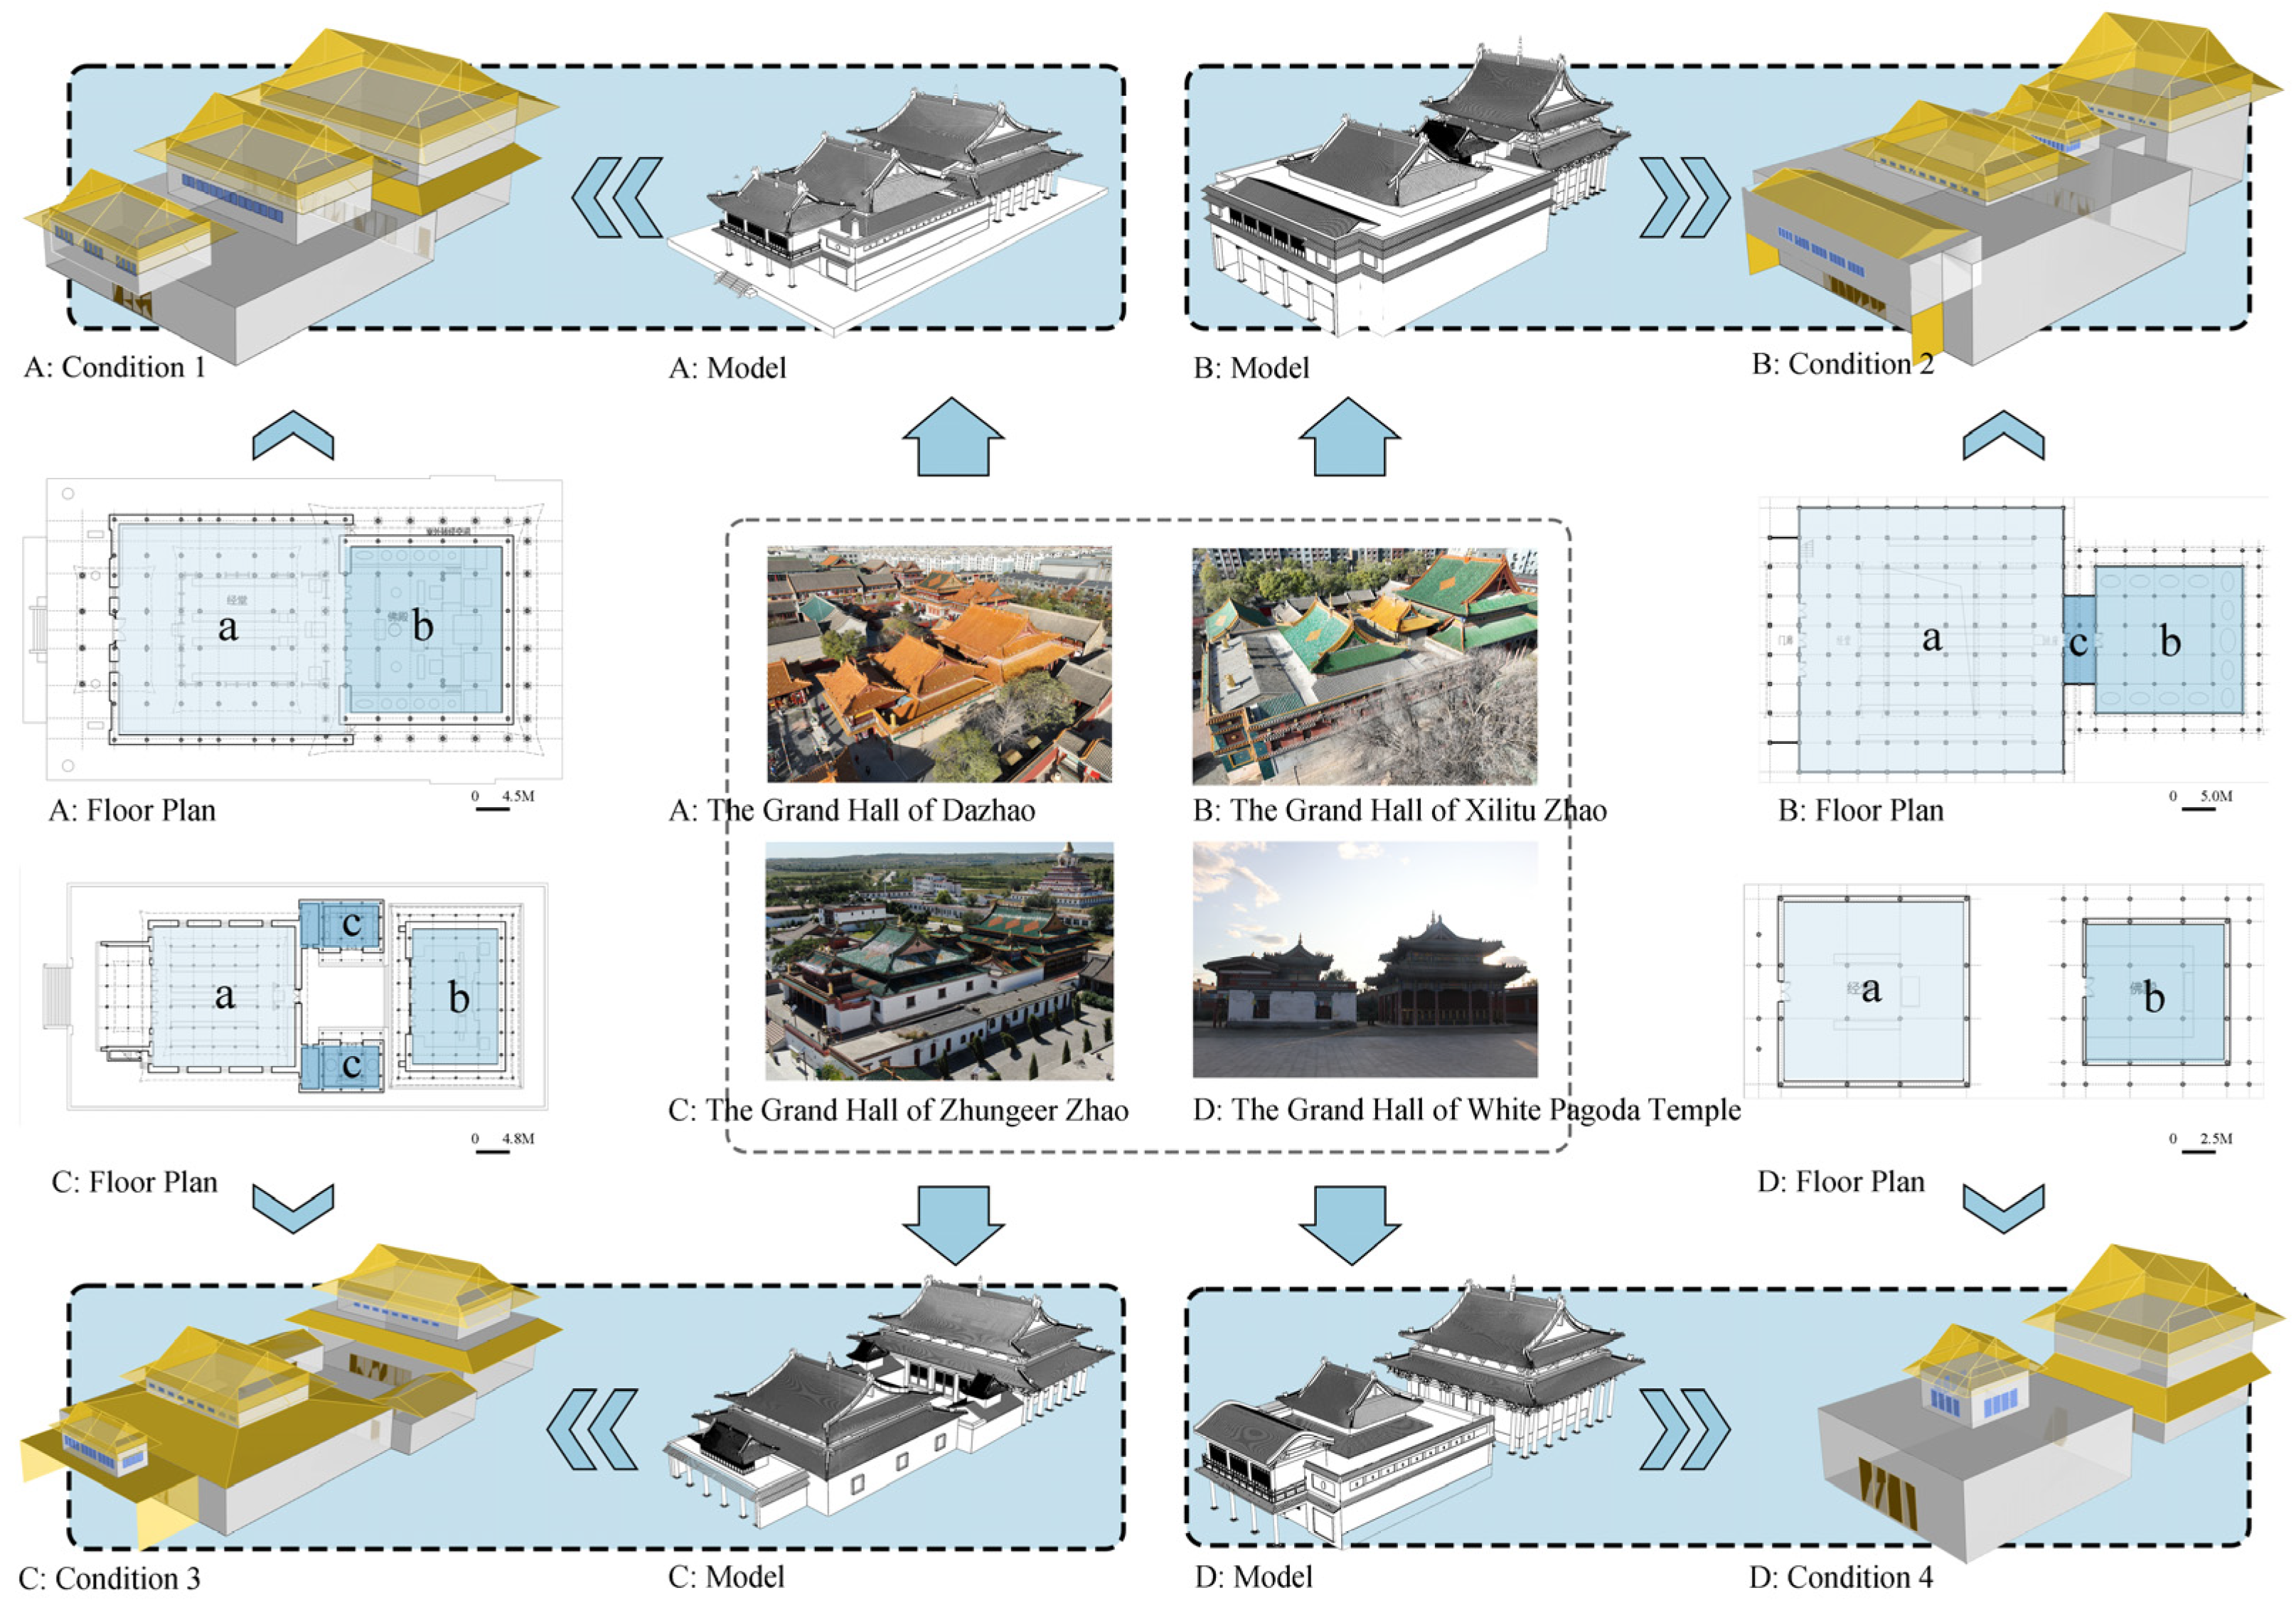
47]. Four typical expansion methods were identified, corresponding to four representative buildings: the DaZhao, which vertically connects the porch, scripture hall, and Buddha hall; the Xili tuZhao, which adds a buffer space between the scripture hall and Buddha hall; the ZhugeerZhao, which incorporates a courtyard between the scripture hall and Buddha hall; and the White Pagoda Temple, where the scripture hall and Buddha hall are arranged separately.
Based on the research of these four temples, simulation models were created using the Honeybee Model for the simulation process. The parameters of these models are derived from simplified real buildings. Since this study is not a case analysis but rather explores the impact of spatial configuration based on representative cases, the slight variation in orientation is not considered. Therefore, all four operating conditions are assumed to face true south. Four operating conditions were established, as shown in
Figure 3. These conditions are primarily used to test the impact of different configurations of space units and the placement of openings in the wind-thermal environment. The specific differences are as follows:
Condition 1: Composed of two connected space units, “a” and “b”. In addition to the main entrance, two small doors are permanently open on the left and right of the connection between “a” and “b”, and a long window is installed on the second floor of both “a” and “b”.
Condition 2: Composed of three connected space units, “a”, “b”, and “c”, where “c” serves as a buffer space connecting “a” and “b”, without any permanently open doors.
Condition 3: Composed of “a”, “b”, and “c”, forming a courtyard-style layout with four space units, where “a” and “c” are disconnected from “b”, representing two independent buildings, each with its own entrance.
Condition 4: Composed of two connected space units, “a” and “b”. The “a” space has doors at both the front and rear, while “b” is also separated and has its own independent door.
The physical parameters of building construction materials need to be reasonably defined based on actual structures. To ensure consistency when analyzing the impact of spatial layout on simulation results, this study adopts averaged and rounded values for the thicknesses of exterior walls, windows, doors, and roofs. Thermal conductivity, thermal transmittance (U-value), and thermal resistance (R-value) are estimated with reference to the Design Standard for Energy Efficiency of Buildings in China. In this study, the exterior wall is a 400 mm thick solid white brick wall with a thermal conductivity of 0.70 W/m·K, resulting in a total thermal resistance of approximately 0.74 m2·K/W and a U-value of about 1.35 W/m2·K. The windows are single-glazed with wooden frames, with a frame thickness of around 40 mm and a glass thickness of approximately 5 mm. Considering the combined thermal performance of both frame and glazing, the U-value is estimated at 5.5 W/m2·K. The doors are 50 mm thick solid wood, with a thermal conductivity of 0.18 W/m·K, giving a total thermal resistance of about 0.45 m2·K/W and a U-value of 2.22 W/m2·K. The roof consists of a wooden structure covered with glazed tiles, simplified as a single material layer with a thermal conductivity of 0.19 W/m·K and a thickness of 0.25 m, resulting in an estimated U-value of 2.0 W/m2·K. These parameters serve as the basis for the thermal input of building components in the simulation, ensuring an accurate representation of heat transfer characteristics.
2.2. Thermal Environment Simulation Evaluation Indicators and Parameter Settings
In this thermal environment simulation experiment, the average building surface temperature and the mean radiant temperature (MRT) experienced by the human body were utilized to evaluate the radiative heat exchange performance of buildings within the thermal environment [
48]. The average building surface temperature is used to assess the differences in heat gain and loss across various facades during thermal exchange and can be directly obtained through simulation or measurement. Mean Radiant Temperature (MRT, commonly denoted as
) is an indicator that describes the environmental radiant temperature perceived by the human body. It represents the average temperature of the long-wave radiant heat received by the body surface from surrounding objects. In an indoor environment, it is determined by the surface temperatures
of all the building’s enclosing structures and the radiation reception ratio of the human body to each surface: the view factor
. The unit is °C, and the specific calculation formula is as follows:
This value represents the environmental radiant temperature perceived by the human body, which can be directly compared in the subsequent experiment. It is also a key parameter in the calculation of PMV.
In this experiment, the Predicted Mean Vote (
PMV) index was employed to assess the indoor thermal comfort conditions of the building. The
PMV model is based on Fanger’s thermal comfort model, which was proposed by P.O. Fanger in the 1970s to predict the average thermal sensation vote of a group of individuals under specific environmental conditions [
49]. The calculation of this index is based on key environmental and physiological parameters, including air temperature, mean radiant temperature (MRT), air velocity, humidity, clothing insulation, and metabolic rate. The calculation process involves metabolic rate (
M), external work (
W), evaporative heat loss (
E), convective heat transfer (
C), and radiative heat transfer (
R). As it cannot be fully expressed by a single formula, its general form can be represented as
The radiative heat R reflects the net radiative heat exchange between the human body and the environment, with units of W/m
2. The calculation of this value requires the use of
(
MRT) from Formula (1), the clothing shape factor
, and the clothing surface temperature
. The specific calculation formula is:
Although the
PMV result is a numerical value, it is not convenient for direct comparison across different conditions. Therefore, it cannot be used directly but needs to be analyzed in conjunction with
PPD.
PPD (Predicted Percentage of Dissatisfied) is calculated based on the
PMV (Predicted Mean Vote) model. It is the predicted percentage of dissatisfied individuals and serves as an important indicator for assessing indoor thermal comfort in buildings. The
PPD value represents the percentage of people who are expected to feel dissatisfied under specific environmental conditions. This indicator is typically used to evaluate how indoor temperature, humidity, air velocity, and other factors affect people’s comfort. The calculation formula is as follows:
Based on the evaluation indicators outlined above, it is necessary to set parameters according to the characteristics of Sino-Tibetan Temples. The Metabolic Rate is a key physical parameter, input into the thermal comfort model in Ladybug, representing the heat generated by the human body. In Sino-Tibetan Temples, visitors typically engage in light walking and other low-intensity activities; therefore, the metabolic rate is generally set at 120 W/m2, based on the input parameter standards of the Ladybug simulation software and determined in accordance with the typical activity patterns observed on site. Clothing Insulation and the Clothing Correction Factor represent the thermal insulation provided by clothing and its adjustment under different activity levels. The Clothing Insulation is measured in clo, with 1 clo roughly equivalent to the insulation level of lightweight clothing (e.g., shirts and pants). For summer, it is set to 0.5 clo, and for winter, it is set to 1.0 clo. The primary function of the Clothing Correction Factor (CCF) is to adjust clothing insulation based on different levels of human activity. In this experiment, it is set to the typical value of 1.0, meaning no adjustment is needed. This is because the study subjects are primarily engaged in light physical activities, such as standing and walking, during which the insulation value of clothing remains unchanged and can be directly used in PMV calculations. Environmental parameters such as Air Temperature, Radiant Temperature, Air Velocity, and Relative Humidity, which fluctuate continuously, need to be extracted from weather data using Ladybug’s weather data analysis tool, and then imported into the experiment.
2.3. Wind Simulation Evaluation Criteria and Parameter Settings
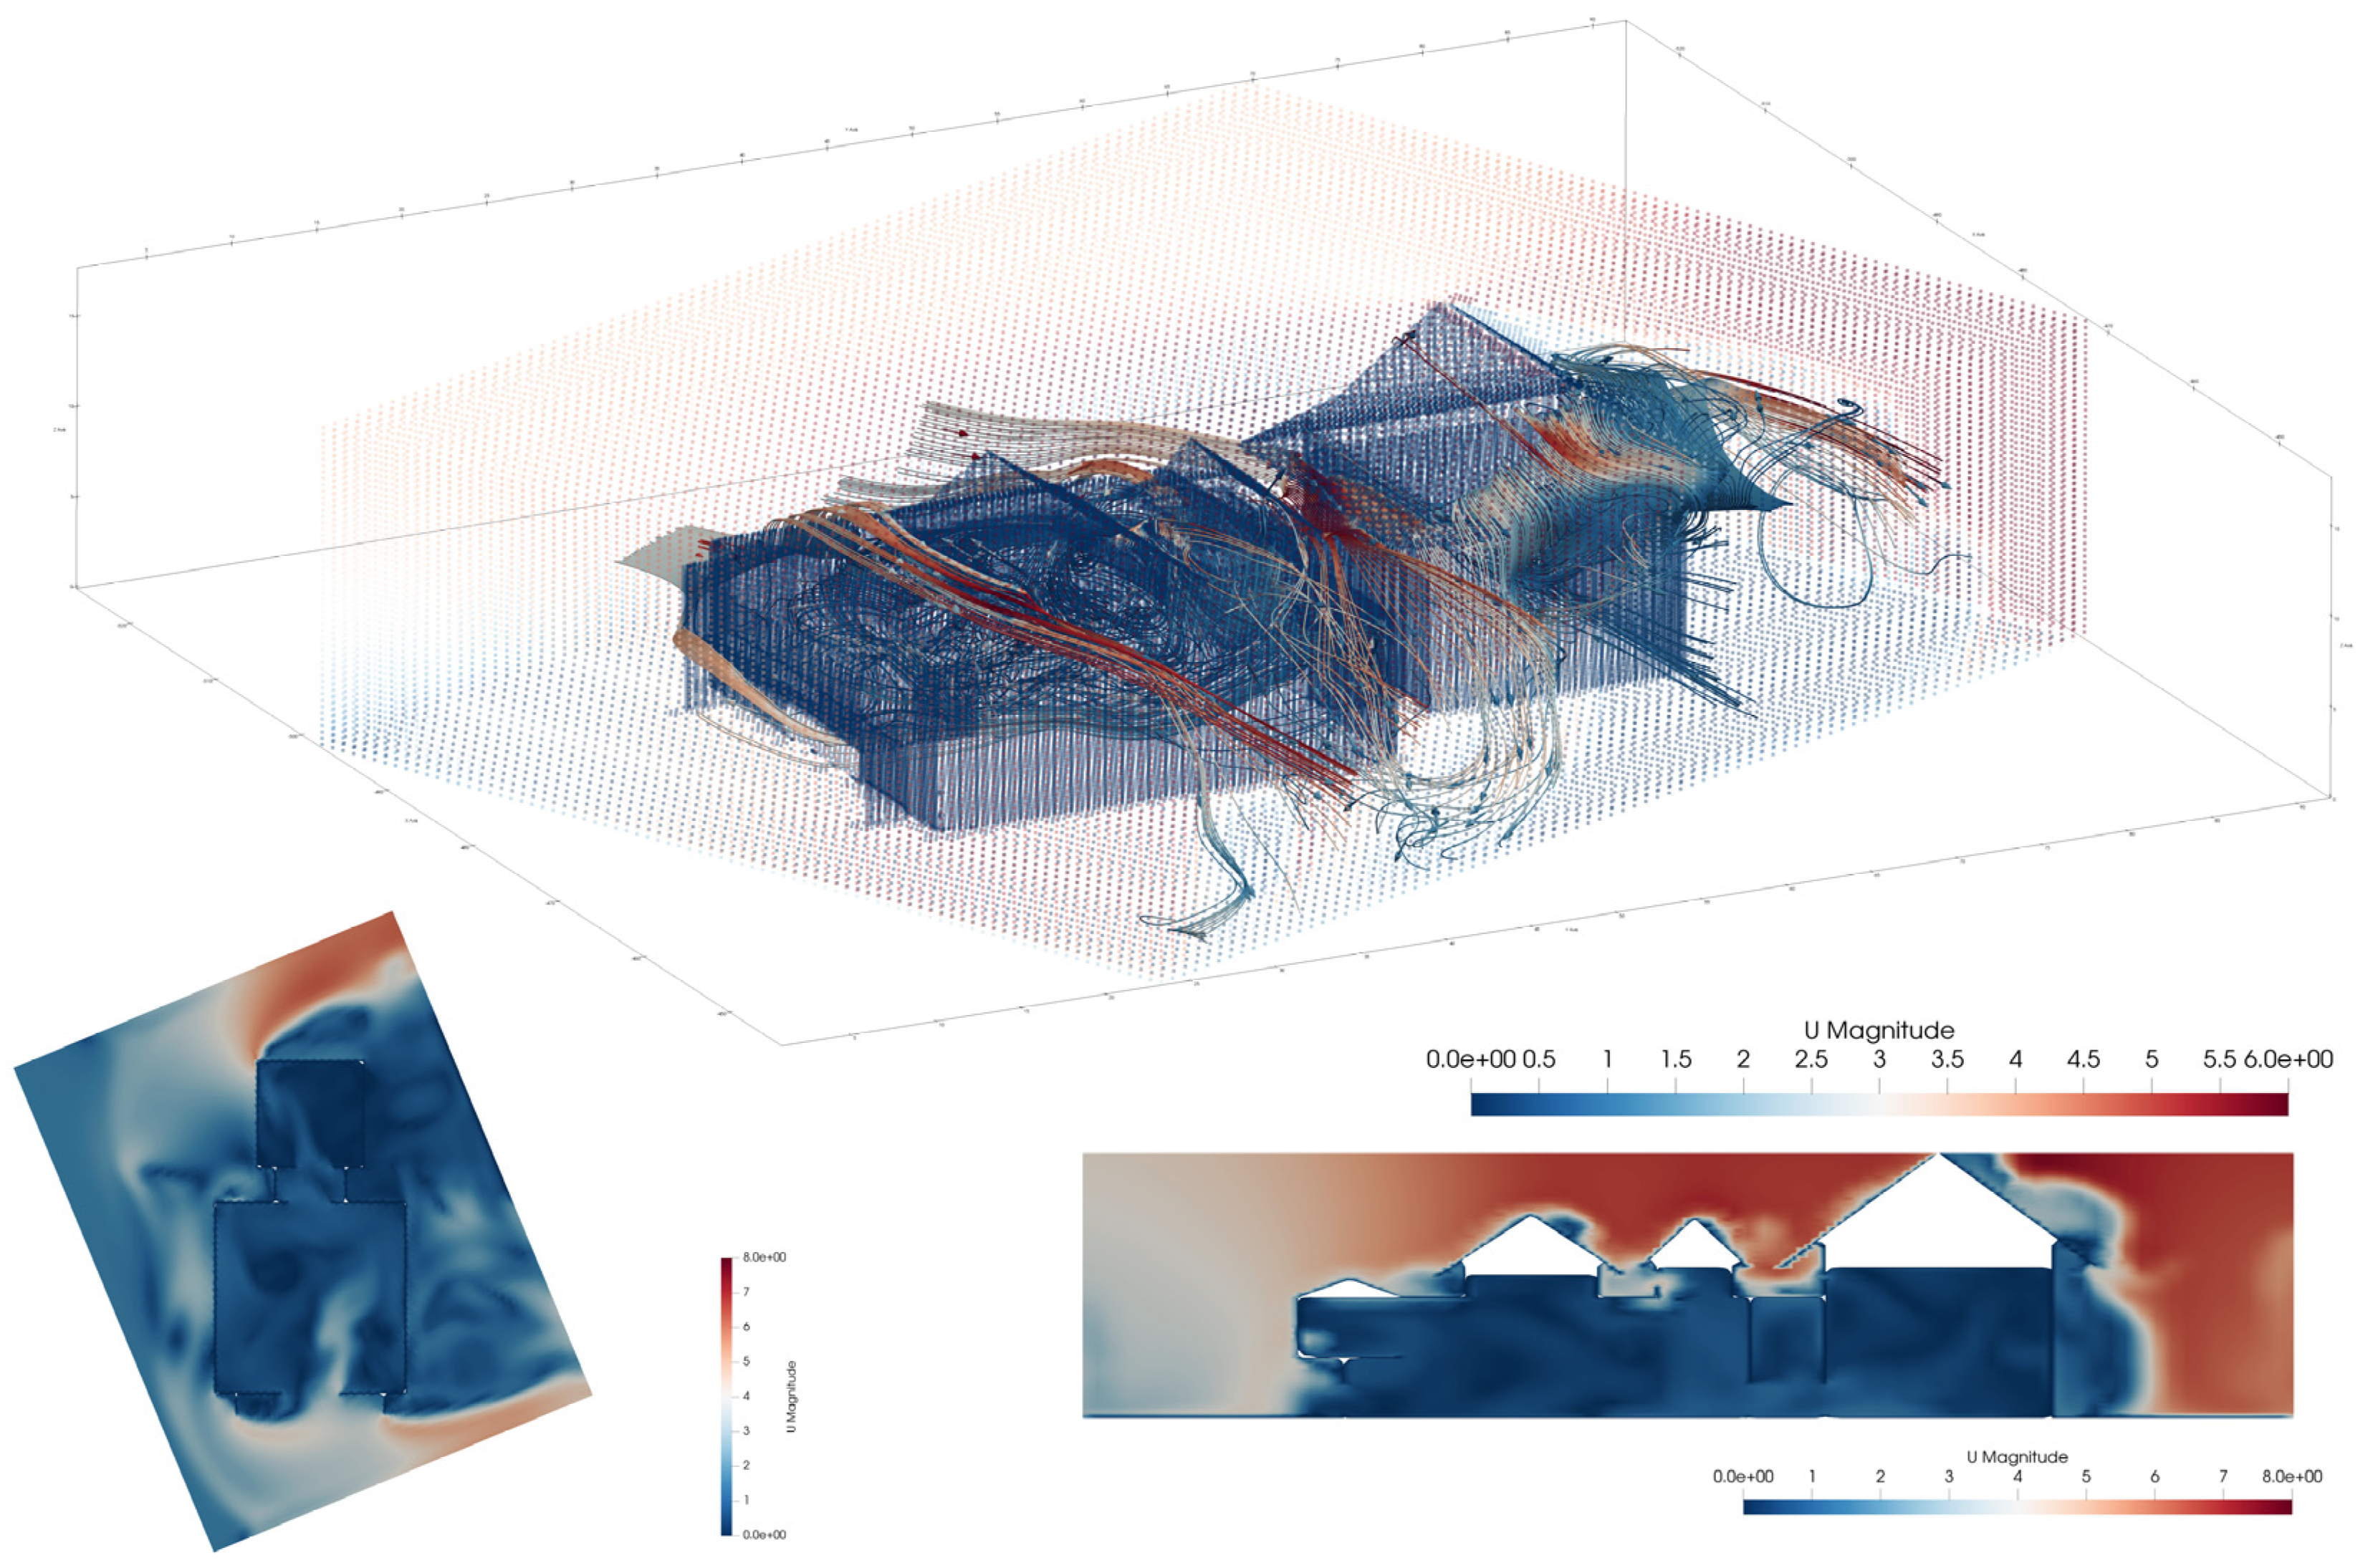
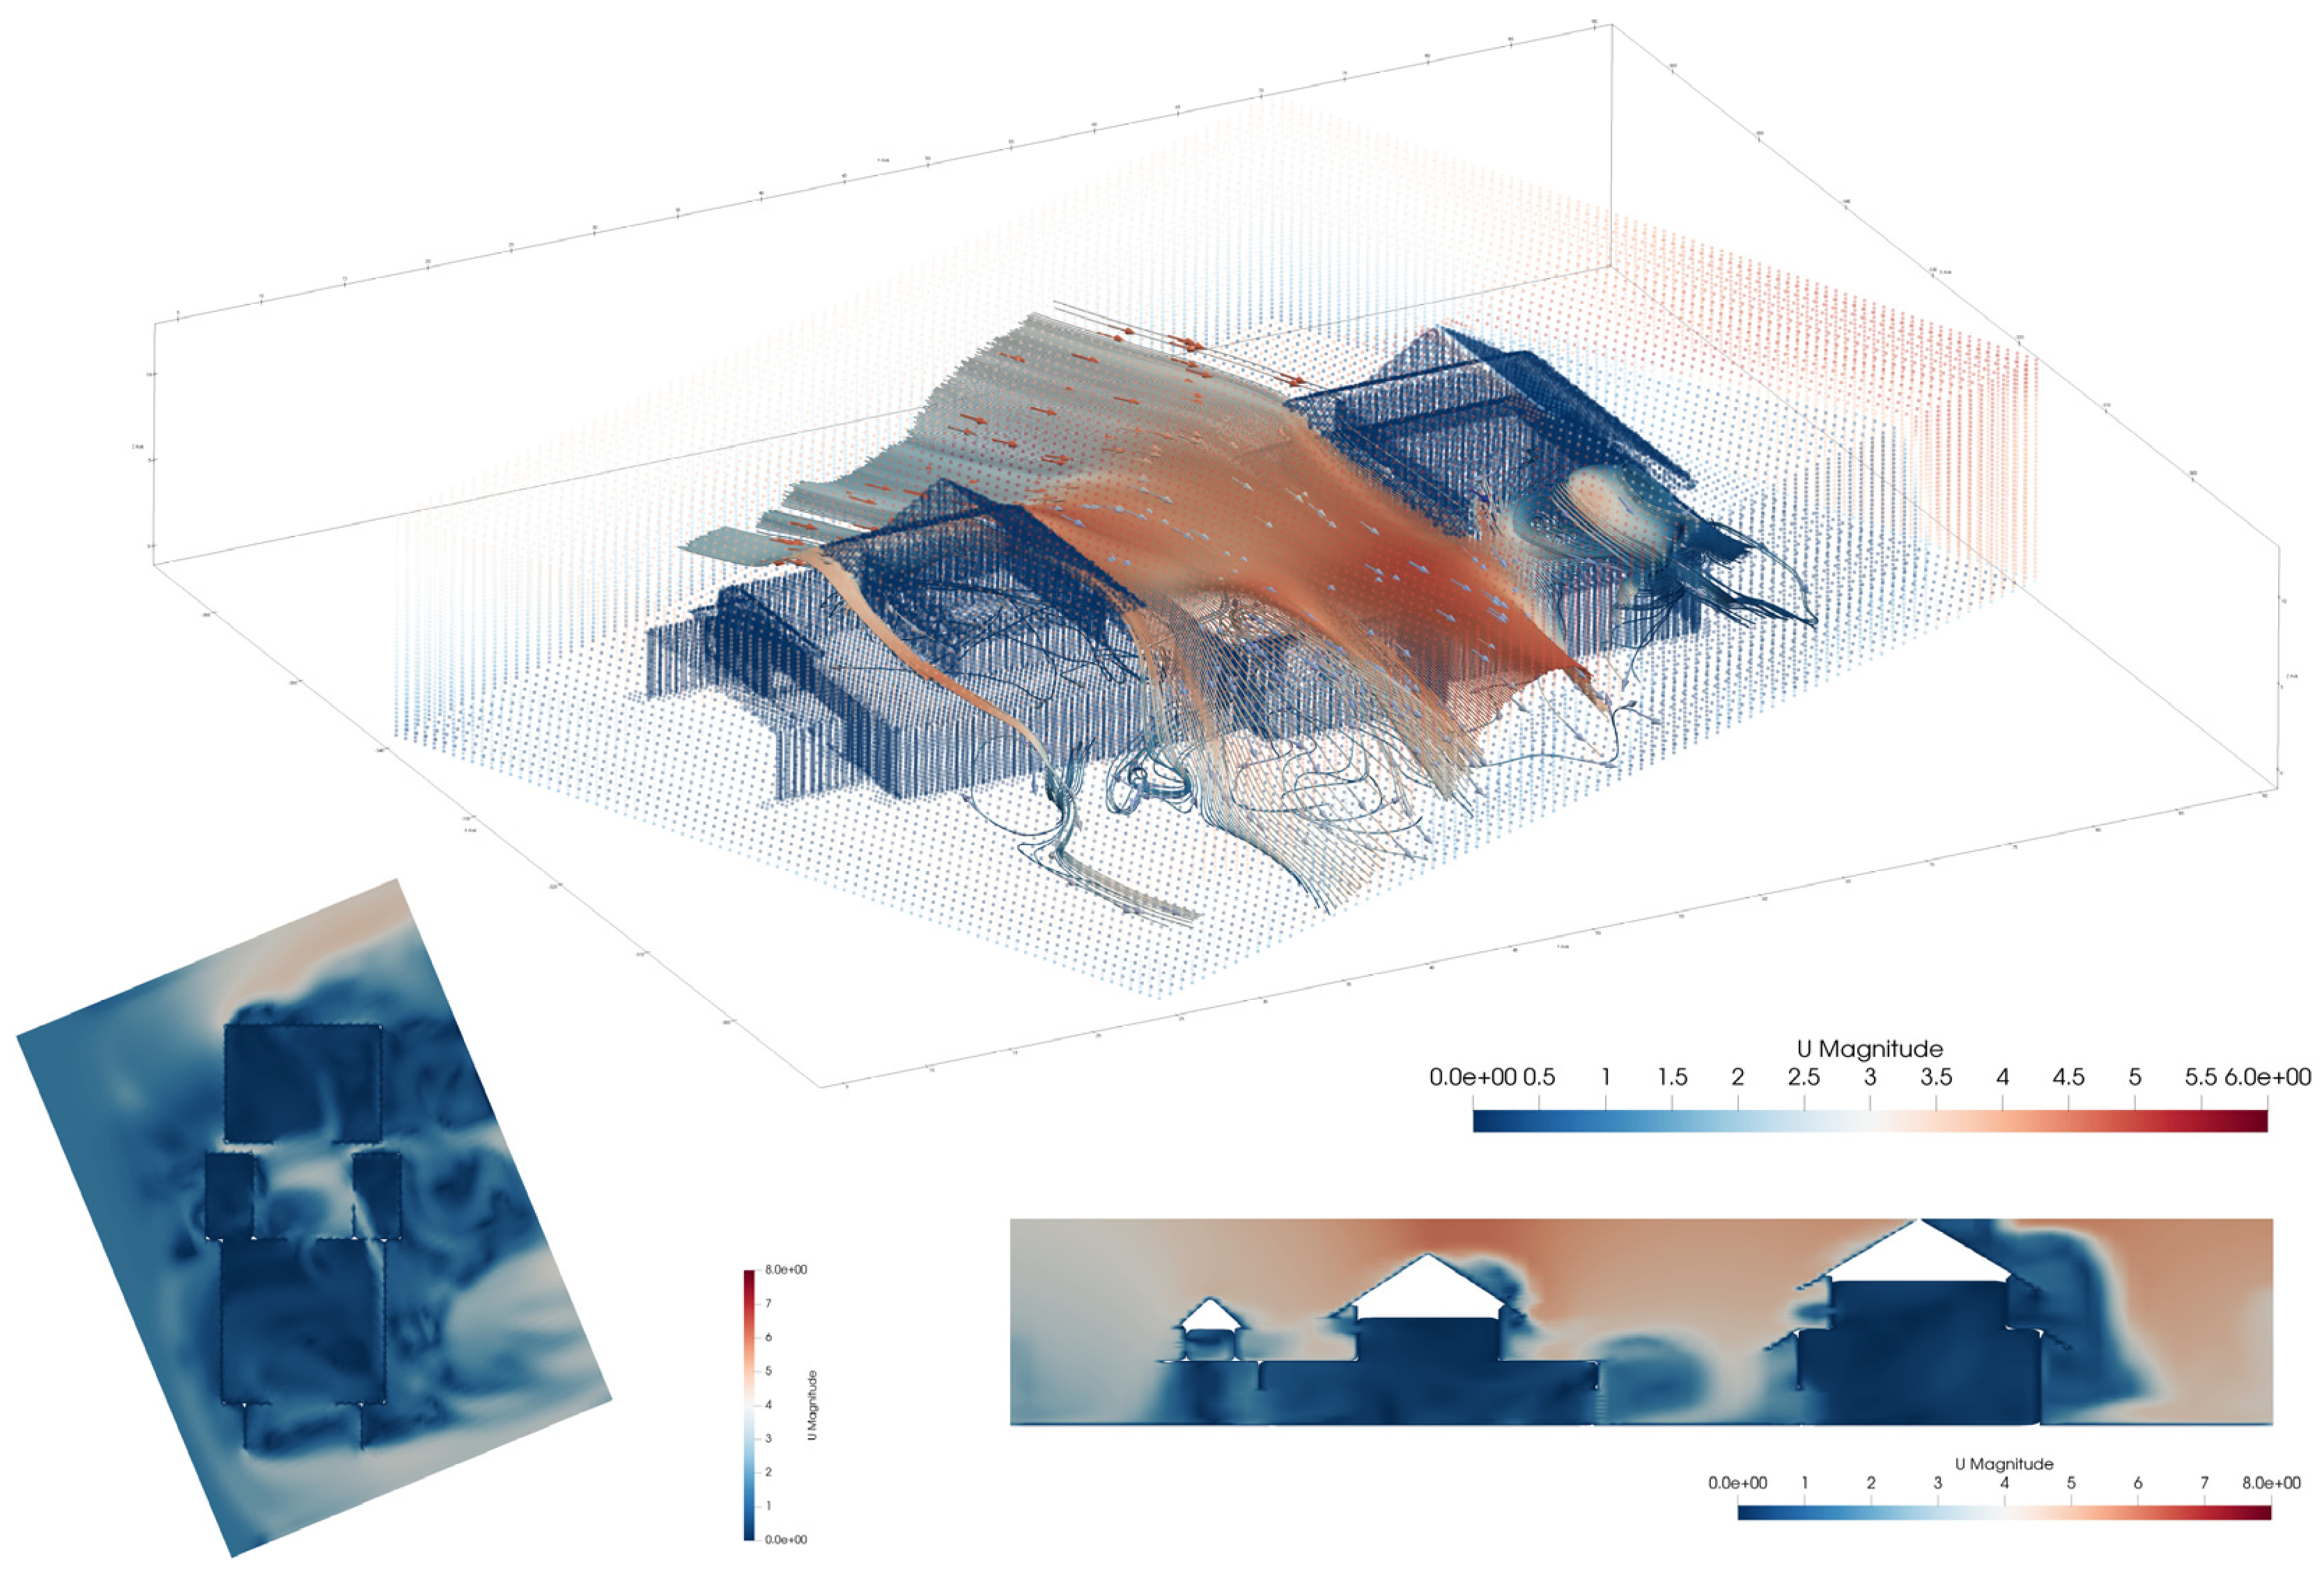
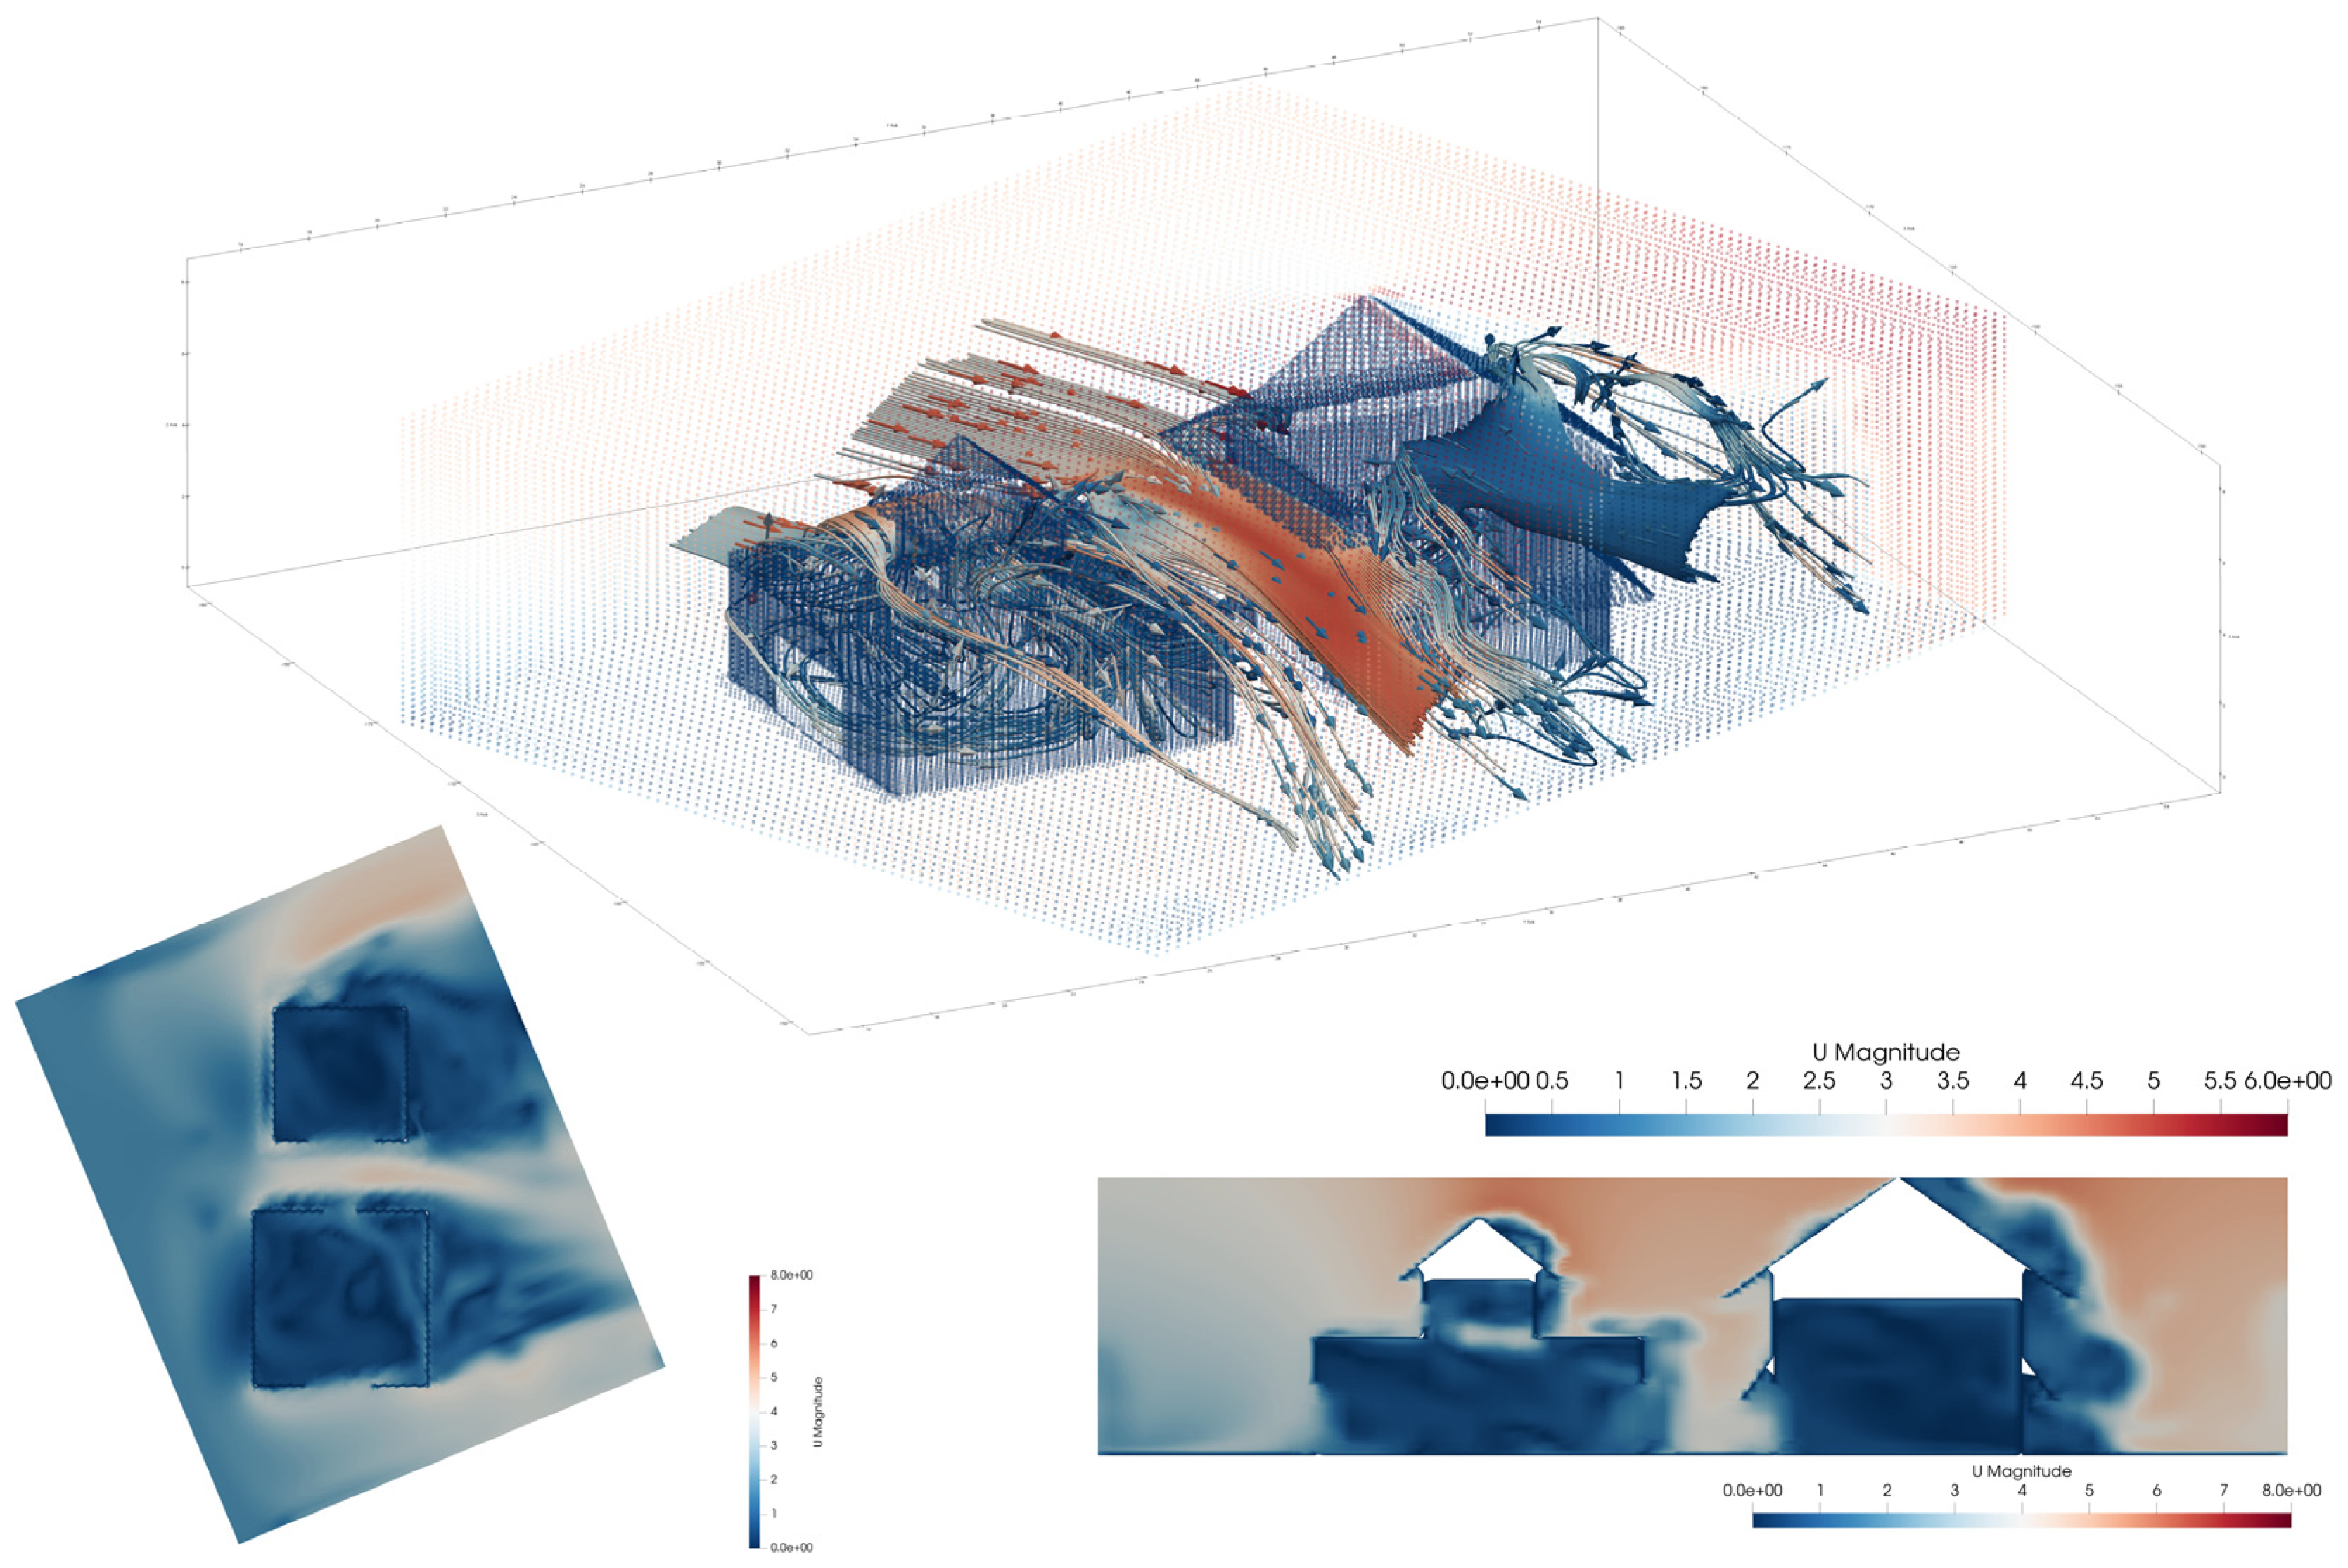
In the wind environment simulation using Ladybug 1.7.0 & Butterfly 0.0.05, the evaluation criteria primarily rely on visualized 3D wind field models to observe wind speed and airflow distribution inside and outside the building, assessing the building’s ventilation capacity. Streamlines can also be employed to trace the airflow through the building, helping to identify potential wind corridors, airflow vortices, and other related phenomena.
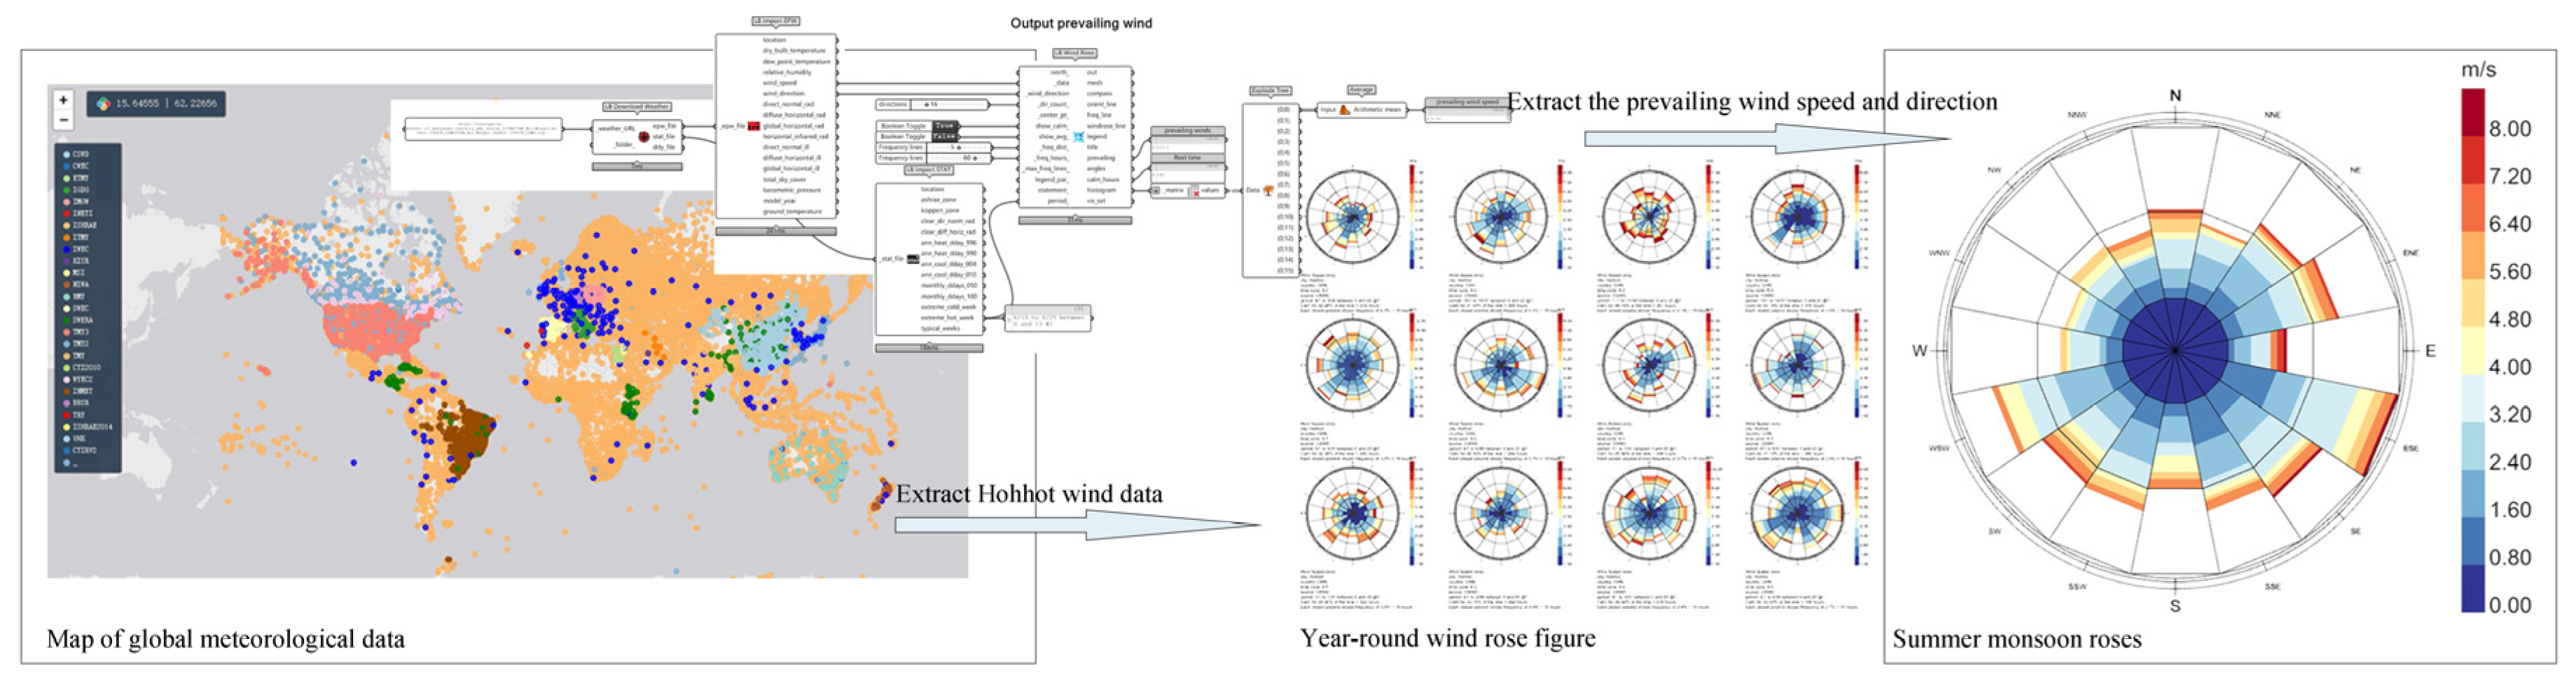
The first parameter to be set in this experiment is the wind field data, which includes wind direction and wind speed. The data is sourced from EPW files, which contain long-term meteorological records collected from weather stations worldwide. In the simulation process, in addition to the spatial configuration, consistency of parameters must also be ensured. The research background of this study is the Han-Tibetan style temples widely distributed in the Inner Mongolian grassland region, so the meteorological data of Hohhot is the most appropriate for the simulation. The prevailing wind direction in summer is 112.5°, with a wind speed of 3.25 m/s, as shown in
Figure 4. Prevailing wind speed refers to the most frequently occurring wind speed in a specific region and time period, representing long-term climatic conditions rather than short-term or extreme weather events. In contrast, instantaneous wind speed, extreme wind speed, and average wind speed exhibit greater fluctuations and are significantly influenced by local factors. Additionally, while variations in wind direction may affect local wind environments, the prevailing wind direction is generally the dominant factor in most building wind environment studies. Since actual wind directions are not uniformly distributed, even significant changes in wind direction do not drastically alter the overall ventilation pattern. Therefore, using prevailing wind speed and direction in simulations provides a more accurate representation of the local wind environment and enhances the applicability of the research.
The second parameter for the wind environment simulation is the selection of the turbulence model. Ladybug & Butterfly offers three basic turbulence models: the Laminar Model, the LES Model, and the RAS Model. The differences among these models are summarized in
Table 1. The Laminar Model is suitable for low-speed flow or simple flow fields, such as small spaces or basic indoor airflow. The LES Model (Large Eddy Simulation) is ideal for simulating complex turbulent flows, such as wind fields around buildings. It provides higher simulation accuracy but requires greater computational resources. The RAS Model (Reynolds-Averaged Simulation) is appropriate for most conventional engineering applications, such as building wind environments and indoor airflow analysis. It strikes a balance between computational accuracy and efficiency. In the simulation of the wind environment of the Sino-Tibetan Temples, the Reynolds-Averaged Turbulence Model (RAS Model) is a suitable choice. It provides sufficiently accurate results while maintaining computational efficiency, making it particularly well-suited for simulating the wind environment of conventional buildings like Sino-Tibetan Temples.
After determining the turbulence model, the simulation grid must also be established. For the RAS model, a relatively coarse grid can be used, as long as it is capable of capturing the characteristics of the turbulent boundary layer. Specifically, the flow around the building requires a finer grid resolution in the boundary layer region to accurately capture velocity gradients and turbulence intensity. Near the exterior walls of the building, the grid should be refined to ensure the resolution is sufficient. The size of the grid’s first layer is typically adjusted to satisfy the y+ value requirement. The y+ value refers to the dimensionless distance from the wall to the first grid point. Different turbulence models have varying y+ value requirements. For instance, the k-ε model and the k-ω model are two refined turbulence models based on the RAS Model framework. The k-ε model is suitable for steady-state flows, particularly external flows (such as atmospheric winds around buildings) or regions farther from walls or solid surfaces. It is particularly effective in simulating large-scale turbulent structures, such as wind fields around buildings and outdoor air movement. The advantage of the k-ε model in this context lies in its relative simplicity and good convergence, making it ideal for large, uniform regions with minimal changes in flow characteristics. It performs well in modeling areas outside the turbulent boundary layer (further from the building surface), where fine details near the wall are less critical. Consequently, for the wind field around the building in this simulation, the k-ε model was chosen, with the y+ value set to 35, while the turbulence near the building walls was modeled using the k-ω model, with the y+ value set to 0.8.
2.4. Parameter Correction and Experimental Reliability Verification
Based on the experimental parameters established in the previous section, a simulated wind environment field was created (
Figure 5). To accurately capture the wind speed and turbulence around the building, the wind environment field must be as large as possible while ensuring simulation accuracy [
50]. By continuously adjusting and optimizing the grid density, the final grid density was set to 80 × 80 × 50, resulting in a total of 32,000 grid cells. The two long edges were designated as the inlet and outlet boundaries, with a wind speed of 3.25 m/s, while the bottom and the building were set as solid boundaries.
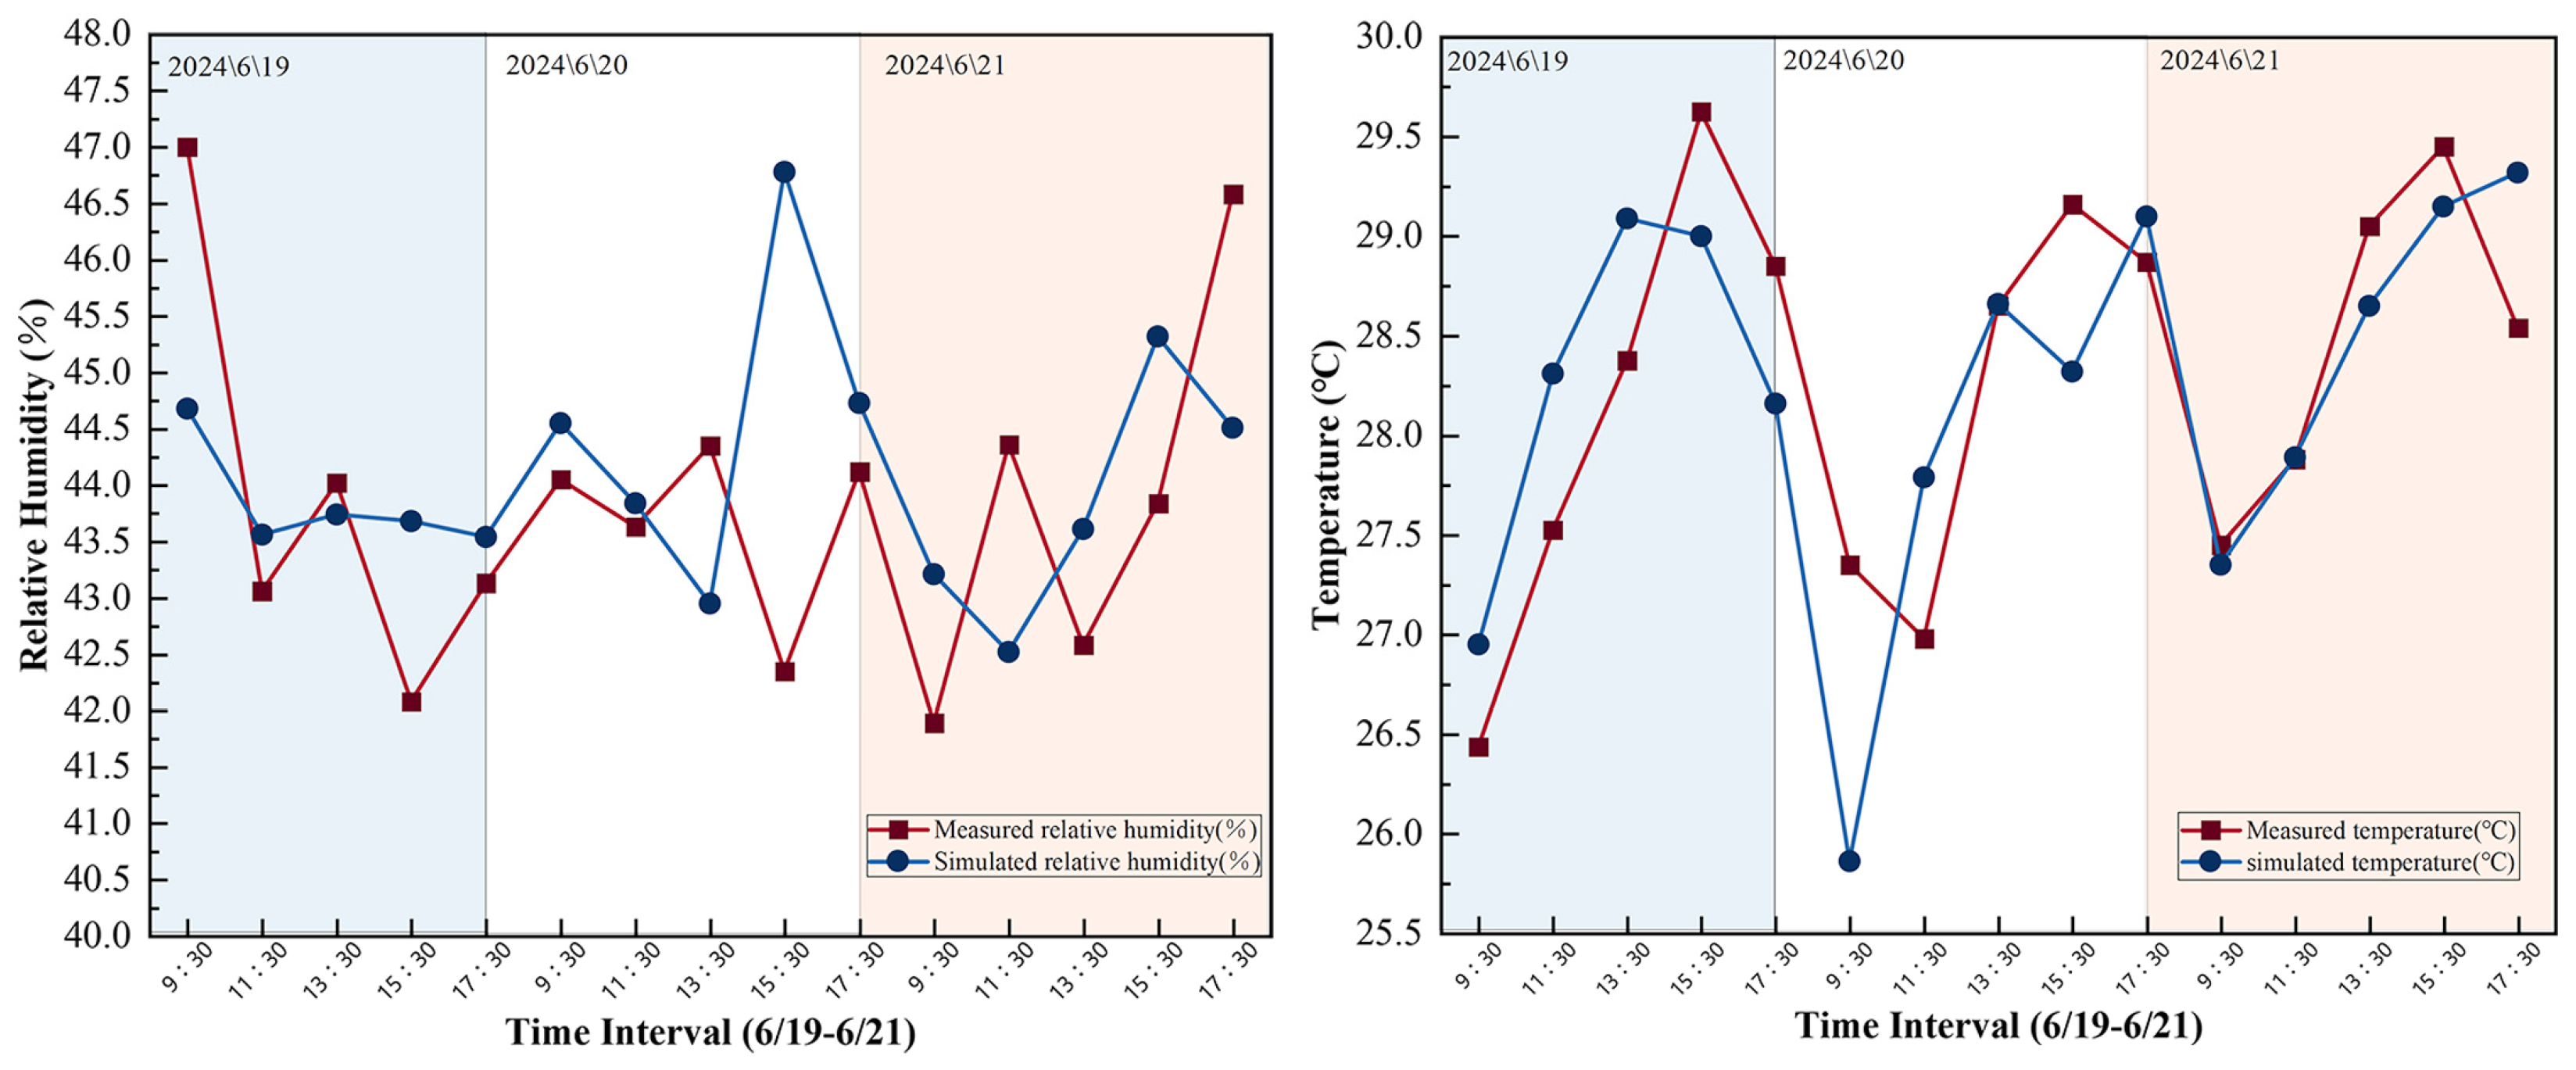
In this experiment, the reliability of the software was verified by comparing the simulation results with actual measured data. After establishing the first operating condition model, the indoor average temperature and humidity from 9:30 AM to 5:30 PM during the hottest three days of the year (19 June to 21 June) were simulated. Subsequently, on-site measurements were conducted at the same time, using a handheld digital thermohygrometer to record temperature and humidity data every two hours. Measurements were taken continuously for three days, and the average value was calculated. Finally, the simulation results were compared with the measured data (see
Figure 6).
The
RMSE (Root Mean Square Error) metric is used to quantify the error between the simulated values and the actual measured values [
51]. The principle of
RMSE involves calculating the squared error for each data point, and then taking the square root of the average of all squared errors.
RMSE reflects the average level of model prediction error, and there is no fixed standard for its value, but it should be considered in conjunction with the experimental design to determine if it is acceptable. The mathematical expression for
RMSE is as follows:
Using the data from the chart, the temperature RMSE value was calculated: Temperature RMSE = √0.4559 °C ≈ 0.675 °C, and the humidity RMSE value was calculated: Humidity RMSE = √2.9147% ≈ 1.707%. This study focuses on the trend of temperature and relative humidity changes, with a relatively high tolerance for exact numerical accuracy. Therefore, when comparing the two RMSE values to the temperature variation of about 4 °C and the relative humidity variation of about 5% in this experiment, the RMSE values are relatively small, indicating that the error does not affect the observed trends in temperature and humidity in this experiment. Thus, the thermal environment simulation conducted using Ladybug Tools & Butterfly demonstrates a satisfactory level of accuracy.
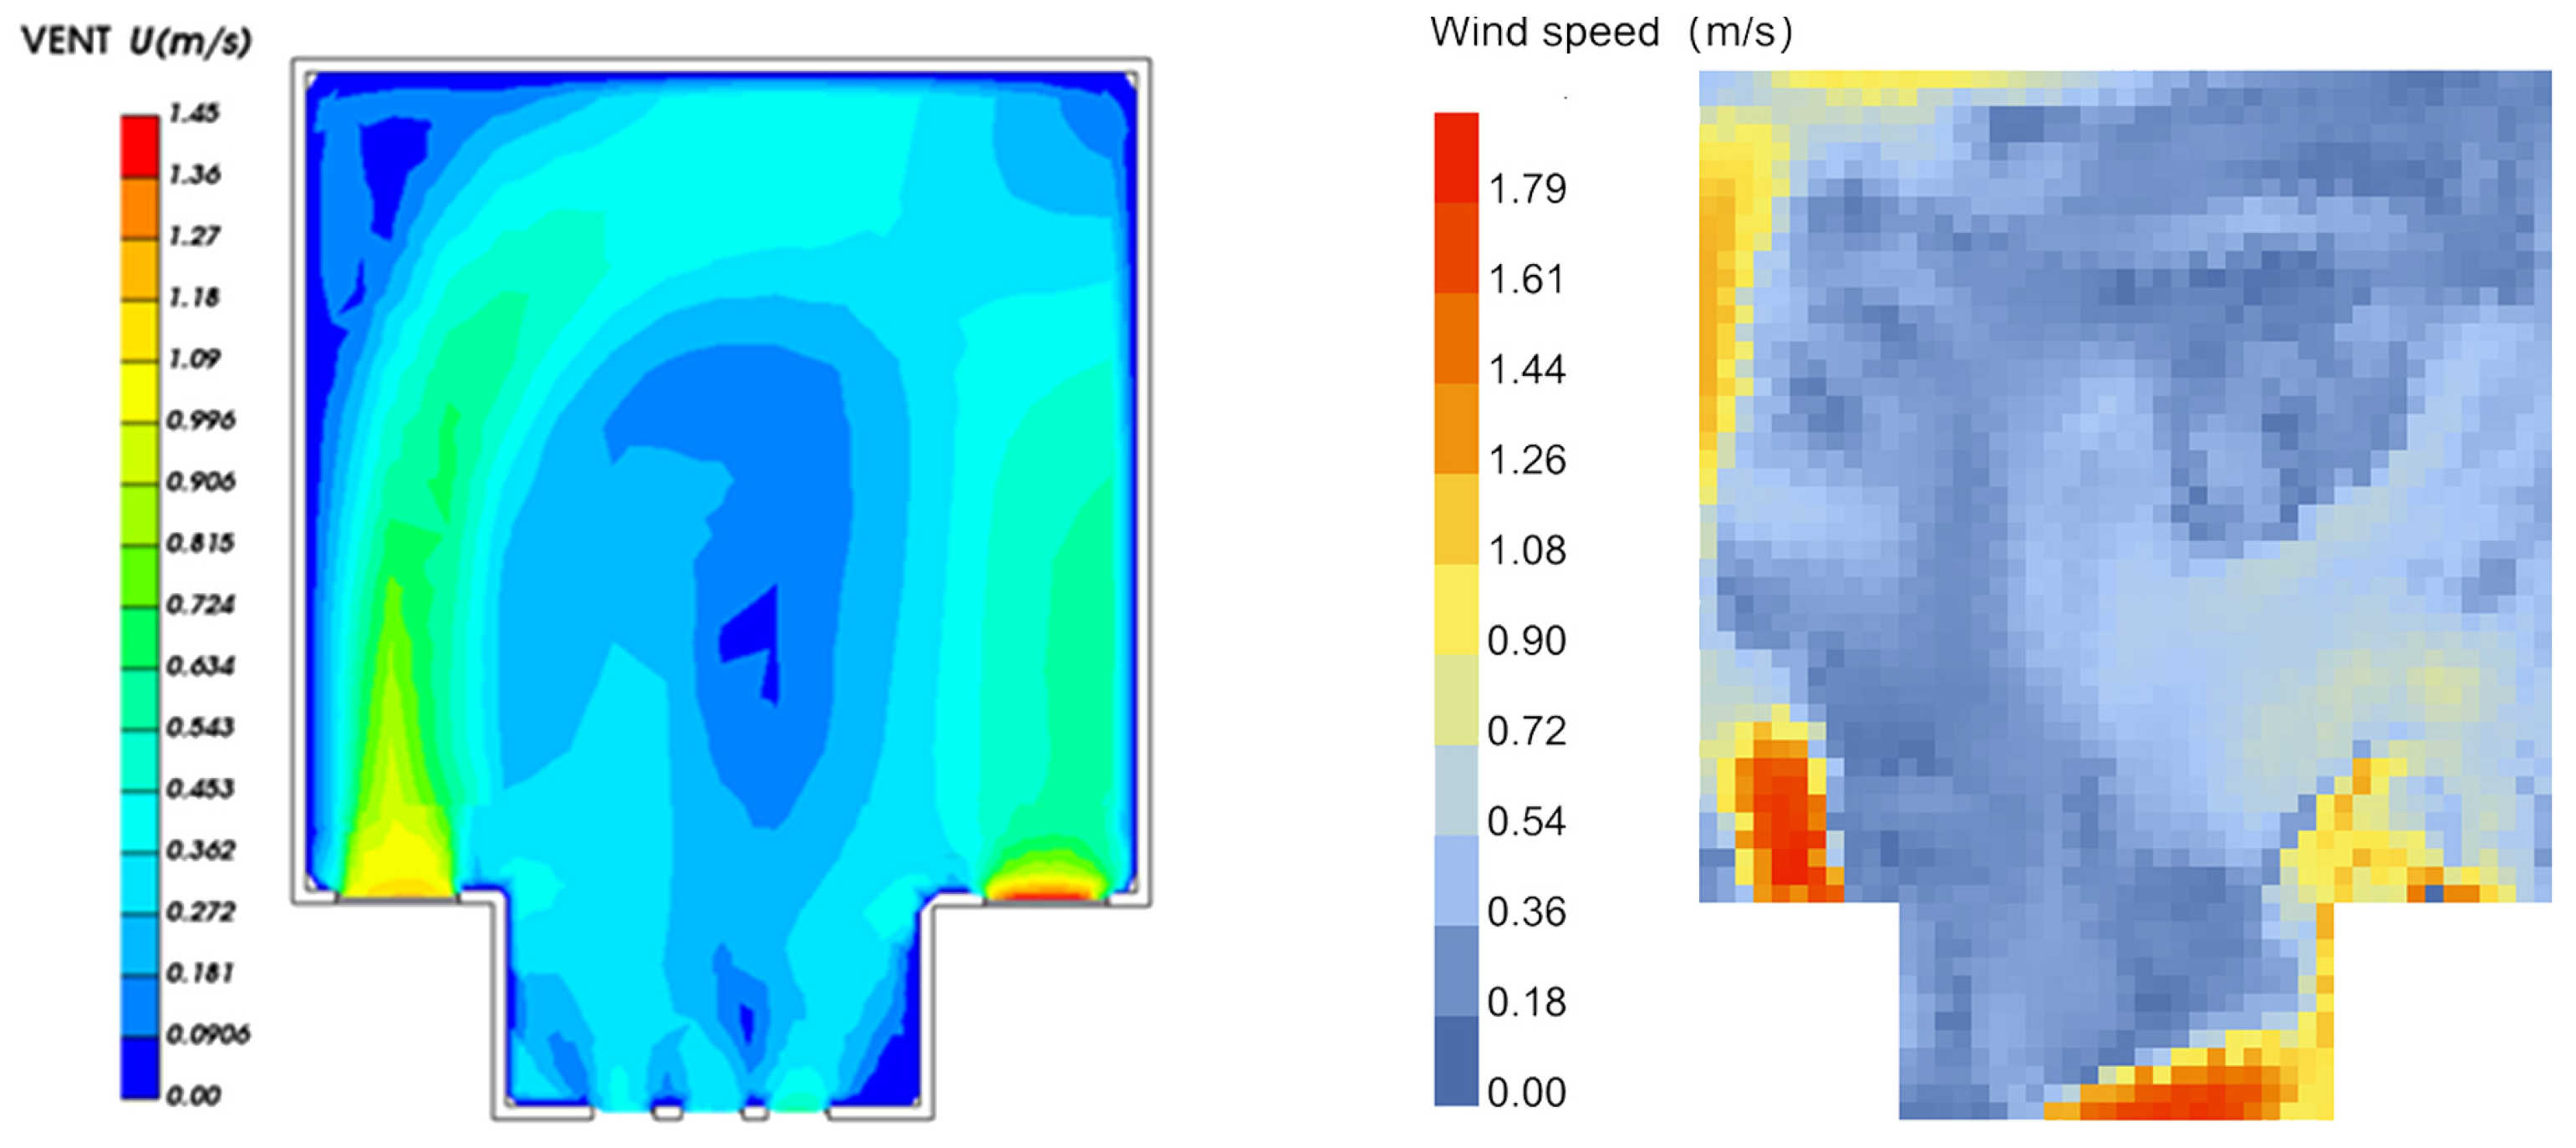
On the other hand, wind environment simulation employs computational fluid dynamics (CFD) methods to solve fluid mechanics equations, predicting the spatial distribution and temporal evolution of airflow. The simulation primarily focuses on parameters such as airflow trajectories, velocity distribution, and vortex structures, which are difficult to obtain directly through empirical measurements. Therefore, merely comparing simulated wind speed with measured data is insufficient for comprehensively evaluating the software’s accuracy. To verify the reliability of the wind environment simulation in this study, the THSWARE 2025 natural ventilation simulation software was used as a reference for comparative analysis. Both software programs simulated the wind environment distribution at a height of 1.5 m in the same room under identical boundary conditions, with the results shown in
Figure 7. A comparison of the cloud maps shows that both simulations exhibit a counterclockwise spiral airflow pattern. The average wind speed simulated by THSWARE is 0.68 m/s, while that simulated by Butterfly 0.0.05 is 0.76 m/s, with a wind speed error of less than 1 m/s. Moreover, the regions of strong wind and vortex formation appear in the same locations in both simulations, indicating a high degree of consistency in their macroscopic wind field characteristics. In addition, the Butterfly simulation more clearly captures the backflow phenomenon that occurs when airflow collides with walls and depicts small-scale vortex structures in localized areas, which aligns with the principles of fluid mechanics. In conclusion, the wind environment simulation conducted using Ladybug Tools and Butterfly in this study demonstrates satisfactory accuracy and reliability, particularly in describing turbulent flow details. Therefore, this approach can be effectively applied to ventilation simulation studies in architectural environments.
4. Discussion and Application
This study simulates and analyzes the thermal and wind environments of four different spatial forms that evolved during the design of the main halls of temple buildings in the northern grassland region of China. The research investigates the impact of these various architectural forms on both indoor and outdoor wind-thermal environments. The results demonstrate that the spatial form of the main hall directly influences its thermal comfort and ventilation effectiveness. A well-designed spatial structure not only optimizes the indoor temperature and humidity but also promotes air circulation, thereby improving the building’s overall performance.
4.1. Comprehensive Comparison
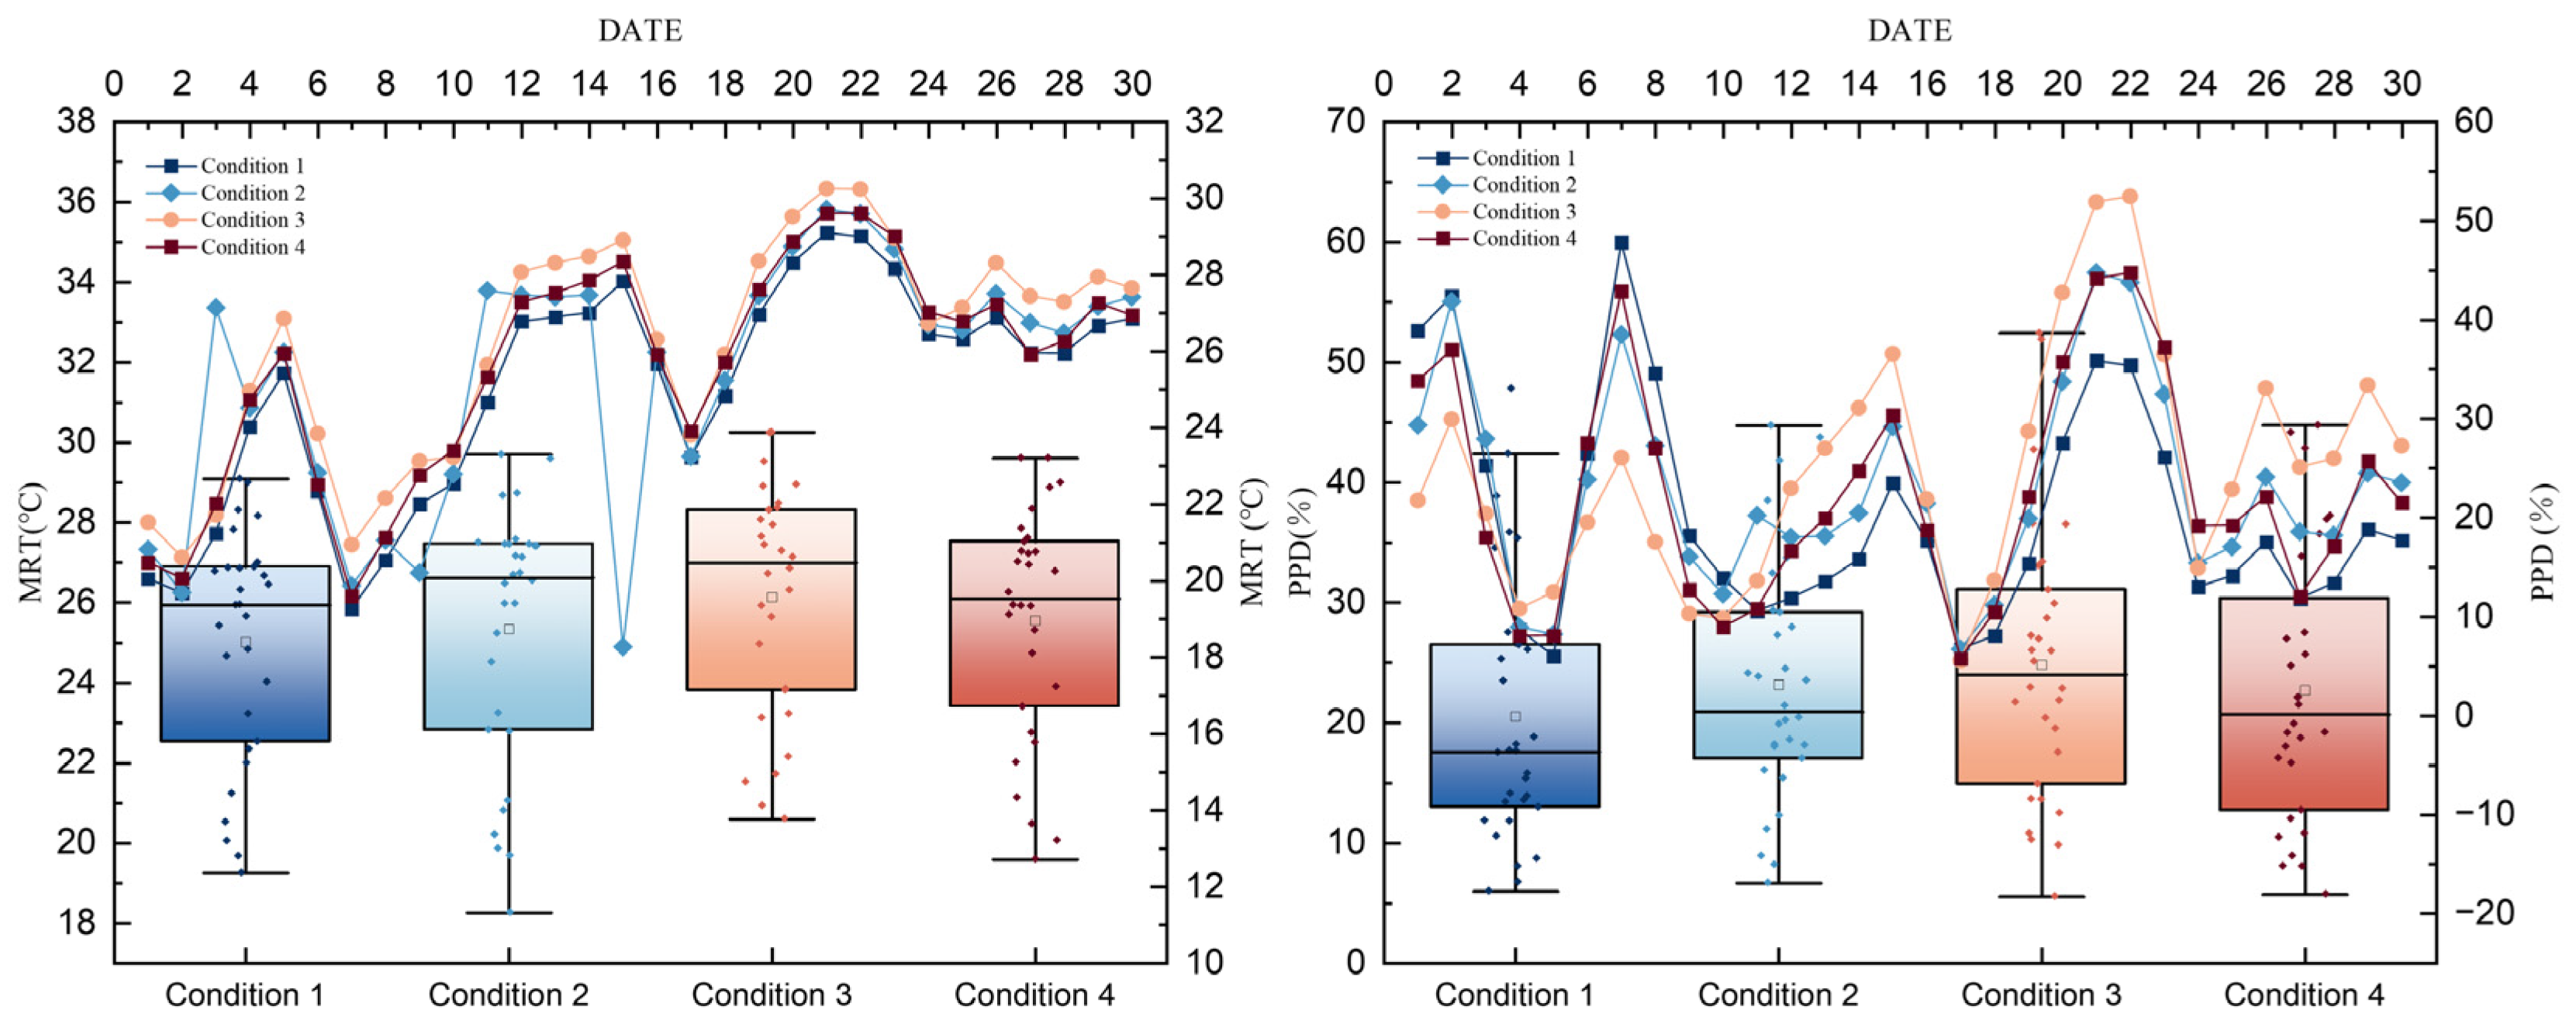
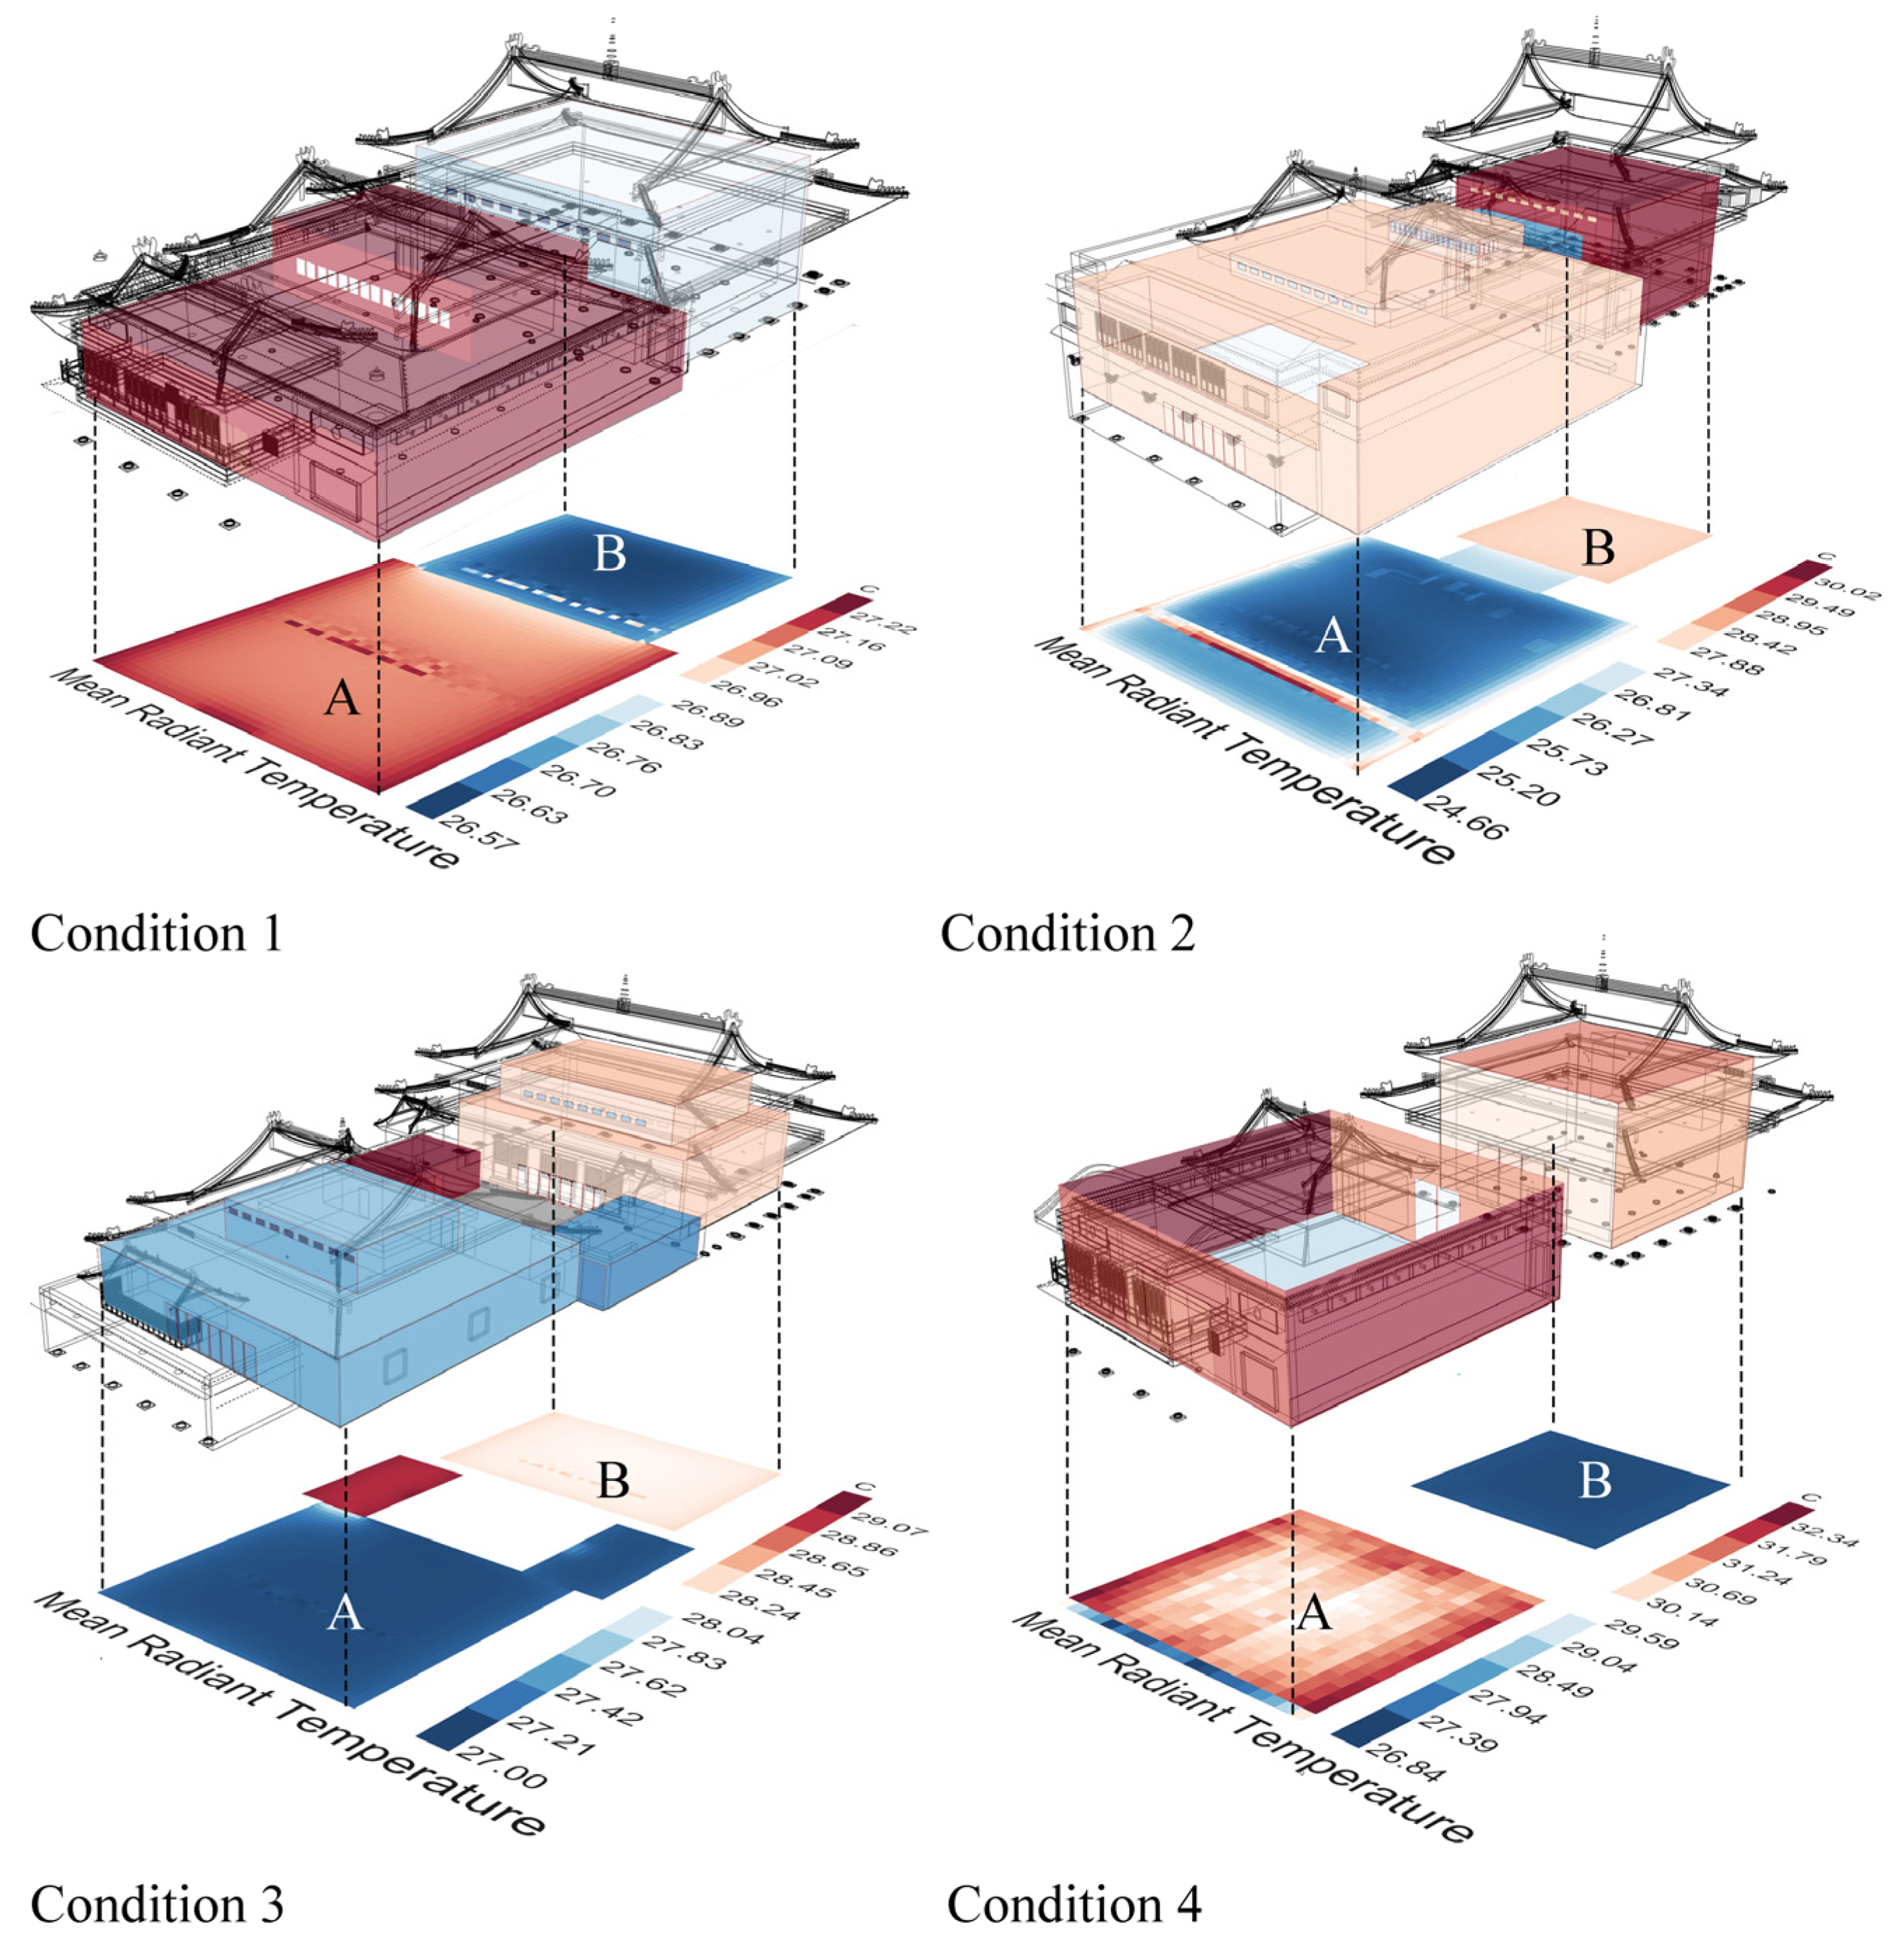
In Condition 1, the front and rear spaces are directly connected through entrances at the junction, which enhances ventilation capacity. However, during periods of strong external winds and high temperatures, the influx of hot air significantly reduces indoor comfort. Despite this, the indoor airflow in the front and rear spaces is most uniform in this condition. In Condition 2, a buffer space is used to connect the front and rear spaces, but the ventilation capacity is weaker compared to Condition 1 due to the presence of only a single entrance. The lack of additional entrances causes the indoor circulation to disappear, resulting in uneven airflow in the front space. However, the buffer space provides more consistent airflow to the rear space, making the airflow in the rear more active than in Condition 1, which improves comfort. In Condition 3, the layout of the courtyard ensures greater stability across the entire building, with relatively minor fluctuations in data throughout the month. In Condition 4, the “Venturi Effect” caused by the separation of the front and rear spaces enhances the wind pressure between the indoor and outdoor environments, improving ventilation efficiency in these spaces. This principle is similar to the second-floor sections of Conditions 1 and 2, with slightly higher ventilation and heat dissipation capacity than in Condition 1.
Table 2 presents a comparison of key metrics across the four spatial layout conditions:
Specifically, spatial forms where the front and rear spaces are directly connected often face challenges in ventilation and heat dissipation in the rear space. Introducing an entrance at the connection point can make the overall indoor airflow more uniform, enhancing comfort. However, considering the hot winds in summer, excessive ventilation capacity may disrupt the indoor thermal environment and reduce comfort. Adding a transitional space at the connection point reduces the building’s ventilation and air exchange capacity, resulting in a decrease of approximately 10% in ventilation effectiveness and a 3% reduction in indoor dissatisfaction. However, the increased building surface area may reduce thermal stability, making the building more susceptible to external temperature fluctuations. The incorporation of a central courtyard between the front and rear spaces effectively improves thermal insulation and enhances indoor thermal stability, maintaining temperatures between 75% and 78% during the hottest months. It is worth noting that the courtyard also generates the “Venturi effect,” where the wind pressure is lower and the wind speed is faster on both sides of the courtyard. Finally, when the front and rear spaces are completely separated without any additional spatial structure, a more pronounced “Venturi effect” occurs. The front and rear spaces form an accelerated ventilation path, speeding up air exchange. These various hall forms demonstrate that the impact of spatial forms is multifaceted, with both advantages and disadvantages arising simultaneously. Furthermore, the wind and thermal environments are interdependent and can influence each other, allowing for optimization through careful design.
4.2. Limitations and Future Directions
While this study provides a reference for the simulation of thermal and wind environments, it primarily focuses on the wind-thermal environment of Sino-Tibetan temples in cold climate zones during summer. This focus is based on the significant impact of spatial layout in summer, which enhances natural ventilation and thermal comfort without the need for mechanical cooling systems. In contrast, buildings in cold climate zones typically remain sealed during winter, relying on external heating systems, which falls outside the scope of this study and is therefore not discussed.
Additionally, the simulation employs prevailing wind speed and direction to reflect the long-term climatic characteristics of the region rather than transient fluctuations, ensuring a more stable and representative analysis. If different wind directions were to be incorporated as variables, reducing the diversity of spatial layout types could be a feasible approach given computational cost constraints. This adjustment can be explored in future studies.
To refine the simulation period, future research could establish a winter control group, integrating both field measurements and simulations to analyze the relationship and differences between winter and summer results. Furthermore, the study can be expanded to different regions and types of traditional buildings, facilitating cross-regional comparative studies to further validate the universality of the simulation results.
Future research could also consider testing these spatial layout forms in different climate types—such as hot-humid, temperate, or arid climates—to evaluate their performance under diverse environmental conditions.
4.3. Application of Experimental Findings and Recommendations
The application of experimental conclusions to modern design can be mainly approached through the following four directions:
When adjusting ventilation and heat dissipation between two adjacent spaces, the introduction of a transitional space can effectively regulate indoor temperature and humidity while altering the path of heat transfer. In modern architectural design, especially in high-temperature or strong-wind regions, these spatial forms can serve as valuable references. Designing similar transitional spaces can enhance building comfort, minimize temperature differences between the front and rear spaces, and reduce heat exchange with the external environment. In regions prone to extreme climatic conditions, the incorporation of courtyards can further improve thermal stability in buildings. These design strategies not only help enhance indoor comfort but also reduce reliance on air conditioning and mechanical ventilation systems, thereby promoting sustainable design development. When two adjacent spaces influence ventilation and heat dissipation, the introduction of a transitional space or central courtyard can effectively regulate indoor temperature and humidity. In modern architectural design, these spatial forms can be referenced, especially in regions with high temperatures or strong winds. Designing similar transitional spaces or courtyard layouts can enhance the building’s thermal stability and ventilation efficiency. This design approach not only helps improve indoor comfort but also reduces reliance on air conditioning and mechanical ventilation, promoting sustainable design.
- 2.
Utilizing the “Venturi Effect” to Enhance Ventilation Efficiency
In traditional architecture, the clever use of spatial separation and entrance design accelerates airflow. Modern buildings can adopt this spatial layout to enhance ventilation, especially in multi-story and open-plan designs. By leveraging variations in wind speed to create pressure differences, the air exchange efficiency can be improved, thereby reducing energy consumption. This approach not only enhances natural ventilation but also contributes to more sustainable, energy-efficient building designs.
- 3.
Spatial Function Zoning and Flexibility
Experiments have shown that historical buildings were designed with distinct construction methods tailored to different functions, and even within the same building type, there was no rigid standardization. Instead, through rational spatial zoning and layout, they ensured both uniformity in form and flexibility in space usage. In modern architecture, this design philosophy can be applied to optimize the layout of different functional areas, ensuring that buildings meet diverse needs while maintaining efficient use of space and the ability to adapt to changes. This approach is particularly beneficial in modern urban environments, where flexible spatial layouts help buildings respond to evolving usage requirements.
- 4.
Enhancing Building Sustainability and Environmental Adaptability
Historical buildings often focus on their ability to respond to extreme climatic conditions, utilizing design features such as wall thickness, window size, and entry-exit configurations to improve environmental adaptability. Modern architecture can draw inspiration from these designs, integrating them with advanced contemporary technologies to enhance both adaptability and sustainability. This approach is especially valuable in reducing energy consumption and environmental impact, particularly when dealing with extreme climate conditions.
- 5.
Innovative Research Methods for Extracting Value from Historical Architecture
This study utilizes modern digital simulation technologies to analyze and extract key design strategies from historical architecture for application in modern buildings. This approach bridges historical design principles with modern building performance analysis, providing architects with data-driven support to enhance sustainability and climate adaptability. Future research should not be limited to technological advancements or heritage conservation alone but should further explore the interdisciplinary connections to ensure that traditional architecture gains new value in the modern era, while advanced technologies find broader applications in contemporary design.
5. Conclusions
This study provides a comprehensive exploration of the thermal and wind environments of Sino-Tibetan temples, with a particular focus on the various spatial layout experiments undertaken during their evolution from the developmental stage to the mature stage. Through detailed simulations of typical spatial layouts, the study demonstrates that although these traditional designs are rooted in ritual practices and construction experience, their spatial forms and structural components exhibit significant potential in enhancing building performance and optimizing indoor comfort. Despite the absence of modern technical equipment during their design, the spatial forms and structural layouts of these buildings have proven effective in improving thermal comfort, ventilation efficiency, and overall sustainability. These findings highlight the relevance of ancient architectural principles in contemporary design, particularly in the context of heritage conservation and modern adaptation.
The main findings of this study can be summarized as follows:
- (1)
The spatial layout with a direct front-to-back connection exhibits high ventilation efficiency. However, as more hot air flows in, the comfort level in the front space decreases.
- (2)
Introducing buffer spaces alters the mode of heat transfer, increasing heat exchange between the front and rear spaces while reducing heat exchange between the building and the environment. Compared to direct connection, ventilation efficiency decreases by 12%, while indoor discomfort is reduced by approximately 3%.
- (3)
Buildings with courtyards perform slightly less effectively than those with buffer spaces. The spatial layout where the front and rear spaces are separated performs similarly to the direct connection layout. However, the central courtyard demonstrates greater thermal stability, maintaining a more stable indoor perceived temperature under extreme heat conditions.
It is also important to note that these spatial configurations may produce different environmental effects in winter. For example, while a courtyard helps buffer temperature fluctuations in summer, it may instead become a channel for heat loss in winter, leading to greater thermal dissipation. In contrast, a transitional space can act as a thermal buffer against cold air infiltration, improving insulation and maintaining indoor comfort. When the front and rear spaces are fully separated, although ventilation efficiency is enhanced in summer, it may result in unnecessary heat loss during the colder months. These findings highlight the multifaceted impact of spatial form on the indoor environment, with advantages and disadvantages coexisting. Moreover, wind and thermal conditions interact and influence each other, underscoring the need for seasonally adaptive spatial strategies to optimize year-round thermal comfort.
These findings provide strong support for the incorporation of traditional design methods into modern architecture, especially in regions facing harsh climatic conditions, where their energy-saving and comfort-enhancing potential is particularly significant. Furthermore, the application of building simulations has proven to be an invaluable tool in understanding the complex relationship between architectural forms, environmental conditions, and occupant comfort. This study not only expands the use of building simulations in modern architecture but also emphasizes their potential in the protection and restoration of ancient buildings. By offering a non-invasive method to test and optimize building performance, building simulations help reduce the potential damage to historical structures, providing a solid foundation for future conservation and renovation projects. Ultimately, this research paves the way for the integration of traditional architectural knowledge with contemporary environmental and technological needs, fostering a more sustainable and harmonious approach to architectural design.


