
Engineering and Durability Properties of Sustainable Bricks Incorporating Lime Kiln Dust, Ground Granulated Blast Furnace Slag, and Tyre Rubber Wastes


Abstract
1. Introduction
2. Experimental Methods
2.1. Test Samples
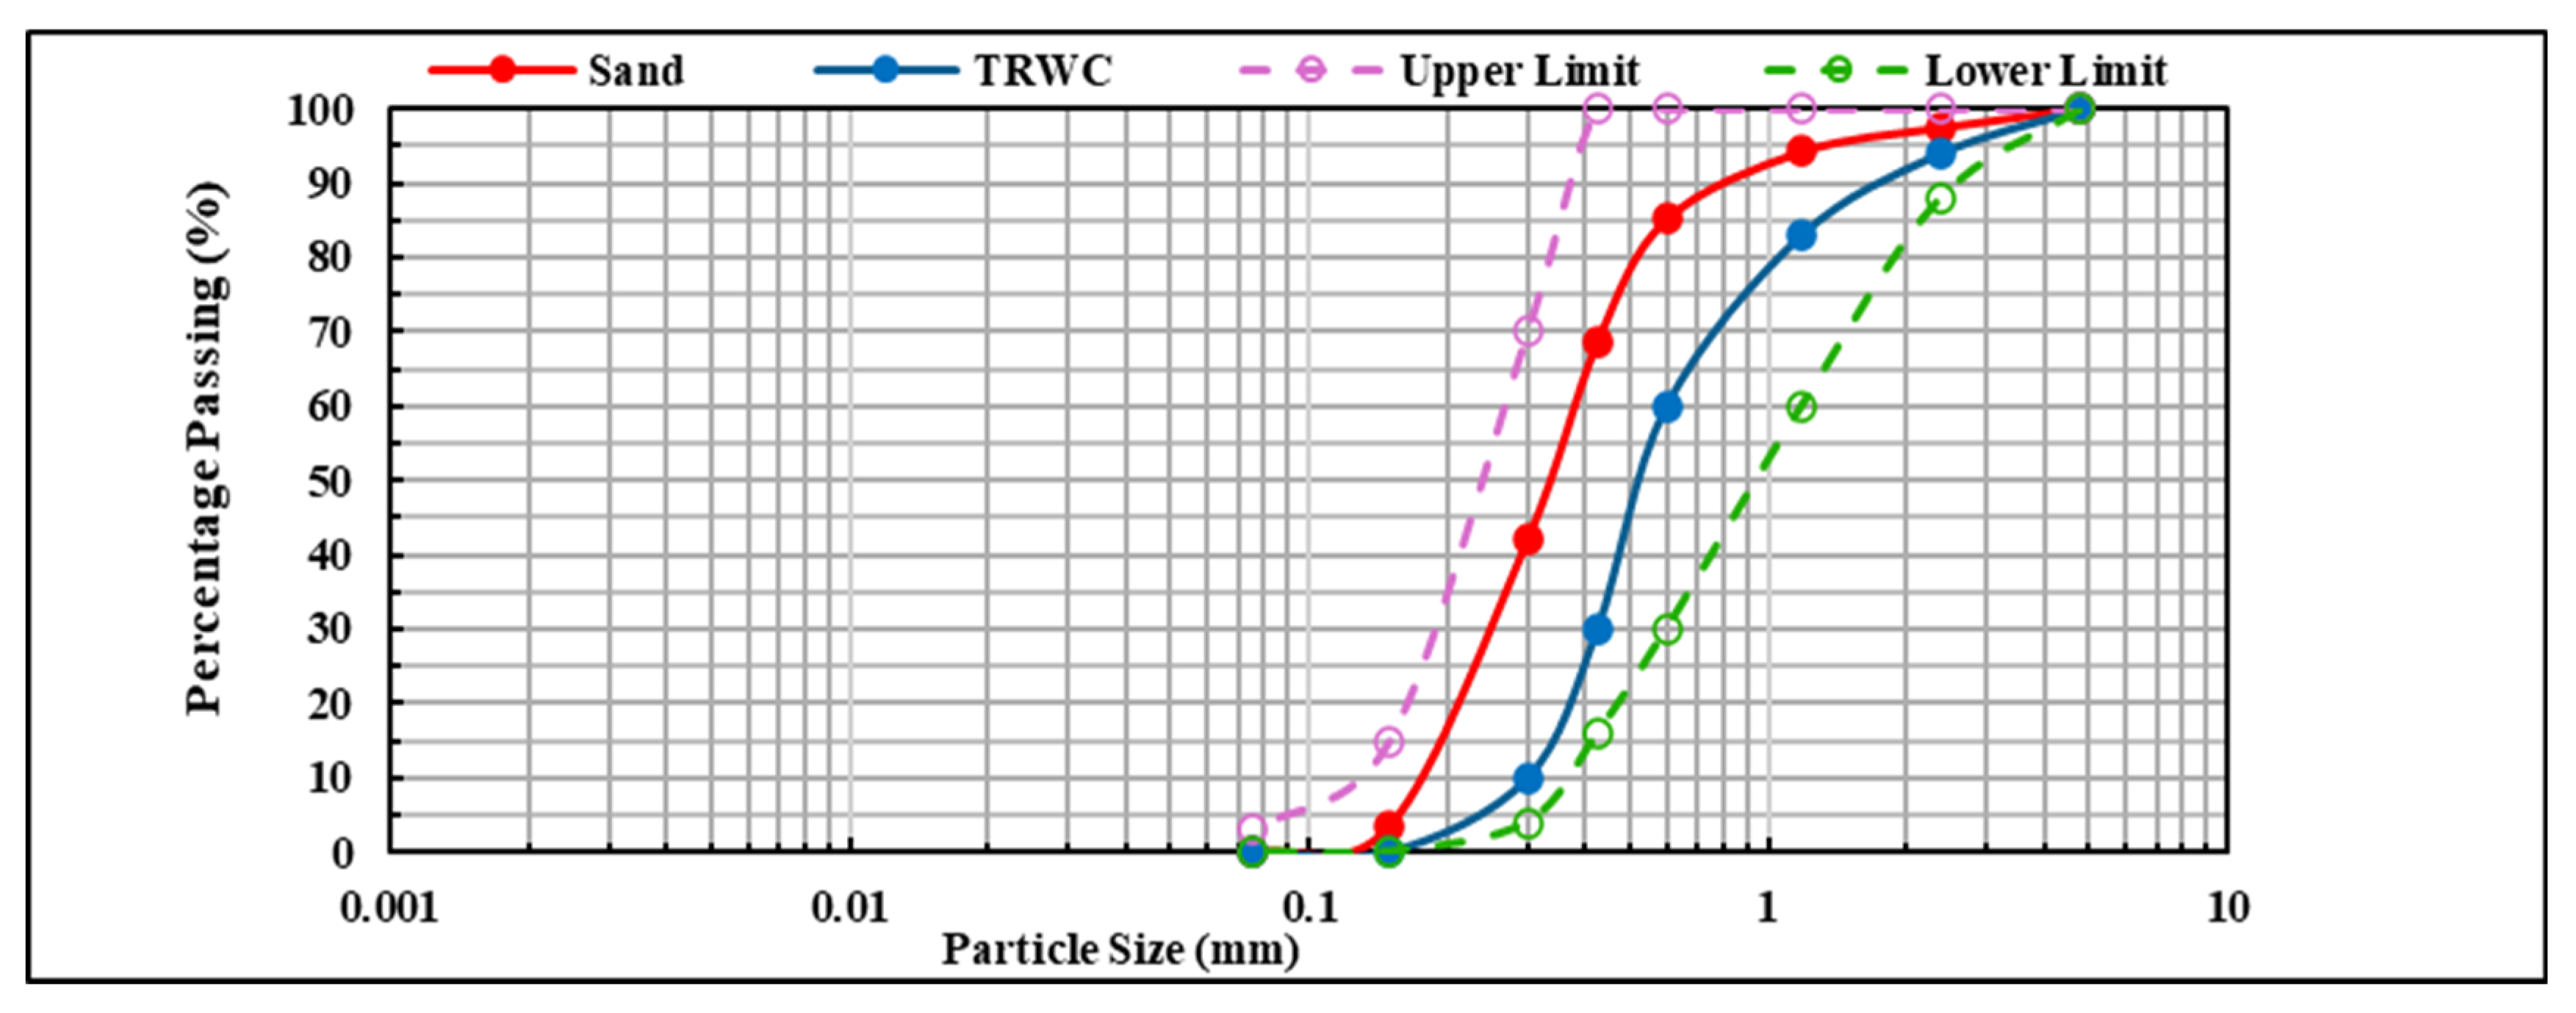
2.2. Materials
2.3. Preparation and Curing of Laboratory Samples
- The procedure for mixing was carried out per the codes [43]. When mixing was completed, the mix was placed in formworks coated with a releasing agent to aid a smooth demoulding process.
- The mix was vibrated in three layers using a vibration table to establish consistency, repeatability across all the samples, and ensure complete removal of entrapped air within the voids of the sample. The first and second layers were vibrated for 40 s, respectively. For the third layer, which was also the final vibration of the samples, a duration of 120 s was used to ensure that the three layers acted monolithically without any discontinuities.
- Following the vibration, the surplus mix above the formwork was struck off, and the remaining mix was levelled and smoothed.
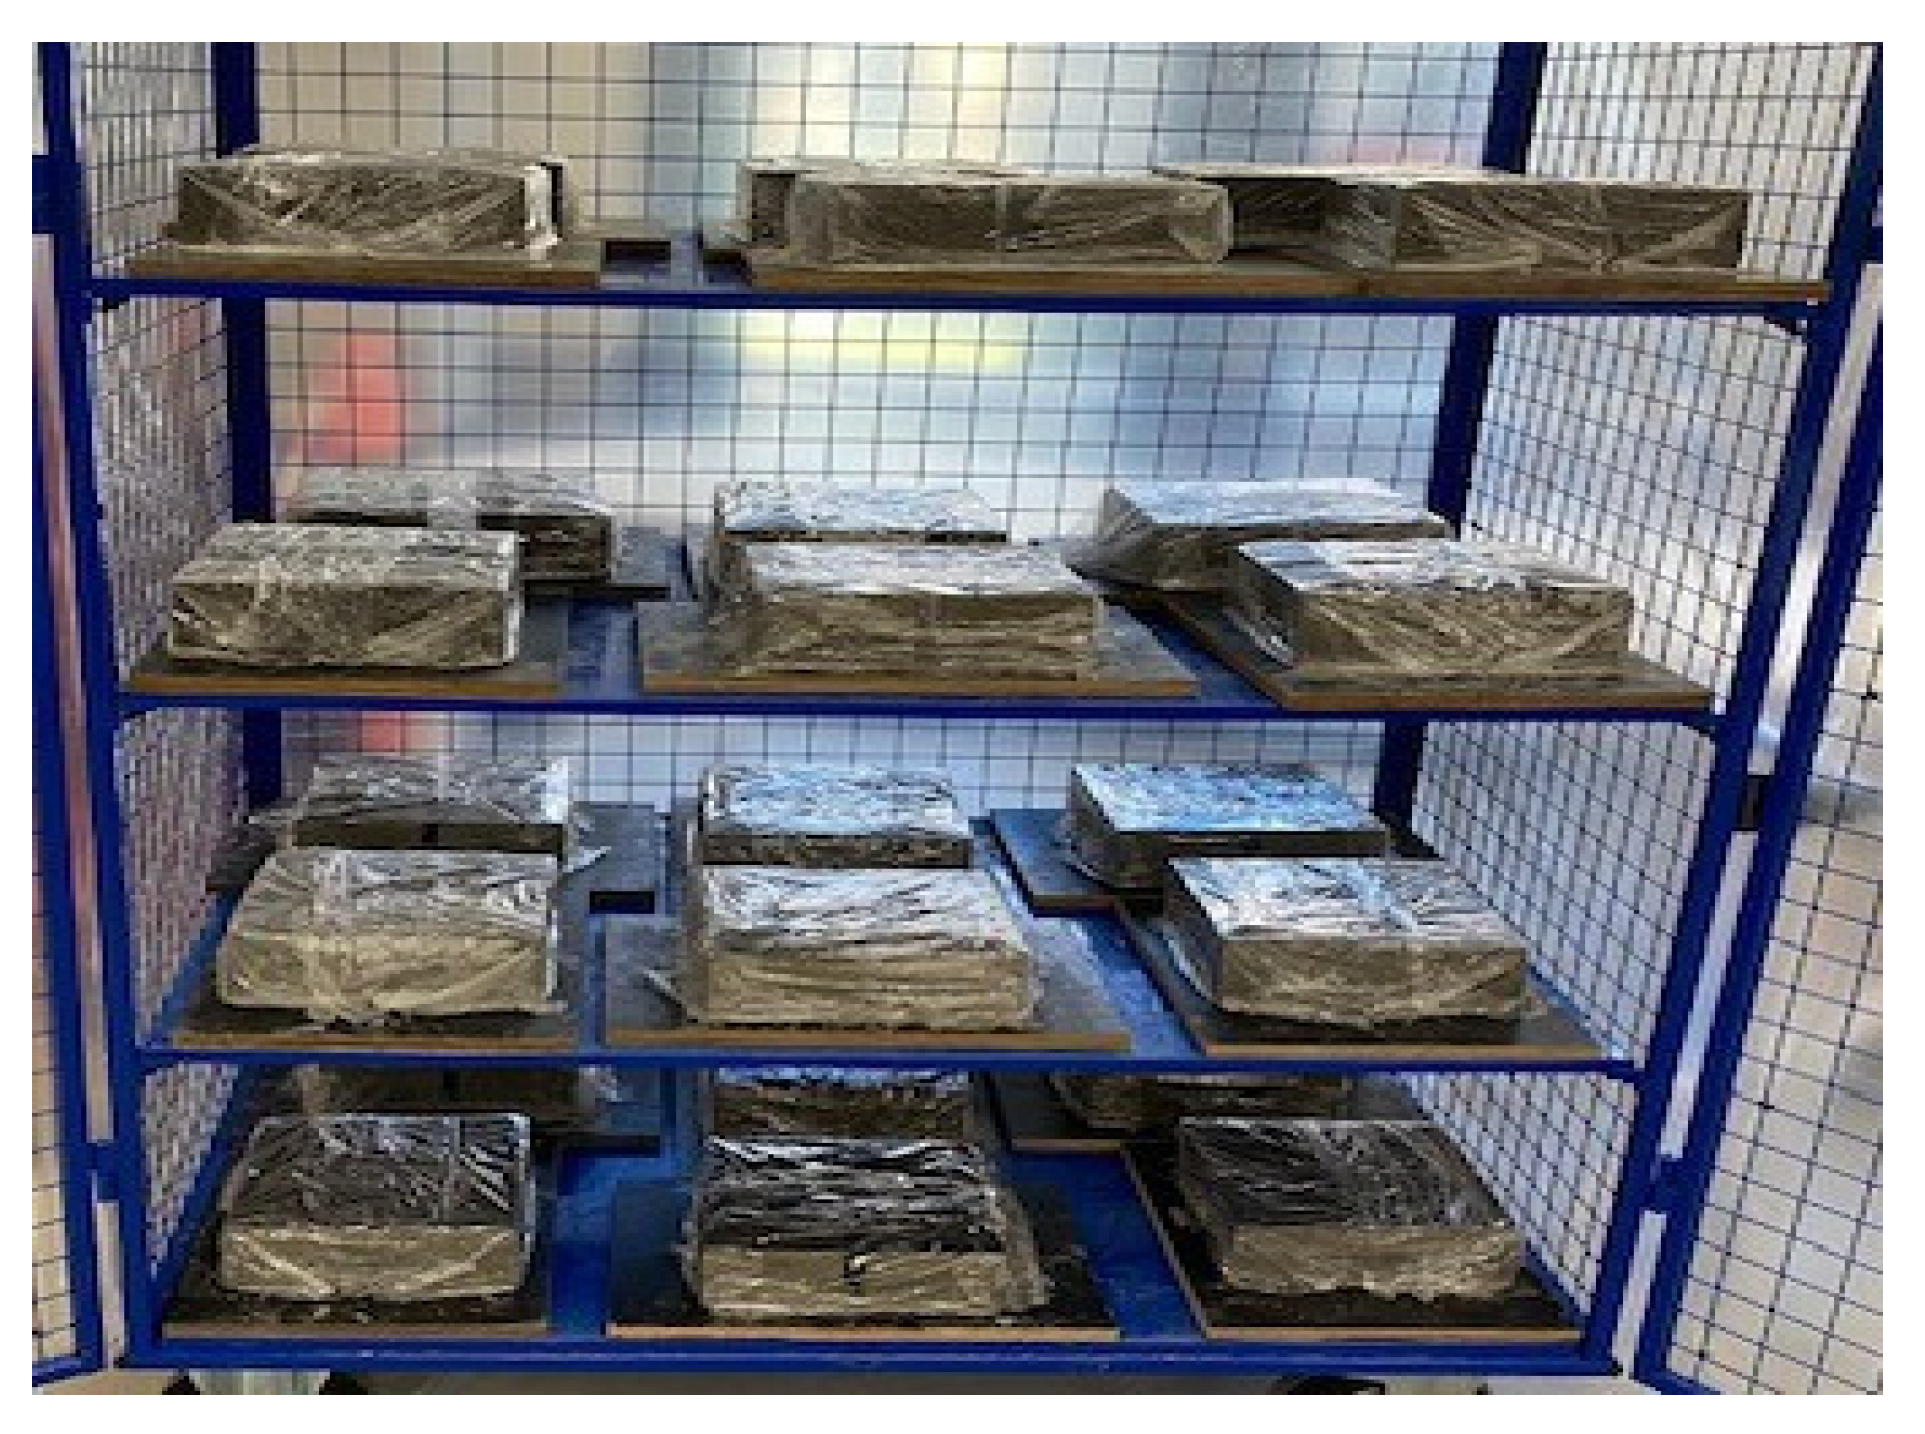
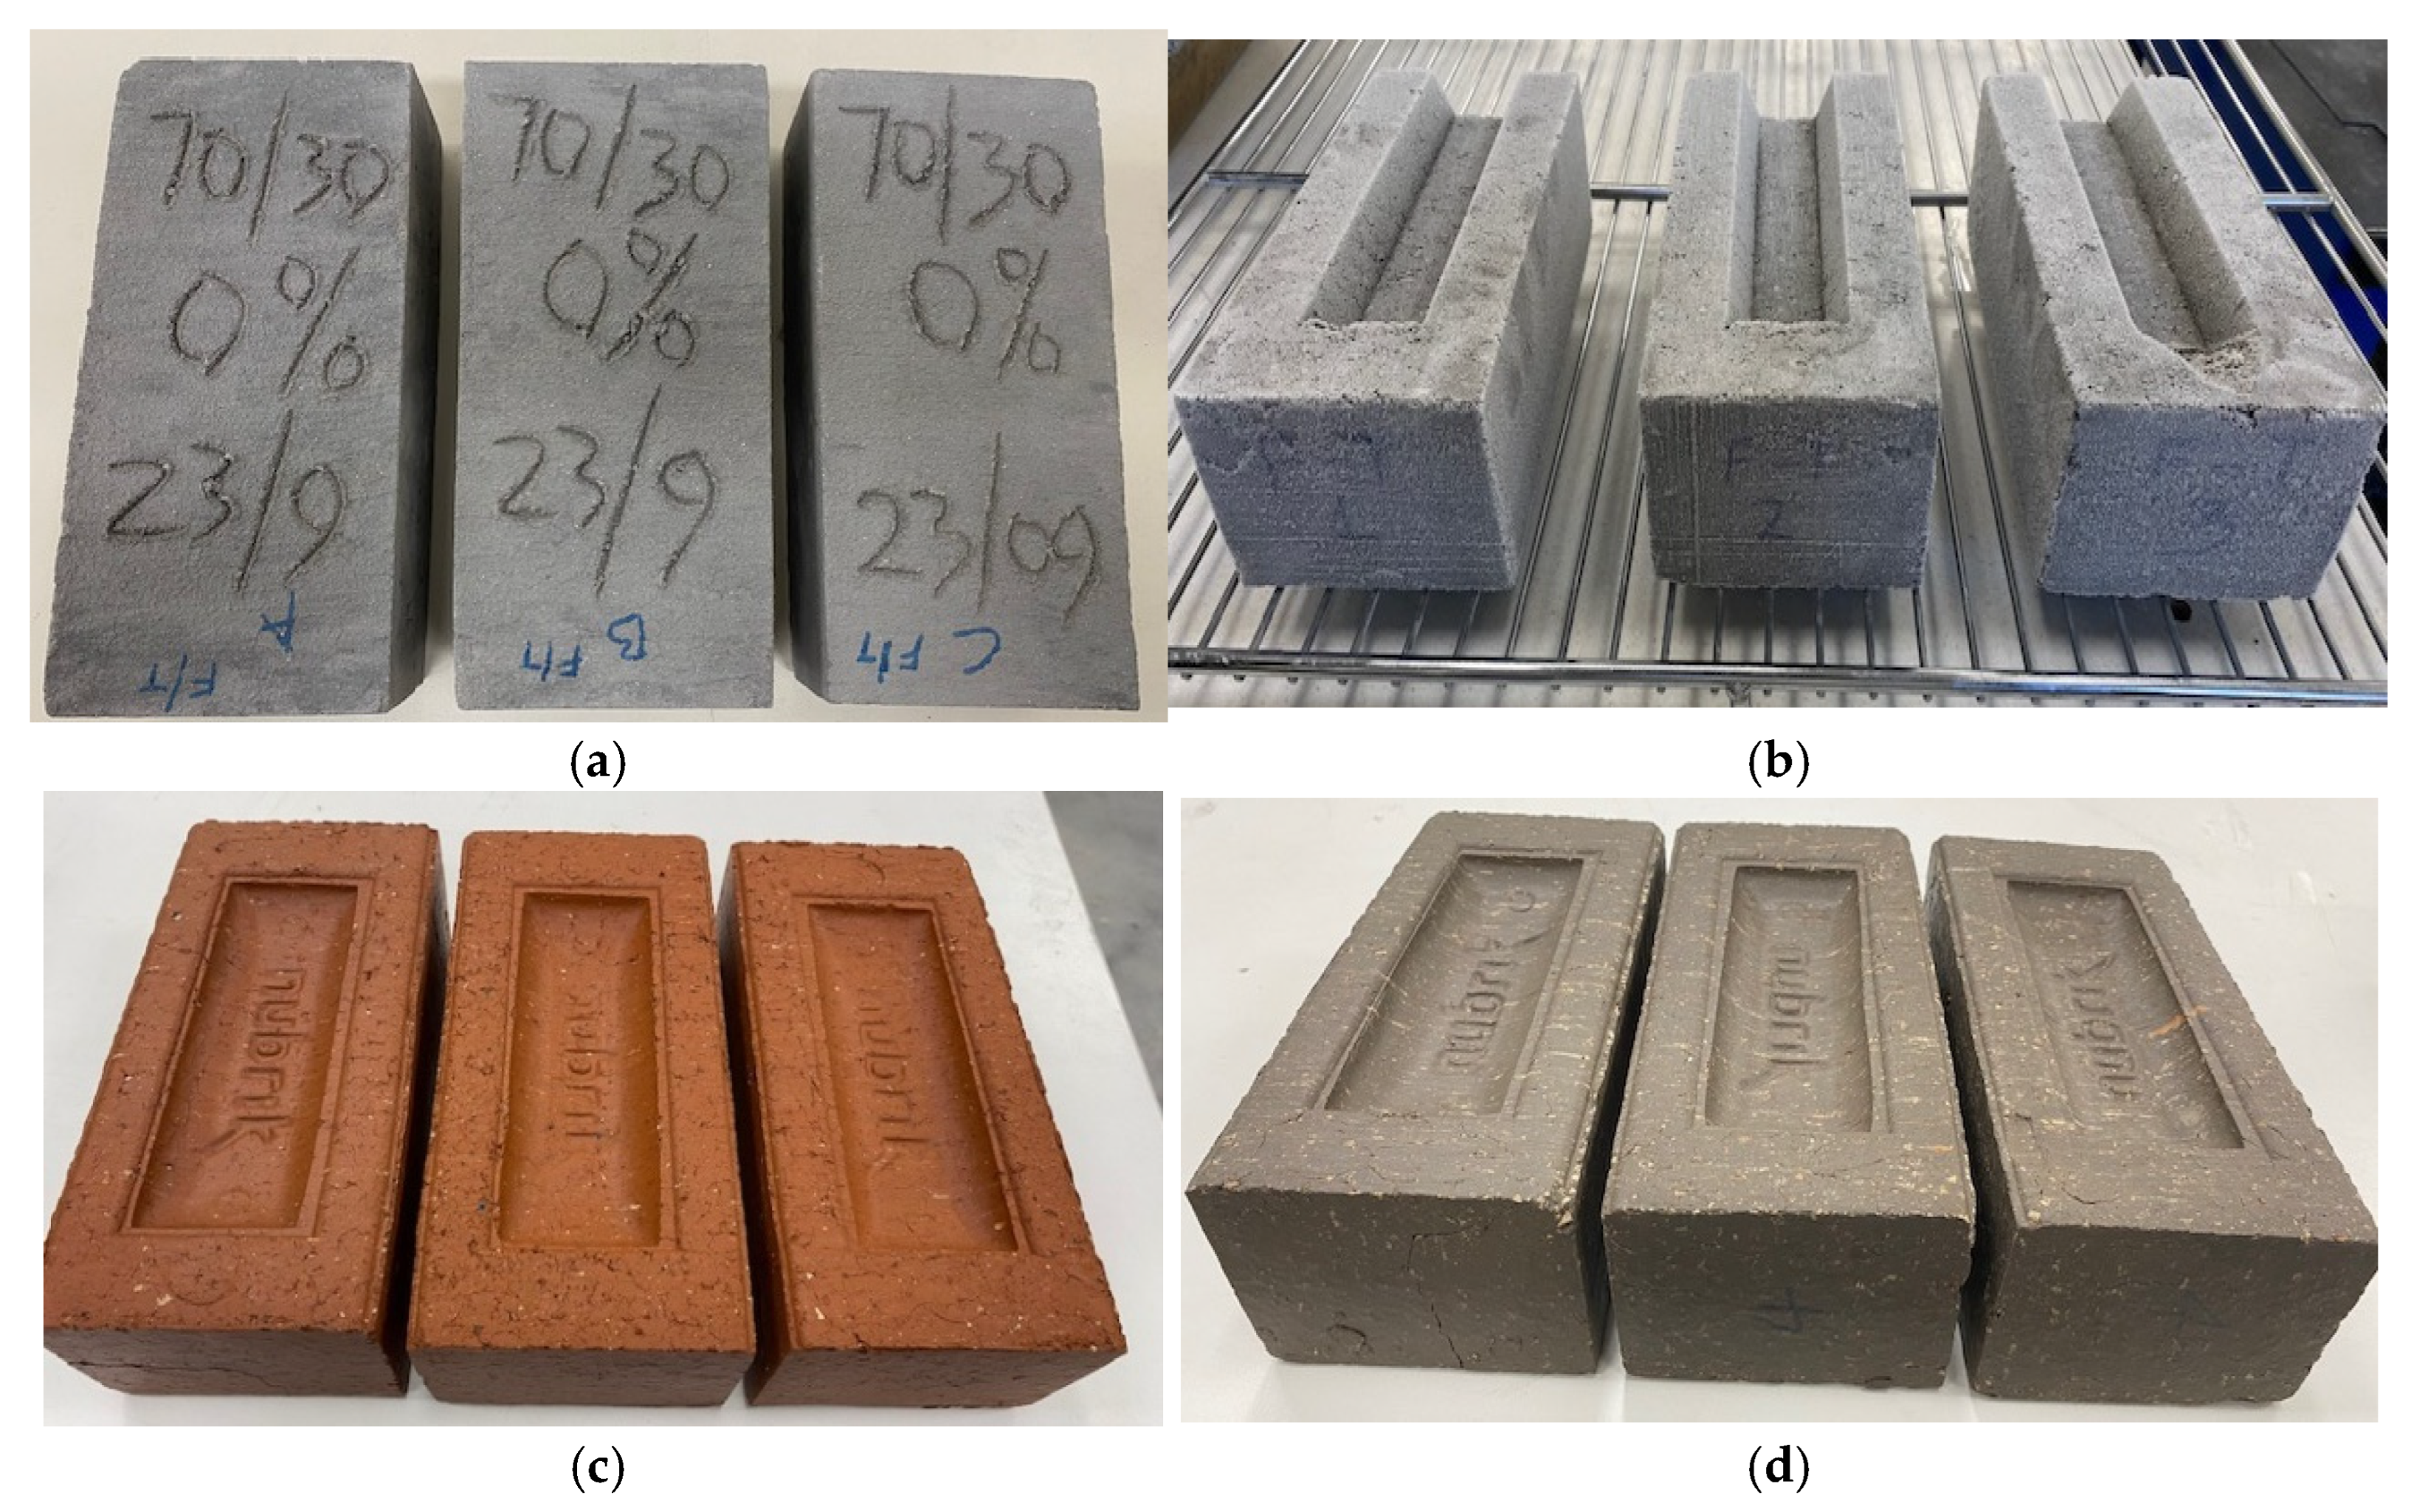
- The bricks remained in the formworks for 48 h due to the slow setting time of GGBFS, and thereafter de-moulded, subjected to water-curing immediately through spraying, wrapped in cling film, and kept in a humid environment having an average temperature and humidity of 19 °C (±5 °C) and 79% (±5%), respectively, to complement moist curing (Figure 2).
- Sample spraying was performed every second day until the respective curing ages of 7, 14, and 28 days considered in the study had elapsed, after which the samples were unwrapped and tested.
3. Tests
3.1. Compressive Strength (CS) Test
3.2. Freeze-Thaw (F-T) Test
3.3. Water Absorption (WA) Test
3.4. Scanning Electron Microscopy (SEM) and Energy Dispersive X-Ray Spectroscopy (EDS)
4. Results
4.1. Compressive Strength (CS)
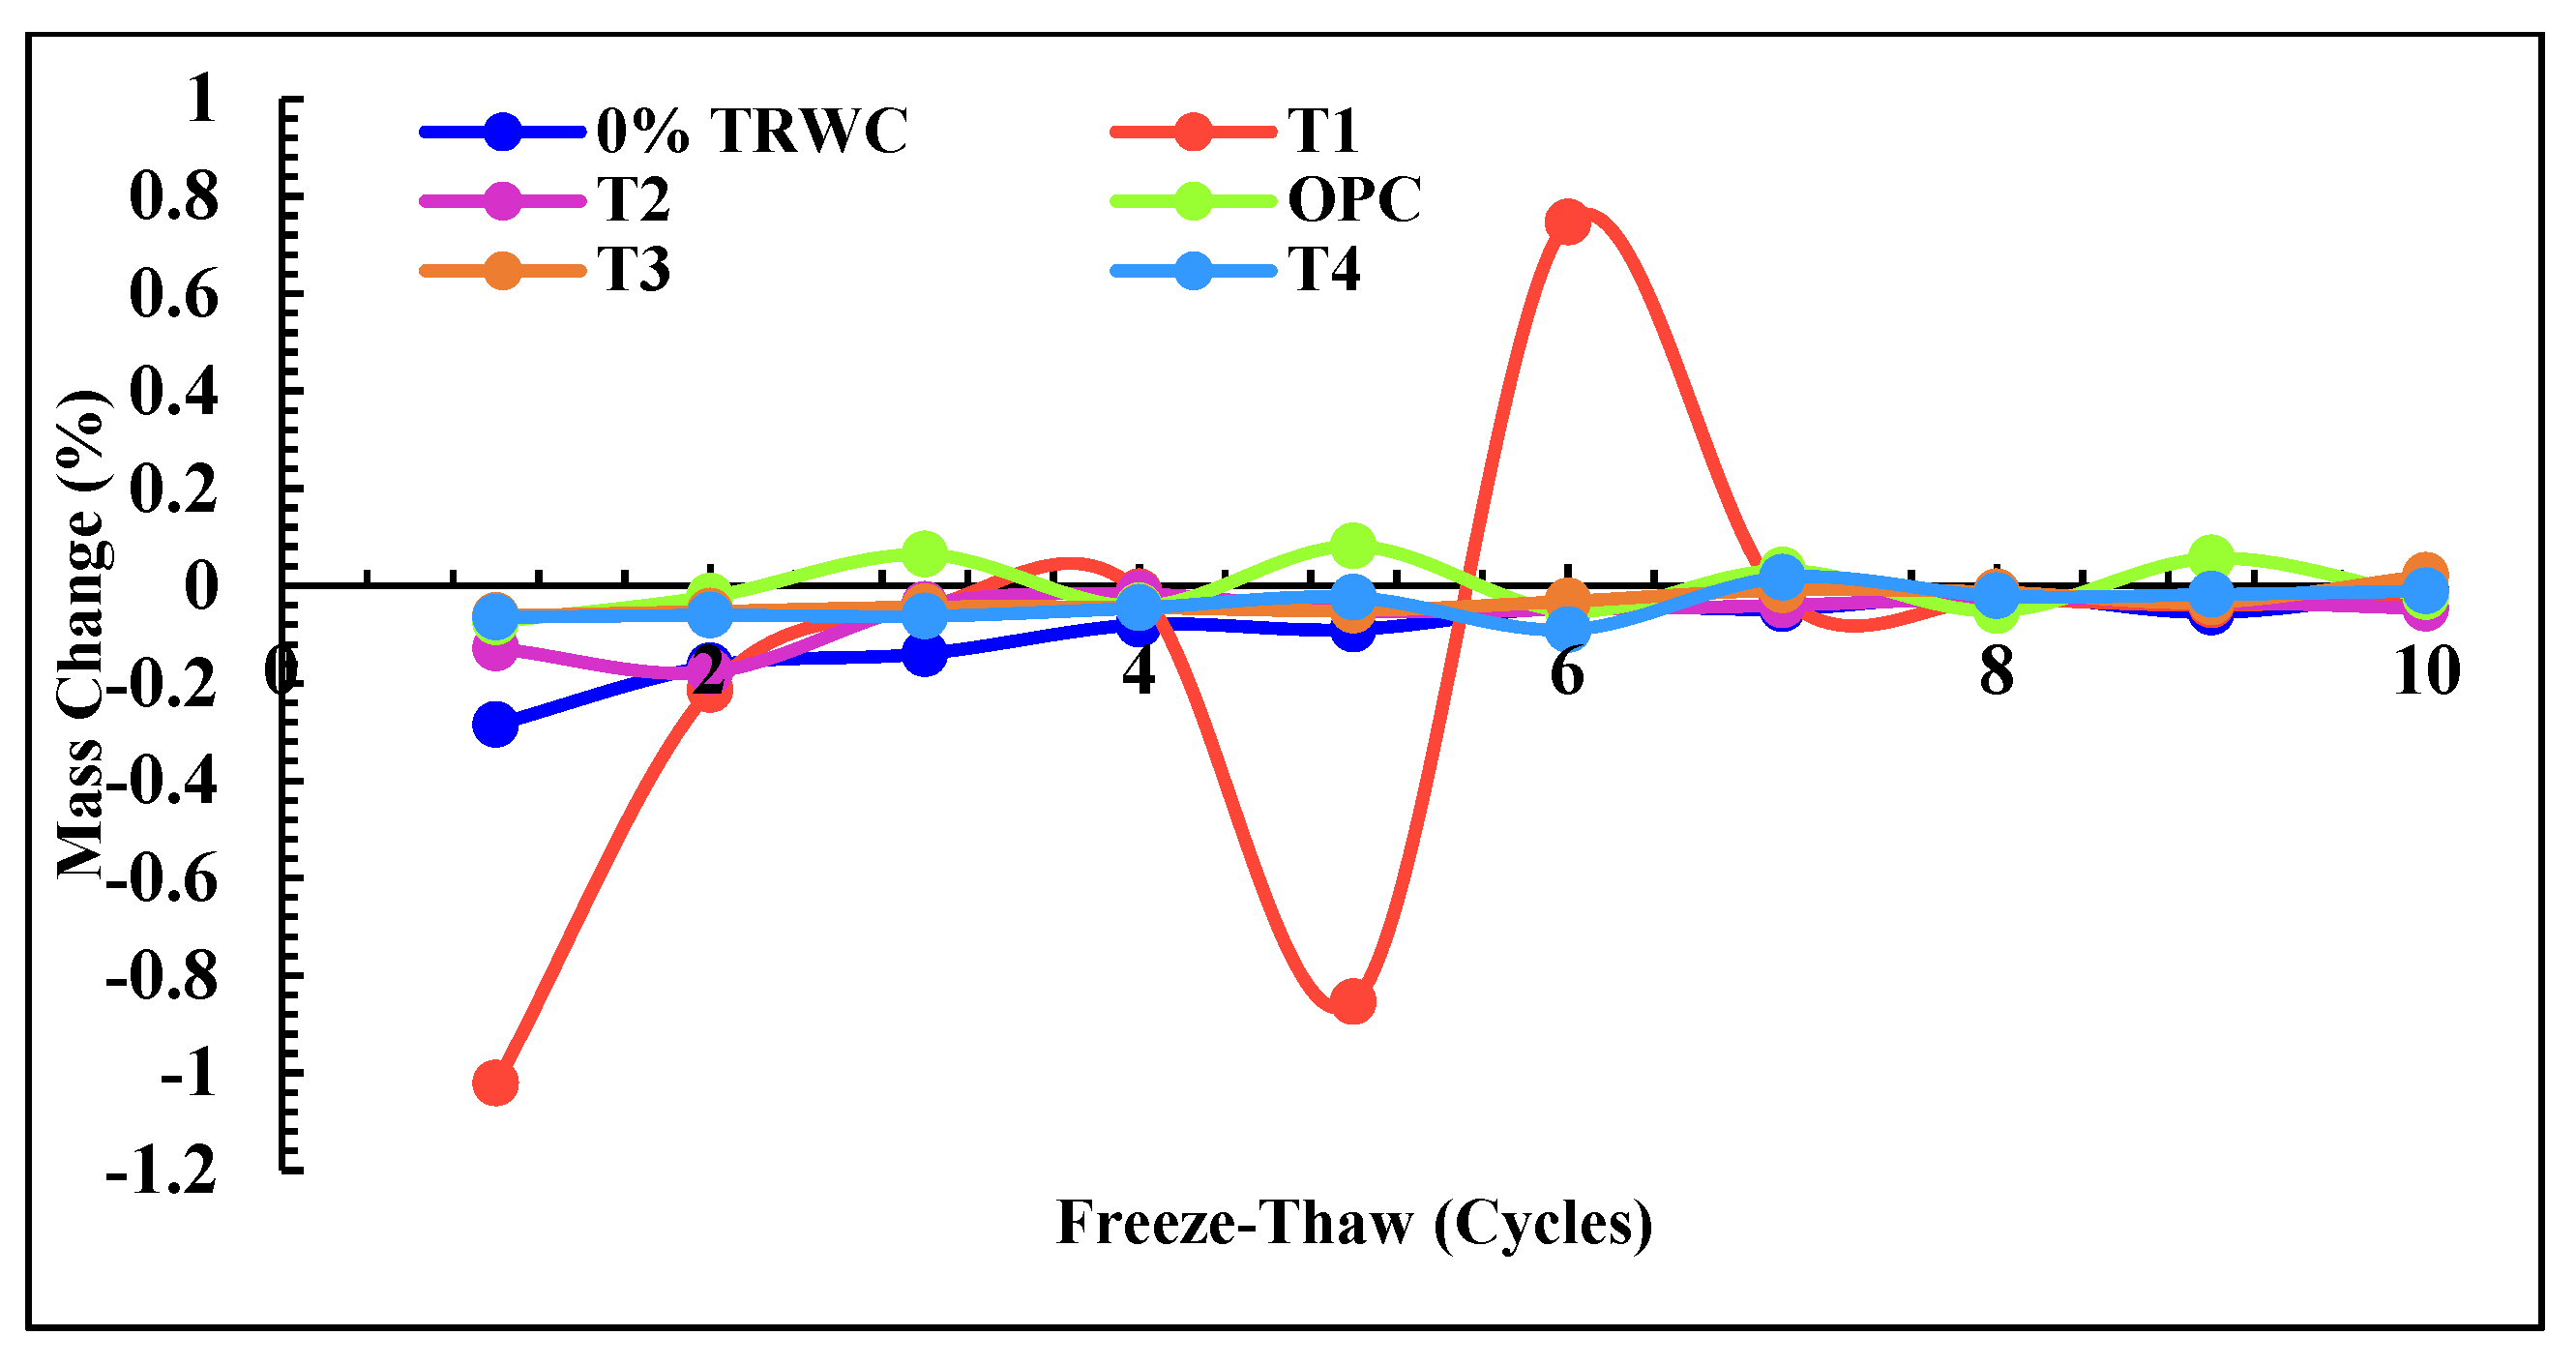
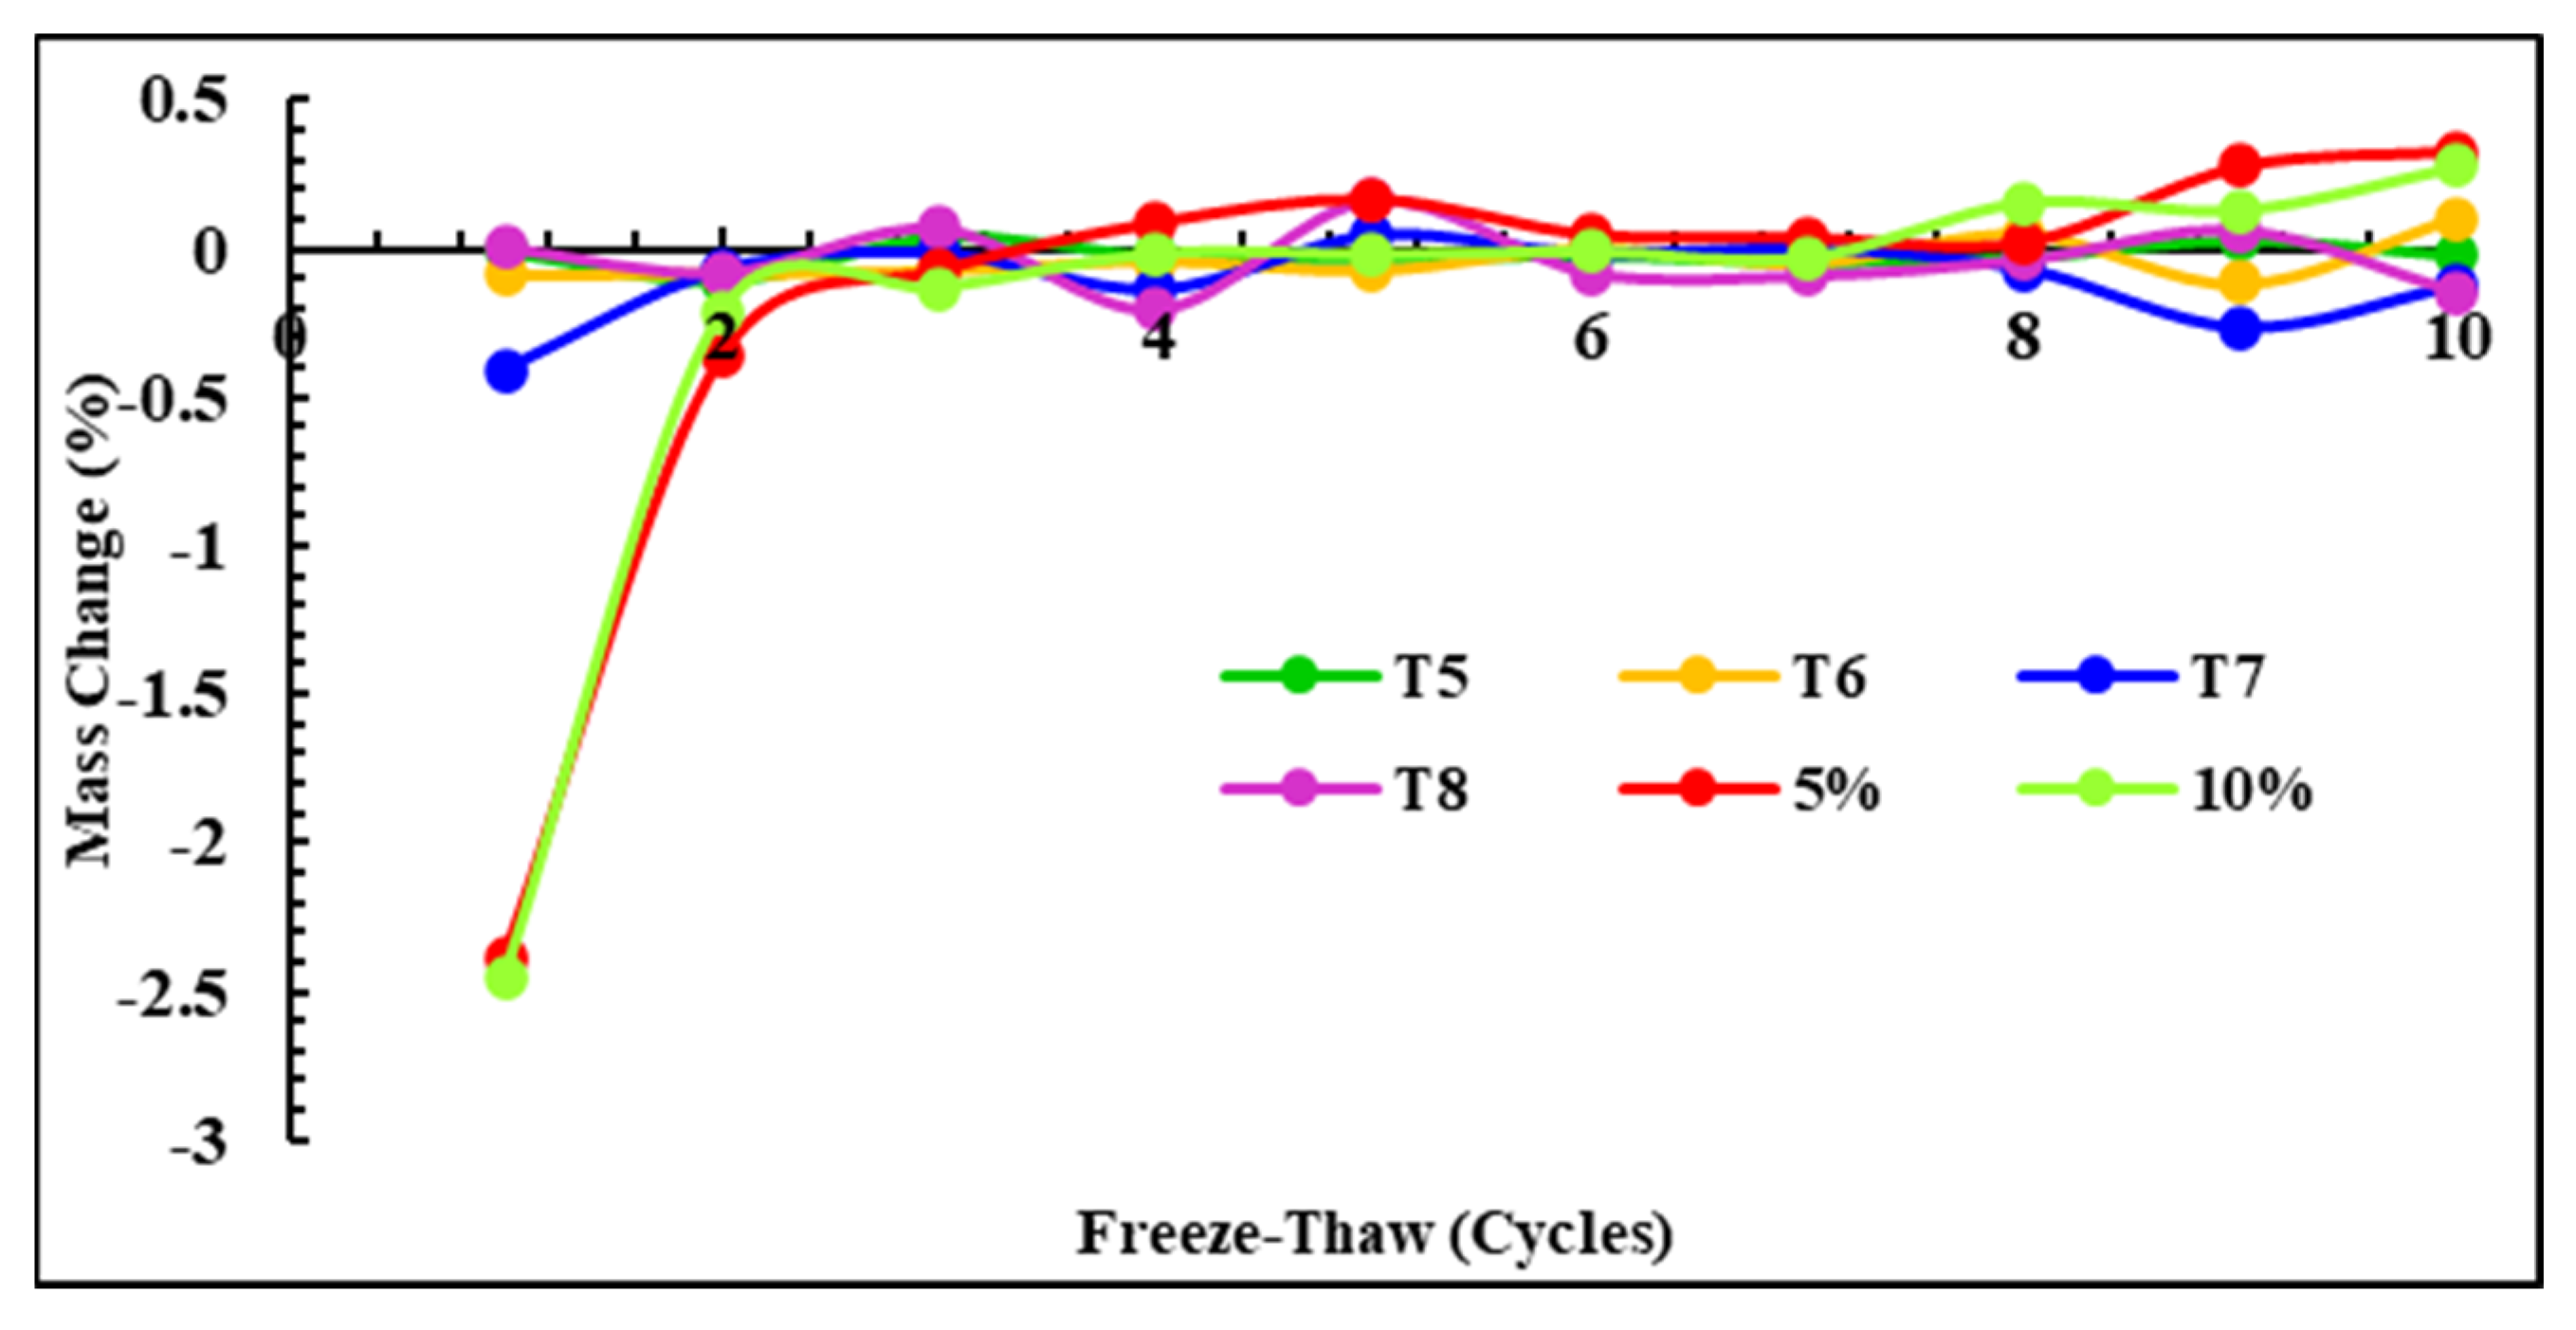
4.2. Freeze-Thaw (F-T)
4.3. CS After F-T Cycles
4.4. Water Absorption (WA)
4.5. Scanning Electron Microscopy (SEM) and Energy Dispersive X-Ray Spectroscopy (EDS)
4.5.1. Scanning Electron Microscopy (SEM)
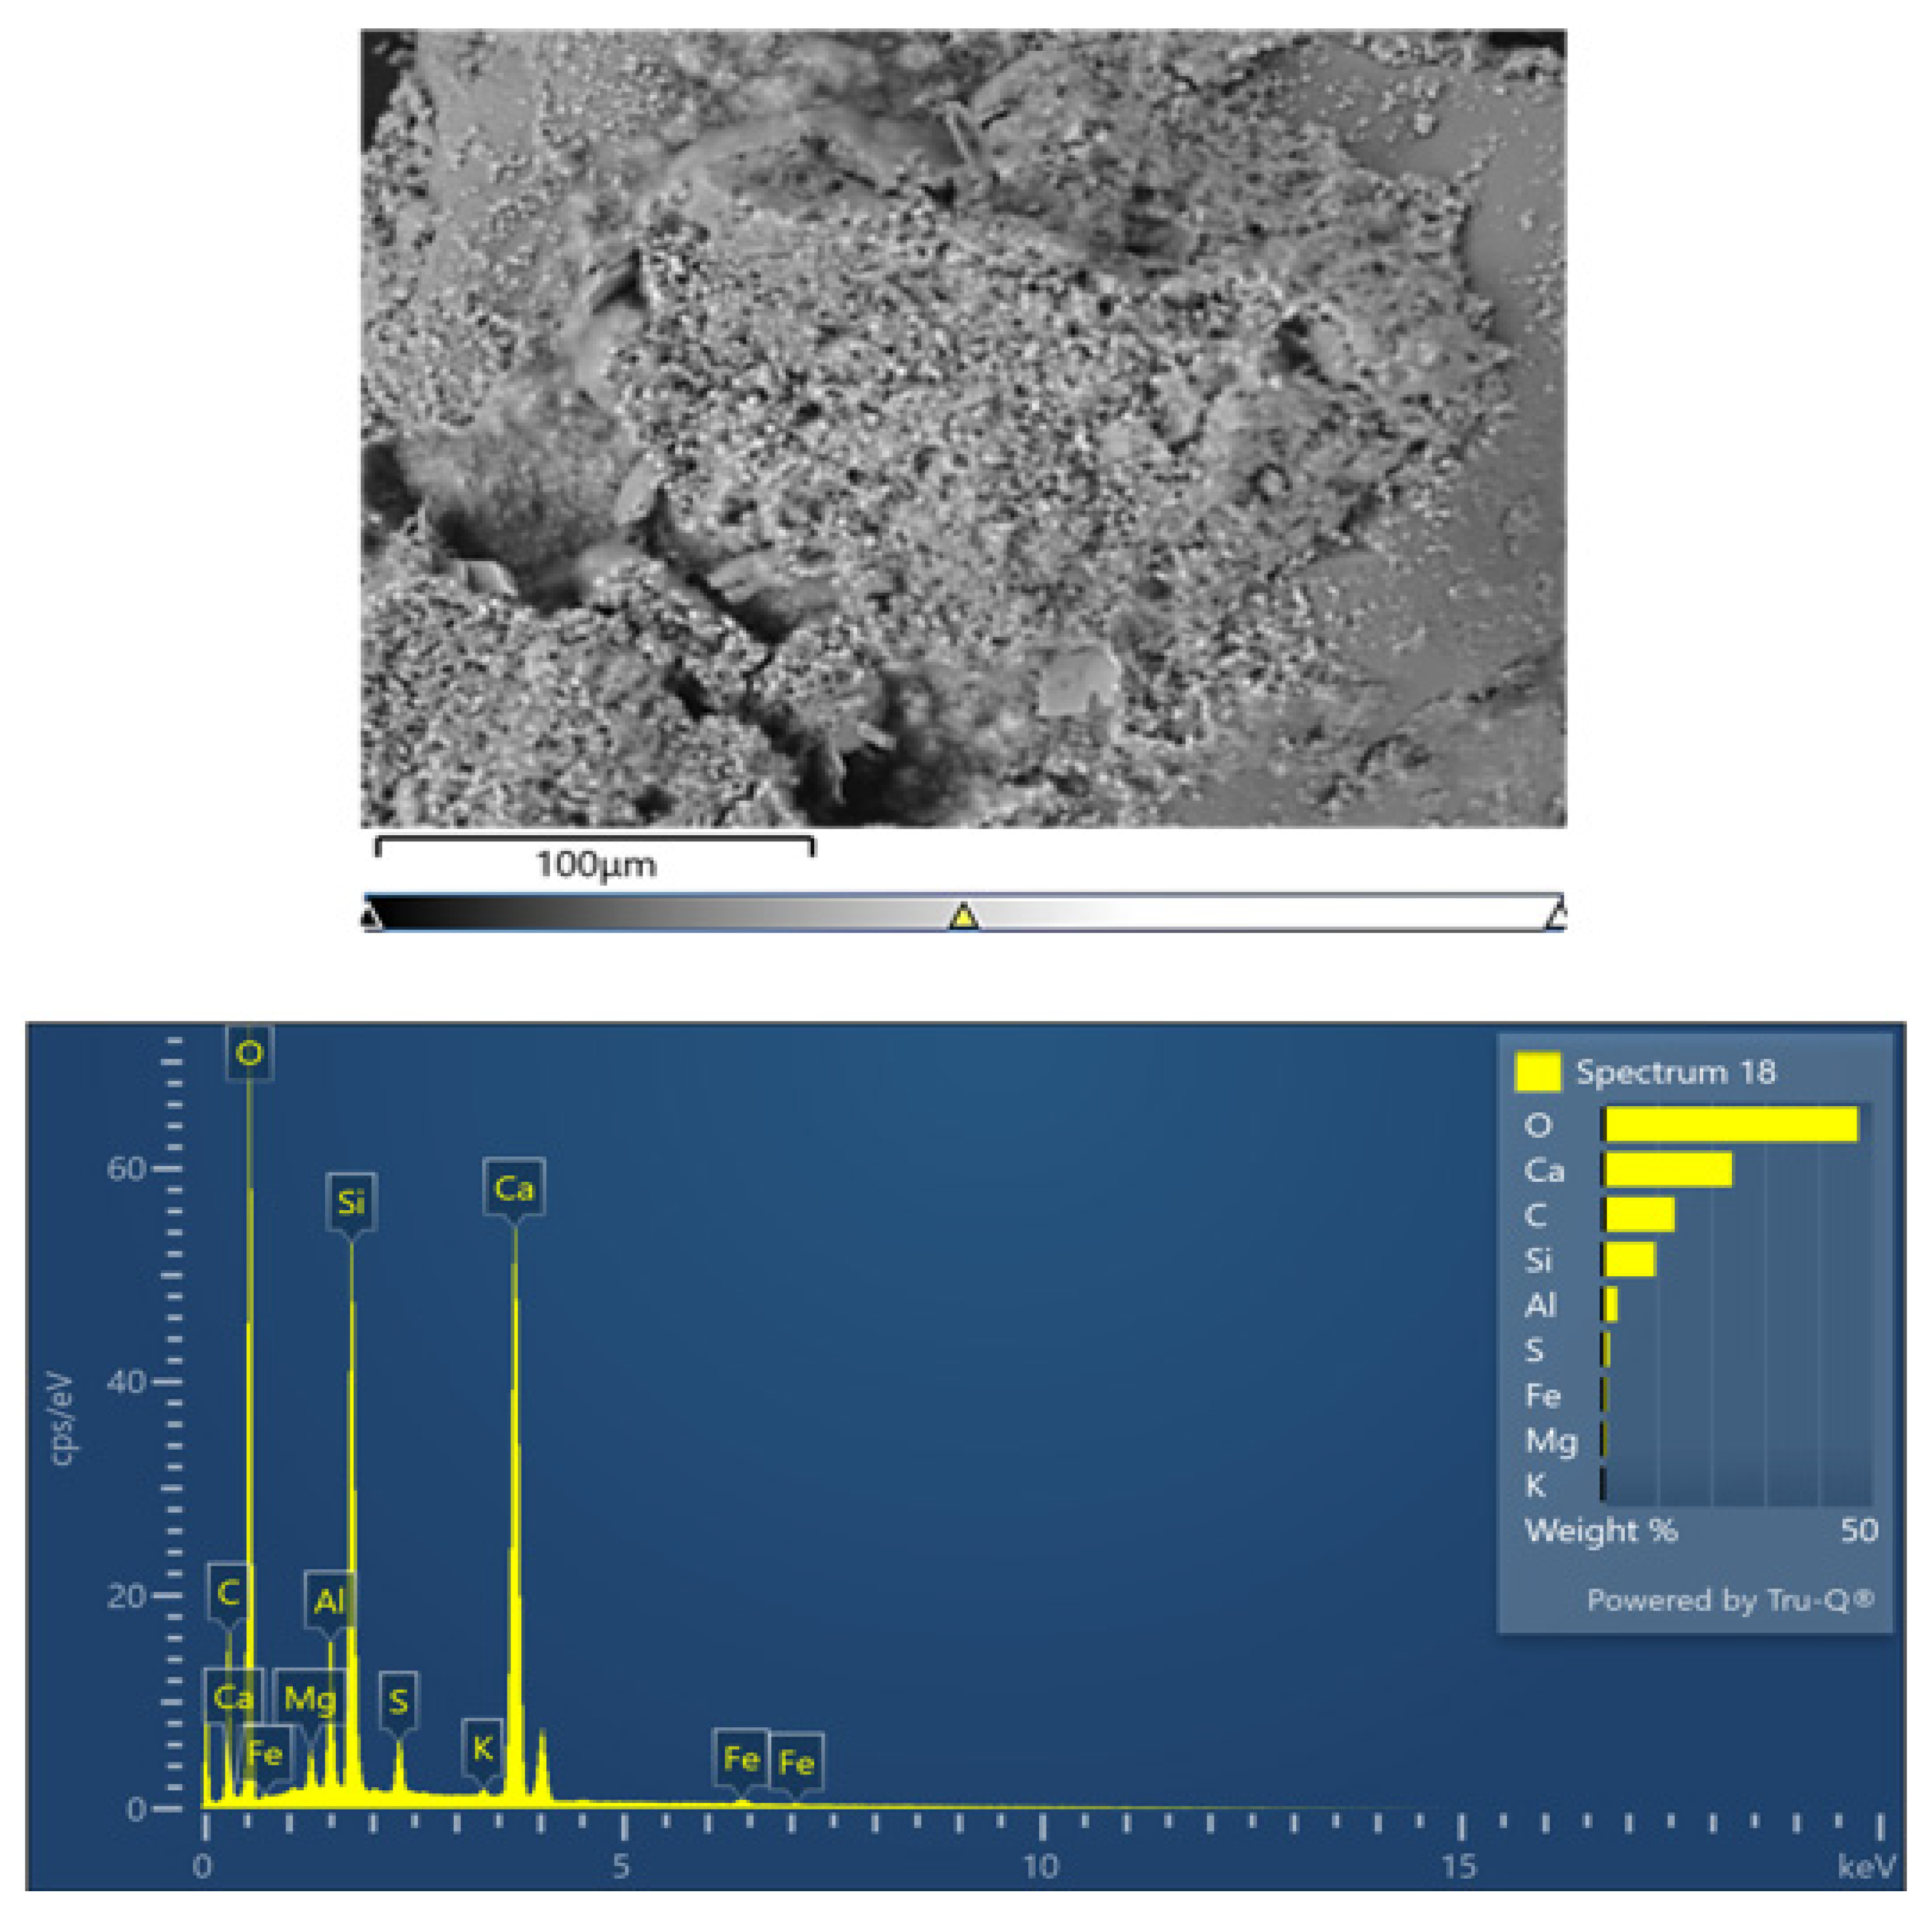
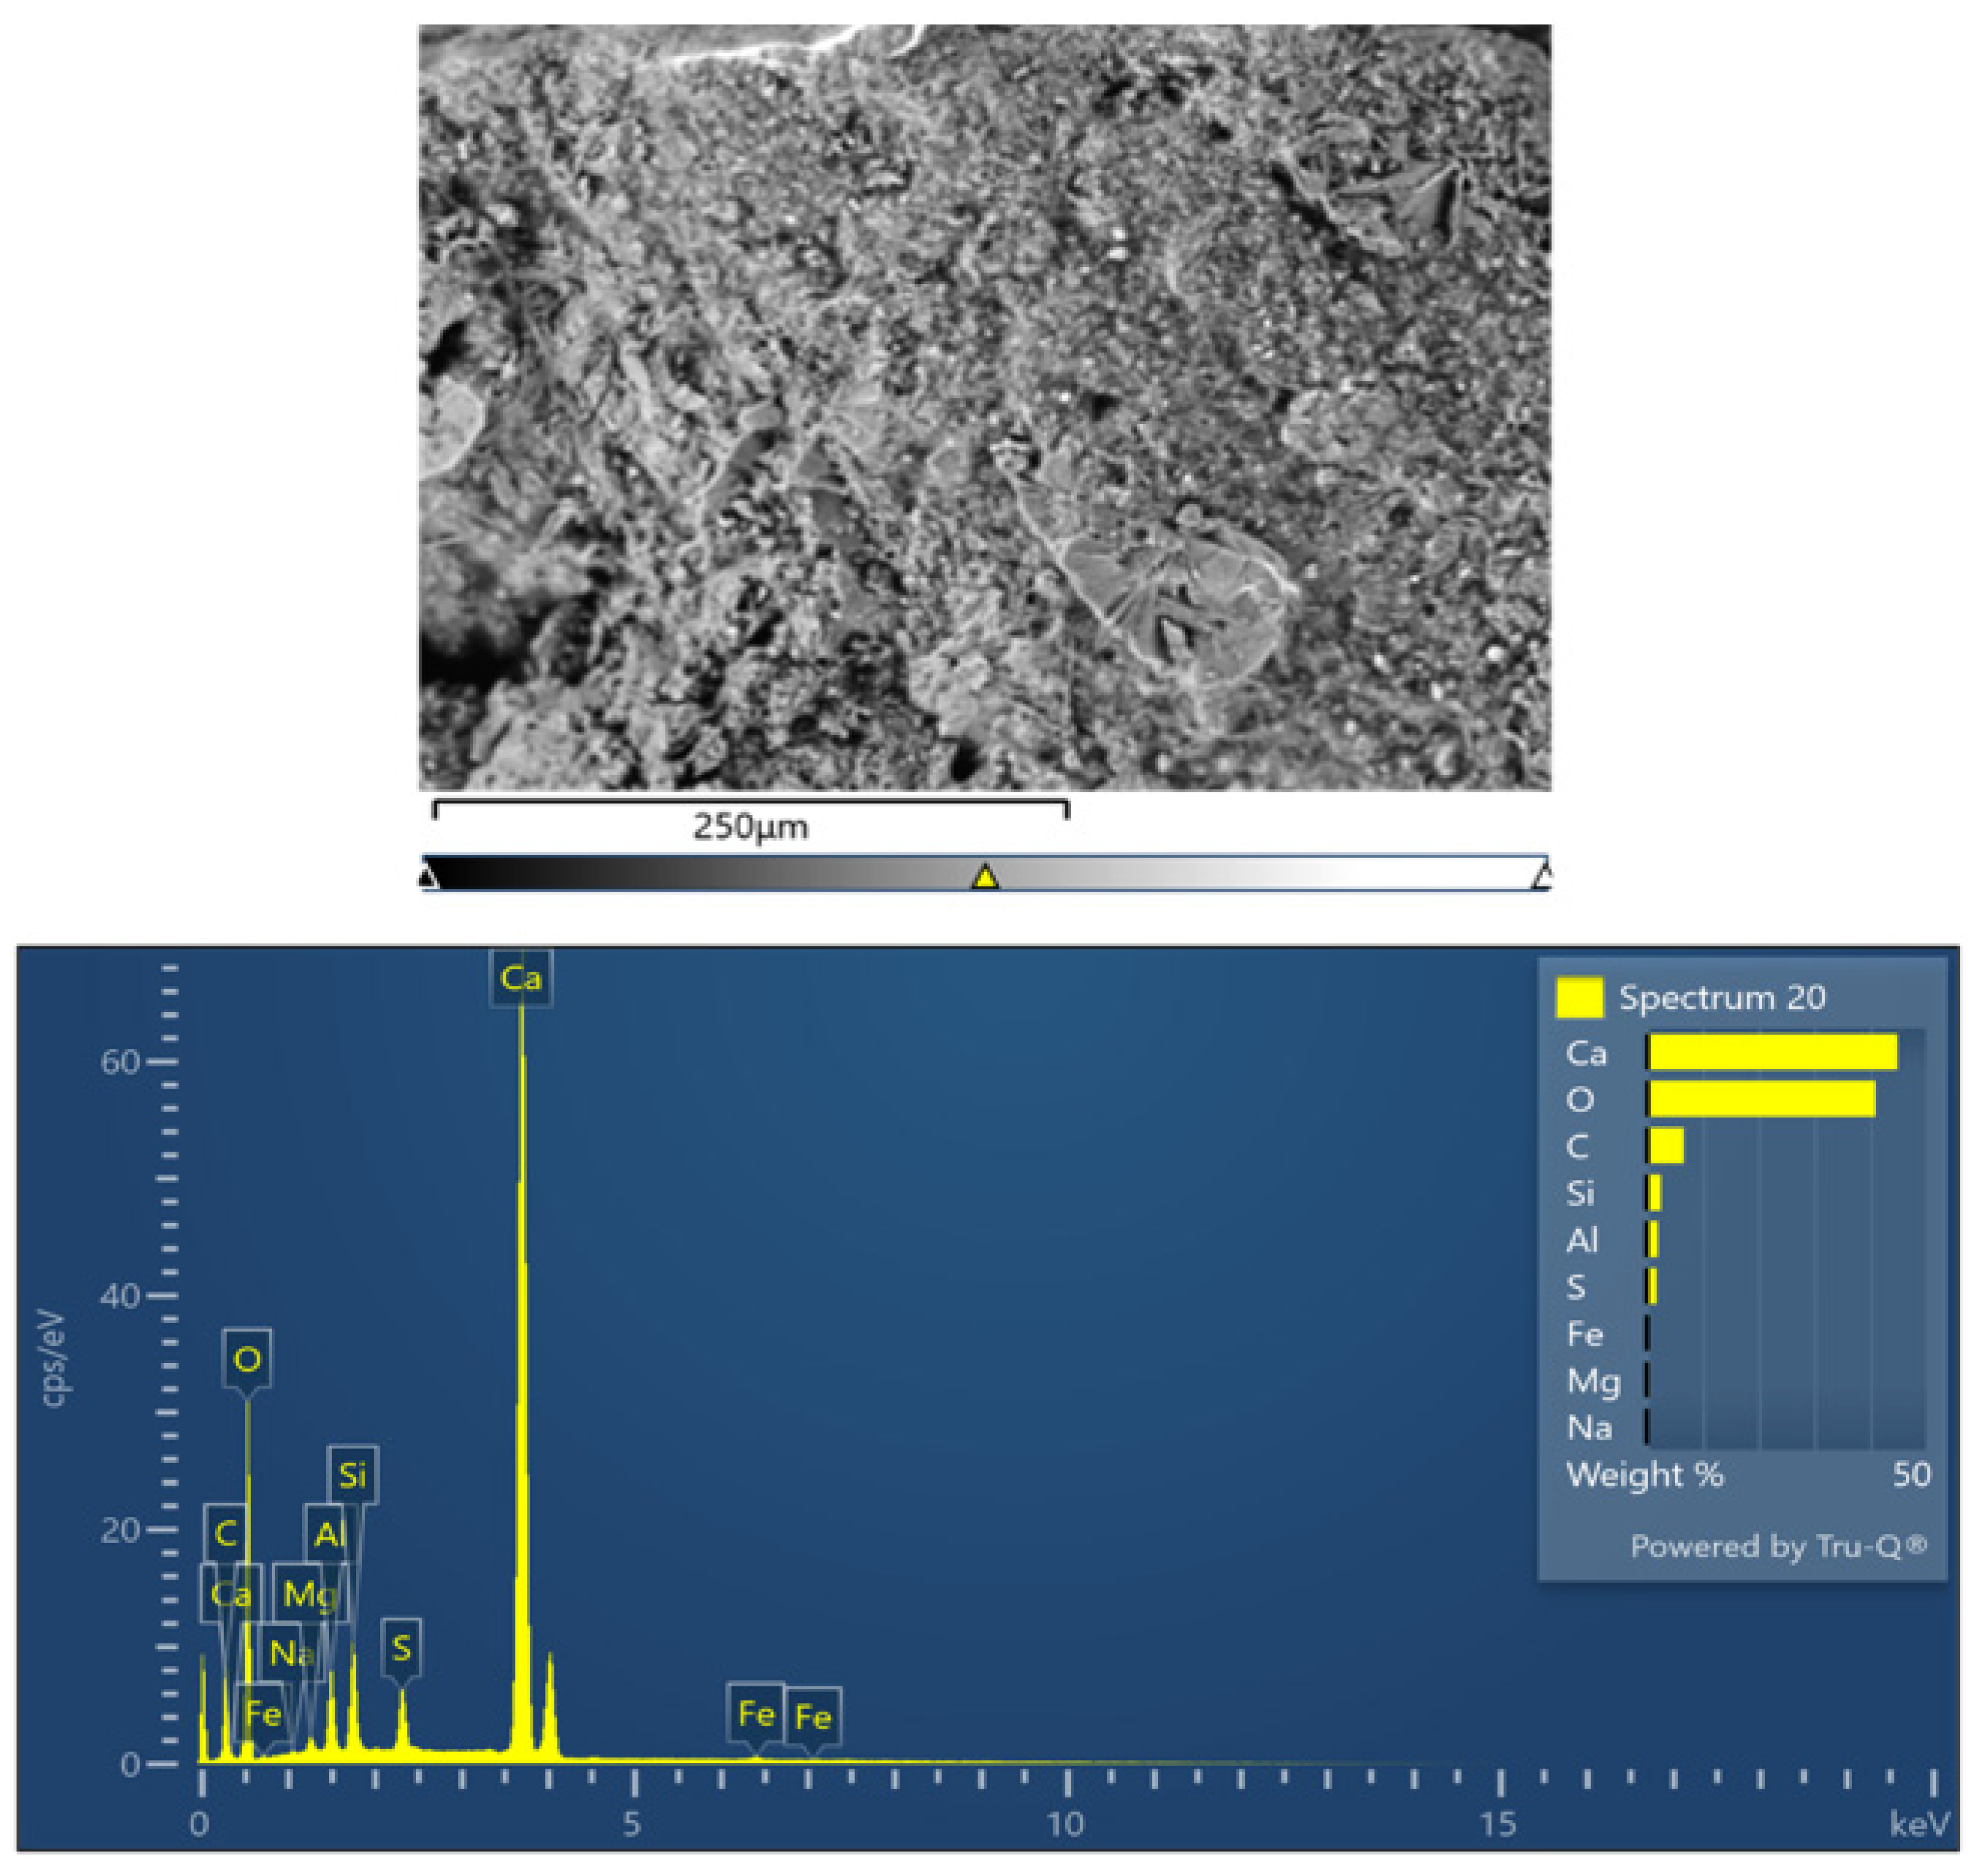
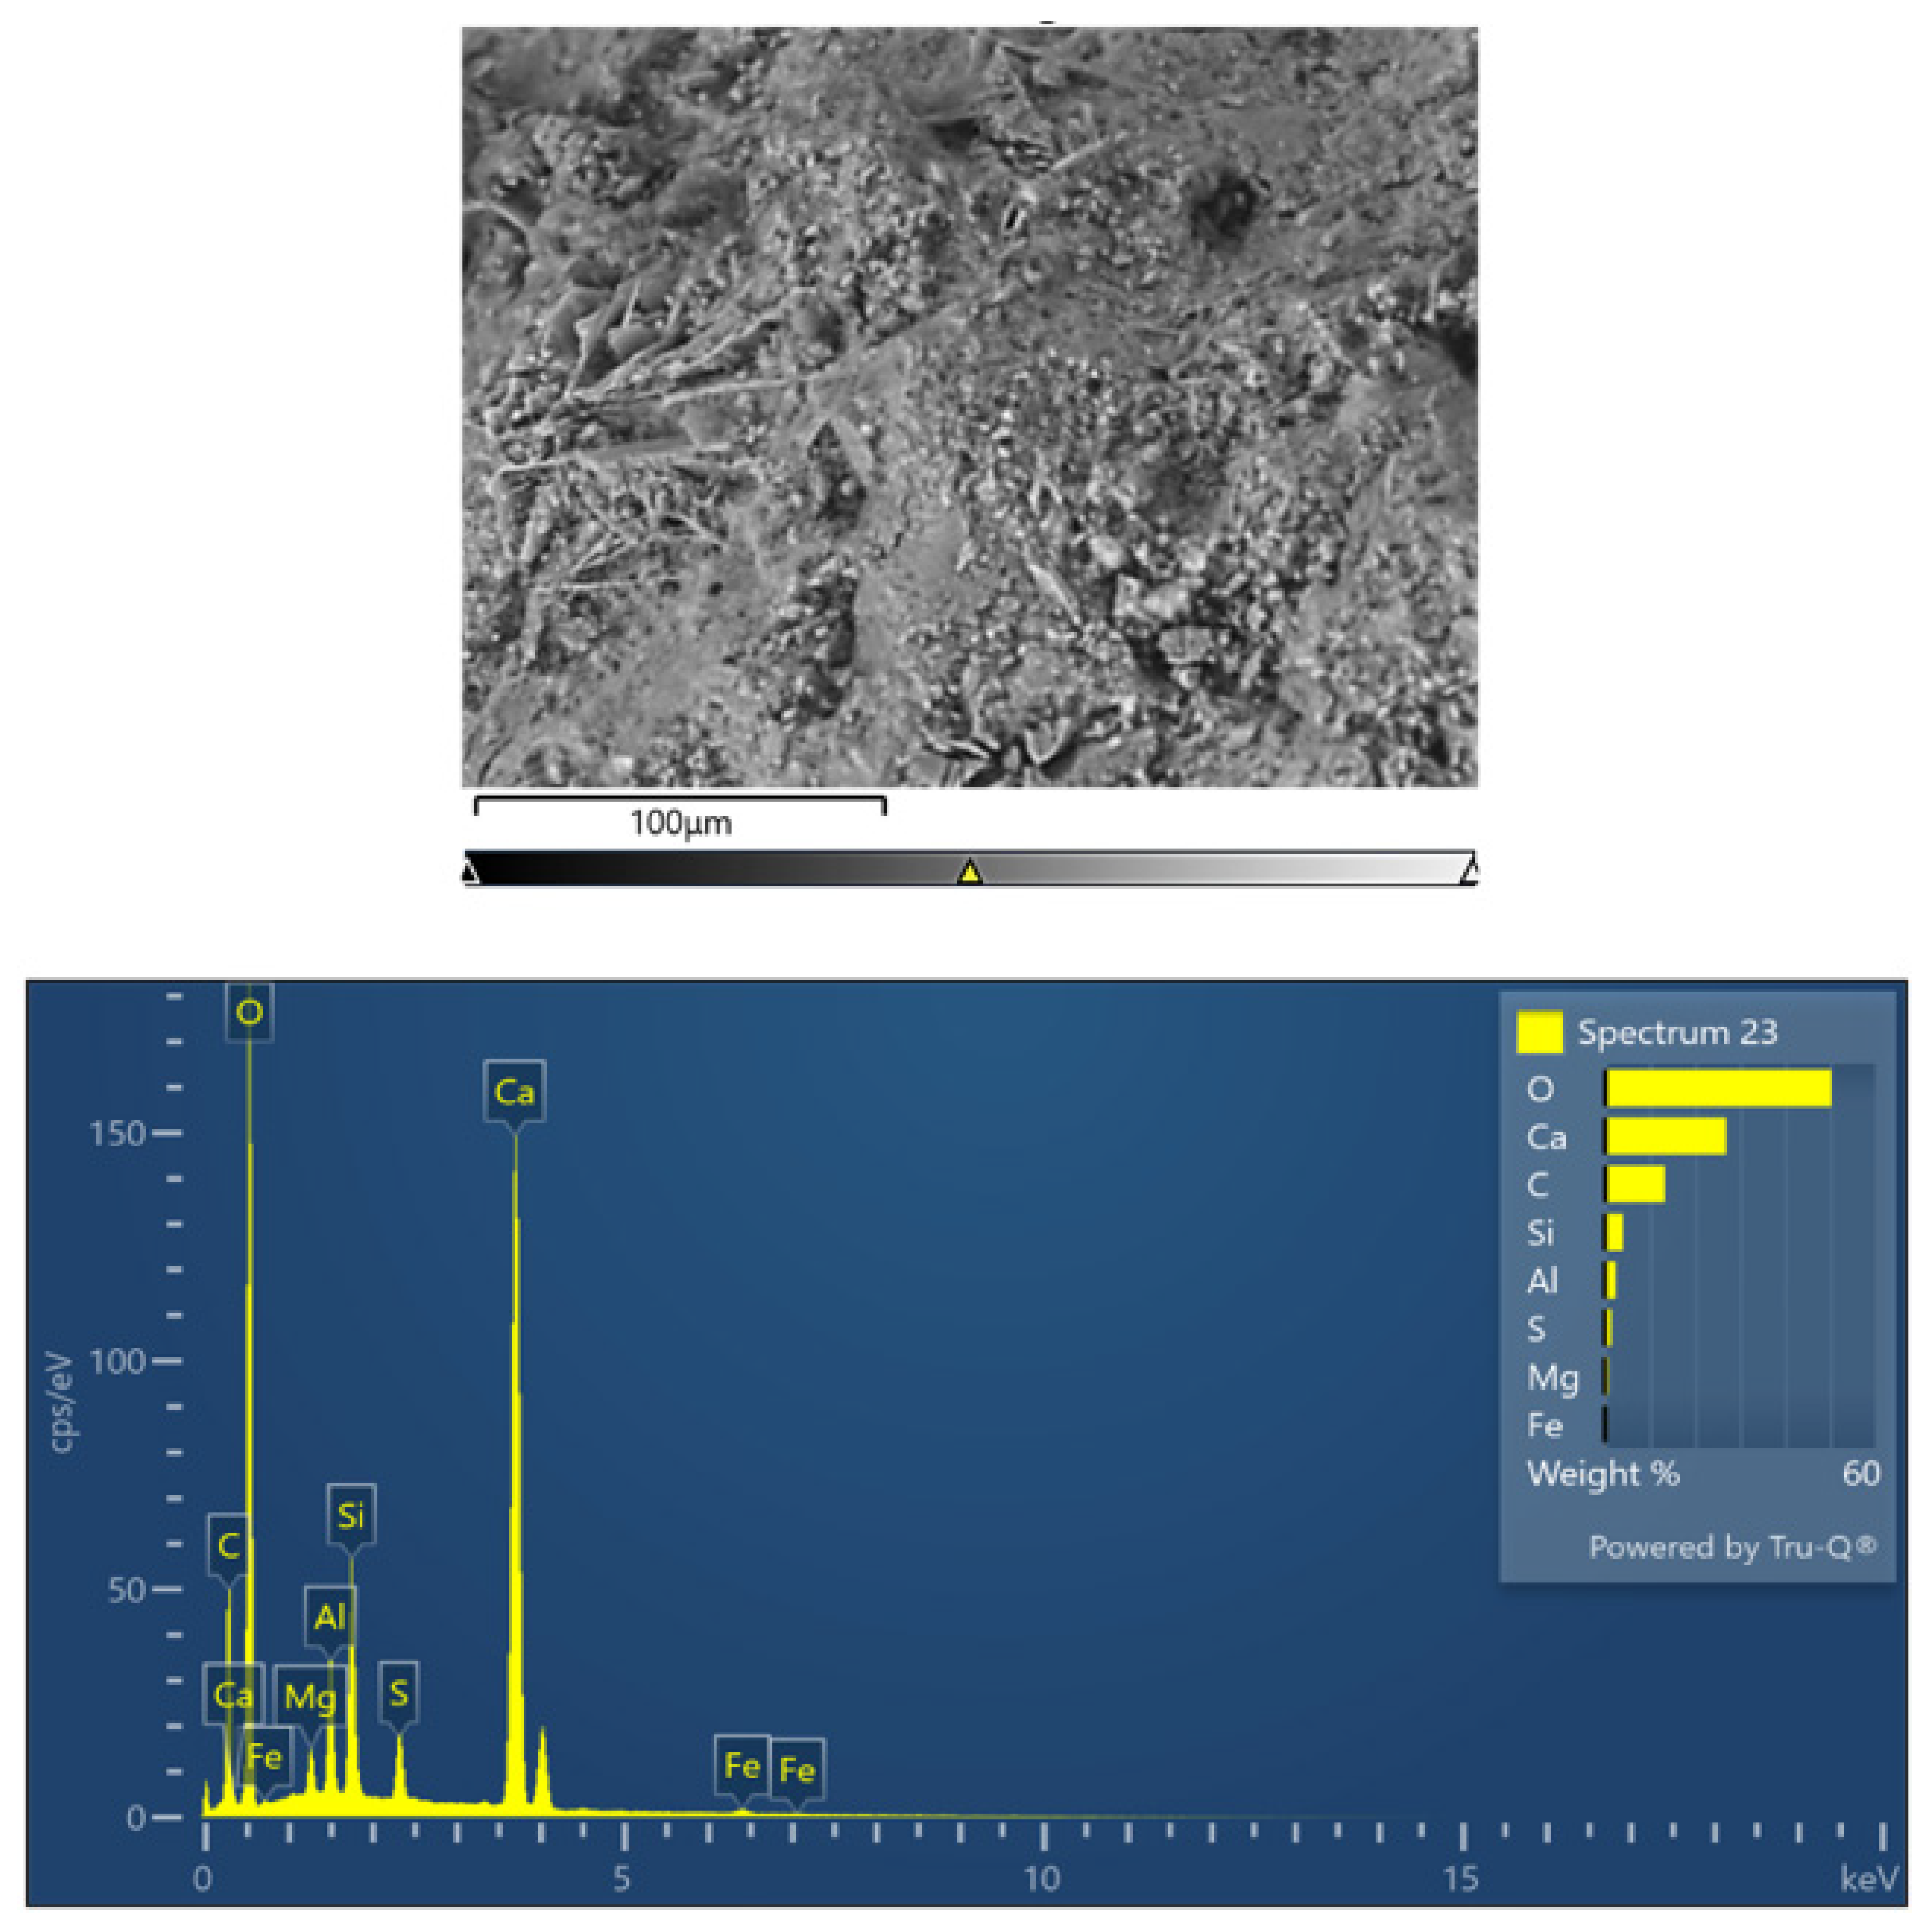
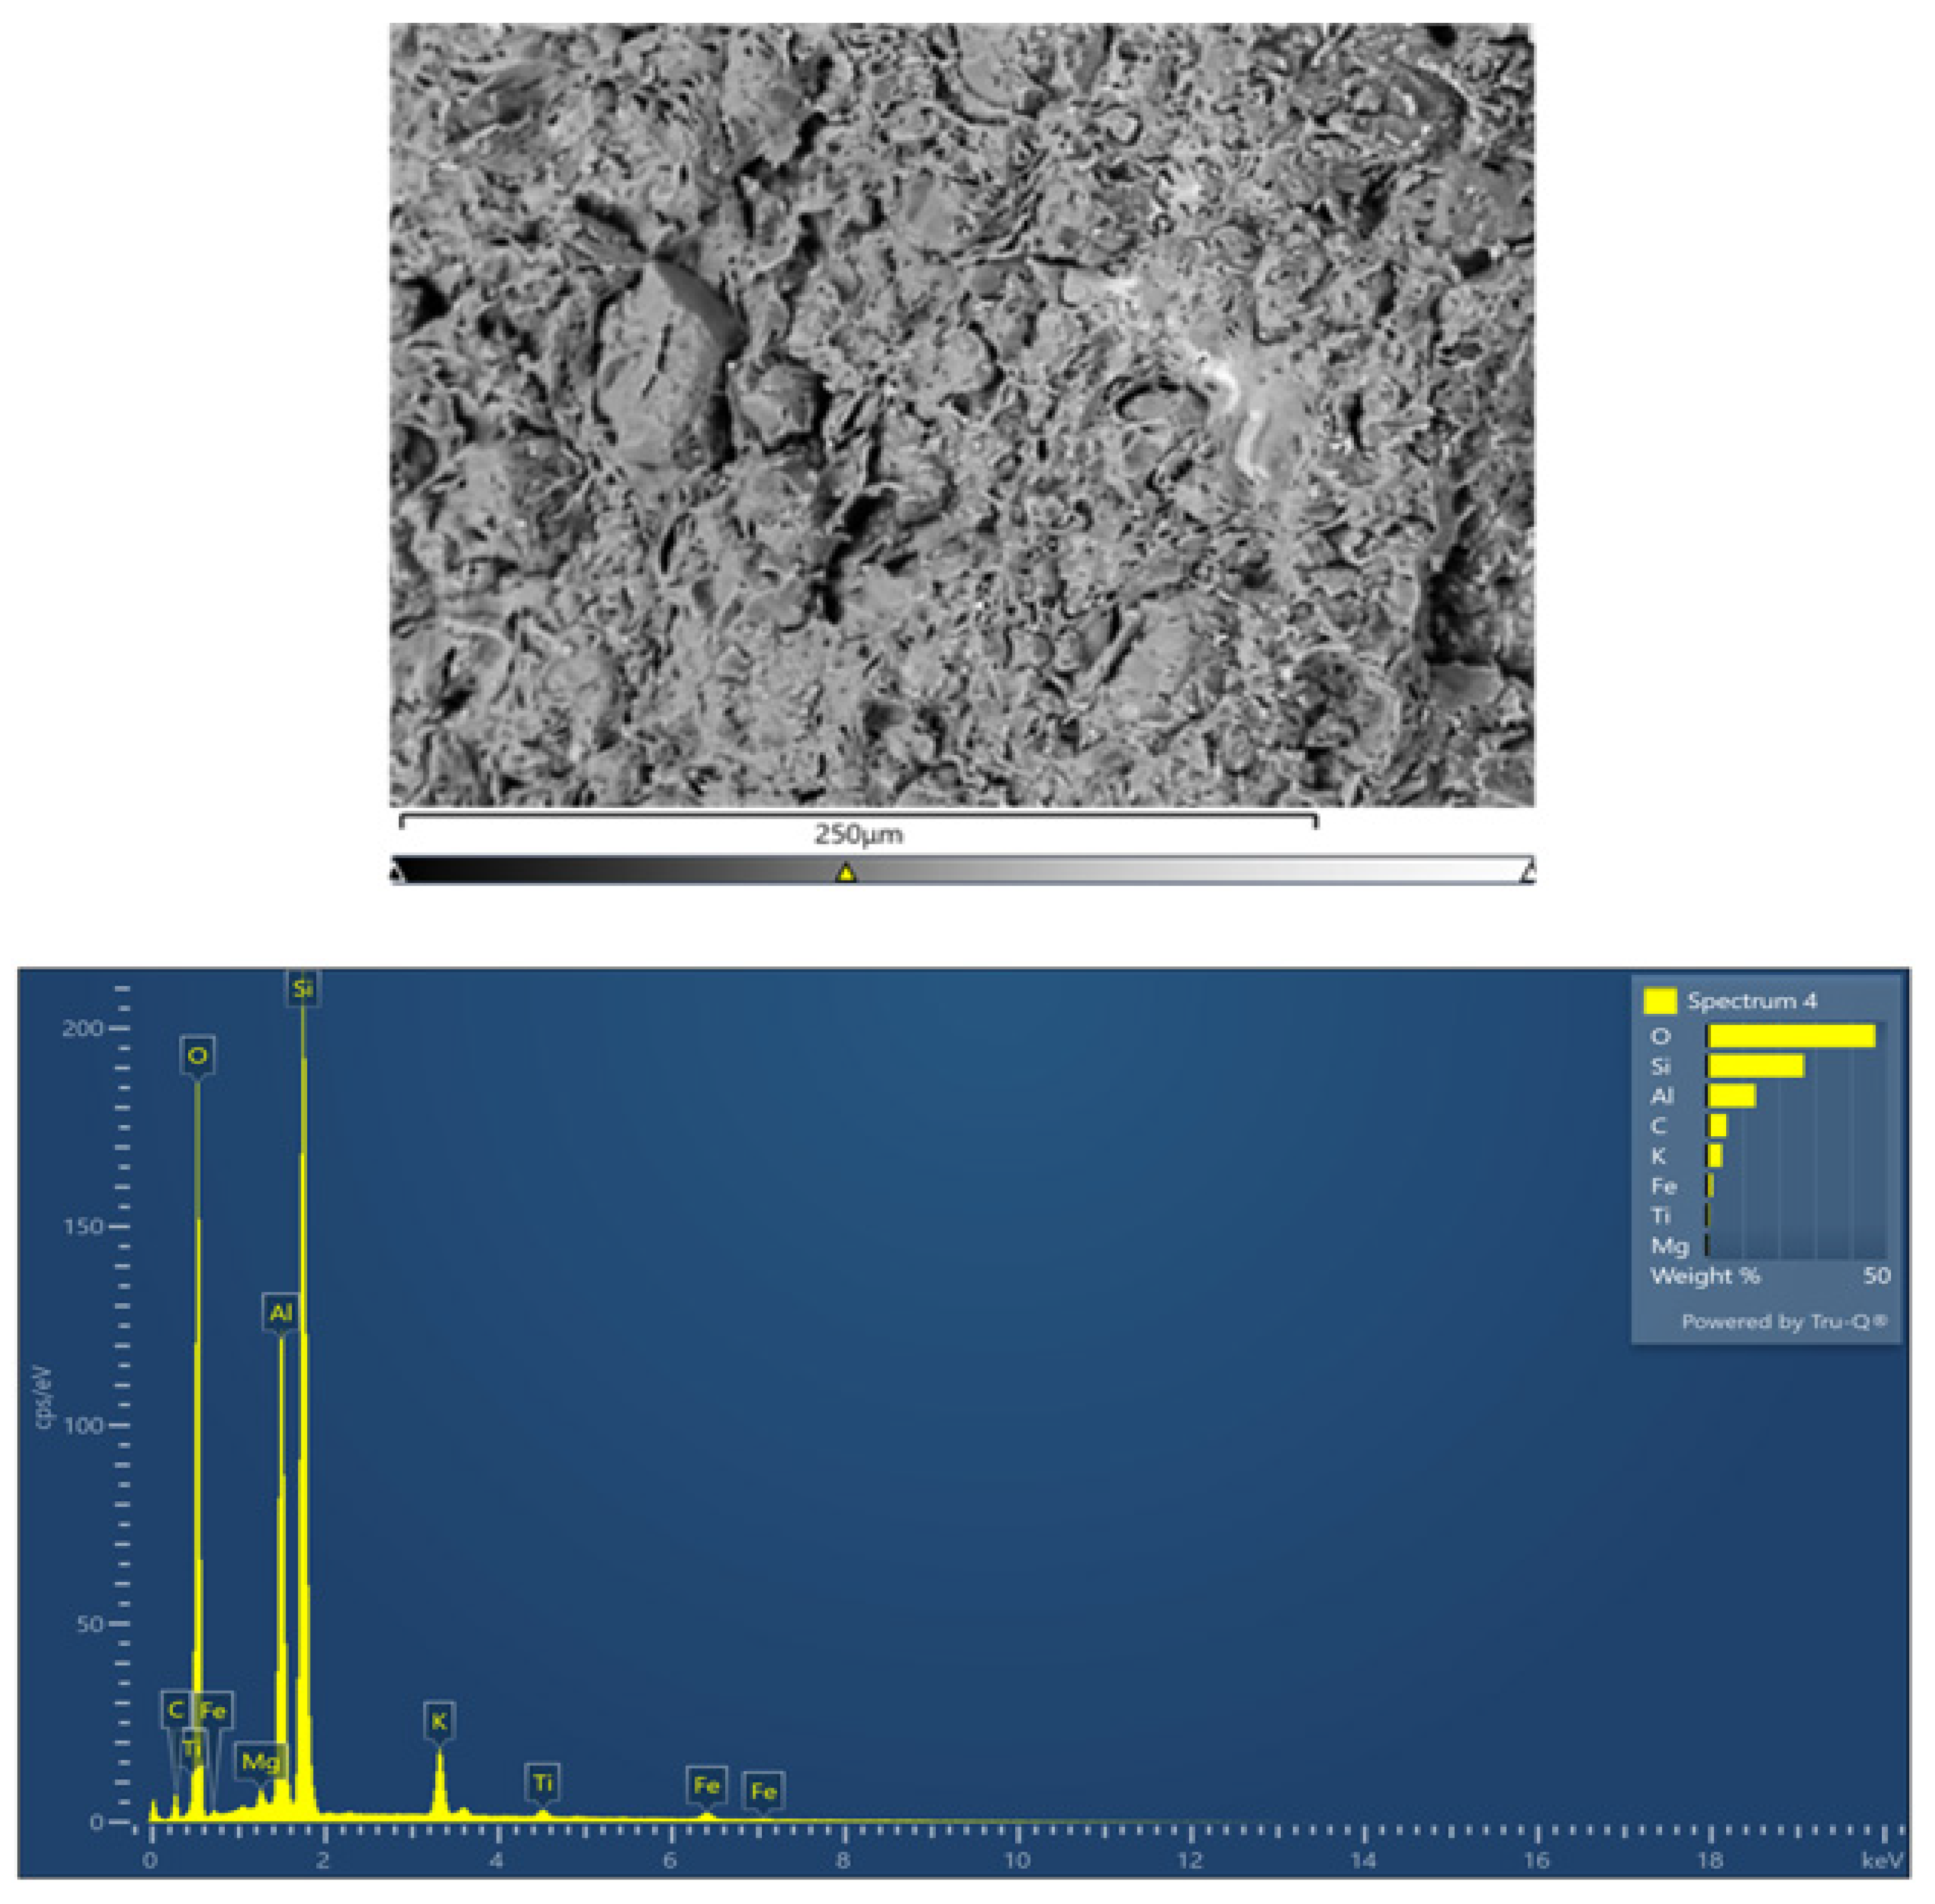
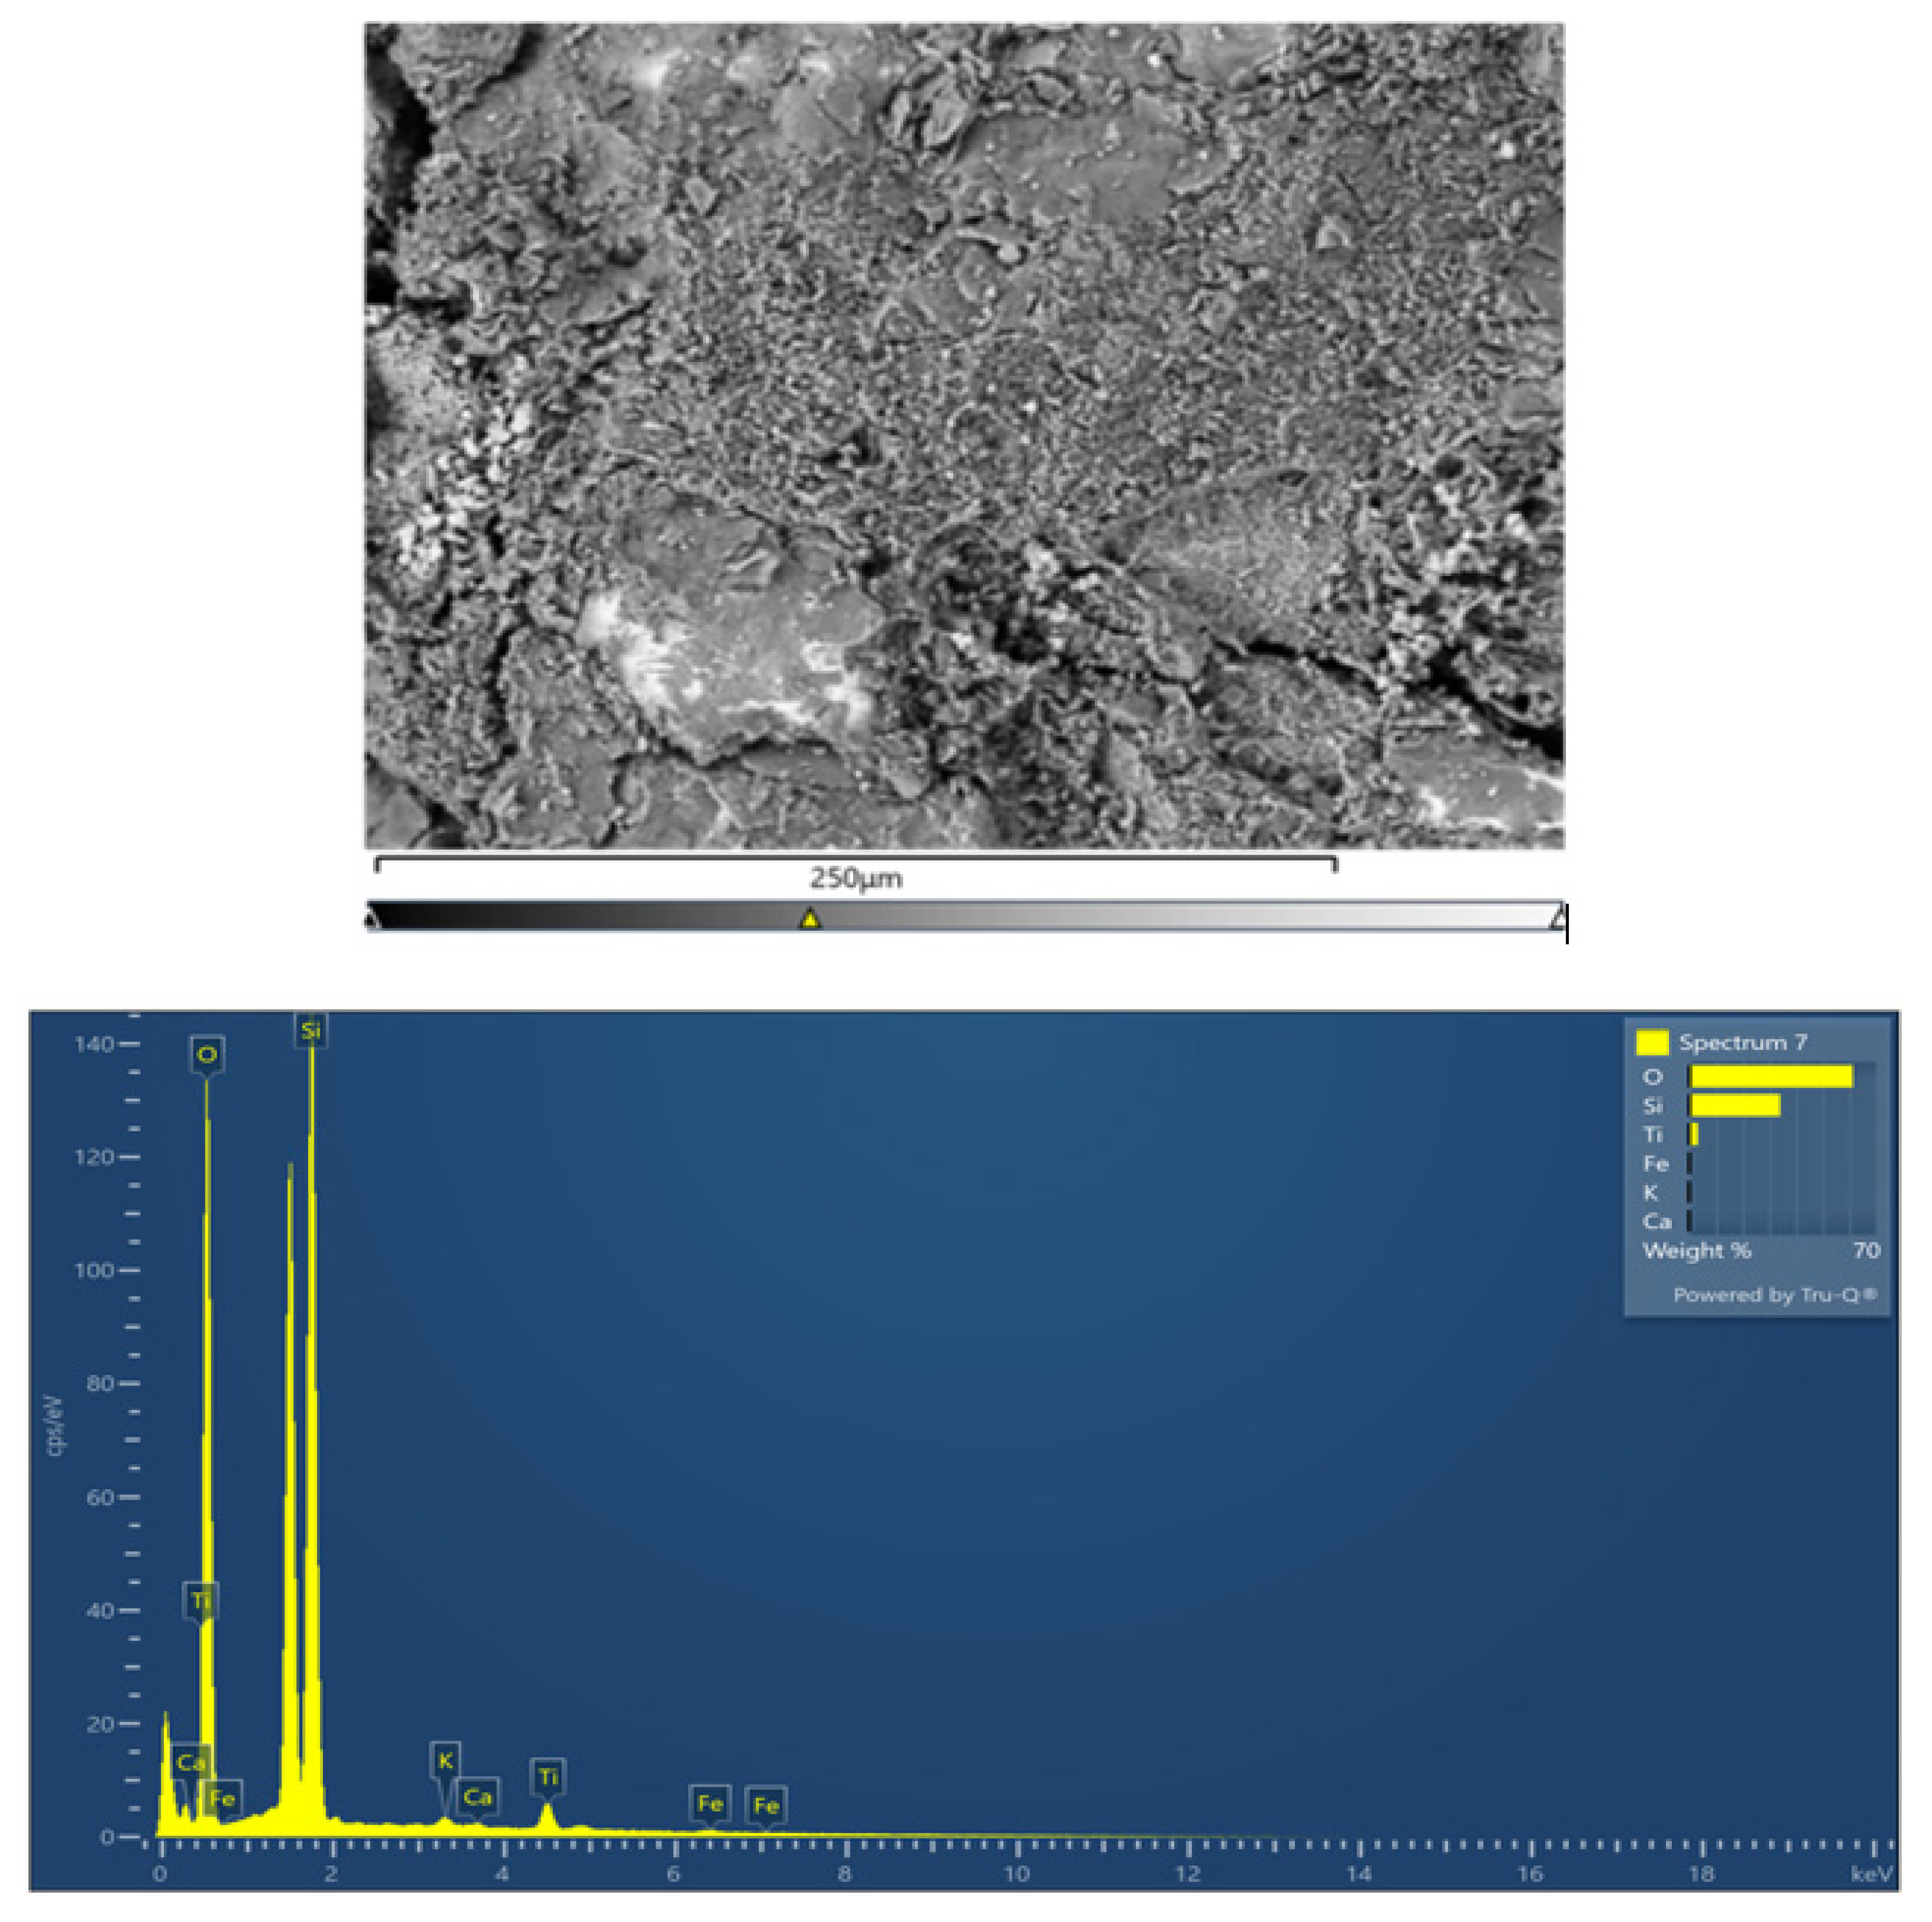
4.5.2. Energy Dispersive X-Ray Spectroscopy (EDS)
5. Conclusions
- The 70:30 LKD–GGBFS blend ratio can be used to entirely replace OPC in combination with 5 and 10% TRWC replacement by volume of sand to produce green bricks. Including these recycled wastes in bricks has shown that these engineered bricks meet industry standards while contributing to environmental sustainability.
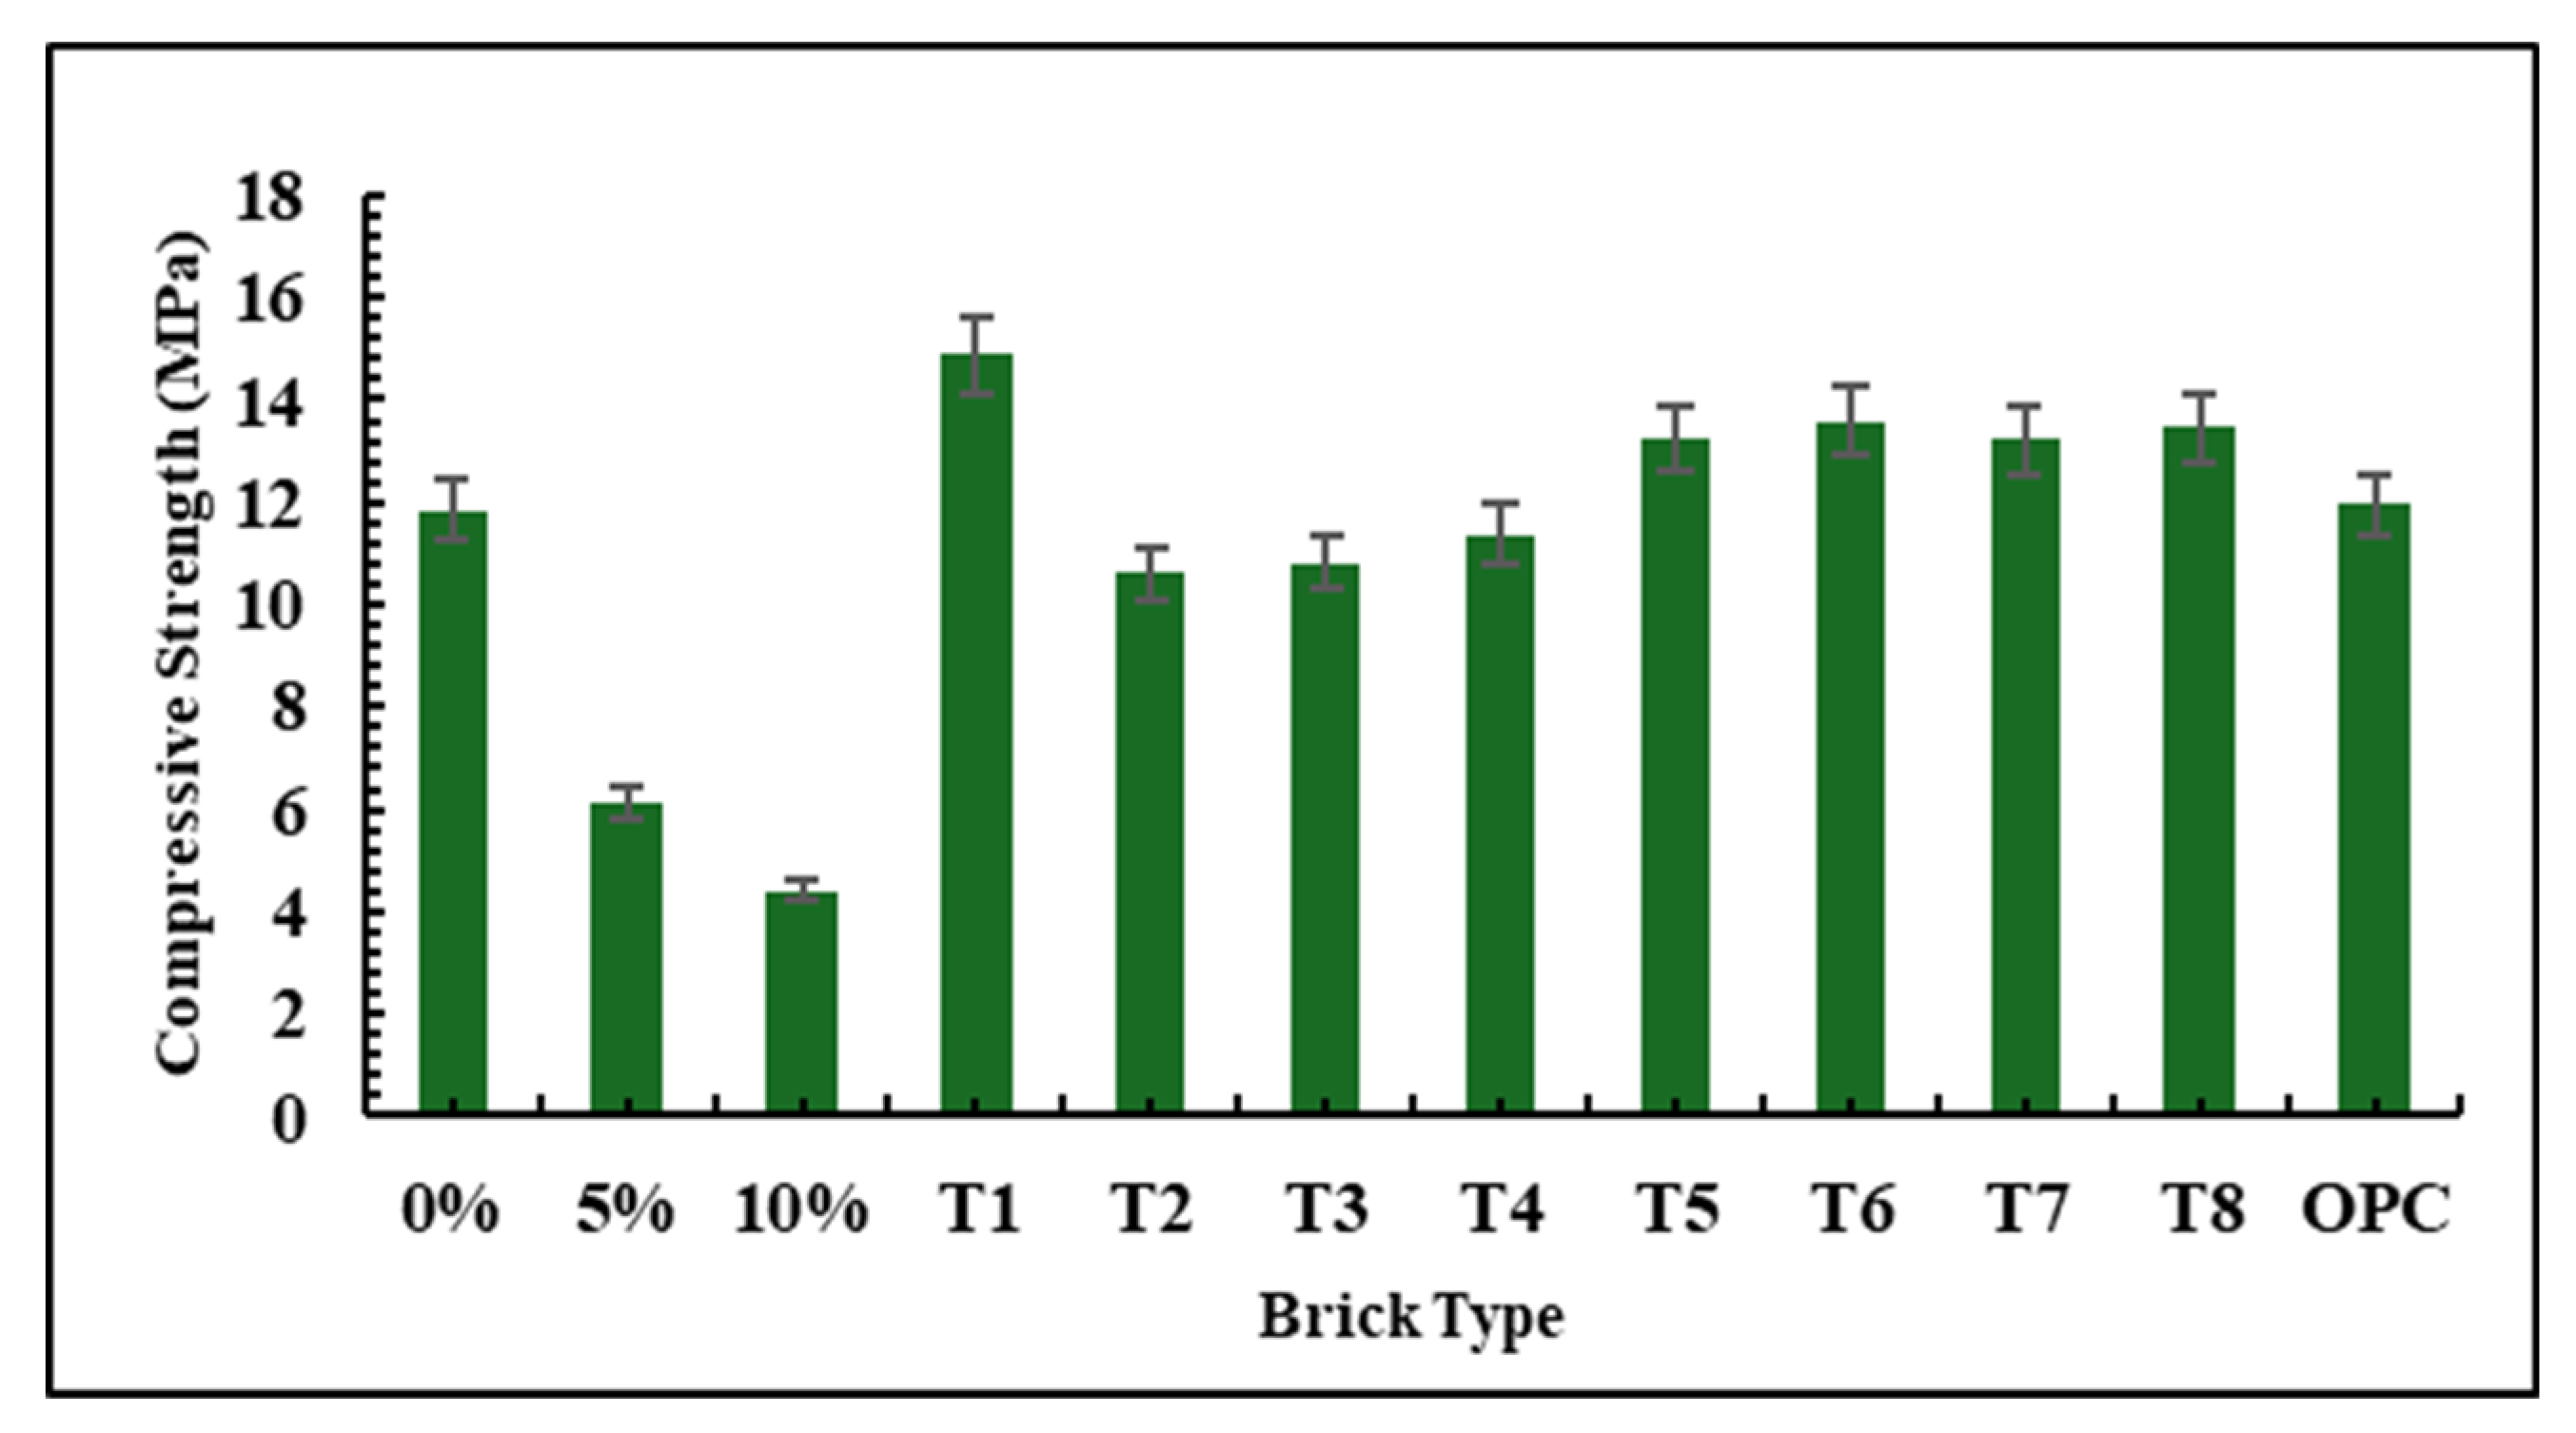
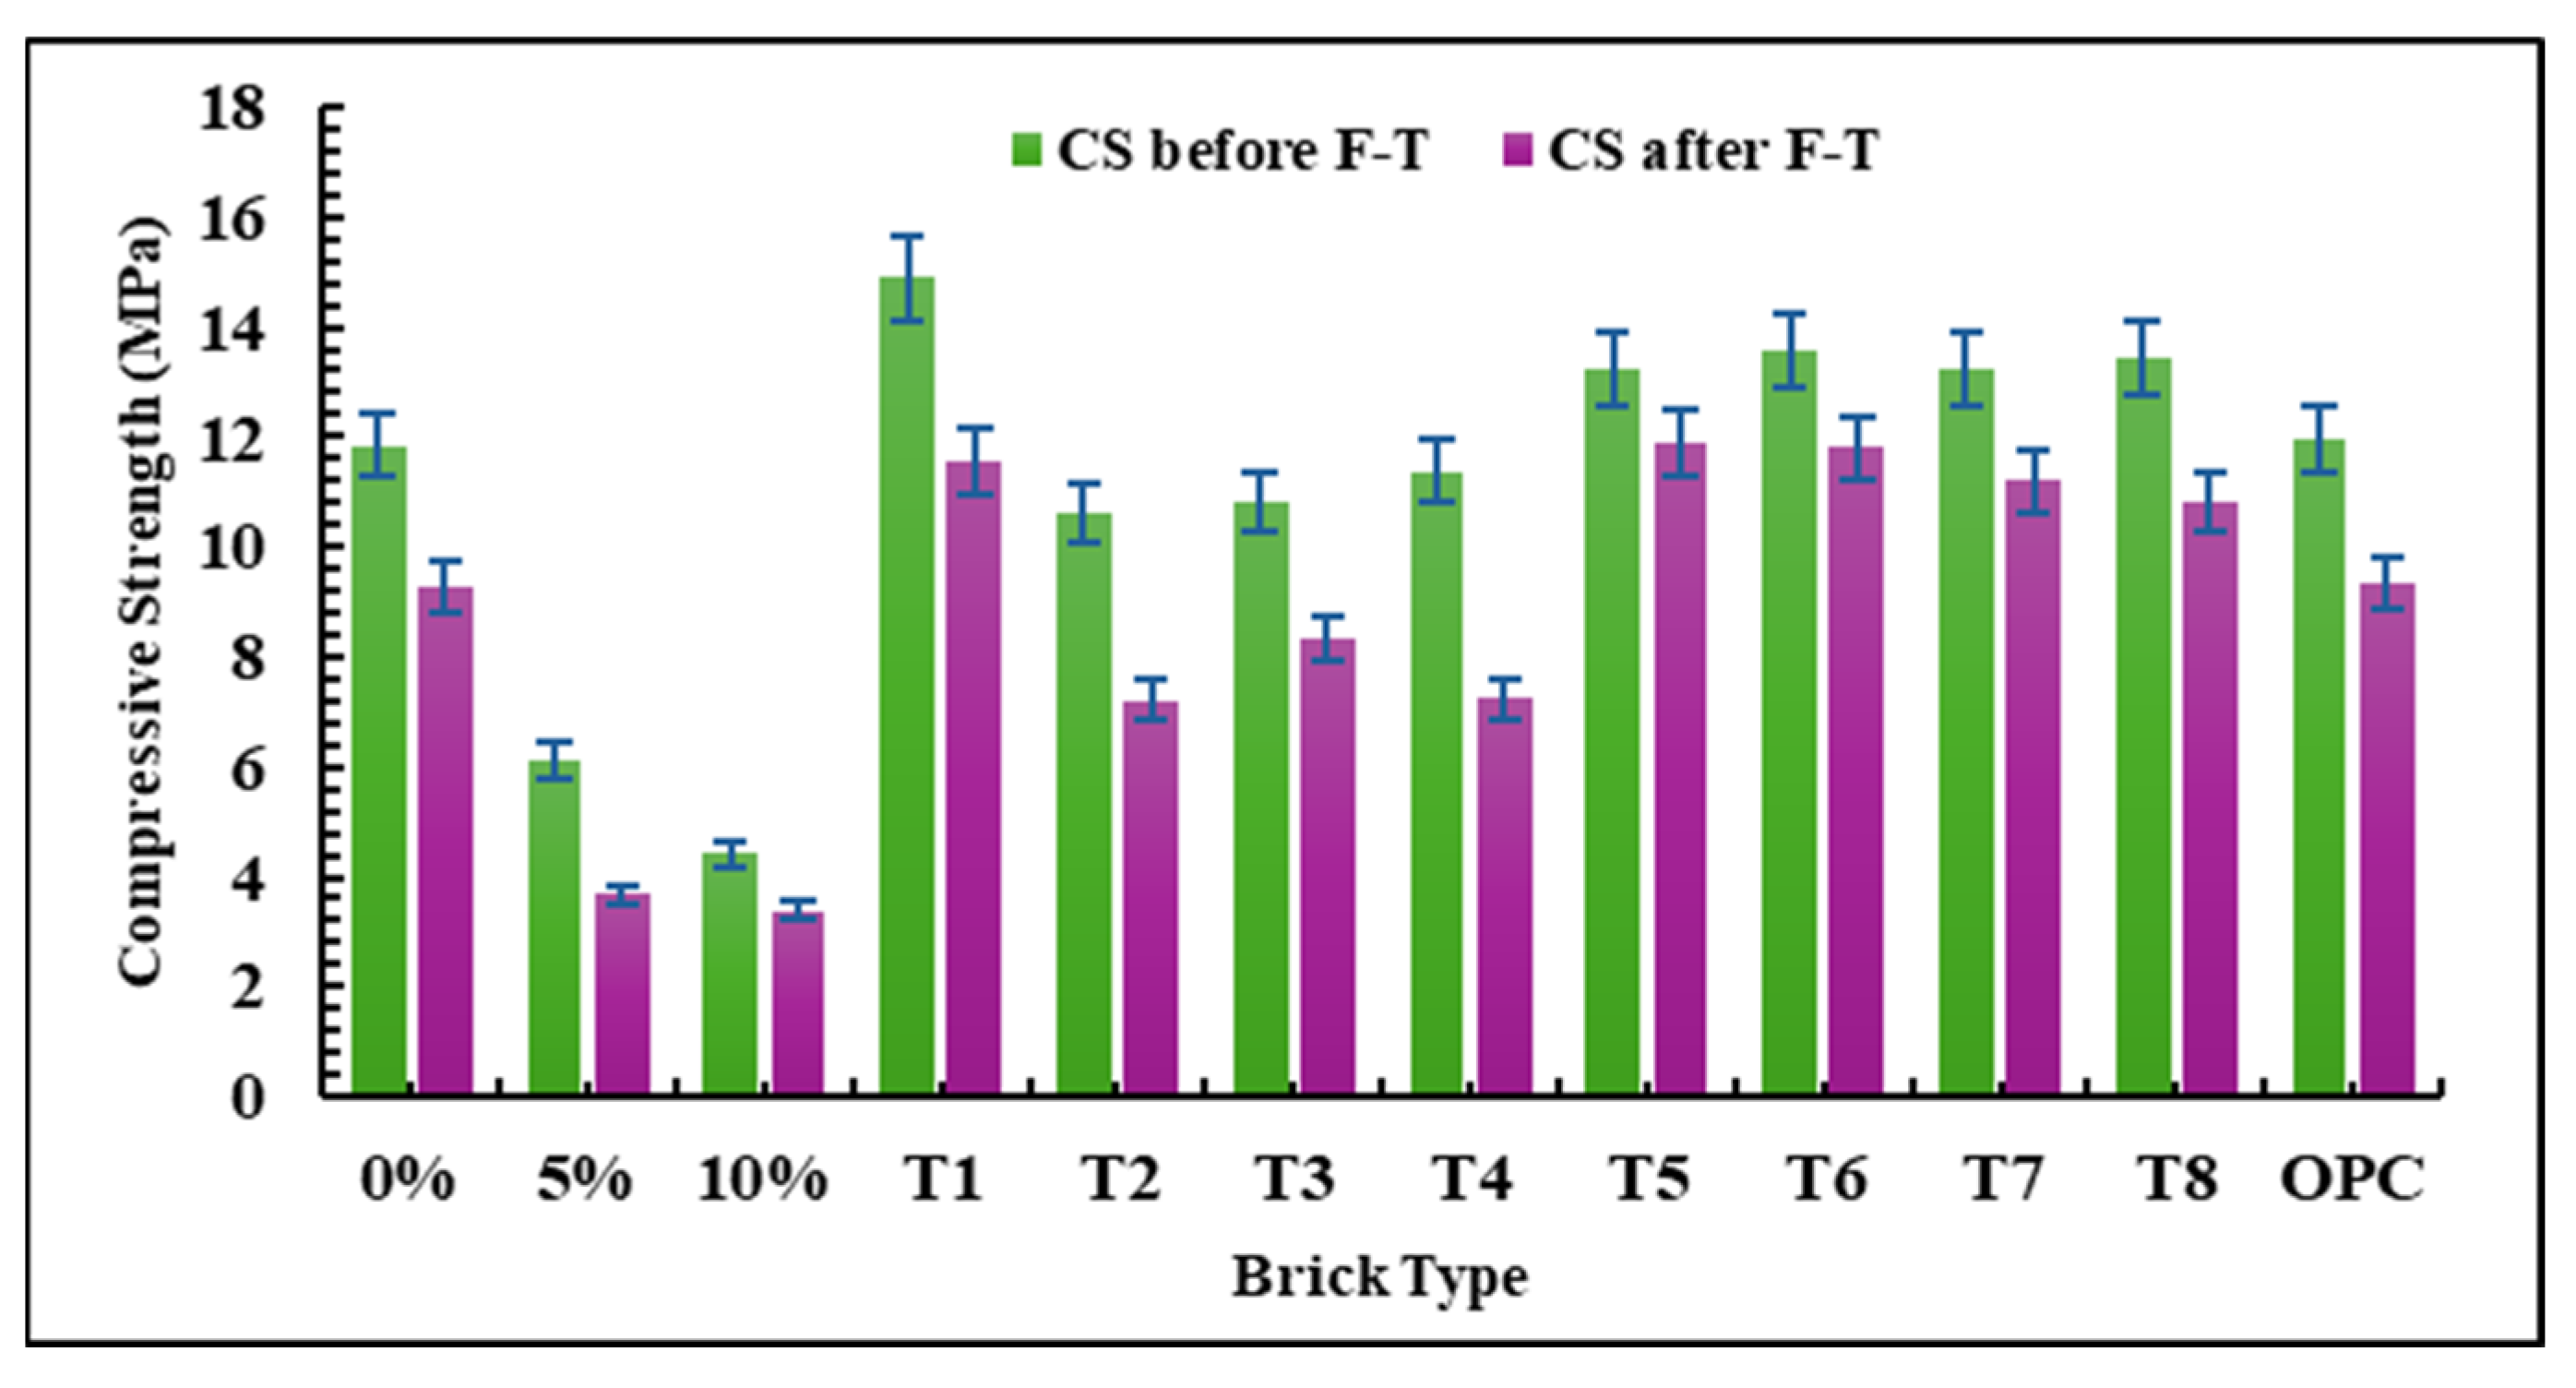
- CS for the 0, 5, and 10% TRWC replacement bricks increased from 6, 5, and 3 MPa at 28 days of moist curing to 12, 6, and 4 MPa after almost one year of exposure to external environmental conditions, indicating 100, 20, and 33.33% increments in strength, respectively. The improved strengths recorded are in line with strength development in slag, which is slower before 28 days compared to OPC, leading to products whose strength gain continues gradually beyond 28 days [49]. Additionally, the CS recorded met the minimum requirements for load-bearing and non-load-bearing bricks.
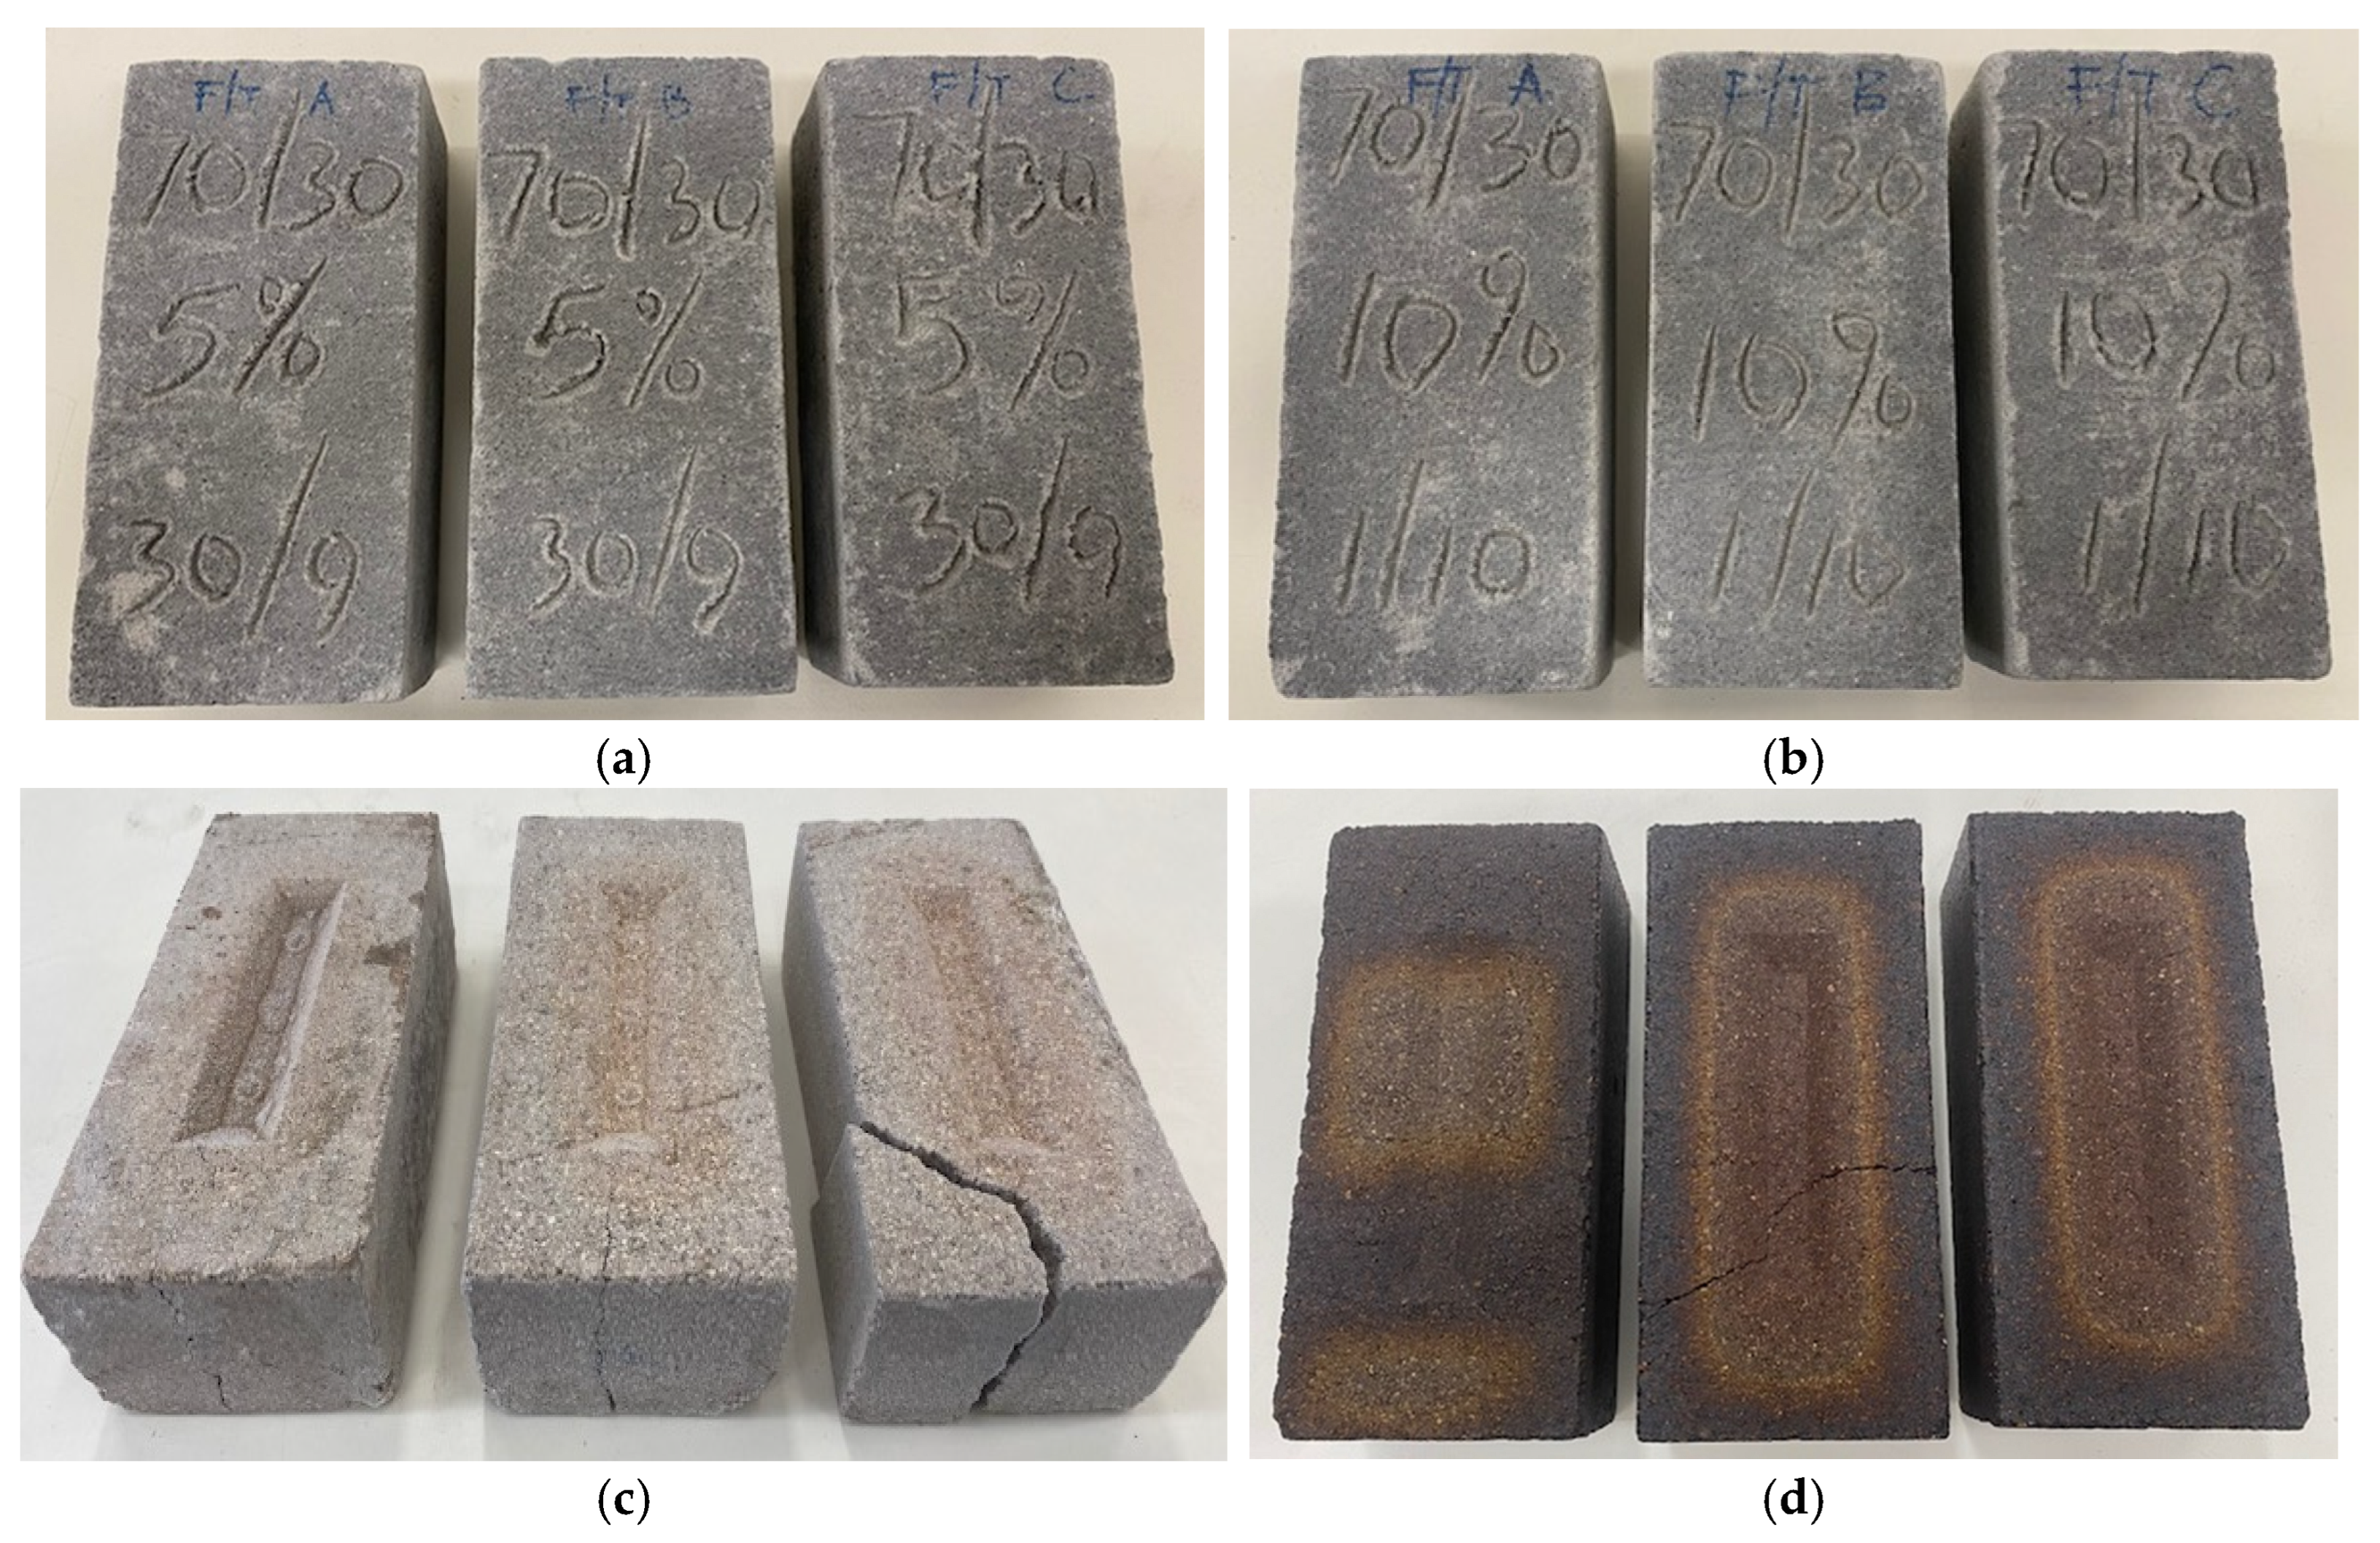
- F-T test performed on the laboratory bricks to understand the effect of F-T on the CS of the bricks after 10 cycles showed that despite the abrasions on the bricks that occurred during the F-T cycles, and notwithstanding the very low temperatures that the bricks were subjected to, they maintained a minimum CS of 3 MPa, indicating that the bricks can withstand repeated cycles of water freezing and expanding within their pores without losing structural integrity.
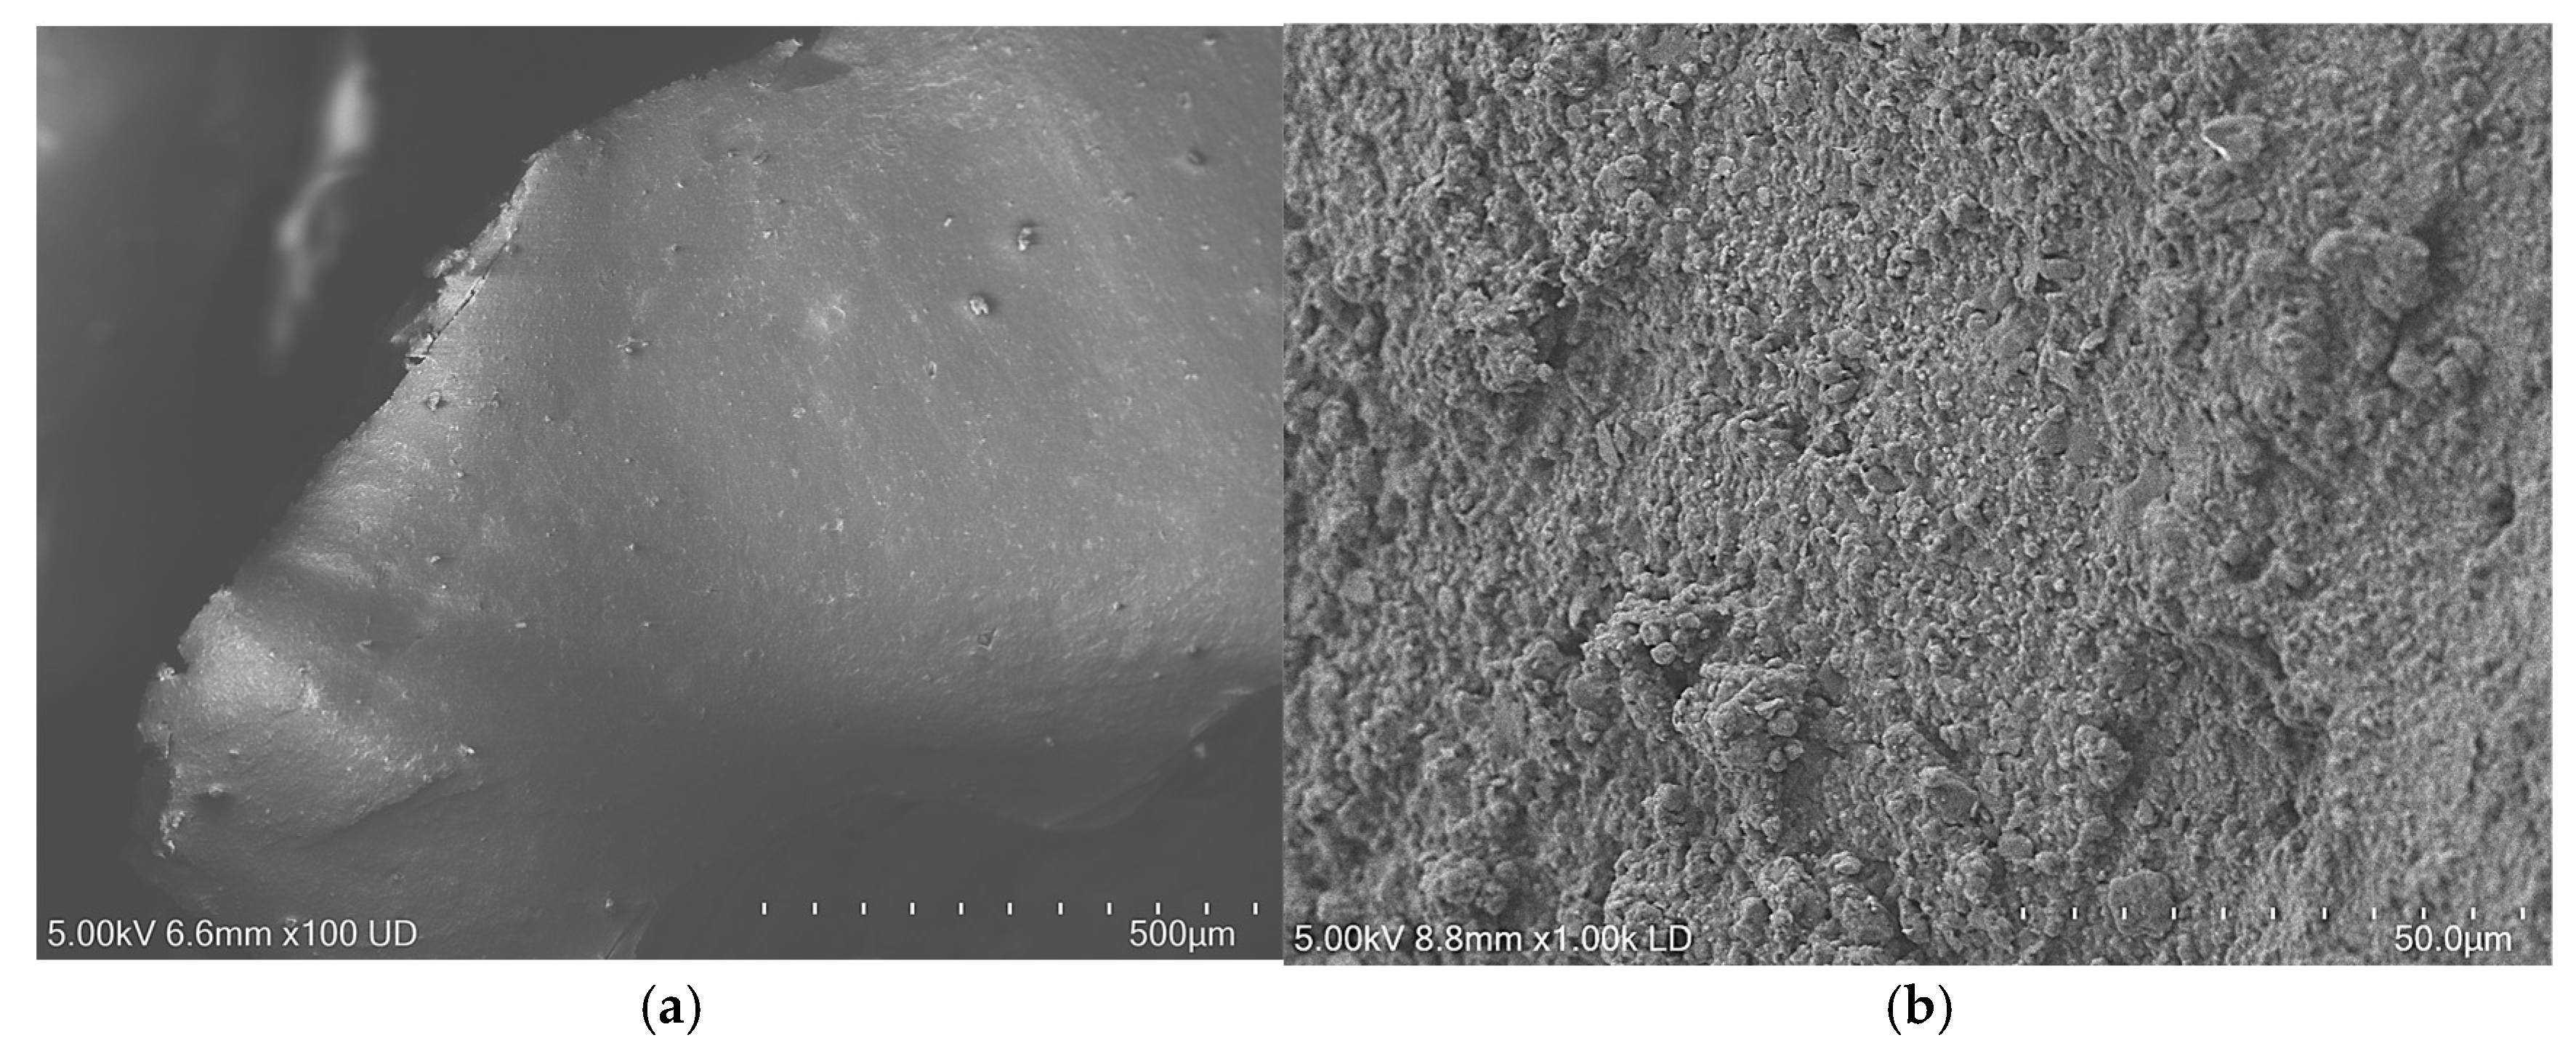
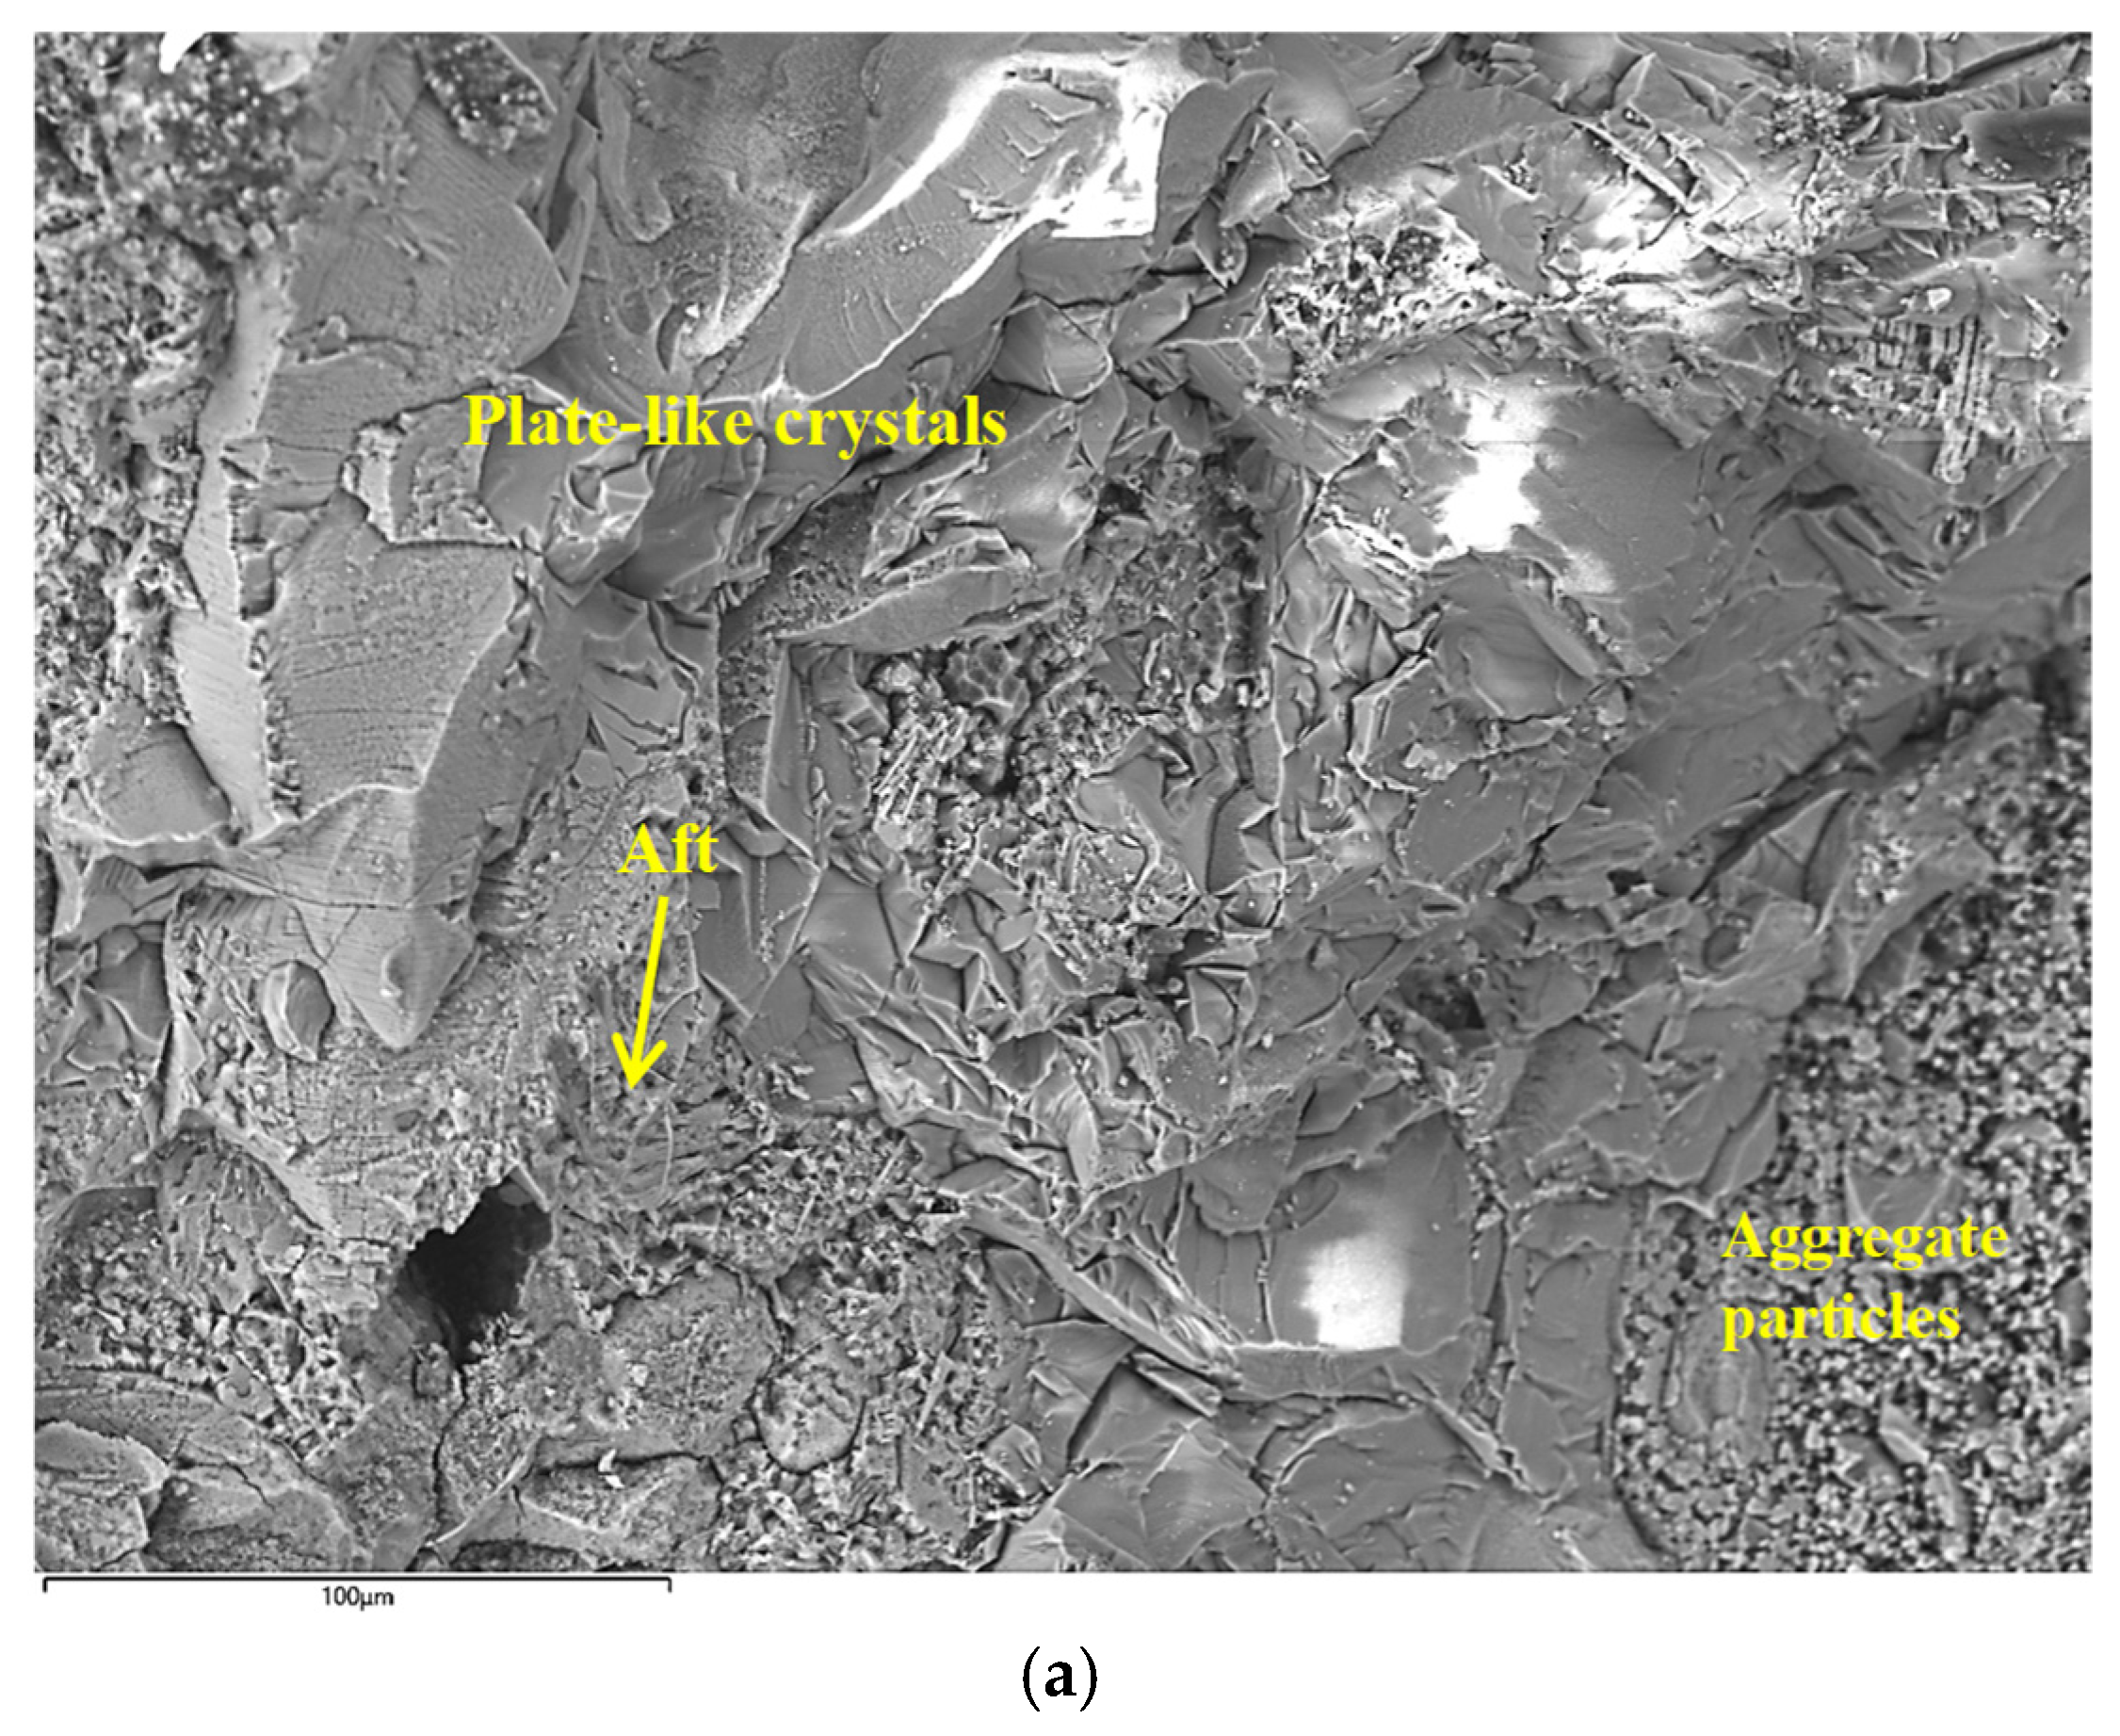
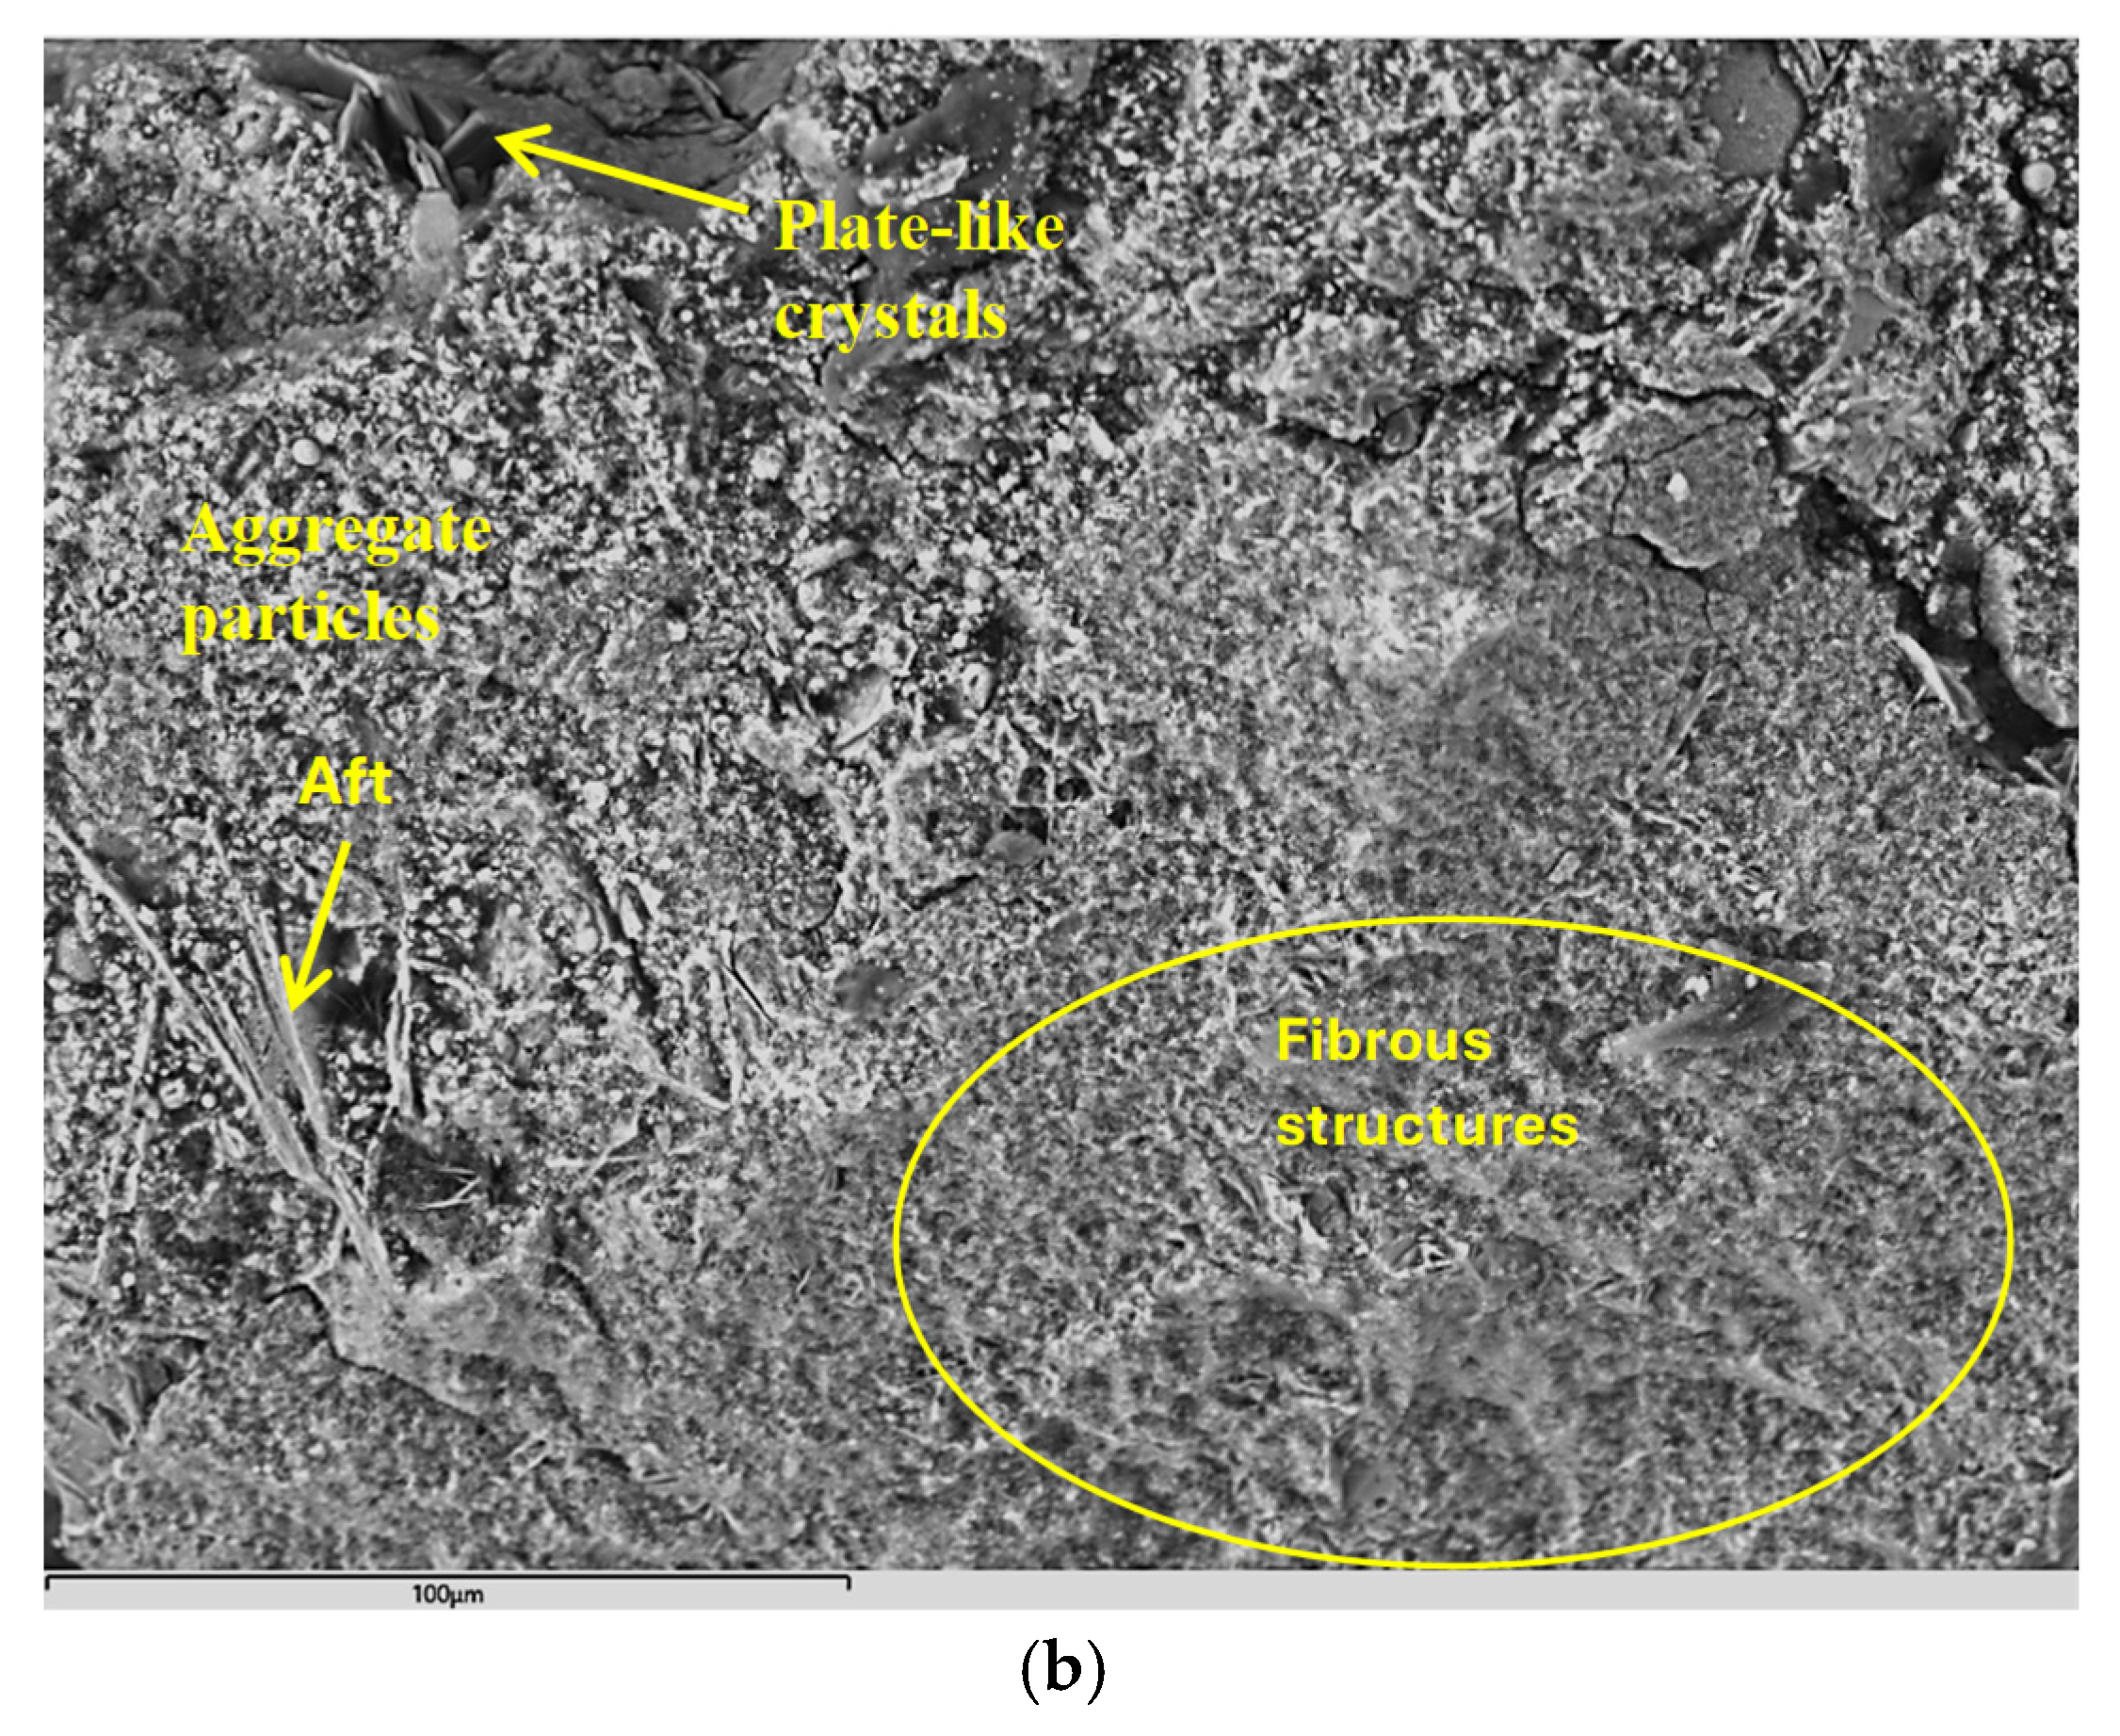
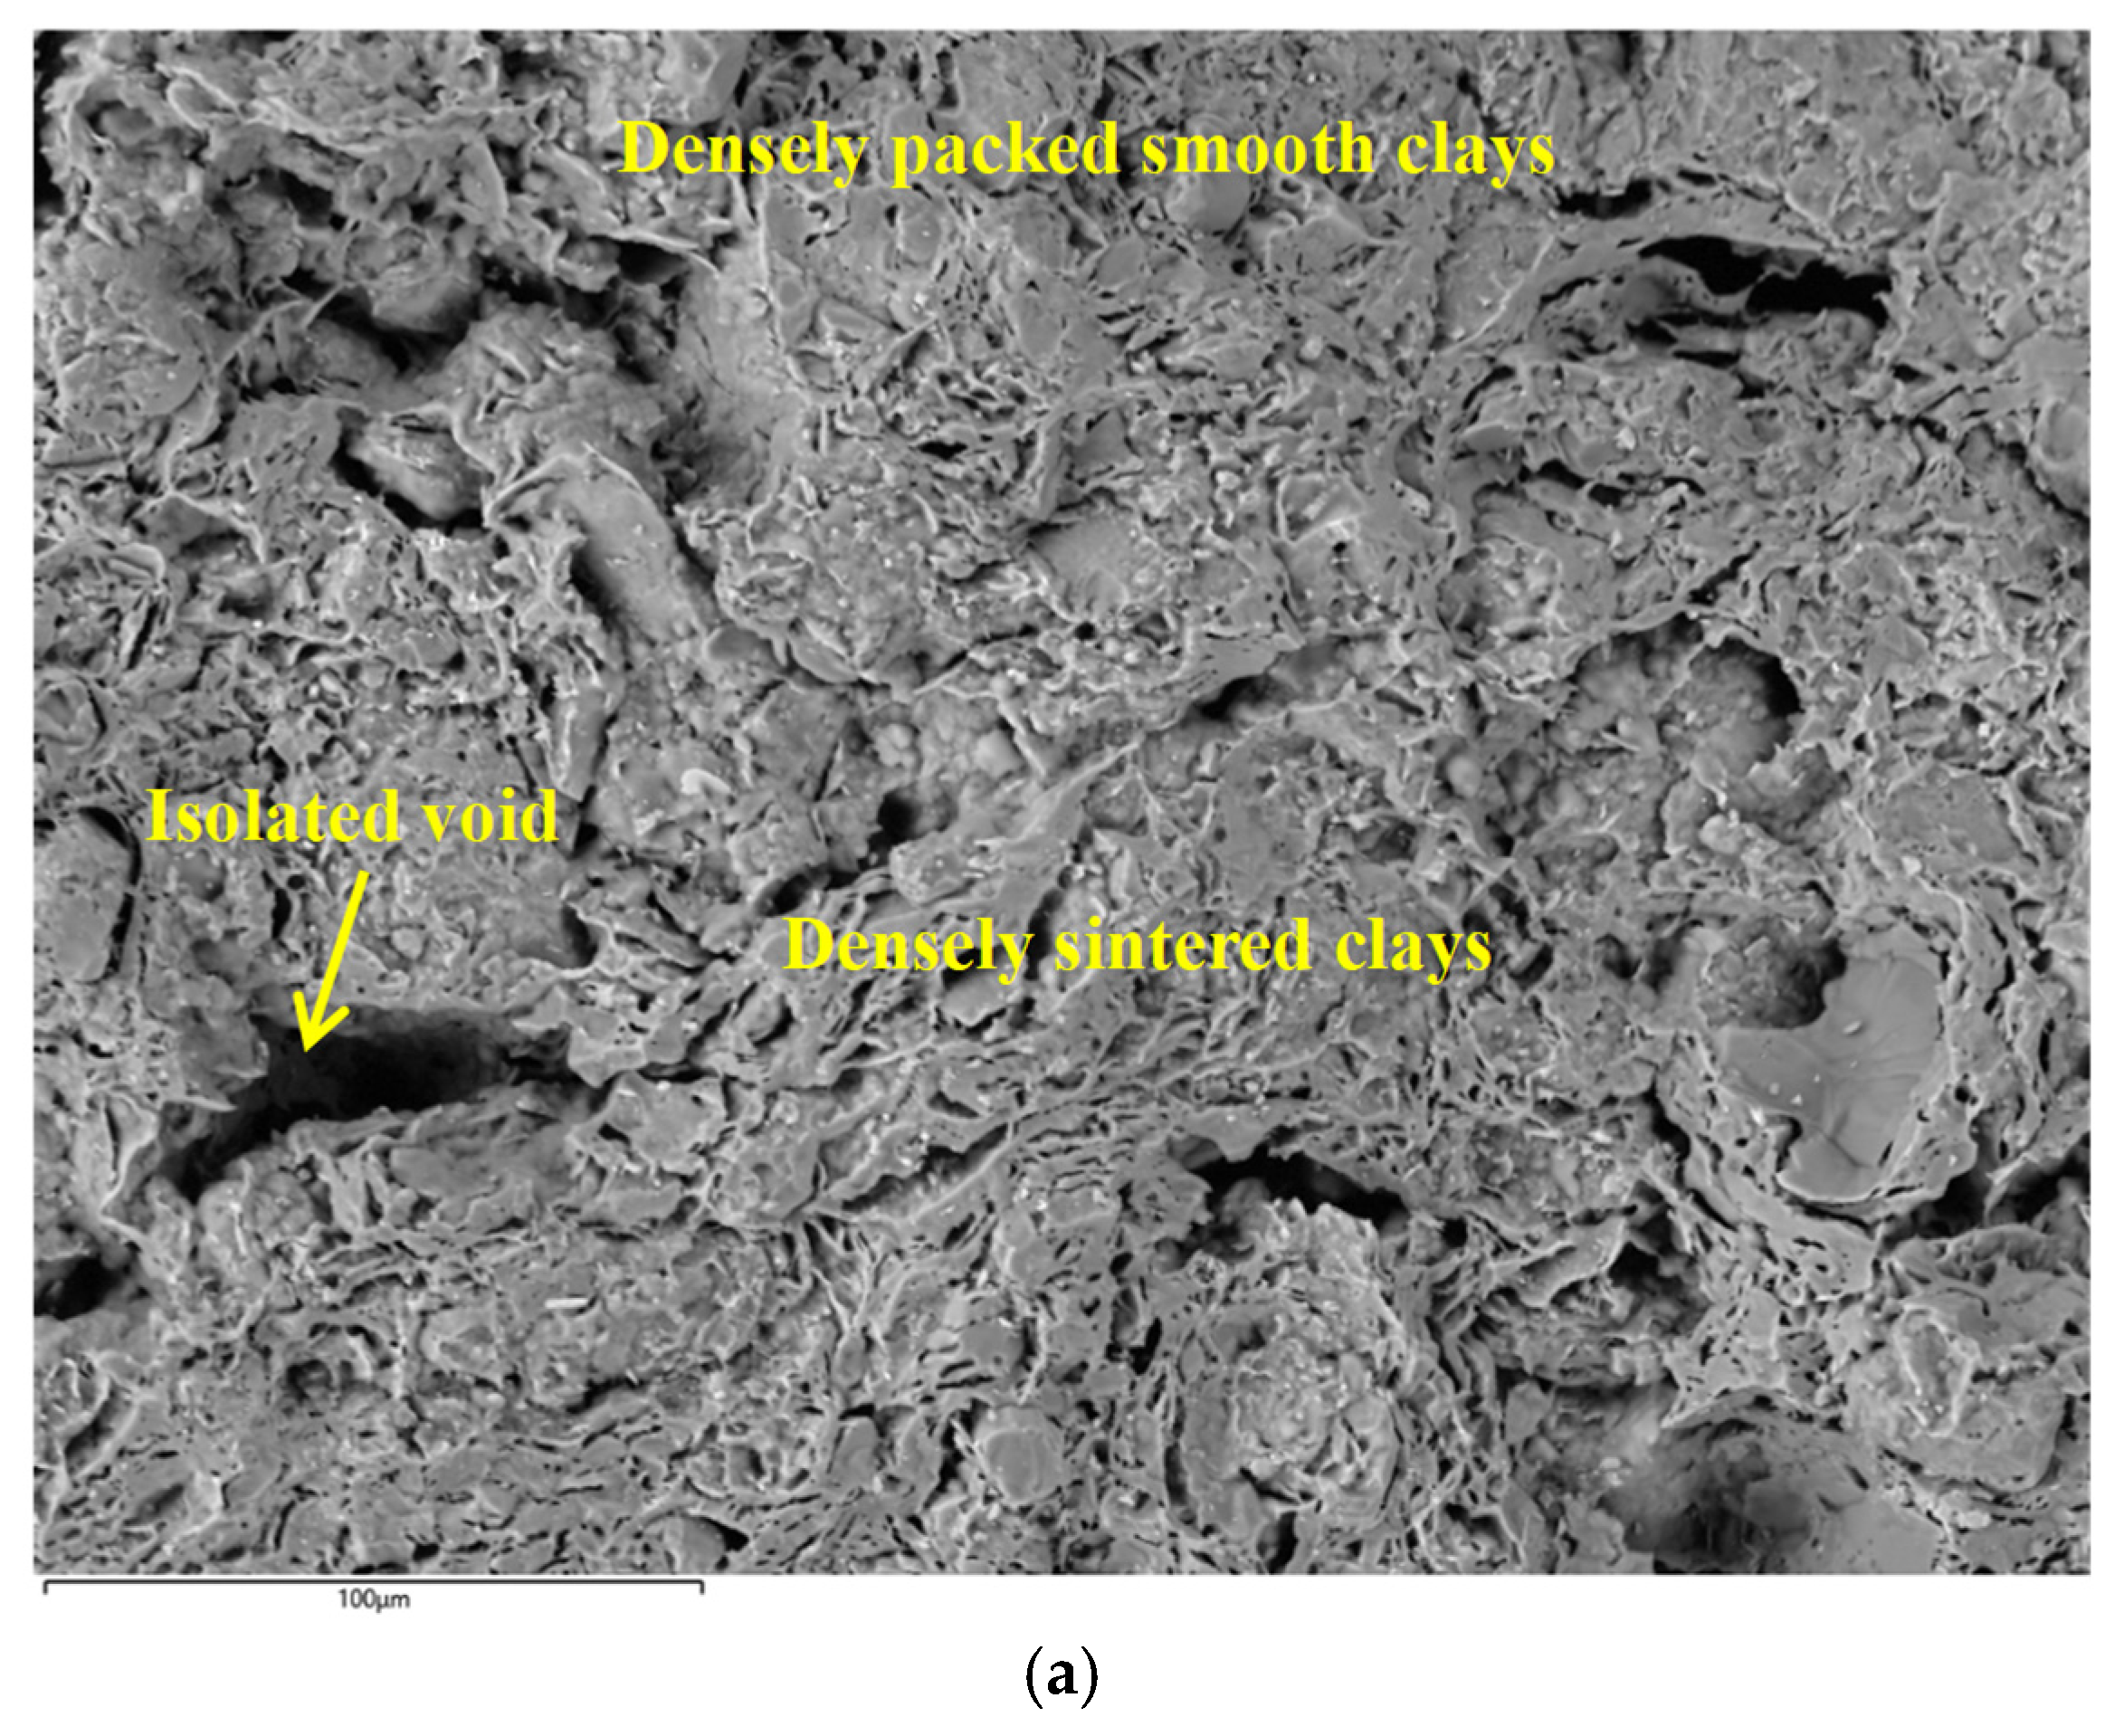
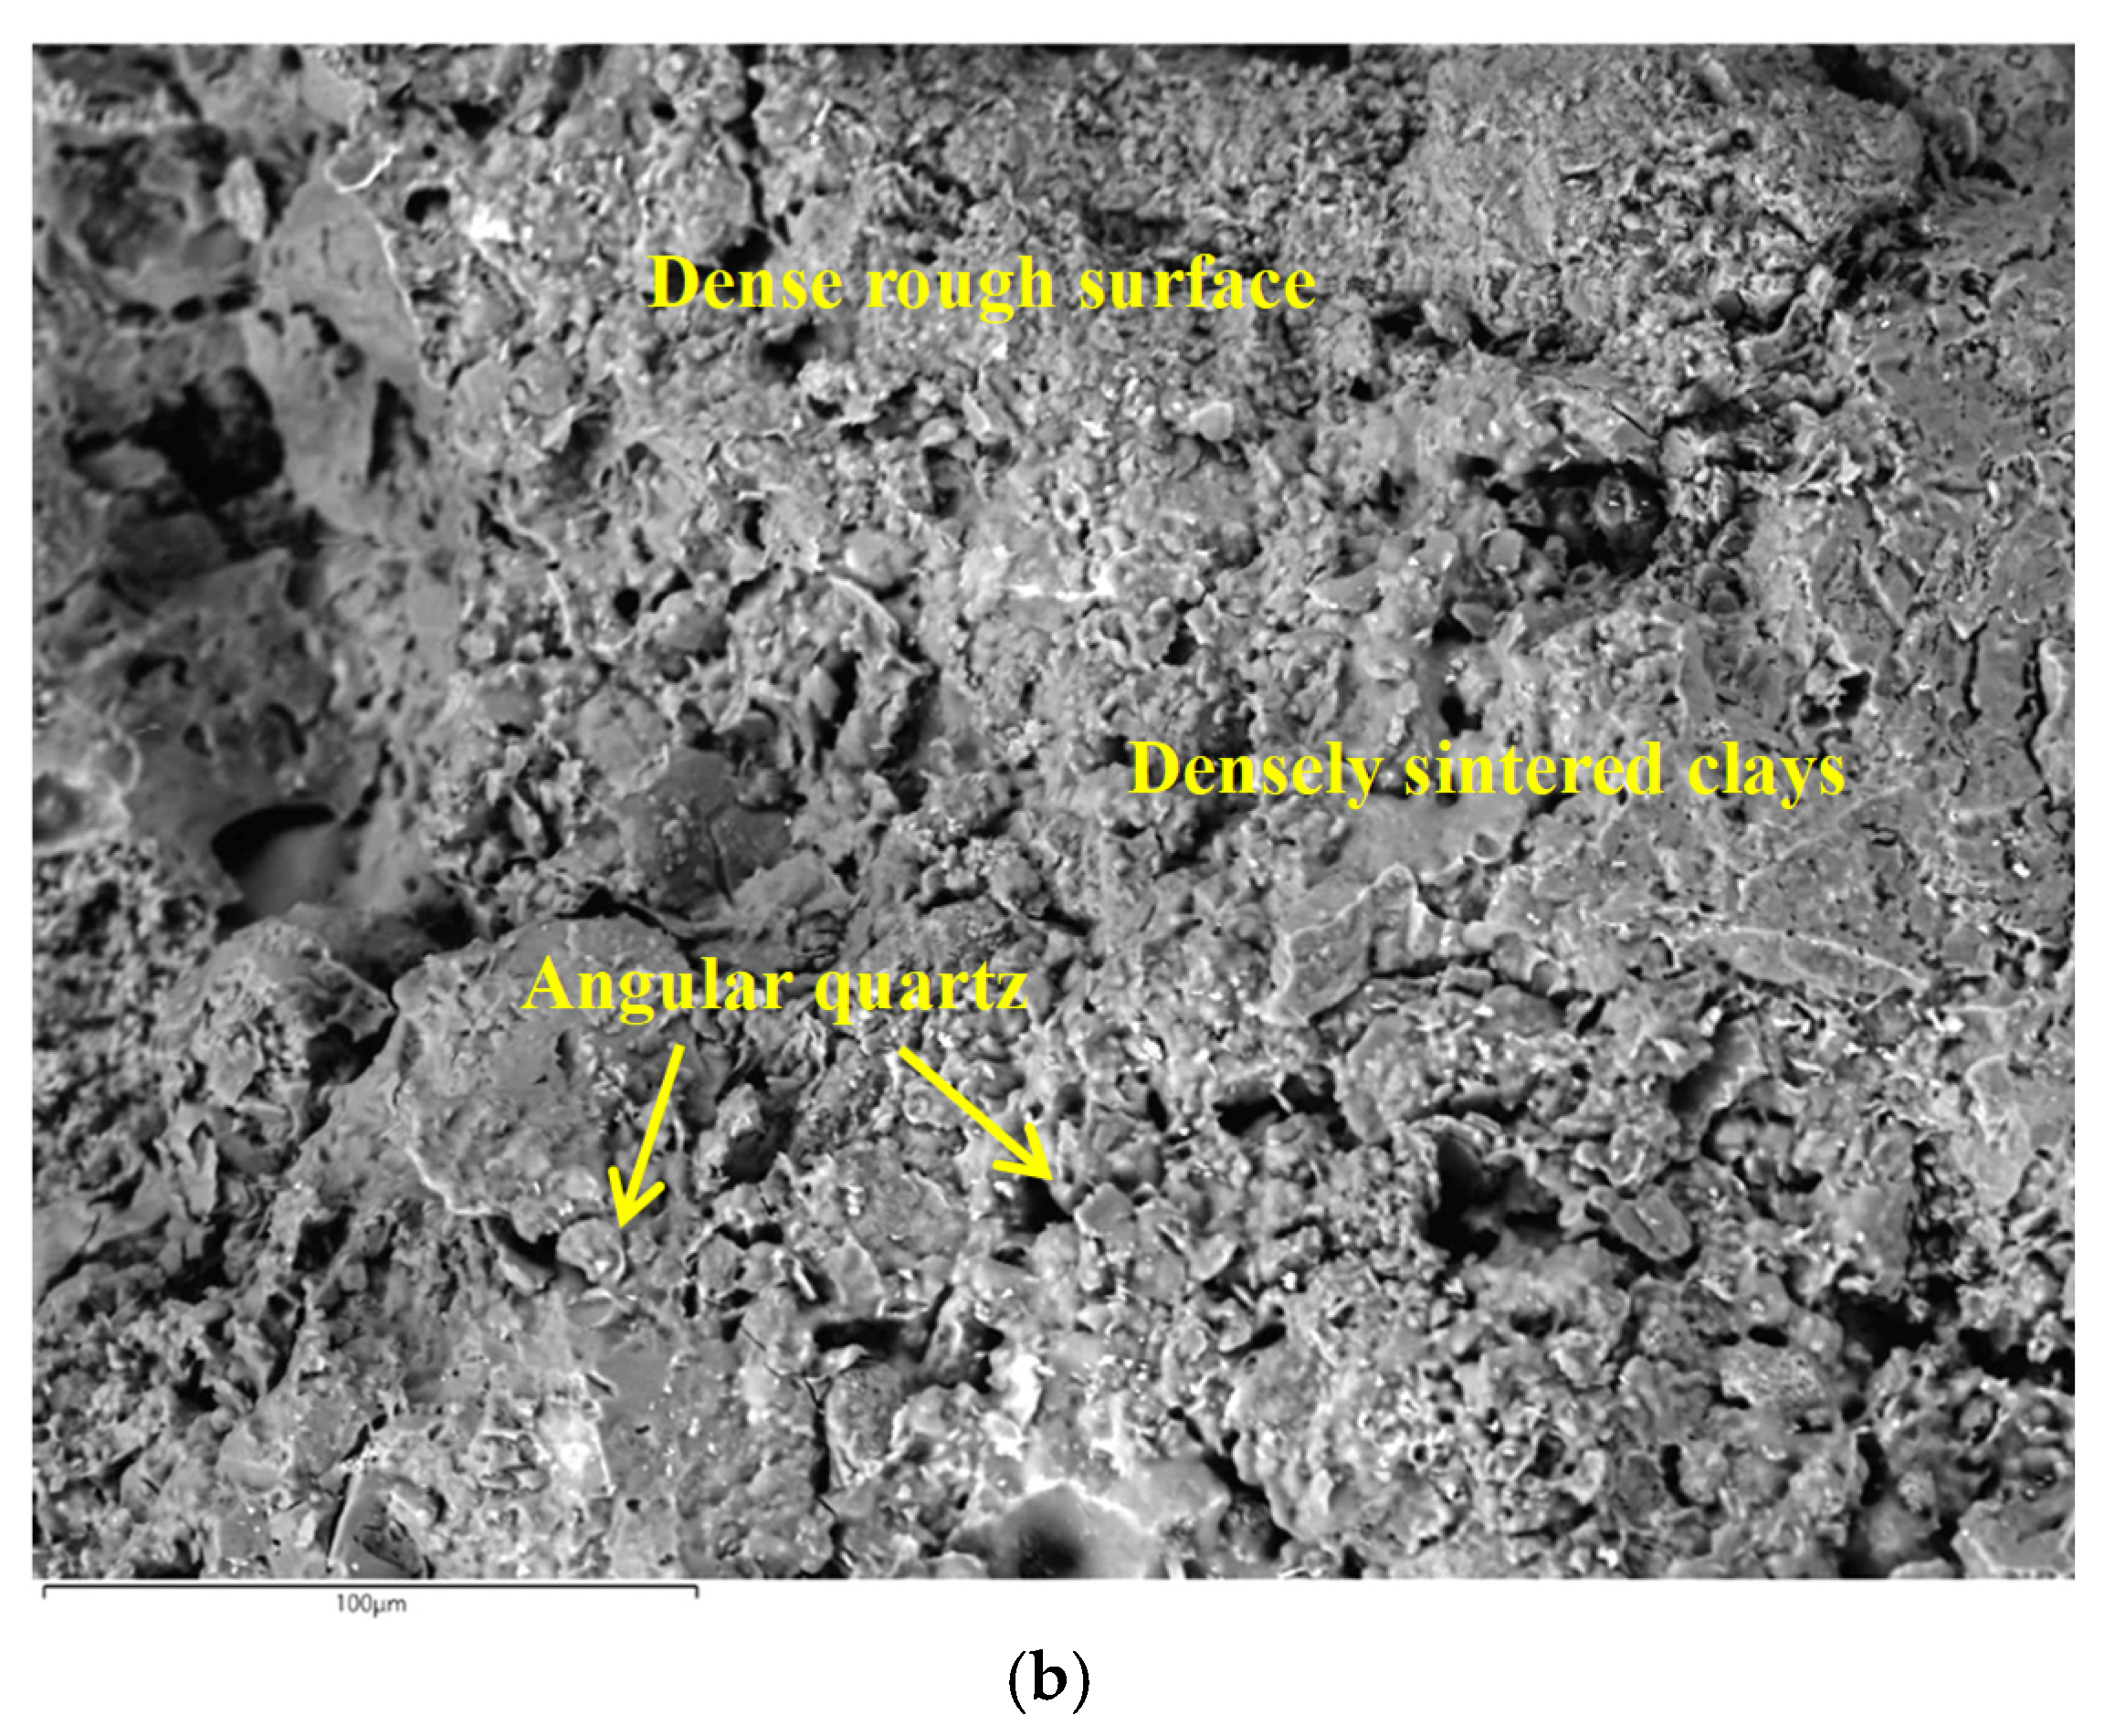
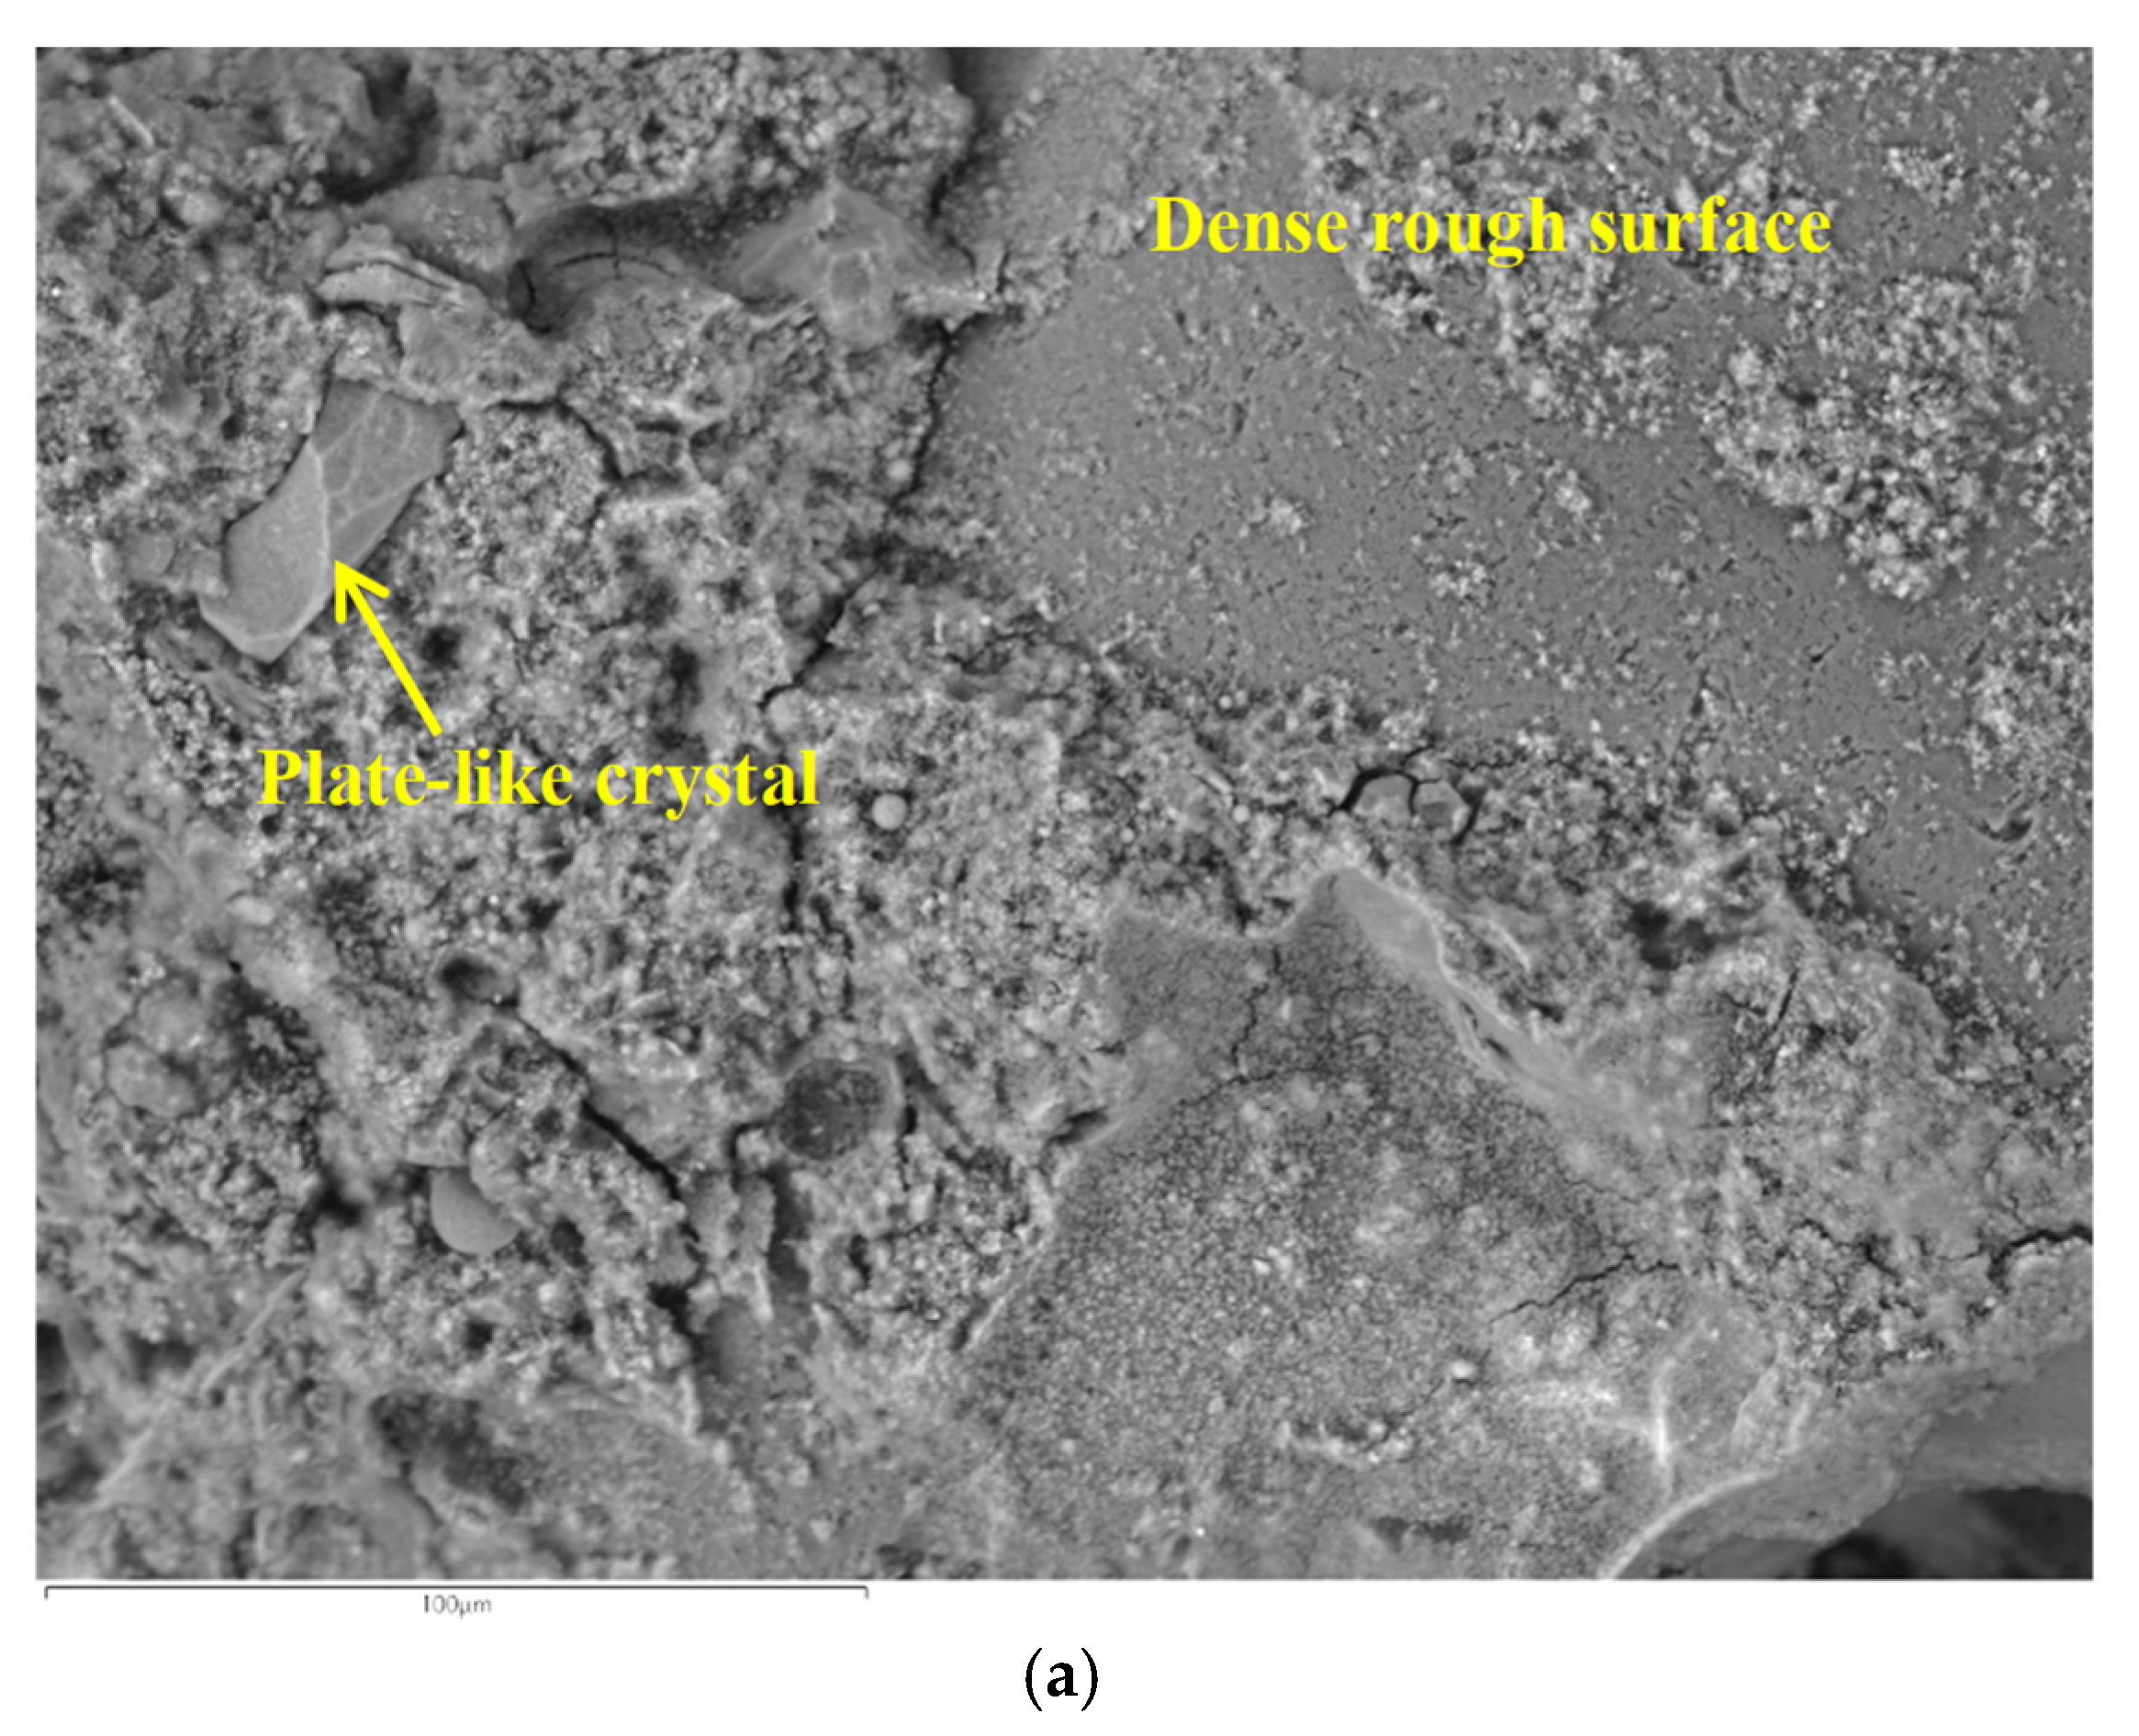
- The SEM images highlighted the novel bricks as having elevated C-S-H compounds, which are the main binding phase for strength gain formed during the hydration of the cementitious agent. Also, CH compounds in the form of plate-like crystals with hexagonal shapes were observed, which are usually formed during the hydration of Dicalcium Silicate (C2S), being responsible for the continuous strength gain exhibited by the LKD–GGBFS blend. These formations have given a proper understanding of the bricks’ macro-properties, which can be used to gain insights into how the microstructure influences the strength and durability behaviours of the novel brick samples.
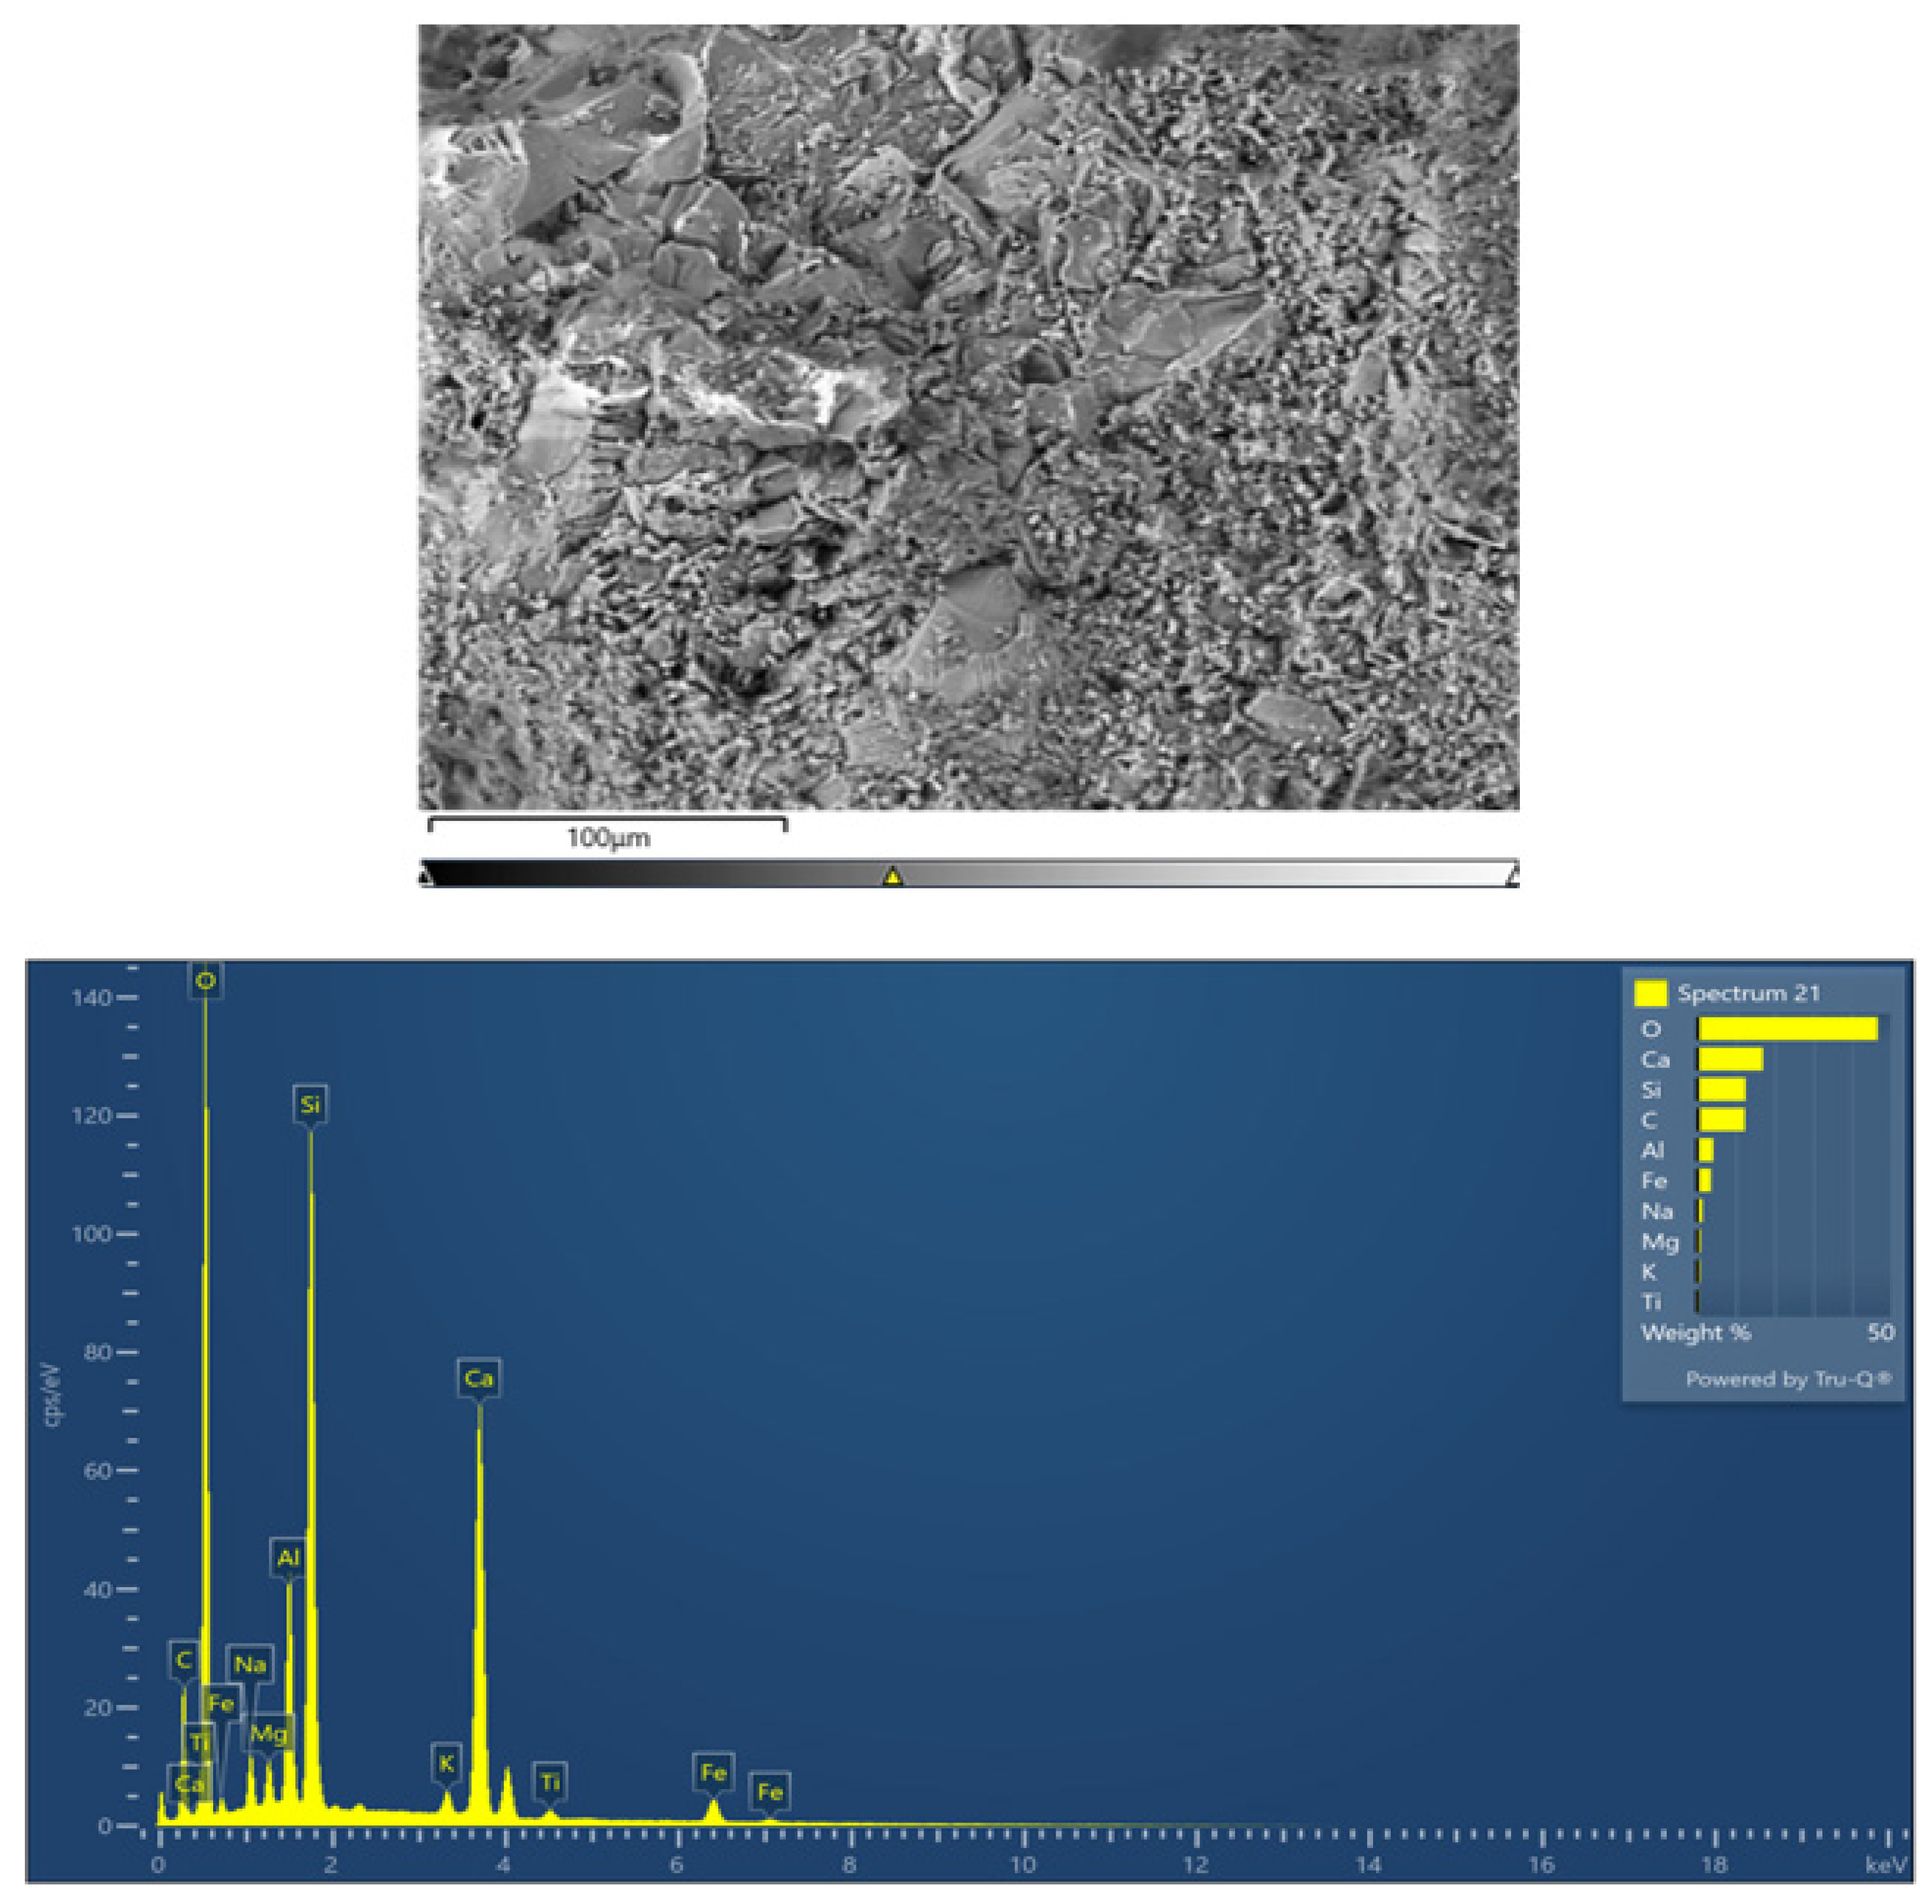
- The EDS provided qualitative and quantitative elemental composition of the novel bricks, indicating elevated Calcium (Ca) and Oxygen (O) elements. The elevated Ca, which implies the presence of C-S-H due to rich calcium content in the LKD–GGBFS blend, and the O in correlation with the Ca to form hydrated products were responsible for strength development in the laboratory bricks, which is directly related to the bonding, strength gain, and durability exhibited by the samples.
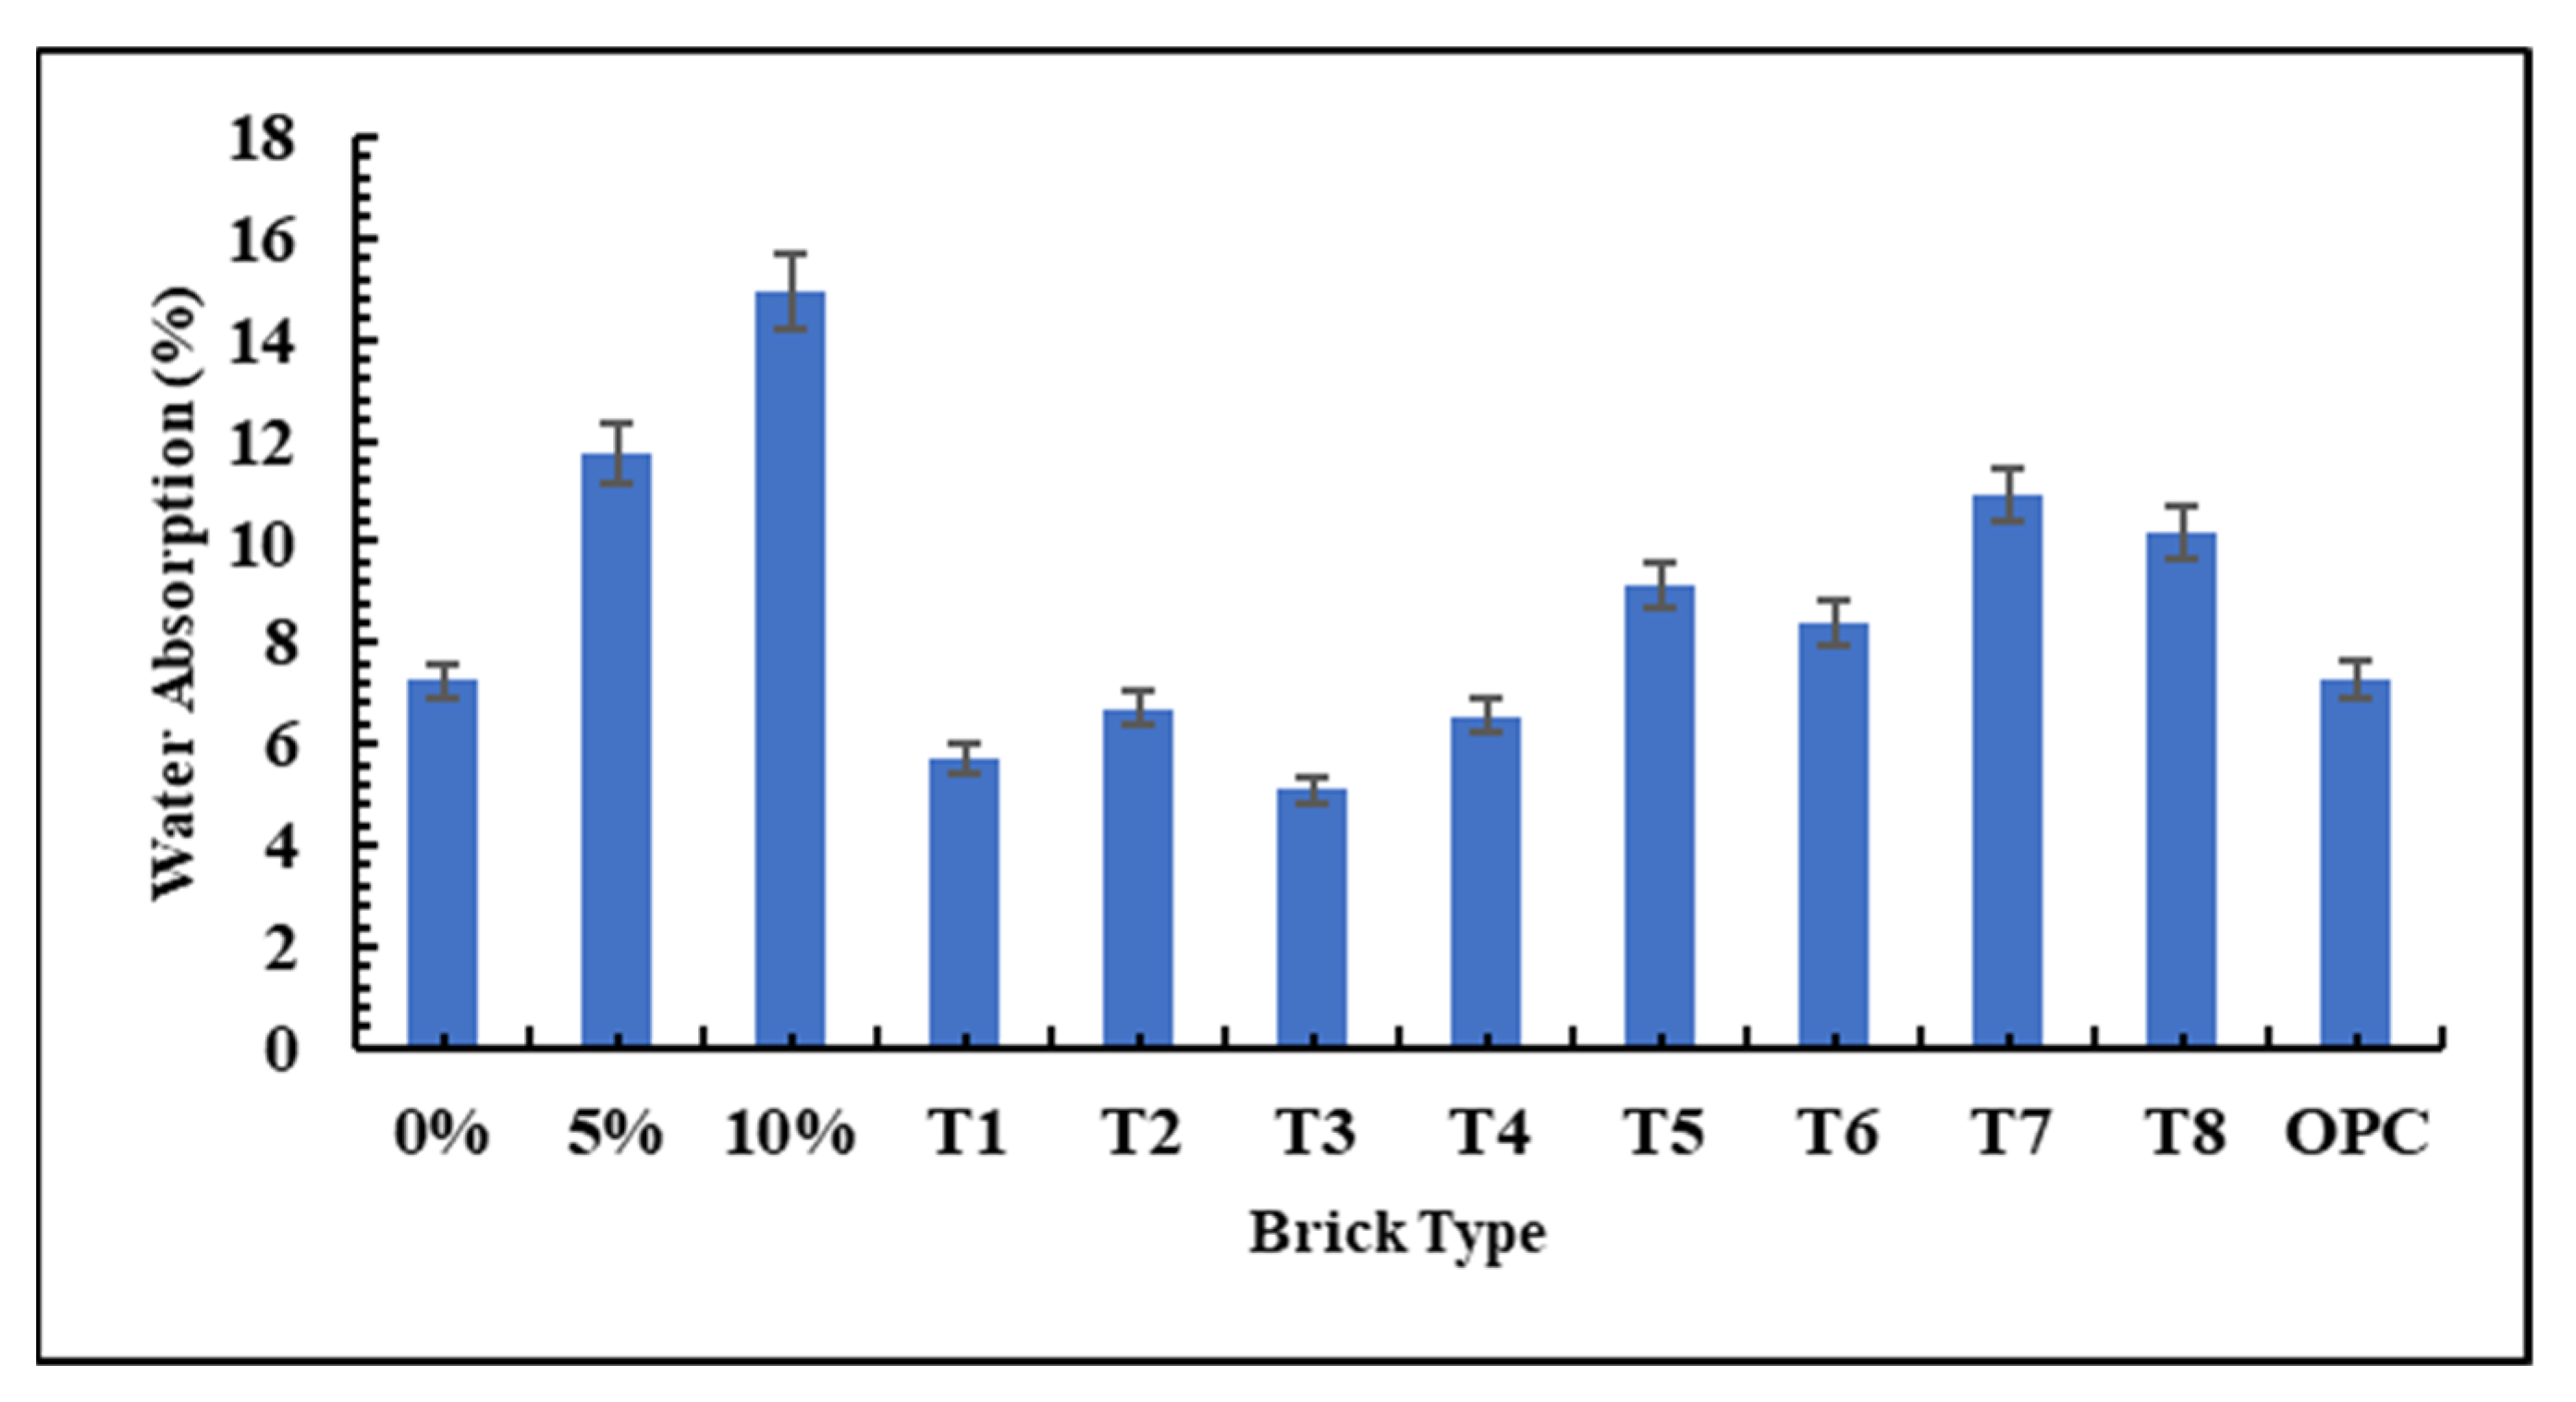
- All the bricks tested in the study had WA, which did not exceed 20% [50]. Though the samples produced with 5 and 10% TRWC had the highest WA values of 11.76 and 14.96%, respectively, they were still within the 12% and 15% maximum water absorption for light-weight and normal-weight load-bearing bricks, respectively [51].
- It is recommended that the bricks produced in this study be subjected to milder conditions as indicated in the codes [47] to assess their physical changes. Additionally, it is recommended that the laboratory bricks be replicated on a larger scale to evaluate their properties and compare the results with the laboratory-scale bricks.
Author Contributions
Funding
Data Availability Statement
Acknowledgments
Conflicts of Interest
References
- Jayasinghe, C.; Mallawaarachchi, R.S. Flexural strength of compressed stabilized earth masonry materials. Mater. Des. 2009, 30, 3859–3868. [Google Scholar] [CrossRef]
- Babé, C.; Kidmo, D.K.; Tom, A.; Mvondo, R.R.N.; Boum, R.B.E.; Djongyang, N. Thermomechanical characterization and durability of adobes reinforced with millet waste fibers (sorghum bicolor). Case Stud. Constr. Mater. 2020, 13, e00422. [Google Scholar] [CrossRef]
- Costi de Castrillo, M.; Ioannou, I.; Philokyprou, M. Reproduction of traditional adobes using varying percentage contents of straw and sawdust. Constr. Build. Mater. 2021, 294, 123516. [Google Scholar] [CrossRef]
- Fernandes, F.M.; Lourenço, P.B.; Castro, F. Ancient Clay Bricks: Manufacture and Properties. In Materials, Technologies and Practice in Historic Heritage Structures; Springer: Berlin, Germany, 2010; Chapter 3; pp. 29–48. [Google Scholar]
- Zhang, L. Production of bricks from waste materials—A review. Constr. Build. Mater. 2013, 47, 643–655. [Google Scholar] [CrossRef]
- Minh Trang, N.T.; Dao Ho, N.A.; Babel, S. Reuse of waste sludge from water treatment plants and fly ash for manufacturing of adobe bricks. Chemosphere 2021, 284, 131367. [Google Scholar] [CrossRef]
- Ige, O.; Danso, H. Physico-mechanical and thermal gravimetric analysis of adobe masonry units reinforced with plantain pseudo-stem fibres for sustainable construction. Constr. Build. Mater. 2021, 273, 121686. [Google Scholar] [CrossRef]
- Pacheco-Torgal, F. Introduction-to-Eco-Efficient-Masonry Bricks and Blocks; Elsevier: Amsterdam, The Netherlands, 2015; pp. 1–10. [Google Scholar] [CrossRef]
- Cabeza-Prieto, A.; Camino-Olea, M.S.; Saez-Perez, M.P.; Llorente-Alvarez, A.; Ramos Gavilan, A.B.; Rodriguez-Esteban, M.A. Comparative Analysis of the Thermal Conductivity of Handmade and Mechanical Bricks Used in the Cultural Heritage. Materials 2022, 15, 4001. [Google Scholar] [CrossRef]
- Morsy, M.I.; Alakeel, K.A.; Ahmed, A.E.; Abbas, A.M.; Omara, A.I.; Abdelsalam, N.R.; Emaish, H.H. Recycling rice straw ash to produce low thermal conductivity and moisture-resistant geopolymer adobe bricks. Saudi J. Biol. Sci. 2022, 29, 3759–3771. [Google Scholar] [CrossRef]
- Rodríguez-Esteban, M.A.; Camino-Olea, M.S.; Llorente-Álvarez, A.; Cabeza-Prieto, A.; Sáez-Pérez, M.P. Brick of the Historical Heritage: Comparative Analysis of The Thermal Conductivity, Density and Moisture. In Proceedings of the World Multidisciplinary Civil Engineering-Architecture-Urban Planning Symposium (WMCAUS) 2021, Prague, Czech Republic, 30 August–5 September 2021. [Google Scholar]
- Ural, N. The Importance of Clay in Geotechnical Engineering. In Current Topics in the Utilization of Clay in Industrial and Medical Applications; IntechOpen: London, UK, 2018; Chapter 5. [Google Scholar]
- Kulkarni, N.G.; Rao, A.B. Carbon footprint of solid clay bricks fired in clamps of India. J. Clean. Prod. 2016, 135, 1396–1406. [Google Scholar] [CrossRef]
- Nasir, M.; Rehman, F.U.; Kishwar, S.; Bashir, S.; Adil, M. Air pollution and child health: The impact of brick kiln pollution on children’s cognitive abilities and physical health in Pakistan. Environ. Dev. Sustain. 2021, 23, 13590–13606. [Google Scholar] [CrossRef]
- Shaikh, K.; Imran, U.; Khan, A.; Khokhar, W.A.; Bakhsh, H. Health risk assessment of emissions from brick kilns in Tando Hyder, Sindh, Pakistan using the AERMOD dispersion model. SN Appl. Sci. 2020, 2, 1290. [Google Scholar] [CrossRef]
- Pellenq, C.; Gunn, S.; Lima, L. The psychological health and well-being of children working in the brick industry: A comparative study. Saf. Sci. 2021, 140, 105251. [Google Scholar] [CrossRef]
- Sizirici, B.; Fseha, Y.; Cho, C.S.; Yildiz, I.; Byon, Y.J. A Review of Carbon Footprint Reduction in Construction Industry, from Design to Operation. Materials 2021, 14, 6094. [Google Scholar] [CrossRef] [PubMed]
- Barbhuiya, S.; Das, B.B.; Adak, D.; Kapoor, K.; Tabish, M. Low carbon concrete: Advancements, challenges and future directions in sustainable construction. Discov. Concr. Cem. 2025, 1, 3. [Google Scholar] [CrossRef]
- Fang, Z.; Yan, J.; Lu, Q.; Chen, L.; Yang, P.; Tang, J.; Jiang, F.; Broyd, T.; Hong, J. A systematic literature review of carbon footprint decision-making approaches for infrastructure and building projects. Appl. Energy 2023, 335, 120768. [Google Scholar] [CrossRef]
- Gartner, E. Industrially interesting approaches to “low-CO2” cements. Cem. Concr. Res. 2004, 34, 1489–1498. [Google Scholar] [CrossRef]
- Mikulčić, H.; Klemeš, J.J.; Vujanović, M.; Urbaniec, K.; Duić, N. Reducing greenhouse gasses emissions by fostering the deployment of alternative raw materials and energy sources in the cleaner cement manufacturing process. J. Clean. Prod. 2016, 136, 119–132. [Google Scholar] [CrossRef]
- IEA. Cement Technology Roadmap 2009-Carbon Emissions Reductions up to 2050; IEA: France, Paris, 2021; pp. 1–2. [Google Scholar]
- Wang, Y.; Zhu, Q.; Geng, Y. Trajectory and driving factors for GHG emissions in the Chinese cement industry. J. Clean. Prod. 2013, 53, 252–260. [Google Scholar] [CrossRef]
- Oke, J.A.; Abuel-Naga, H. Assessment of a Non-Destructive Testing Method Using Ultrasonic Pulse Velocity to Determine the Compressive Strength of Rubberized Bricks Produced with Lime Kiln Dust Waste. Geotechnics 2023, 3, 1294–1308. [Google Scholar] [CrossRef]
- Chen, Y.; Zhang, L.; Xu, L.; Zhou, S.; Luo, B.; Ding, K. In-situ investigation on dynamic response of highway transition section with foamed concrete. Earthq. Eng. Eng. Vib. 2025, 24, 547–563. [Google Scholar] [CrossRef]
- Siddika, A.; Mamun, M.A.A.; Alyousef, R.; Amran, Y.H.M.; Aslani, F.; Alabduljabbar, H. Properties and utilizations of waste tire rubber in concrete: A review. Constr. Build. Mater. 2019, 224, 711–731. [Google Scholar] [CrossRef]
- Gaveesh; Umashankar, Y.; Yogananda, M.V.; Manjunatha, L.R. Utilization of Granulated Blast Furnace Slag in the Manufacturing of Solid Concrete Blocks. J. Emerg. Technol. Innov. Res. (JETIR) 2015, 2. [Google Scholar]
- Sindhurashmi, B.M.; Nayak, G.; Adesh, N.D.; Rao, V.; Dubey, S.P. Incorporating sea sand into self-compacting concrete: A systematic review. Discov. Appl. Sci. 2024, 6, 194. [Google Scholar] [CrossRef]
- Bhatawdekar, R.M.; Singh, T.N.; Tonnizam Mohamad, E.; Armaghani, D.J.; Binti Abang Hasbollah, D.Z. River Sand Mining Vis a Vis Manufactured Sand for Sustainability. In Proceedings of the International Conference on Innovations for Sustainable and Responsible Mining, Hanoi, Vietnam, 15–17 October 2020; Lecture Notes in Civil Engineering. Springer Nature: Cham, Switzerland, 2020. Chapter 8. pp. 143–169. [Google Scholar]
- Oke, J.A.; Abuel-Naga, H. Ultrasonic Non-Destructive Testing of Accelerated Carbonation Cured-Eco-Bricks. Appl. Sci. 2024, 14, 8954. [Google Scholar] [CrossRef]
- Edike, U.E.; Ameh, O.J.; Dada, M.O. Performance of polymer bricks produced with plastic waste. Innov. Infrastruct. Solut. 2022, 8, 51. [Google Scholar] [CrossRef]
- Chin, W.Q.; Lee, Y.H.; Amran, M.; Fediuk, R.; Vatin, N.; Kueh, A.B.H.; Lee, Y.Y. A Sustainable Reuse of Agro-Industrial Wastes into Green Cement Bricks. Materials 2022, 15, 1713. [Google Scholar] [CrossRef]
- Oke, J.A.; Abuel-Naga, H. Durability Assessment of Eco-Friendly Bricks Containing Lime Kiln Dust and Tire Rubber Waste Using Mercury Intrusion Porosimetry. Appl. Sci. 2024, 14, 5131. [Google Scholar] [CrossRef]
- Latif, M.A.; Naganathan, S.; Razak, H.A.; Mustapha, K.N. Performance of Lime Kiln Dust as Cementitious Material. Procedia Eng. 2015, 125, 780–787. [Google Scholar] [CrossRef]
- Bernal, S.A.; de Gutierrez, R.M.; Provis, J.L.; Rose, V. Effect of silicate modulus and metakaolin incorporation on the carbonation of alkali silicate-activated slags. Cem. Concr. Res. 2010, 40, 898–907. [Google Scholar] [CrossRef]
- Maunahan, B.; Adeba, K. Production of Hollow Block Using Waste Plastic and Sand. Am. J. Sci. Eng. Technol. 2021, 6, 127. [Google Scholar] [CrossRef]
- Hesami, S.; Salehi Hikouei, I.; Emadi, S.A.A. Mechanical behavior of self-compacting concrete pavements incorporating recycled tire rubber crumb and reinforced with polypropylene fiber. J. Clean. Prod. 2016, 133, 228–234. [Google Scholar] [CrossRef]
- Shu, X.; Huang, B. Recycling of waste tire rubber in asphalt and portland cement concrete: An overview. Constr. Build. Mater. 2014, 67, 217–224. [Google Scholar] [CrossRef]
- Guo, S.; Dai, Q.; Si, R.; Sun, X.; Lu, C. Evaluation of properties and performance of rubber-modified concrete for recycling of waste scrap tire. J. Clean. Prod. 2017, 148, 681–689. [Google Scholar] [CrossRef]
- AS-1141.11.1; Methods for Sampling and Testing Aggregates. Standards Australia: Sydney, NSW, Australia, 2020.
- ASTM-C33/C33M; Standard Specification for Concrete Aggregates. ASTM International: West Conshohocken, PL, USA, 2013.
- AS 4773.2:2015; Masonry in Small Buildings Construction. Standards Australia: Sydney, NSW, Australia, 2015.
- AS-NZS-4455.1:2008; Masonry Units, Pavers, Flags and Segmental Retaining Wall Units-Masonry Units. Standards Australia: Sydney, NSW, Australia, 2008.
- AS-NZS-4456.4:2003; Masonry Units, Segmental Pavers and Flags-Methods of Test Determining Compressive Strength of Masonry Units. Standards Australia: Sydney, NSW, Australia, 2003.
- Abu Bakar, B.; Wan Ibrahim, M.; Megat Johari, M. A Review: Durability of Fired Clay Brick Masonry Wall due to Salt Attack. Int. J. Integr. Eng. (Issue Civ. Environ. Eng.) 2011, 1, 111–127. [Google Scholar]
- Netinger Grubesa, I.; Vracevic, M.; Ranogajec, J.; Vucetic, S. Influence of Pore-Size Distribution on the Resistance of Clay Brick to Freeze-Thaw Cycles. Materials 2020, 13, 2364. [Google Scholar] [CrossRef]
- ASTM-C67/C67M-20; Standard Test Methods for Sampling and Testing Brick and Structural Clay Tile. ASTM International: West Conshohocken, PA, USA, 2020.
- AS-NZS 4456.14:2003; Masonry Units, Segmental Pavers and Flags—Methods of Test Determining Water Absorption Properties (Reconfirmed 2023). Standards Australia: Sydney, NSW, Australia, 2003.
- Yuksel, I. Blast-furnace slag. In Waste and Supplementary Cementitious Materials in Concrete; Woodhead Publishing: Sawston, UK, 2018; pp. 361–415. [Google Scholar]
- ASTM-C62-17; Standard Specification for Building Brick (Solid Masonry Units Made from Clay or Shale). American Society for Testing and Materials: West Conshohocken, PA, USA, 2017.
- ASTM-C90-22; Standard Specification for Loadbearing Concrete Masonry Units. American Society for Testing and Materials: Philadelphia, PA, USA, 2022.
- Arif, R.; Khitab, A.; Kırgız, M.S.; Khan, R.B.N.; Tayyab, S.; Khan, R.A.; Anwar, W.; Arshad, M.T. Experimental analysis on partial replacement of cement with brick powder in concrete. Case Stud. Constr. Mater. 2021, 15, e00749. [Google Scholar] [CrossRef]
- Amal Mohammed, A.-M.; Al Saadi, H.K.H.; Marwa Fahad, A.-R.; Noof Ali, A.-N.; Noof Salim, A.-W.; Nasra Said, A.-M.; Seku, K.; Bellum, R.R. Influence of nano CaCO3 on pore structure and compressive strength in concrete bricks. J. Build. Eng. 2025, 105, 112520. [Google Scholar] [CrossRef]
- Hernandez, N.; Lizarazo-Marriaga, J.; Rivas, M.A. Petrographic characterization of Portlandite crystal sizes in cement pastes affected by different hydration environments. Constr. Build. Mater. 2018, 182, 541–549. [Google Scholar] [CrossRef]
- Muhit, I.B.; Raihan, M.T.; Nuruzzaman, M. Determination of mortar strength using stone dust as a partially replaced material for cement and sand. Adv. Concr. Constr. 2014, 2, 249–259. [Google Scholar] [CrossRef]
- Cayme, J.-M.C. Analytical Chemistry Methods of Estimating the Original Firing Temperature of Bricks from a 19th Century Convent in the Philippines: Perspective of a Southeast Asian Country. SPAFA J. 2021, 5, 1–16. [Google Scholar] [CrossRef]
- Zhao, Y.; Gao, J.; Xu, Z.; Li, S.; Luo, X.; Chen, G. Combined effect of slag and clay brick powder on the hydration of blended cement. Constr. Build. Mater. 2021, 299, 123996. [Google Scholar] [CrossRef]
- Islam, M.T.; Chittoori, B.C.S.; Burbank, M. Evaluating the Applicability of Biostimulated Calcium Carbonate Precipitation to Stabilize Clayey Soils. J. Mater. Civ. Eng. 2020, 32, 04019369. [Google Scholar] [CrossRef]
- Koçyiğit, F. Thermo-physical and Mechanical Properties of Clay Bricks Produced for Energy Saving. Int. J. Thermophys. 2022, 43, 18. [Google Scholar] [CrossRef]


| Sample | CaO | SiO2 | Al2O3 | Fe2O3 | MgO | K2O | Na2O | SO3 |
|---|---|---|---|---|---|---|---|---|
| LKD | 63.24 | 20.04 | 4.90 | 3.49 | 1.11 | 0.35 | 0.43 | 2.35 |
| GGBFS | 42.10 | 33.10 | 13.20 | 0.30 | 6.50 | - | 0.50 | 2.00 |
| LKD–GGBFS Blend Ratio | 28-Day Compressive Strength (MPa) |
|---|---|
| 30-70 | 12.04 |
| 40-60 | 11.94 |
| 50-50 | 8.71 |
| 60-40 | 10.49 |
| 70-30 | 6.17 |
| 80-20 | 3.69 |
| 90-10 | 1.67 |
| Mix Design | TRWC Content (%) | LKD:GGBFS Blend (g) | Sand (g) | TRWC (g) |
|---|---|---|---|---|
| 1:3 | 0 | 1260:540 | 5400 | 0 |
| 1:2.91:0.09 | 5 | 1260:540 | 5230 | 170 |
| 1:2.81:0.19 | 10 | 1260:540 | 5060 | 340 |
| 1:2.72:0.28 | 15 | 1260:540 | 4890 | 510 |
| 1:2.62:0.38 | 20 | 1260:540 | 4720 | 680 |
| Element | OPC Sample | 0% TRWC | 5% TRWC | 10% TRWC | ||||
|---|---|---|---|---|---|---|---|---|
| Wt % | Wt % Sigma | Wt % | Wt % Sigma | Wt % | Wt % Sigma | Wt % | Wt % Sigma | |
| C | 12.36 | 0.28 | 13.33 | 0.26 | 6.66 | 0.17 | 13.33 | 0.19 |
| O | 46.66 | 0.22 | 47.24 | 0.22 | 40.97 | 0.22 | 50.32 | 0.19 |
| Mg | 0.88 | 0.03 | 0.72 | 0.03 | 0.04 | 0.03 | 0.88 | 0.03 |
| Al | 4.20 | 0.05 | 2.72 | 0.04 | 2.03 | 0.04 | 2.44 | 0.04 |
| Si | 12.54 | 0.08 | 9.73 | 0.07 | 2.60 | 0.04 | 4.11 | 0.04 |
| S | - | - | 1.23 | 0.03 | 1.81 | 0.04 | 1.45 | 0.03 |
| K | 0.77 | 0.03 | 0.24 | 0.03 | - | - | - | - |
| Ca | 17.02 | 0.11 | 23.99 | 0.13 | 44.94 | 0.19 | 26.93 | 0.13 |
| Fe | 3.59 | 0.10 | 0.80 | 0.07 | 0.50 | 0.08 | 0.55 | 0.07 |
| Na | 1.38 | 0.04 | - | - | 0.10 | 0.03 | - | - |
| Ti | 0.06 | 0.04 | - | - | - | - | - | - |
| Total | 100.00 | 100.00 | 100.00 | 100.00 | ||||
| T1 Sample | T6 Sample | |||
|---|---|---|---|---|
| Element | Wt % | Wt % Sigma | Wt % | Wt % Sigma |
| C | 5.56 | 0.37 | - | - |
| O | 46.82 | 0.24 | 61.22 | 0.22 |
| Mg | 0.52 | 0.03 | - | - |
| Al | 13.53 | 0.10 | - | - |
| Si | 26.98 | 0.16 | 34.06 | 0.18 |
| K | 4.20 | 0.06 | 0.53 | 0.06 |
| Ti | 0.79 | 0.06 | 3.29 | 0.10 |
| Fe | 1.60 | 0.10 | 0.06 | 0.13 |
| Ca | - | - | 0.29 | 0.06 |
| Total | 100.00 | 100.00 | ||
Disclaimer/Publisher’s Note: The statements, opinions and data contained in all publications are solely those of the individual author(s) and contributor(s) and not of MDPI and/or the editor(s). MDPI and/or the editor(s) disclaim responsibility for any injury to people or property resulting from any ideas, methods, instructions or products referred to in the content. |
© 2025 by the authors. Licensee MDPI, Basel, Switzerland. This article is an open access article distributed under the terms and conditions of the Creative Commons Attribution (CC BY) license (https://creativecommons.org/licenses/by/4.0/).
Share and Cite
Oke, J.A.; Abuel-Naga, H. Engineering and Durability Properties of Sustainable Bricks Incorporating Lime Kiln Dust, Ground Granulated Blast Furnace Slag, and Tyre Rubber Wastes. Buildings 2025, 15, 2079. https://doi.org/10.3390/buildings15122079
Oke JA, Abuel-Naga H. Engineering and Durability Properties of Sustainable Bricks Incorporating Lime Kiln Dust, Ground Granulated Blast Furnace Slag, and Tyre Rubber Wastes. Buildings. 2025; 15(12):2079. https://doi.org/10.3390/buildings15122079
Chicago/Turabian StyleOke, Joy Ayankop, and Hossam Abuel-Naga. 2025. "Engineering and Durability Properties of Sustainable Bricks Incorporating Lime Kiln Dust, Ground Granulated Blast Furnace Slag, and Tyre Rubber Wastes" Buildings 15, no. 12: 2079. https://doi.org/10.3390/buildings15122079
APA StyleOke, J. A., & Abuel-Naga, H. (2025). Engineering and Durability Properties of Sustainable Bricks Incorporating Lime Kiln Dust, Ground Granulated Blast Furnace Slag, and Tyre Rubber Wastes. Buildings, 15(12), 2079. https://doi.org/10.3390/buildings15122079