Abstract
Under the background of intensified global economic fluctuations, to prevent the systemic risk of real estate (e.g., the U.S. subprime crisis), this study constructs a linkage network of the real estate industry in the U.S. based on the complex network method, reveals the fluctuation diffusion mechanism, identifies the key pivotal industries through the network characteristic indicators, and analyses the characteristics of the fluctuation conduction paths by applying the industrial fundamental association trees. The study found that (1) the U.S. real estate industry is a ‘supply hub’ industry, with first-order and second-order weighted degrees of mean 6.78, 3.98, and significant asymmetry in the supply structure of the industrial network; (2) industries like architectural, engineering, and related services (541300), nonresidential maintenance and repair (230301), and electric power generation, transmission, and distribution (221100) show high degree centrality and betweenness centrality. Their strong propagation and control capabilities form real estate fluctuations’ core transmission mechanisms; (3) foundational association trees reveal long, broad propagation paths where financial investment and energy-supply sectors act as “traffic hubs,” decisively influencing risk diffusion depth and breadth. Targeted policy recommendations address four dimensions: optimizing industrial chain structures, strengthening financial risk isolation, improving housing supply systems, and enhancing policy coordination. This aims to help China avoid U.S.-style real-estate-bubble risks and achieve coordinated real estate macroeconomy development.
1. Introduction
The real estate industrial chain is characterized by its long structure, strong interconnections, and fluctuation propagation. Real estate has a large industrial scale and extensive reach as a central hub industry (in the economic system of a country or region, the industrial sector is crucial, fundamental, and widely driven to achieve overall economic development) within this chain. It plays a pivotal role in the national financial system; it exerts significant systemic influence on the stability and risk prevention of the industrial chain [1]. When the real estate industry is subject to external shocks, the fluctuations generated within the industry will be transmitted to the upstream and downstream sectors through the supply and demand relationship, and the micro-specific shocks will be amplified to the whole macroeconomic market through the industrial association relationship [2]. For example, when the real estate bubble burst in the United States in 2008, the fluctuation of the real estate industry rapidly propagated and diffused through the industrial chain among related industries and then spread to the entire industrial network in the United States, causing a systemic economic crisis [3].
The global economy faces triple pressures of “high inflation, high debt, and low growth”. Compounded by complex variables, including geopolitical conflicts, energy transition, and supply-chain restructuring, this has formed a unique cycle of vulnerability resonance [4]. As the center of world economic trade, the United States occupies a super-node position in the global economy. Real estate, the largest asset class in the U.S. national economy, is pivotal in impacting the whole system when moving a single part within the global economic system [5]. Based on global value chains, the U.S. real estate industry achieves direct or indirect linkages with industries across nations, profoundly influencing the global economic network through financial, trade, and other channels [6].
In recent years, the U.S. real estate market has been impacted by multiple factors, including drastic monetary policy adjustments, intensifying intergenerational conflicts in demographic structure, disruptions from the remote work revolution, and soaring supply-chain costs [7]. Consequently, real estate investment and market transactions have shown significant divergence, with unstable market demand triggering ripple effects across upstream and downstream industrial chains [8]. To address market volatility, the Federal Reserve and the federal government have indicated they will implement long-term structural adjustments to the real estate market through policy measures such as monetary tool recalibrations, tax incentive reforms, and guidance for industrial structural transformation.
Thus, in the context of economic globalization, investigating the mechanisms of real estate fluctuation propagation at the structural level and conducting a comprehensive, systematic analysis of real estate fluctuation diffusion and impacts from an industrial-chain linkage perspective can not only provide new perspectives and foundations for individual countries or regions to avoid economic crises triggered by real estate volatility but also offer policy recommendations for promoting the stable and healthy development and structural transformation of the real estate sector. Furthermore, this contributes to global economic stability and growth.
2. Literature Review
2.1. Current Status of Research on Industrial Fluctuations
Industrial fluctuations, triggered by macro and micro shocks, including national macroeconomic policies, natural disasters, technological innovations, labor dynamics, and international trade, manifest as oscillations in industrial output. These fluctuations propagate through inter-industry linkages along the industrial chain, exerting differential impacts on interconnected sectors and ultimately inducing systemic effects on the broader economic system [9]. Many scholars have studied the relationship between industrial fluctuations and economic fluctuations in response to the above relationship. From a macro-impact perspective, scholars such as Peng et al. [10] and Kong et al. [11] have approached industrial fluctuation research through the lens of industrial interdependencies, examining the correlation between sector-specific fluctuations and broader economic cycles while analyzing the distinctive characteristics of sectoral fluctuations during economic volatility and identifying key industries driving macroeconomic instability. Miao [12] has investigated the relationship between industrial structural shifts and macroeconomic fluctuations from a structural perspective. Some scholars have extended the impact of industrial fluctuations within a single region to the level of the cross-regional transmission of industrial fluctuations with a modular perspective; Xiang et al. [13] employed network k-shell decomposition to reveal the intrinsic mechanisms of interregional industrial fluctuation diffusion. Combining the impact of fluctuations at specific industry nodes with a cross-regional communication perspective, scholars like Attilio et al. [14] and Du et al. [15] explored spatial patterns of price fluctuations and carbon-emission volatility propagation within single or multiple industries.
2.2. Current Status of Research on Fluctuations in the Real Estate Industry
Investigating the propagation mechanisms and characteristics of real estate sector fluctuations across interconnected industries and the national economic system holds significant implications for mitigating their sectoral impacts and stabilizing socioeconomic development, rendering it a persistent academic focus. Early studies focused on the linkage between real estate fluctuations and macroeconomic cycles. Scholars like Huang et al. [16] and Ruan et al. [17] examined causal relationships between real estate investment dynamics and GDP fluctuations. However, given the oversimplification of single-factor frameworks like investment, researchers, including Kong et al. [18] and Xu et al. [19], pioneered more systematic explorations of multidimensional drivers—spanning real estate development investment, production activities, and consumption patterns—to explain macroeconomic volatility. Some scholars have also tried to explore the theoretical mechanism of GDP fluctuations caused by fluctuations in the real estate industry from different perspectives and by applying various methods and models. Qiu et al. [20] analyzed the sector’s GDP contributions through the expenditure-based national accounting framework. At the same time, Lee et al. [21] employed autoregressive models to reveal asymmetric effects of real estate uncertainty shocks on the U.S. economy and housing markets under high- versus low-volatility regimes. With the development of real estate industry fluctuation research, many scholars are no longer satisfied with studying the macroeconomic impact of real estate industry fluctuations and have begun to turn their attention to the study of the effects of real estate industry fluctuations on specific industries. Zeng [22] conducted innovative research on the dynamic fluctuation correlation and diversification strategy between the U.S. real estate investment trusts (REITs) and the green financial index.
2.3. Current Status of Research on Complex Networks and Industrial Fluctuations
The pervasive interdependencies among industries enable the propagation of industrial fluctuations across sectors, leading to non-negligible aggregate output volatility or interregional diffusion. Industrial complex network analysis has been widely applied to study industrial linkages and the diffusion of economic fluctuations, which quantifies structural indicators of socioeconomic systems to characterize internal structural features and reveal complex relationships between hierarchical structures and external economic functions [23]. Acemoglu et al. [24] demonstrated that inter-industrial linkages act as intermediaries through which sectoral fluctuations translate into macroeconomic volatility, a finding that has spurred multi-dimensional investigations into fluctuation transmission. Xiang et al. [25] constructed a Chinese industrial network model based on Acemoglu’s research method. They conducted a similar study on the Chinese economic system, revealing that China’s industrial network structure exerts a weaker influence on aggregate output fluctuations than the U.S. Zhao et al. [26] investigated fluctuation propagation across asymmetric interregional industrial networks, offering critical insights for optimizing spatial resource allocation and industrial cluster planning. Feng et al. [27] further uncovered the evolution of industrial network resilience under risk disturbances from static and dynamic perspectives, proposing novel pathways for network restructuring and system optimization.
In real estate fluctuation research, scholars inspired by Acemoglu’s work have adopted industrial complex network approaches to examine the sector’s macroeconomic impacts. However, focusing solely on GDP effects provides limited guidance for stabilizing overall economic development. A more precise policy framework requires meso–micro analyses of real estate fluctuations’ spillover effects on interconnected industries [28]. Su et al. [29], Man et al. [30], and Chen et al. [31] conducted quantitative analyses of real estate’s intersectoral linkages, positioning its systemic importance within economic networks. Scholars such as Liu [32], Zhang et al. [33] and Gao et al. [34] explored real estate’s spillover effects on upstream and downstream, particularly financial services and construction—highlighting strategies for intersectoral coordination. Han et al. [35] and Hu et al. [36] employed industrial complex network analysis to assess real estate’s structural evolution, growth trends, and risk contagion patterns.
2.4. Concluding Remarks on Existing Research
In summary, academics have broken through the mainstream view that macroeconomic fluctuations are caused by macro-level shocks (e.g., consumer demand, technological change, labor supply, etc.) and have invested in research on meso-industry fluctuations or micro-enterprise fluctuations, with hotspots of research focusing mainly on the impact of industry fluctuations on the macro economy. Some scholars have also set their sights on the impact of industry-specific shocks on the economic system or related industries. However, there is a lack of systematic research in academia on the diffusion mechanism and effects of fluctuations in the real estate industry within the economic system from a meso-industry perspective, applying the method of industrial complex network analysis. Therefore, this paper analyses the diffusion path and propagation effect of the fluctuation of the real estate industry in the region based on the industrial network infrastructure regarding the research of related scholars. Taking the United States as an example for empirical analysis, we use the time-series data of the United States industry to construct the network model of the real estate industry in the United States. Based on the centrality index and fundamental association trees index, we analyze the diffusion mechanism of the real estate industry shocks in the industry network and explore the key paths and nodes of the diffusion of the fluctuations in the real estate industry. Finally, based on the law of fluctuation propagation of the real estate industry derived from empirical analysis, it can provide countermeasures and suggestions for other countries to cope with the fluctuation of the real estate industry, balance the propagation effects of fluctuation suffered by industrial linkage effects, and stabilize macroeconomic development.
3. Research Design
3.1. Research Methodology
3.1.1. Industrial Network Model Construction
Constructing industrial networks based on the material–economic linkages among sectors in input–output tables, integrated with complex network structures, constitutes a mainstream methodology for investigating the extensive interdependencies within national economic systems. This study, therefore, employs an industrial network model to examine fluctuation propagation effects from a meso-industrial perspective. Utilizing the detailed commodity-by-commodity total requirements tables from input–output accounts, we define network nodes according to the sectoral classification in input–output tables, where each intermediate flow represents the value of product required to produce one monetary unit of product . By modeling industries as nodes , techno-economic linkages as edges , and intermediate flows as edge weights , the intricate inter-industrial relationships are abstracted into a visualized industrial network model (where is the set of industry nodes , is the set of inter-industry connecting edges , and is the connecting-edge weight matrix). This framework enables a scientific and objective quantitative analysis of intersectoral linkages through network characteristic metrics.
3.1.2. Weighted-Degree-Based Model of the Supply and Demand Structure of Industrial Networks
In industrial networks, various types of centrality are usually used to measure the importance of each node, in which degree centrality is used to describe the characteristics of the regional correlation of the industrial network, degree distribution is used to portray the basic structure of the industrial network, and weighted degree describes the basic structure of the industrial empowerment network. The weighted degree includes the weighted out-degree and the weighted in-degree, in which the weighted out-degree portrays the structural characteristics of the industrial network from the supply perspective, i.e., it describes the basic supply structure of the industrial network.
According to the hierarchical nature of industrial linkages, degrees can be divided into first-order degrees, second-order degrees, and higher-order degrees. The first-order degree depicts the direct linkage between industries, i.e., any industry’s demand (supply) impact on its direct upstream (downstream) industry. In contrast, the second-order and higher-order degrees depict the indirect linkage between industries, i.e., any industry’s indirect demand (supply) impact on its upstream industry (and the downstream of its downstream industry). As shown in Figure 1, the circles represent different industries, the large circles 2, 3, …, n represent other industries directly associated with industry 1, and the relationship between the large circles represents the first-order degree. The small circles denote the industries that are indirectly associated with industry 1 through the direct upstream (downstream) industries, and the relationship between the large circle one and the small circles reached indirectly through the large circles 2, 3, …, n denotes the second-order degree.
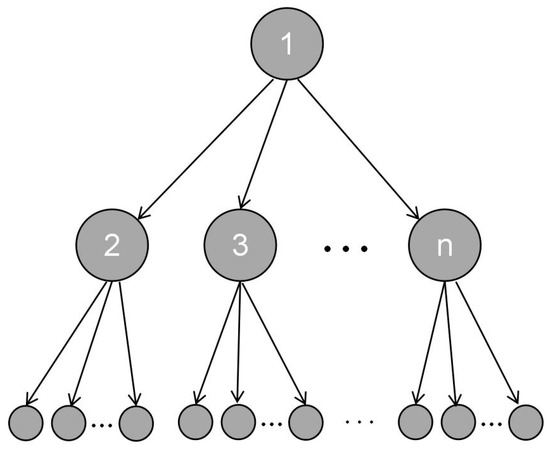
Figure 1.
Schematic diagram of first-order and second-order degrees between industries.
(1) An analysis of the supply structure of the industrial network based on the weighted out-degree
Based on the industrial network model constructed in Section 3.1.1, wij denotes the value on product that needs to be spent on product for each unit of value produced, then the first-order weighted out-degree for any industry is , and reflects the impact of industry on the supply of its direct downstream industry . The larger the value of , the greater the impact of industry ’s intermediate product inputs on industry . When industry ’s product outputs are subject to shocks, such shocks will directly lead to fluctuations in industry ’s output. The distribution of describes the industrial network’s direct supply structure and portrays the economic system’s possible supply hubs. The second-order weighted out-degree of industry , denoted as , reflects the supply-side influence of industry on its second-tier downstream sectors. When the product output of industry experiences shocks, such disturbances will propagate along the industrial chain to its downstream industries’ downstream industries (industry ), consequently causing output fluctuations in industry . The distribution of describes the second-order indirect supply structure of the industrial network, portraying a situation in which several supply hubs in the economic system may have standard suppliers.
The findings of Acemoglu et al. (2012) [24] and Carvalho et al. (2019) [37] suggest that if the industrial network of an economic system has a symmetric supply structure or demand structure, fluctuations in the output of a particular industry or industries are averaged out by the majority of the sectors in that economic system, and hence total output fluctuations are negligible. On the contrary, asymmetries in the industrial network infrastructure provide a potential mechanism for the propagation and diffusion of sectoral shocks or output fluctuations in the economic system, leading to aggregate output fluctuations. If the first-order weighted out-degree follows a normal distribution, indicating that most industries’ first-tier supply connections cluster around the mean, the first-order supply structure of the industrial network is deemed symmetric, thus obviating the need for second-order structural analysis. Conversely, if adheres to a power-law distribution, this reveals the existence of a few dominant direct suppliers (first-tier supply hubs) in the economic system, signifying an asymmetric first-order supply structure. In such cases, extending the analysis to the distribution of , if it also exhibits power-law characteristics, would confirm the asymmetric nature of the second-order indirect supply structure in the industrial network.
(2) An analysis of the demand structure of industrial networks based on weighted entry degree
In contrast to the weighted out-degree, the weighted in-degree portrays the structural characteristics of the industrial network from a demand perspective, describing the underlying demand structure of the industrial network. In the same way as the formulation of weighted out-degree, the first-order weighted in-degree of industry is , reflects the impact of industry ’s demand on its direct upstream industry . The larger the value of , the greater the indication that industry ’s demand for the intermediate product inputs of industry is more affected by the demand situation of industry . When industry is subject to a shock, this shock triggers a variation in its demand for industry ’s intermediate products, which leads to fluctuations in industry ’s output. The distribution of describes the direct demand structure of the overall industrial network, portraying the large customer industries that may exist in the economic system. The second-order weighted in-degree of industry , denoted as , quantifies the indirect demand influence of industry on its second-tier upstream sectors. When industry is subjected to external shocks, such disturbances induce demand adjustments in its immediate upstream industries, which subsequently propagate to their upstream suppliers, ultimately causing output fluctuations in these second-tier upstream industries. The distribution of delineates the second-order indirect demand structure of the industrial network, highlighting the phenomenon where industries with significant demand in the economic system tend to share common client industries. Extending this logic, higher-order weighted out-degrees (in-degrees) characterize an industry’s supply (demand) influence across all downstream (upstream) tiers. However, since first-order weighted out-degrees (in-degrees) capture over 90% of supply (demand) interactions between industries, this study excludes analysis of second-order and higher-order out-degree (in-degree) metrics.
According to the existing studies, the characteristics of the supply and demand structure of the industrial network can be concluded as the following two points: (1) If and conform to the normal distribution, this indicates that most industries’ first-order weighted out-degree or first-order weighted in-degree are concentrated near the mean value. The first-order supply structure and the first-order demand structure of the industrial linkage network are symmetrical. Therefore, second-order supply structure and second-order demand structure analyses are unnecessary. (2) If , obeys the power-law distribution, which indicates that there are a few larger direct supply class or direct demand class industries, i.e., the first-order supply hub or the first-order large-scale customer industry in the economic system; then, the first-order supply structure or the first-order demand structure of the industrial network is asymmetric, and it can further be sought for the distribution of , distribution. If it also obeys the power-law distribution, then the industrial network’s second-order indirect demand structure or second-order indirect supply structure is also asymmetric.
3.1.3. Real Estate Industry Network Modeling
This study focuses on the impact of empowered industrial networks on the diffusion of fluctuations in the real estate industry, so this paper takes the input–output table as the basis for the specialized segmentation of the industrial network and constructs a network model of the real estate industry, which is used to capture nonlinear, multi-dimensional correlations between segmented industries. The basic principle of establishing the real estate industry network model is as follows: Firstly, based on the basic supply and demand structure of the industry network, we analyze the characteristics of the real estate industry in the supply and demand structure of the industry network, and take the direct consumption coefficient of the industry as an index to quantify the inter-industry correlation relationship if its supply structure is an asymmetric structure, and take the direct distribution coefficient of the industry as an index to quantify the inter-industry correlation relationship if its demand structure is an asymmetric structure; secondly, screen the strong associated industries of the real estate industry (including first-order linked industries, second-order linked industries and the strong linked industries of the first-order linked industries), and determine the set of nodes of the industrial network; once again, construct the matrix of industrial linkage coefficients based on the quantitative indexes, and construct the network model of the real estate industry by taking the industries as the nodes, and the inter-industry linkage relationship as the edge. The specific construction steps are as follows:
Step 1: Analyze the characteristics of the real estate industry in the supply and demand structure of the industrial network.
First, the direct consumption coefficients between real estate and other industries are calculated. The estimated direct consumption coefficients are ranked in order of magnitude. The first-order linked industries with a high correlation with the real estate industry are filtered according to the empirical values (e.g., industries when the cumulative proportion reaches 95%). Second, the full consumption coefficient includes both direct and full indirect consumption, and second-order related industries can be identified by comparing the difference between the full consumption coefficient and the direct consumption coefficient. Specifically, for a given first-order linked industry, if its full consumption coefficient is much larger than the direct consumption coefficient and this additional consumption is mainly provided by other (i.e., other than that first-order linked industry) industries, these industries can be considered as second-order linked industries of the real estate industry [38]. According to the size ranking of the difference between the coefficient of complete consumption and the coefficient of direct consumption, the second-order linked industries with a high degree of association with the real estate industry are screened out. Finally, the characteristics of the real estate industry in the supply and demand structure of the industrial network are analyzed.
Step 2: Selection of inter-industry linkage coefficients.
For different research purposes, it is usually necessary to consider other information, such as production and consumption or distribution and use, and to select quantitative relationships, such as intermediate flows, consumption coefficients, distribution coefficients, demand coefficients, supply coefficients, and so on, to determine the correlation between the industries of the economic system. Measurement indicators of industrial linkage effects include direct consumption coefficient and full consumption coefficient, and direct distribution coefficient and full distribution coefficient, which are used to reveal the technical and economic links and interdependence between various sectors of the national economy; compared with the indicators of full consumption coefficient and distribution coefficient, the direct consumption coefficient or the direct distribution coefficient can reflect more clearly the direct material or technological linkage between the sectors, and it is based on the idea of product input share [39]. Therefore, this paper selects the direct consumption or distribution coefficients as the quantitative index to quantify the inter-industry linkage and construct the industry linkage coefficient matrix.
(1) When the supply structure of an industry is asymmetric, the direct consumption coefficient of the industry is used as an indicator to quantify the inter-industry linkage. The direct consumption coefficient indicates that the unit of total output of product sector j directly consumes the quantity of products of product sector , expressed by the symbol . The larger the value of , the greater the demand-pulling effect of product sector on product sector , and the closer the link between the two sectors. The formula can be expressed as:
where represents the direct consumption of product sector on product sector ; represents the total output of product sector ; (all the same as in the subsequent text and will not be repeated). The matrix () consisting of the coefficients is called the direct consumption coefficient matrix.
(2) When the demand structure of an industry is asymmetric, the industry’s direct coefficient of distribution is used as an indicator to quantify inter-industry linkages. The direct allocation coefficient refers to the proportion of a sector’s products (sector ) allocated to each sector (sector ) for production and social end-use in relation to the sector’s total products. It reflects the direct supply from sector to sector and the proportion of sector ’s unit allocated to sector , reflecting the direct intersectoral push effect. The formula can express it:
where denotes the total output of the product sector . The matrix () consisting of the coefficients is called the direct consumption coefficient matrix.
Step 3: Determine the set of nodes of the industrial system.
To construct an industrial complex network, it is first necessary to determine the industrial nodes according to the classification of industrial sectors in the input–output table. According to the different research objectives, the industrial sectors in the input–output table can usually be split or merged, or some industries can be screened based on the original input–output table.
Step 4: Construct a real estate industry network model.
After determining the set of industry nodes and linkage coefficients, the real estate industry linkage coefficient matrix is constructed, and the economic system is abstracted into the real estate industry network model with industries as nodes and inter-industry linkages as edges, where is the set of sectors, is the set of inter-industry linkage edges, is the linkage weight matrix, and is the linkage strength between industry and industry , which is expressed as the direct consumption/allocation coefficient.
3.1.4. Analytical Model Based on Network Structural Characteristics
The diffusion effect of fluctuations in the real estate industry in the structure of the industrial network can be measured by the specific structural indicators of the single-region-empowered industrial network. The main ones include the degree of nodes, degree centrality, and betweenness centrality.
(1) Degree is a critical metric commonly used to characterize graphs and is usually used to indicate the significance of the position a node occupies in the graph and the resource status of the occupied position. In a directed graph, the degree of vertex is equal to the sum of the in-degrees and out-degrees of the vertex , and the sum of the in-degrees of all vertices is equal to the sum of the out-degrees of all vertices. In an industrial network, the out-degree of node is the number of edges pointing directly from node to other nodes, and the in-degree node is the number of edges pointing to node from other nodes. Let the industrial network have nodes and its adjacency matrix is . The degree of node can be expressed as:
(2) Degree centrality is the most direct metric to portray node centrality in network analysis. The larger the node degree of a node, the higher the degree of centrality of the node, and the more important the node is in the network. Using to denote the number of edges of node with other nodes, the degree of centrality of node can be expressed as:
(3) Betweenness centrality is a measure of node importance based on the number of shortest paths passing through a node, reflecting the ability of node to control the paths in the network. Assuming that the number of shortest paths for material and information transfer between any two nodes and is , where the number of shortest paths passing through the third node is , the median centrality of a node can be expressed as:
3.1.5. Analytical Model for Propagation Paths of Fluctuations Based on Fundamental Association Trees
Industrial fundamental association trees, or association trees for short, are significant indicators that portray the position and role of specific industries in an industrial (sub)system. Industrial fundamental association trees are the smallest kind of structure in the industrial network, which takes the most significant association between each industry and other industries in the network as an edge, and it is the largest spanning tree composed of all the nodes and the least number of edges in the network, which reflects the most significant association relationship between industries [40]. Applying industrial fundamental association trees to the study of fluctuation diffusion in the real estate industry can extract the main paths of fluctuation transmission from the linkage network of the real estate industry and distinguish the core and edge transmission relationships. The channels (half-channels) of association trees form the chain with the strongest association relationship in the industrial network, which is the crucial industry chain of the industrial system, while the diameter is the longest chain in the association tree, which is the foundation for analyzing the key industry sub-network of the industrial system.
With reference to the algorithm for fundamental association trees proposed by Zhao et al. [40], let (where ) denote a spanning subgraph of the industrial network . For any arc , there exists a weight . If the subgraph is acyclic and the total edge weight is maximized, then is defined as the fundamental association tree of the network. The specific algorithm (Algorithm 1) is as follows:
| Algorithm 1: Algorithm for fundamental association trees |
| Step 1: Initialize an empty set with a total weight of 0 |
| Step 2: Select the edge with the maximum weight and add it to , ensuring the maximum weight criterion is satisfied |
| Step 3: If already contains edges , select the next edge such that the induced subgraph remains acyclic and is as large as possible |
| Step 4: If , return to Step 3; otherwise, terminate the process when |
This study innovatively integrates complex network analysis with foundational association trees to construct a phased systematic analytical framework of “network construction-backbone extraction-path verification”. It employs not only complex networks to capture the nonlinear, multidimensional correlation networks of real estate fluctuations within the U.S. economic system, comprehensively identifying key hub nodes for risk transmission, but also utilizes foundational association tree technology to distill the most core and robust backbone paths of fluctuation propagation from this complex network. This clearly delineates the concrete chains of risk transmission among critical nodes. This integrated approach helps overcome potential path ambiguity inherent in standalone complex network analysis while avoiding the limitations of traditional econometric models (e.g., VAR) in characterizing high-dimensional, nonlinear transmission. Consequently, it achieves dual precision positioning for both key node identification and critical path tracing. This provides a more refined and actionable network topology perspective for understanding the transmission mechanisms of U.S. real estate fluctuations within industrial networks.
3.2. Research Data
The data employed in this study were obtained from the detailed benchmark commodity-by-commodity total demand input–output (IO) tables provided by the U.S. Bureau of Economic Analysis (BEA). These detailed benchmark data are published every five years, with the most recent data released in 2017. Consequently, this study selects the latest three detailed benchmark IO datasets, corresponding to 2007, 2012, and 2017. Due to the extreme complexity of compiling these detailed benchmark input–output tables and their extended publication intervals, the data may exhibit certain lags. However, owing to the robust characteristics of industrial association networks—where technological–economic linkages and supply–demand relationships between industries demonstrate long-term stability—the real estate sector maintains relatively stable connections with most associated industries over a period [27], such as the enduring technological–economic linkages and supply relationships between real estate and sectors including construction, building material manufacturing, and furniture/appliance manufacturing. Therefore, pre-2017 input–output data can somewhat reflect current U.S. real estate fluctuation diffusion dynamics. When a new detailed benchmark commodity-by-commodity total demand input–output table is published, we will introduce the latest data as a future object of study for this research.
In addition, the detailed level input–output table divides the U.S. industry into 402 sectoral classifications. Since this study focuses on the impact of real estate’s inter-industry linkages on the propagation of its fluctuations within the network, we treat real estate as an integrated entity for analytical clarity. Specifically, by cross-referencing product classifications in the detailed benchmark tables with the North American Industry Classification System (NAICS) standards, industries falling under NAICS real estate categories—including owner-occupied housing, tenant-occupied housing, and other real estate—were consolidated, resulting in a final industrial system comprising 400 nodes.
4. Empirical Analysis
4.1. The Construction of U.S. Industrial Networks
This study treats industries as nodes and uses intermediate flows from the 2007, 2012, and 2017 detailed benchmark commodity-by-commodity total demand input–output tables as the metric for industrial linkages to establish an association matrix. Given many industry nodes, directly constructing an industrial network with edges representing inter-industry connections would result in excessively dense edges, hindering network observation and analysis. Therefore, we establish the mean value of inter-industry input shares as a threshold: intermediate flows above this mean are assigned a value of 1. In contrast, those below are assigned 0, constructing a binary (0–1) industrial association matrix. When building the U.S. intra-regional industrial network , an element value of 1 in the matrix indicates an input–output linkage between the corresponding row and column industries, forming an edge; otherwise, no edge is formed. Figure 2 illustrates the 2017 U.S. industrial network.
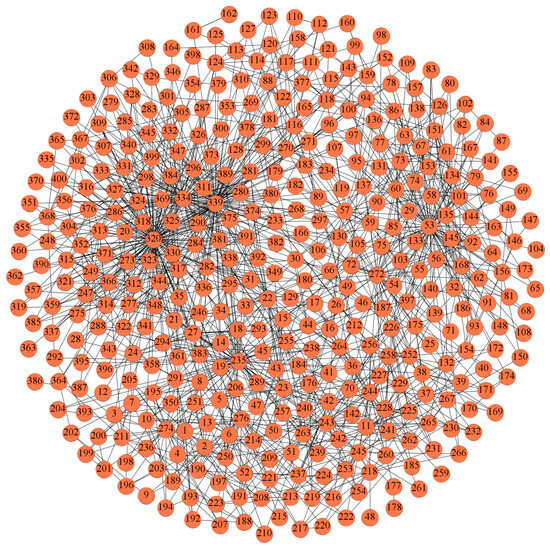
Figure 2.
Industrial network of the United States in 2017.
In this figure, nodes represent industries, with industry serial numbers corresponding to NAICS codes and industry names (refer to the industry code reference table in the Appendix A). Edges denote inter-industry linkages. Observation of the U.S. industrial network reveals that no industry exists in isolation; all maintain technological–economic linkages with others. Industries such as Real Estate (Serial No. 320), Management of Companies and Enterprises (Serial No. 339), Petroleum Refineries (Serial No. 235), and Iron and Steel Mills and Ferroalloy Manufacturing (Serial No. 53) exhibit high degrees of connectivity, indicating extensive input–output linkages with other sectors. These industries act as major consumers or suppliers within the economic system and serve as intermediary bridges for indirect interactions between different sectors.
4.2. Analysis of U.S. Industrial Network Infrastructure
Drawing on Acemoglu and Carvalho’s (2012) [24] method for analyzing network foundation structures, this study employs OLS regression analysis to conduct a nonparametric estimation of the empirical distributions for first-order weighted in-degree and out-degree, respectively. Using a Gaussian kernel smoothing function with a bandwidth of 0.3 to process the data, we generate empirical density plots of first-order weighted in-degree and out-degree for the overall U.S. industrial network, thereby analyzing real estate’s position and role within the supply–demand structure of this network. Adopting normal and power-law distributions primarily aims to determine whether the network structure exhibits symmetry through the empirical density plots derived from OLS regression analysis.
4.2.1. Analysis of Fundamental Demand Structure
According to the panel display in Figure 3, it can be seen that the distributions of the first-order weighted incomes of the U.S. industrial network in 2007, 2012, and 2017 are all approximately normally distributed. The calculated data show that the mean value of the first-order weighted incidence of the US industrial network in 2017 is 0.514 and the standard variance is 0.2846, while the mean and standard equation of 2007 are 0.482 and 0.2823, respectively, and the mean and standard variance of 2012 are 0.490 and 0.2764, respectively. The industries with first-order weighted incomes concentrated within one standard deviation in 2007, 2012, and 2017 were 69%, 65%, and 66%, respectively. In particular, the first-order weighted incomes of the U.S. real estate industry in 2007, 2012, and 2017 were 0.39, 0.37, and 0.36, respectively, which were all lower than the average of the first-order weighted incomes in those years, but all of them were located in the range of one standard deviation, which suggests that the real estate industry is relatively more reliant on intermediate inputs from the upstream sector but is not a demand pivot industry. The above data show that although a few industries’ incidence is significant, most industries’ incidence is concentrated around the mean, i.e., the first-order direct demand structure of the U.S. industrial network is equilibrium. Then, micro-specific shocks due to changes in industry demand are gradually averaged out in the propagation of the network, causing negligible effects on aggregate output.
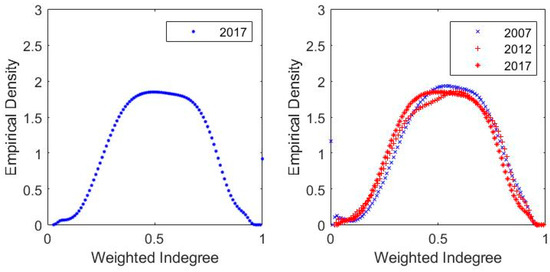
Figure 3.
Empirical density plot of first-order weighted in-degree.
4.2.2. Analysis of Fundamental Supply Structure
As shown in the panel in Figure 4, the empirical density distribution of the first-order weighted out-degree exhibits significant skewness with a right-heavy tail. This phenomenon implies the existence of a small number of “supply hubs” within the economic system that provide intermediate inputs to numerous other sectors, whose first-order weighted out-degree far exceeds the average, consistent with power-law distribution characteristics. A comparative analysis of the nonparametric estimation results for second-order weighted out-degree (empirical density plot shown in Figure 5) reveals that its distribution also displays a right-heavy tail, aligning with power-law properties. This indicates that a minority of sectors act as primary suppliers to departments producing general-purpose inputs, meaning these sectors indirectly supply intermediate inputs to a majority of sectors through higher-order linkages.
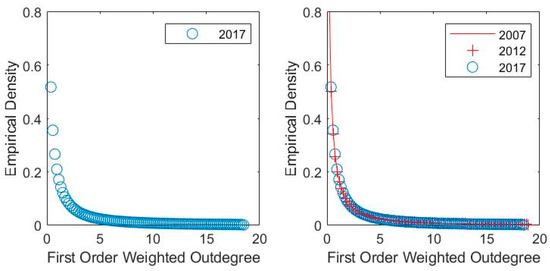
Figure 4.
Empirical density plot of first-order weighted out-degree.
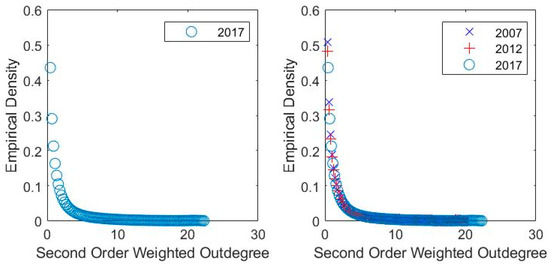
Figure 5.
Empirical density plot of second-order weighted out-degree.
To further characterize the right-heavy tail phenomenon observed in the empirical density distributions of first- and second-order weighted out-degrees, this study employs Nadaraya–Watson kernel regression to plot the empirical complementary cumulative distribution functions (CCDFs) of first- and second-order weighted out-degrees for the U.S. industrial network in 2007, 2012, and 2017 on a double-logarithmic scale, as illustrated in Figure 6 and Figure 7. The results reveal that the tails of the CCDFs for both first- and second-order out-degrees approximate power-law distributions, suggesting that a minority of sectors dominate the direct and indirect input supply to the majority of sectors. Consequently, the U.S. industrial network’s direct and indirect supply-side structures exhibit asymmetry. This implies that if the intermediate inputs provided by these “supply hubs” to their downstream industries undergo sharp short-term disruptions, the resulting output fluctuations in numerous downstream sectors will propagate through the network, ultimately amplifying systemic volatility in aggregate economic output.
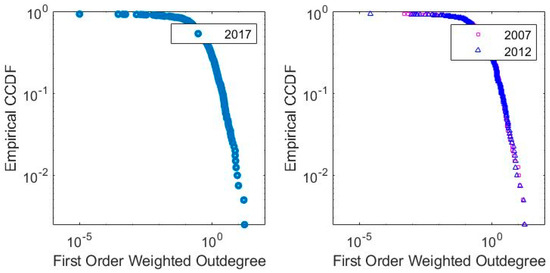
Figure 6.
Complementary cumulative distribution function plot of first-order weighted out-degree.
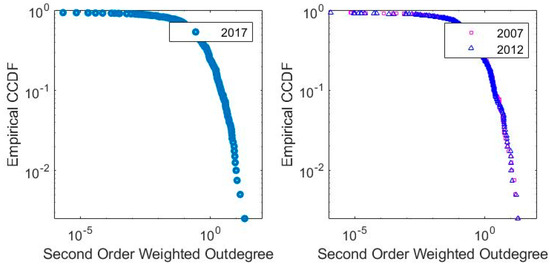
Figure 7.
Complementary cumulative distribution function plot of second-order weighted out-degree.
As shown in Table 1, the first-order and second-order weighted out-degrees of the U.S. real estate industry in 2007, 2012, and 2017 are presented. The average first-order and second-order weighted out-degrees for real estate are 6.78 and 3.98, respectively, indicating the average direct and indirect contribution of the real estate industry to producing a unit of product in other industries. These data demonstrate that within the economic system, real estate’s first-order and second-order average weighted out-degrees are notably high, positioned in the tails of their empirical density distributions. This confirms real estate’s role as a significant direct and indirect supplier. Consequently, fluctuations in the U.S. real estate sector would impact most industries across the economic system to varying degrees. Therefore, studying the diffusion characteristics of real estate fluctuations within the industrial network holds significant importance for stabilizing the U.S. financial system.

Table 1.
First-order and second-order weighted out-degree of the real estate industry.
4.3. Construction of the U.S. Real Estate Industry Network
Taking the real estate industry in the United States as an example to study the fluctuation diffusion effect of the real estate industry in a single region, it is also necessary to carry out further processing based on the overall industrial network of the United States, and the specific steps include analyzing the status and role of the real estate industry in the basic supply and demand structure, selecting the inter-industry linkage coefficients, determining the set of nodes of the real estate industry network, constructing the network model of the real estate industry, and so on.
4.3.1. Selection of Industry Linkage Coefficients
According to Acemoglu et al. (2012) [24], the imbalance in the supply and demand structure of the industrial network is an essential basis for causing micro-specific shocks to evolve into general economic fluctuations eventually. To study the fluctuation propagation effect of the U.S. real estate industry, it is necessary to start from the supply and demand structure of the U.S. industrial network to analyze the role and position of the U.S. real estate industry in the supply and demand structure and to judge whether the supply and demand structure is balanced or not, to provide a basis for the selection of the linkage coefficients between the industries.
According to the analysis in Section 4.2, the fundamental demand structure of the overall U.S. industrial network is balanced, and analyzing the impact of fluctuations in a particular industry on shocks to the overall network is of little significance. However, its first-order and second-order supply structures are both unbalanced structures, and the real estate industry has a large first-order and second-order weighted degree of output, so fluctuations in the real estate industry will be an important influencing factor causing fluctuations in total output. Therefore, we use the direct consumption coefficient of the industry as an indicator to quantify the inter-industry correlation to construct the US real estate network.
4.3.2. Determining the Collection of Real Estate Network Nodes
The distribution of input shares from one industry to another is inherently heterogeneous. Even if dominant supplier industries directly or indirectly control specific demands across multiple sectors, the allocation of these demands may vary significantly among industries. For example, there are significant gaps in the share of inputs from electricity generation, transmission, and distribution to iron and steel mills, ferroalloy manufacturing, and grain farming. Therefore, when studying industrial linkages, tools such as thresholds or the Whittle index can be employed to filter and screen associated industries. This excludes interference from weakly linked sectors and highlights strong interdependencies. Therefore, when studying industrial linkages, tools such as thresholds or the Whittle index can filter and screen associated industries, excluding interference from weakly linked sectors and highlighting strong interdependencies. Threshold selection must be carefully calibrated: overly low thresholds permit industries with weaker connections into the screening scope, causing excessive network nodes and impairing visualization; conversely, overly high thresholds filter out strongly linked industries, and retaining too few nodes is detrimental to the discovery of network characteristics of industry fluctuations.
Figure 8 displays the descending-order ranking of direct consumption coefficients for the U.S. real estate industry in 2017. The plot reveals a pronounced kink point in this ranking, indicating that it only has a large share of inputs to about 10 industries. This signifies that real estate maintains notable linkages with merely 2.5% of all sectors, while connections with the vast majority of other industries are negligible. Consequently, this study applies a 98% threshold to filter strongly linked industries for real estate, encompassing first-order linked industries, second-order linked industries, and strongly linked industries of first-order linked industries. This approach reduces redundancy from weakly associated industries and insignificant relationships in network visualization, thus enabling a clear structural representation of real estate’s industrial linkages. Since first-order linked industries, second-order linked industries, and strongly linked industries of first-order linked industries may overlap, the final filtered results comprise 120 nodes in the 2007 U.S. real estate network, 180 nodes in 2012, and 158 nodes in 2017.
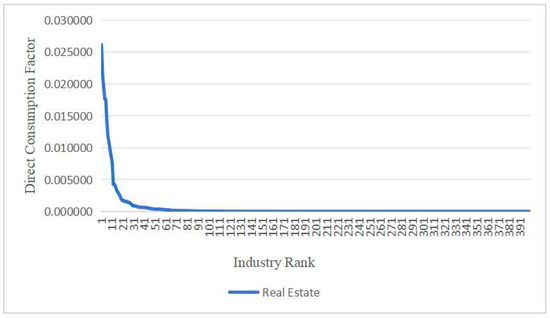
Figure 8.
Ranking of direct consumption factors for the U.S. real estate industry, 2017.
Given the high granularity of the commodity-by-commodity input–output (IO) tables utilized in this study, a cumulative proportion threshold of 98% was applied to filter industries for network visualization, ensuring a clear representation of the real estate industry’s interdependencies. This threshold identified first-order and second-order linked industries of the real estate industry and strongly associated industries of its first-order partners. Since the first-order and second-order linked industries of the real estate industry and the strongly linked industries of the first-order linked industries may overlap, the final filtered node sets comprised 120 nodes in the 2007 U.S. real estate network, 180 nodes in 2012, and 158 nodes in 2017.
4.3.3. Modeling the U.S. Real Estate Industry Network
Using the filtered industry node sets and inter-sectoral linkage coefficients obtained through the abovementioned procedures, we constructed the linkage coefficient matrix for the real estate industry network. Industries were defined as nodes, inter-sectoral linkages as edges, and direct consumption coefficients were applied to weight these linkages. The U.S. real estate industry networks for 2007, 2012, and 2017 were visualized using UCINET (v6.186), as shown in Figure 9, Figure 10 and Figure 11. Among them, the U.S. real estate industry network contained 120 nodes and 1101 connecting edges in 2007, 180 nodes and 1256 connecting edges in 2012, and 158 nodes and 1476 connecting edges in 2017. The nodes in the figure represent different industries. The thickness of the connecting edges indicates the strength of the inter-industry correlation; the thicker the connecting edges are, the stronger the correlation. The arrows point to indicate the direction of the supply inflow.
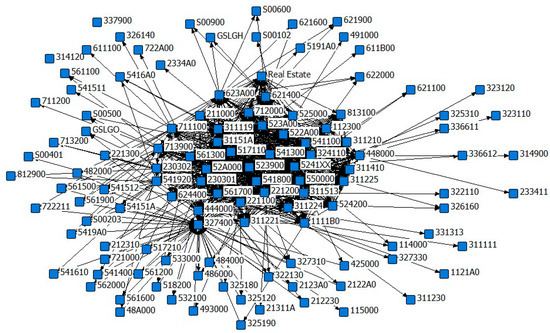
Figure 9.
U.S. real estate industry network diagram, 2007.
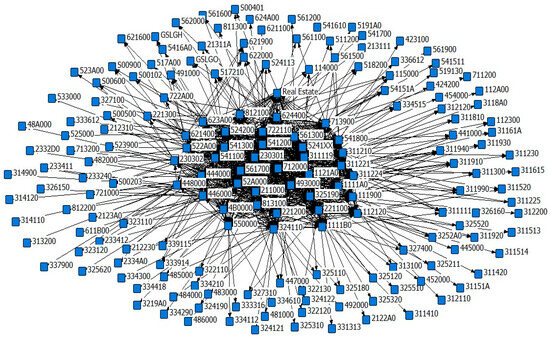
Figure 10.
U.S. real estate industry network diagram, 2012.
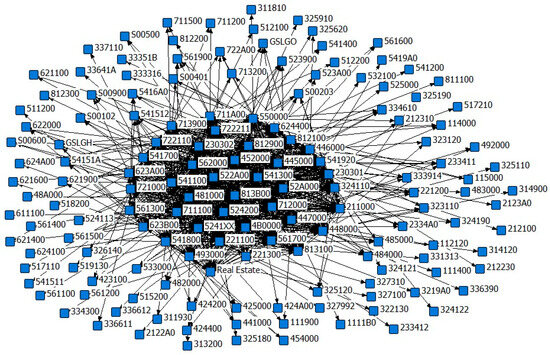
Figure 11.
U.S. real estate industry network diagram, 2017.
Comparative analysis of Figure 9, Figure 10 and Figure 11 indicates that between 2007 and 2017, the number of industries linked to real estate exhibited a trend of initial expansion followed by contraction. This fluctuation reflects the real estate industrial chain’s transition from “post-crisis restorative expansion” to “efficiency-driven contraction”. Following the 2008 financial crisis, the U.S. government implemented large-scale economic stimulus measures to revive real estate and related industries, including low interest rates, tax incentives, and infrastructure investments. Concurrently, the recovery and innovation of the real estate supply chain attracted heightened participation from financial and ancillary service sectors, leading to a significant increase in linked industries between 2007 and 2012. However, the Federal Reserve’s 2015 initiation of an interest rate hike cycle elevated financing costs for real estate, prompting the exit of marginal industries reliant on loose capital. Simultaneously, automation technologies streamlined traditional construction processes, reducing demand for material transportation and on-site labor services. Policy withdrawals and technological substitutions, etc., resulted in a modest decline in linked industries between 2012 and 2017. This analysis underscores policy shifts as a pivotal driver of structural changes in the real estate sector’s industrial linkages. At the same time, technological advancements critically influenced the breadth and composition of its associated industries.
Observing node and edge density in the network diagrams reveals that from 2007 to 2017, the number of industries with strong linkages to U.S. real estate consistently remained around 40. These strongly connected industries exhibited substantial overlap, with sectors such as oil and gas extraction (211000), architectural, engineering, and related services (541300), services to buildings and dwellings (561700), and electric power generation, transmission, and distribution (221100) maintaining robust technological–economic linkages and supply–demand relationships with real estate throughout. This indicates relative stability in the U.S. real estate linkage network during 2007–2017, attributable to the rigidity of industrial economic structures—whereby technological–economic connections and supply–demand relationships between real estate and sectors like energy supply, professional services, and financial investment persist regardless of economic cycles. This reveals real estate’s path dependence on existing industrial networks, wherein these strongly linked industries most likely constitute primary transmission channels for real estate risks. Therefore, promoting technological innovation in the real estate industrial chain to create new alternative strongly linked industries and precisely targeted policy instruments for these key sectors can effectively prevent risks triggered by real estate fluctuation diffusion.
The U.S. real estate industrial network visually represents complex economic inter-industry linkages. It displays basic information about real estate’s associated industries and is the foundation for the subsequent analysis of real estate fluctuation effects through network characteristics. It further enables the identification of critical fluctuation diffusion paths via foundational association trees, establishing the empirical basis for studying the diffusion effects of U.S. real estate fluctuations.
4.4. Empirical Analysis of Fluctuation Propagation Effects in the U.S. Real Estate Industry
4.4.1. Research of Fluctuation Propagation Effects Based on Network Characteristics
- Degree centrality
Figure 12, Figure 13 and Figure 14 shows the weighted degree centrality of 400 industries in 2007, 2012, and 2017. The higher the weighted degree centrality of the nodes in the industry network, the stronger their fluctuation transmission ability. Among them steel product manufacturing from purchased steel (331200), petroleum refineries (324110), other durable goods merchant wholesalers (423A00), other nondurable goods merchant wholesalers (424A00), real estate, internet publishing and broadcasting and web search portals (519130) (the industry rankings are 54, 235, 272, 276, 320, and 339, respectively) and other industries with strong transmission capacity. The real estate industry serves as a super hub of the economic network, linking several industries, including finance, construction, legal, and home furnishings, and there is a massive flow of resources to and from financiers and builders. Through construction, there are indirect linkages with hub industries such as steel product manufacturing from purchased steel (331200), petroleum refineries (324110), other durable goods merchant wholesalers (423A00), and other nondurable goods merchant wholesalers (424A00): steel product manufacturing from purchased steel (331200), petroleum refineries (324110) are located in the key positions of the metal industry chain and the energy industry chain, respectively, connecting the metal mining, refining, machinery manufacturing, power, and other industries; other durable goods merchant wholesalers (423A00) and other nondurable goods merchant wholesalers (424A00) act as intermediaries, connecting producers and retailers with a high number of connections and high transaction volumes. It can be seen that these industries are at the intersection of multiple industrial chains, connecting numerous nodes upstream and downstream, undertaking the function of aggregating or widely distributing resources such as capital, commodities, and information, and forming a hub value that is difficult to replace. These hub industries not only further broaden the scope of industrial association in the real estate industry but also further widen the breadth of fluctuation diffusion in the real estate industry.
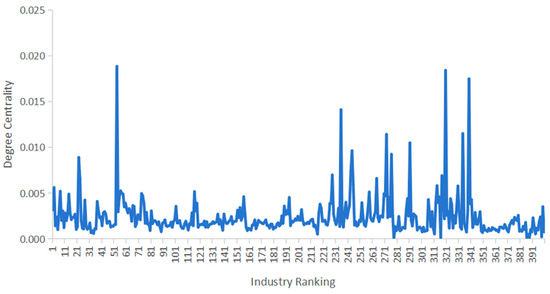
Figure 12.
Weighted degree centrality by industry, 2007.
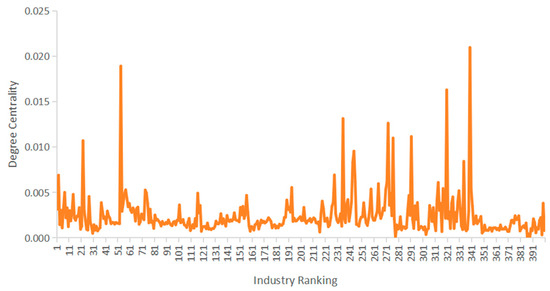
Figure 13.
Weighted degree centrality by industry, 2012.
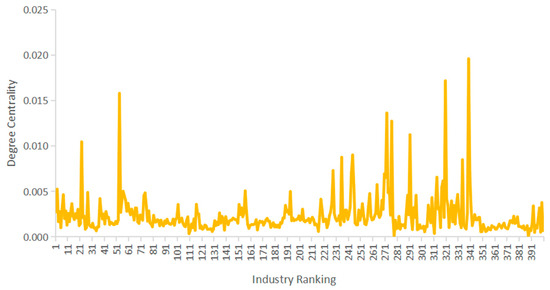
Figure 14.
Weighted degree centrality by industry, 2017.
Table 2 exhibits the top 10 percent of the U.S. real estate industry in terms of network degree centrality in 2007, 2012, and 2017, with architectural, engineering, and related services (541300), advertising, public relations, and associated services (541800), petroleum refineries (324110), nonresidential maintenance and repair (230301), and electric power generation, transmission, and distribution (221100). Petroleum refineries (324110), nonresidential maintenance and repair (230301), electric power generation, transmission, and distribution (221100), and nondepository credit intermediation and related activities (522A00) are in the top 10% of the centrality data for all three years. They cover the energy supply, development and construction, finance and investment, related service sectors, the core industries in the upstream, midstream, and downstream real estate industry chain. With their high degree of centrality and strong transmission capacity, these industries constitute the primary transmission mechanism of the real estate industry chain and play an essential role in the diffusion of fluctuations in the U.S. real estate industry network. The three-year average centrality of architectural, engineering, and related services (541300) and nonresidential maintenance and repair (230301) are 0.51 and 0.50, respectively. Its actual economic significance indicates that in the U.S. real estate industry network, these industries have a direct supply and demand relationship with more than 50% of the industries. Therefore, the other industries have a strong systematic dependence on these industries, which will trigger a chain reaction in the real estate industrial linkage network if they suffer a shock.
Table 2.
Top 10% of U.S. real estate industry network degree centrality, 2007, 2012, 2017.
- 2.
- Betweenness Centrality
Based on the data in Figure 15, it can be found that, among them, management of companies and enterprises (550000), architectural, engineering, and related services (541300), nonresidential maintenance and repair (230301), electric power generation, transmission, and distribution (221100), and employment services (561300) all rank in the top 10% of the three years of betweenness centrality data. This suggests these industries maintain a relatively strong control over the U.S. real estate network, even in a turbulent economic environment. The betweenness centrality of sectors linked to the U.S. real estate industry was generally higher in 2007 than in 2012 and 2017. The elevated betweenness centrality in 2007 stemmed from an artificially interconnected network fueled by financialization, high leverage, and complex derivatives. Post-subprime crisis deleveraging, technological substitution, and industrial consolidation restructured the supply chain, rendering inter-industry linkages more flattened and specialized, thereby reducing betweenness centrality. This trajectory reflects the U.S. real estate industry’s transition from “finance-driven expansion” to “efficiency-driven structural optimization”. The decline in betweenness centrality is not indicative of sectoral decline but rather a hallmark of enhanced resource allocation efficiency.
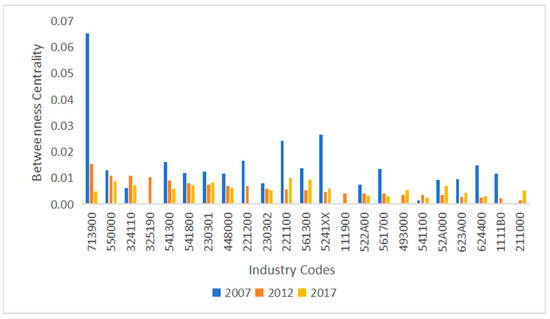
Figure 15.
Betweenness centrality of the real estate industry network, 2007, 2012, 2017.
4.4.2. Analysis of Fluctuation Diffusion Paths in the Real Estate Industry
This study adopts the foundational association tree algorithm from Zhao et al. (2013) [40]. It constructs real estate industrial foundational association trees for 2007, 2012, and 2017 using direct consumption coefficients between U.S. real estate and its strongly linked industries as edge weights. To display inter-industry linkages and nodal positions within the association trees, a threshold of 0.01 is applied (filtering matrix elements where direct consumption coefficients fall below 0.01). This prunes industries with weaker coefficients, retaining only the strongest connections between industries to reveal fluctuation diffusion paths and characteristics between real estate explicitly and it is key associated sectors. As shown in Figure 16, each node in the foundational association tree represents an industry, while edges denote the strongest inter-industry linkages.
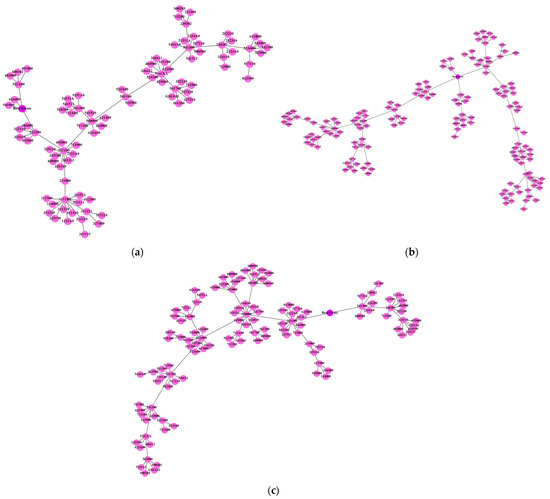
Figure 16.
(a) Industry fundamental association trees, 2007. (b) Industry fundamental association trees, 2012. (c) Industry fundamental association trees, 2017.
As shown in Figure 16a, the 2007 U.S. real estate industry network fundamental association trees have 92 industry nodes that include 13 industries in their diameter. The real estate industry is directly associated with natural gas distribution (221200), nondepository credit intermediation and related activities (522A00), child day care services (624400), and advertising, public relations, and associated services (541800). The real estate industry is indirectly linked to other industries, mainly through natural gas distribution (221200) and nondepository credit intermediation and related activities (522A00). Electric power generation, transmission, and distribution (221100) is the most first-order linked industry, directly connected to 11 industries. It is the most critical industry in determining the breadth of the propagation of fluctuations in the real estate industry. Therefore, the longest diffusion path of fluctuations in the U.S. real estate industry in 2012 is
482000(S00102/491000)—522A00—real estate—221200—221100—550000—541100—5241XX—541300—230301—52A000—517110—813100
As shown in Figure 16b, the 2012 association tree has a total of 154 industry nodes, which include 17 industries in its diameter, of which the real estate industry is directly connected to insurance carriers, except direct life (5241XX), architecture, engineering, and related services (541300), monetary authorities and depository credit intermediation (52A000), and full-service restaurants (722110), and indirectly linked to other industries through these four industries, with the longest volatility diffusion path:
484000(324121/324122/483000/492000/481000)—324110—211000—550000—541200—541100—5241XX—Real Estate—541300—325190—111900—1111B0—1111A0—311221—311119—1121A0—31161A
As shown in Figure 16c, the 2017 association tree has 121 industry nodes, which include 13 industries in its diameter, with the real estate industry being directly associated with architecture, engineering, and related services (541300) and electric power generation, transmission, and distribution (221100), and indirect linkages with other industries occur mainly through the industry electric power generation, transmission, and distribution (221100). The longest diffusion path of fluctuations in the real estate industry is:
324190(324121/324122/325120/483000/492000)—324110—230301—541300—Real Estate—221100—550000—52A000—562300—541100—5241XX—562000—524113(S00203/S00401/GSLGO)
5. Discussion
This study analyses the propagation path and propagation effect of real estate industry fluctuations in a region based on the infrastructure of an industrial network. It takes the United States as an example for empirical analysis. We use the time-series data of the U.S. industrial network to construct a model of the U.S. real estate industry network, analyze the propagation mechanism of real estate industry shocks in the industrial network based on the centrality indicators and fundamental association trees indicators, and explore the key paths and nodes of the propagation of real estate industry fluctuations. The study results show that the real estate industry has a large degree of output, and its associated industries are numerous and cover a wide area, which is the “hub industry” of the ultra-long industrial chain. The propagation and diffusion of fluctuations in the real estate industry in the asymmetric supply structure of the United States industrial network will affect many associated industries and ultimately cause fluctuations in total output. However, this study also has certain limitations, including data acquisition and processing issues, as well as the applicability of the findings due to real estate differences between China and the United States.
5.1. Discussion on the Limitations of Data Acquisition and Processing
The most current version of the detailed benchmark commodity-by-commodity total demand input–output table in the United States is still in 2017, and this paper has used the most recent data sources available. This is because the preparation and calculation of the input–output table consumes a great deal of human and material resources and requires visits to and aggregation of data from various industries. Additionally, due to the unique federal structure of the U.S., where states maintain high autonomy and independence, data acquisition faces inherent delays. The COVID-19 pandemic further significantly impeded field data collection and table compilation efforts, inevitably causing publication delays. However, this research uses the real estate industrial linkage network as the foundation for investigating fluctuation diffusion mechanisms and characteristics. Industrial networks reflect technological–economic linkages between sectors, which exhibit long-term stability. For instance, intrinsic material dependencies—such as between construction and building materials industries or real estate and finance—are structurally anchored by enduring production processes and institutional frameworks. Only major technological disruptions can significantly alter these industrial technological–economic relationships. Moreover, such disruptions require multi-phase processes, including R&D diffusion, equipment retrofitting, and capacity replacement to reshape industrial networks, demonstrating time-lag effects. Therefore, pre-2017 data can reasonably reflect current inter-industry linkages involving real estate. Future research will continuously monitor U.S. real estate’s industrial associations. When updated detailed benchmark commodity-by-commodity total demand tables become available, we will analyze real estate fluctuation diffusion effects within industrial networks using the latest data.
Furthermore, the real estate sector comprises distinct submarkets (e.g., residential and commercial real estate) with divergent industry linkages, economic roles, and risk transmission channels. Nevertheless, since this study focuses on how real estate’s external industrial linkages influence the diffusion of its fluctuations within the network, all real estate subsectors were aggregated as unified entities during data processing. While this facilitates meso-industrial analysis of real estate fluctuation diffusion impacts and patterns, it overlooks diffusion dynamics within real estate’s internal submarkets from a micro perspective. Future work will delve into real estate submarkets to examine association relationships and fluctuation propagation between subsectors and external industries, thereby complementing real estate fluctuation diffusion research from a micro-level subsector perspective.
5.2. Discussion on the Limitations of Real Estate Differences Between the U.S. and China
The core of this paper centers on the diffusion effects of fluctuations in the U.S. real estate industry within industrial networks, with the ultimate goal of drawing lessons from the diffusion mechanisms and characteristics of U.S. real estate volatility to provide policy recommendations for China’s real estate development. However, institutional and structural differences exist between the Chinese and U.S. real estate markets, which impose certain limitations on applying U.S. real estate volatility diffusion research findings to China.
These differences are manifested in the following ways: China’s market is built on public land ownership, relies on government administrative controls and a high-leverage development model, is dominated by new home sales, and concentrates financial risks within the banking system. In contrast, the U.S. market centers on private land ownership, utilizes market-based tools (interest rates and taxes) and legal regulations, features a mature secondary market, and disperses risks through securitization into capital markets. Despite these fundamental institutional disparities, research on U.S. real estate volatility diffusion remains highly relevant for China. This is because both markets face cyclical risks inherent to real estate as an economic pillar and share common needs for policy intervention. The U.S. subprime mortgage crisis revealed the dangers of excessive financialization, demonstrated the long-term regulatory role of property taxes, and exposed regulatory loopholes during crises—all offering warnings and a reference framework for China as it advances securitization, refines its housing finance system, and develops market-based regulatory tools. Particularly in preventing systemic risks (such as the spillover of developer debt crises into the financial system) and promoting the transition from “new construction to existing stock”, the U.S. practices—balancing efficiency and stability through legal constraints, innovative capital instruments, and specialized division of labor—can provide common lessons across institutional contexts. These insights may help China mitigate its dependence on land finance and explore sustainable development pathways for its real estate market.
In conclusion, future research on the propagation of fluctuations in the real estate industry to formulate policy recommendations for the stable and healthy development of the Chinese real estate industry should prioritize the availability of local data. An in-depth study of the industrial linkage structure and fluctuation propagation characteristics of China’s real estate industry and the formulation of practical strategies and policies in line with China’s unique socio-economic and developmental realities are necessary to effectively circumvent the overall economic fluctuations caused by fluctuation propagation in the real estate industry.
6. Conclusions and Policy Recommendations
6.1. Conclusions
The asymmetry in the foundational structure of industrial networks serves as a critical mechanism for the propagation and diffusion of industrial fluctuations. The United States’ industrial network infrastructure analysis reveals its supply-side structure exhibits inherent asymmetry. Given the real estate industry’s extensive inter-industry linkages and significant out-degree centrality, it emerges as a pivotal risk prevention target within the economic system. Micro-level idiosyncratic shocks affecting the real estate sector can propagate through industrial interdependencies within the network, ultimately inducing fluctuations in aggregate economic output.
From a network characteristics perspective examining real estate fluctuation diffusion, the elongated and complex real estate industrial chain interacts with hub sectors across multiple industrial chains, substantially influencing the breadth of fluctuation transmission. Key industries, including architectural, engineering, and related services (541300), nonresidential maintenance and repair (230301), and electric power generation, transmission, and distribution (221100), demonstrate a prominent degree of centrality and betweenness centrality within the U.S. real estate network. These sectors span energy supply, development and construction, financial investment, and related service domains, constituting core components along the real estate industrial chain’s upstream, midstream, and downstream segments. Their strong transmission capacity and control mechanisms form the principal conduits for real estate fluctuation propagation, playing vital roles in disseminating volatility through the network.
The real estate sector exhibits extended transmission paths and broad impact scope within the industrial system strategically positioned along the diameter of the fundamental industrial association tree. Financial investment sectors and energy-supply-related industries, situated along the main trunk of transmission pathways with numerous industrial connections, function as “critical hubs” for real estate fluctuation transmission. The length of this fundamental association tree’s diameter and the breadth of its associated industries collectively determine the depth and scope of real estate volatility diffusion. Consequently, mitigating the excessive extension of the association tree’s diameter and reducing redundant branch industries constitute essential measures for diminishing the diffusion effects of industrial fluctuations.
6.2. Policy Recommendations
To balance industrial fluctuations and stabilize the macroeconomy, this study proposes the following recommendations based on research findings, China’s industrial system characteristics, and the current state of real estate development.
Building on insights regarding asymmetric industrial network features and key-node transmission mechanisms, a dynamic resilience assessment mechanism for the real estate industry chain should be established. A multidimensional risk-monitoring index system must be developed for critical nodes with a high degree of centrality and betweenness centrality—such as electric power generation, transmission, and distribution (221100) and architectural, engineering, and related services (541300). This system should track order fluctuations and capital anomalies in real-time in hub sectors like power supply and engineering services while simulating risk transmission paths through supply-chain stress tests [41]. Given the positive correlation between the foundational association tree’s diameter length and the fluctuation diffusion depth, priority monitoring should focus on the finance–energy–construction transmission backbone, shortening key industrial-chain paths to mitigate systemic risks.
Leveraging the finding that the breadth of real estate fluctuation diffusion significantly correlates with industrial linkage density, China should enhance the application of IoT integration technologies, big data, and other advanced tools during the 2025 urban renewal initiative. Digital tools like smart meters (linking to NAICS 221100) and BIM technology (linking to NAICS 541300) can stimulate upstream demand in steel and building materials, forming a precision regulation mechanism aligned with network centrality structures.
Acknowledging the pivotal role of financial investment nodes in transmission paths, China should refine the regulatory framework for financial derivatives like MBS by drawing lessons from post-subprime crisis scale supervision in the U.S. regulatory red lines—such as securitization rate thresholds and underlying asset default rate limits—while expanding the pilot securitization of affordable rental housing from five cities to major metropolitan clusters. Strict leverage caps for developers and limits on concentrated bank credit exposure to real estate must be enforced. Concurrently, innovative financing instruments should channel special bonds to support high-quality developers, securitize affordable rental housing, and reduce liquidity risks.
To prevent economic hollowing caused by over-reliance on real estate [42], China must reduce the sector’s GDP share, fundamentally dampening the impact of its fluctuations. Fiscal incentives and industrial funds should redirect capital toward manufacturing upgrades, promoting industrial synergy and structural transformation to counter diffusion effects. Informed by industrial association tree topology, REITs should be deployed to divert social capital into 12 branch node sectors—including property management and logistics warehousing—increasing the service-oriented economy’s share and creating diversified investment channels compatible with network structures.
Regarding land-housing supply–demand balance, China’s centralized land supply and “bid-auction-listing” system amplify price volatility. Learning from U.S. failures where inelastic land supply fueled housing bubbles, China must reform asymmetric land supply constraints by establishing a routine supply mechanism synchronized with urban growth and population trends. Aligned with asymmetric transmission mechanisms in industrial networks, land reform should prioritize breaking rigid linkages in the “development-finance-energy” triangular nodes. A complexity coefficient for industrial chains should be embedded in land auctions, triggering automatic stabilizers—such as compulsory affordable housing supply and REIT issuance—when regional industrial network diameters exceed 1.2 times the national average. This would establish a multi-tiered “commodity + affordable + rental” housing system, alleviating purchase pressure through equal renter-buyer rights.
China can effectively balance cross-sector fluctuations by optimizing industrial-chain structures, accelerating IoT and big data adoption, strengthening financial risk isolation, improving housing supply systems, and fostering policy coordination. These measures will prevent a recurrence of U.S.-style real estate crises and build multidimensional resilience to underpin macroeconomic stability.
Author Contributions
Methodology, W.X.; Software, W.X.; Validation, X.P.; Formal analysis, W.X. and X.P.; Investigation, L.W.; Resources, W.S.; Data curation, W.S.; Writing—original draft, X.P.; Visualization, W.S.; Supervision, L.W.; Funding acquisition, L.W. All authors have read and agreed to the published version of the manuscript.
Funding
This research was funded by the National Natural Science Foundation of China (No. 71973086) (No. 72204149); Science and Technology Support Plan for Youth Innovation of Colleges and Universities of Shandong Province of China (2024KJL015).
Data Availability Statement
The data presented in this study are available on request from the corresponding author. There are outstanding follow-up studies to this study.
Acknowledgments
The funders are gratefully acknowledged.
Conflicts of Interest
The authors declare no conflicts of interest.
Abbreviation
The following abbreviation is used in this manuscript:
| IO | Input–output |
Appendix A
Table A1.
Industry code reference table.
Table A1.
Industry code reference table.
| № | Code | Commodity Description | № | Code | Commodity Description |
|---|---|---|---|---|---|
| 1 | 1111A0 | Oilseed farming | 201 | 311520 | Ice cream and frozen dessert manufacturing |
| 2 | 1111B0 | Grain farming | 202 | 311615 | Poultry processing |
| 3 | 111200 | Vegetable and melon farming | 203 | 31161A | Animal (except poultry) slaughtering, rendering, and processing |
| 4 | 111300 | Fruit and tree nut farming | 204 | 311700 | Seafood product preparation and packaging |
| 5 | 111400 | Greenhouse, nursery, and floriculture production | 205 | 311810 | Bread and bakery product manufacturing |
| 6 | 111900 | Other crop farming | 206 | 3118A0 | Cookie, cracker, pasta, and tortilla manufacturing |
| 7 | 112120 | Dairy cattle and milk production | 207 | 311910 | Snack food manufacturing |
| 8 | 1121A0 | Beef cattle ranching and farming, including feedlots and dual-purpose ranching and farming | 208 | 311920 | Coffee and tea manufacturing |
| 9 | 112300 | Poultry and egg production | 209 | 311930 | Flavoring syrup and concentrate manufacturing |
| 10 | 112A00 | Animal production, except cattle and poultry and eggs | 210 | 311940 | Seasoning and dressing manufacturing |
| 11 | 113000 | Forestry and logging | 211 | 311990 | All other food manufacturing |
| 12 | 114000 | Fishing, hunting, and trapping | 212 | 312110 | Soft drink and ice manufacturing |
| 13 | 115000 | Support activities for agriculture and forestry | 213 | 312120 | Breweries |
| 14 | 211000 | Oil and gas extraction | 214 | 312130 | Wineries |
| 15 | 212100 | Coal mining | 215 | 312140 | Distilleries |
| 16 | 212230 | Copper, nickel, lead, and zinc mining | 216 | 312200 | Tobacco manufacturing |
| 17 | 2122A0 | Iron, gold, silver, and other metal ore mining | 217 | 313100 | Fiber, yarn, and thread mills |
| 18 | 212310 | Stone mining and quarrying | 218 | 313200 | Fabric mills |
| 19 | 2123A0 | Other nonmetallic mineral mining and quarrying | 219 | 313300 | Textile and fabric finishing and fabric coating mills |
| 20 | 213111 | Drilling oil and gas wells | 220 | 314110 | Carpet and rug mills |
| 21 | 21311A | Other support activities for mining | 221 | 314120 | Curtain and linen mills |
| 22 | 221100 | Electric power generation, transmission, and distribution | 222 | 314900 | Other textile product mills |
| 23 | 221200 | Natural gas distribution | 223 | 315000 | Apparel manufacturing |
| 24 | 221300 | Water, sewage and other systems | 224 | 316000 | Leather and allied product manufacturing |
| 25 | 233210 | Health care structures | 225 | 322110 | Pulp mills |
| 26 | 233262 | Educational and vocational structures | 226 | 322120 | Paper mills |
| 27 | 230301 | Nonresidential maintenance and repair | 227 | 322130 | Paperboard mills |
| 28 | 230302 | Residential maintenance and repair | 228 | 322210 | Paperboard container manufacturing |
| 29 | 2332A0 | Office and commercial structures | 229 | 322220 | Paper bag and coated and treated paper manufacturing |
| 30 | 233412 | Multifamily residential structures | 230 | 322230 | Stationery product manufacturing |
| 31 | 2334A0 | Other residential structures | 231 | 322291 | Sanitary paper product manufacturing |
| 32 | 233230 | Manufacturing structures | 232 | 322299 | All other converted paper product manufacturing |
| 33 | 2332D0 | Other nonresidential structures | 233 | 323110 | Printing |
| 34 | 233240 | Power and communication structures | 234 | 323120 | Support activities for printing |
| 35 | 233411 | Single-family residential structures | 235 | 324110 | Petroleum refineries |
| 36 | 2332C0 | Transportation structures and highways and streets | 236 | 324121 | Asphalt paving mixture and block manufacturing |
| 37 | 321100 | Sawmills and wood preservation | 237 | 324122 | Asphalt shingle and coating materials manufacturing |
| 38 | 321200 | Veneer, plywood, and engineered wood product manufacturing | 238 | 324190 | Other petroleum and coal products manufacturing |
| 39 | 321910 | Millwork | 239 | 325110 | Petrochemical manufacturing |
| 40 | 3219A0 | All other wood product manufacturing | 240 | 325120 | Industrial gas manufacturing |
| 41 | 327100 | Clay product and refractory manufacturing | 241 | 325130 | Synthetic dye and pigment manufacturing |
| 42 | 327200 | Glass and glass product manufacturing | 242 | 325180 | Other basic inorganic chemical manufacturing |
| 43 | 327310 | Cement manufacturing | 243 | 325190 | Other basic organic chemical manufacturing |
| 44 | 327320 | Ready-mix concrete manufacturing | 244 | 325211 | Plastics material and resin manufacturing |
| 45 | 327330 | Concrete pipe, brick, and block manufacturing | 245 | 3252A0 | Synthetic rubber and artificial and synthetic fibers and filaments manufacturing |
| 46 | 327390 | Other concrete product manufacturing | 246 | 325411 | Medicinal and botanical manufacturing |
| 47 | 327400 | Lime and gypsum product manufacturing | 247 | 325412 | Pharmaceutical preparation manufacturing |
| 48 | 327910 | Abrasive product manufacturing | 248 | 325413 | In vitro diagnostic substance manufacturing |
| 49 | 327991 | Cut stone and stone product manufacturing | 249 | 325414 | Biological product (except diagnostic) manufacturing |
| 50 | 327992 | Ground or treated mineral and earth manufacturing | 250 | 325310 | Fertilizer manufacturing |
| 51 | 327993 | Mineral wool manufacturing | 251 | 325320 | Pesticide and other agricultural chemical manufacturing |
| 52 | 327999 | Miscellaneous nonmetallic mineral products | 252 | 325510 | Paint and coating manufacturing |
| 53 | 331110 | Iron and steel mills and ferroalloy manufacturing | 253 | 325520 | Adhesive manufacturing |
| 54 | 331200 | Steel product manufacturing from purchased steel | 254 | 325610 | Soap and cleaning compound manufacturing |
| 55 | 331313 | Alumina refining and primary aluminum production | 255 | 325620 | Toilet preparation manufacturing |
| 56 | 33131B | Aluminum product manufacturing from purchased aluminum | 256 | 325910 | Printing ink manufacturing |
| 57 | 331410 | Nonferrous metal (except aluminum) smelting and refining | 257 | 3259A0 | All other chemical product and preparation manufacturing |
| 58 | 331420 | Copper rolling, drawing, extruding and alloying | 258 | 326110 | Plastics packaging materials and unlaminated film and sheet manufacturing |
| 59 | 331490 | Nonferrous metal (except copper and aluminum) rolling, drawing, extruding and alloying | 259 | 326120 | Plastics pipe, pipe fitting, and unlaminated profile shape manufacturing |
| 60 | 331510 | Ferrous metal foundries | 260 | 326130 | Laminated plastics plate, sheet (except packaging), and shape manufacturing |
| 61 | 331520 | Nonferrous metal foundries | 261 | 326140 | Polystyrene foam product manufacturing |
| 62 | 332114 | Custom roll forming | 262 | 326150 | Urethane and other foam product (except polystyrene) manufacturing |
| 63 | 33211A | All other forging, stamping, and sintering | 263 | 326160 | Plastics bottle manufacturing |
| 64 | 332119 | Metal crown, closure, and other metal stamping (except automotive) | 264 | 326190 | Other plastics product manufacturing |
| 65 | 332200 | Cutlery and hand-tool manufacturing | 265 | 326210 | Tire manufacturing |
| 66 | 332310 | Plate work and fabricated structural product manufacturing | 266 | 326220 | Rubber and plastics hoses and belting manufacturing |
| 67 | 332320 | Ornamental and architectural metal products manufacturing | 267 | 326290 | Other rubber product manufacturing |
| 68 | 332410 | Power boiler and heat exchanger manufacturing | 268 | 423100 | Motor vehicle and motor vehicle parts and supplies |
| 69 | 332420 | Metal tank (heavy gauge) manufacturing | 269 | 423400 | Professional and commercial equipment and supplies |
| 70 | 332430 | Metal can, box, and other metal container (light gauge) manufacturing | 270 | 423600 | Household appliances and electrical and electronic goods |
| 71 | 332500 | Hardware manufacturing | 271 | 423800 | Machinery, equipment, and supplies |
| 72 | 332600 | Spring and wire product manufacturing | 272 | 423A00 | Other durable goods merchant wholesalers |
| 73 | 332710 | Machine shops | 273 | 424200 | Drugs and druggists’ sundries |
| 74 | 332720 | Turned product and screw, nut, and bolt manufacturing | 274 | 424400 | Grocery and related product wholesalers |
| 75 | 332800 | Coating, engraving, heat treating and allied activities | 275 | 424700 | Petroleum and petroleum products |
| 76 | 332913 | Plumbing fixture fitting and trim manufacturing | 276 | 424A00 | Other nondurable goods merchant wholesalers |
| 77 | 33291A | Valve and fittings other than plumbing | 277 | 425000 | Wholesale electronic markets and agents and brokers |
| 78 | 332991 | Ball and roller bearing manufacturing | 278 | 4200ID | Customs duties |
| 79 | 332996 | Fabricated pipe and pipe fitting manufacturing | 279 | 441000 | Motor vehicle and parts dealers |
| 80 | 33299A | Ammunition, arms, ordnance, and accessories manufacturing | 280 | 445000 | Food and beverage stores |
| 81 | 332999 | Other fabricated metal manufacturing | 281 | 452000 | General merchandise stores |
| 82 | 333111 | Farm machinery and equipment manufacturing | 282 | 444000 | Building material and garden equipment and supplies dealers |
| 83 | 333112 | Lawn and garden equipment manufacturing | 283 | 446000 | Health and personal care stores |
| 84 | 333120 | Construction machinery manufacturing | 284 | 447000 | Gasoline stations |
| 85 | 333130 | Mining and oil and gas field machinery manufacturing | 285 | 448000 | Clothing and clothing accessories stores |
| 86 | 333242 | Semiconductor machinery manufacturing | 286 | 454000 | Nonstore retailers |
| 87 | 33329A | Other industrial machinery manufacturing | 287 | 4B0000 | All other retail |
| 88 | 333314 | Optical instrument and lens manufacturing | 288 | 481000 | Air transportation |
| 89 | 333316 | Photographic and photocopying equipment manufacturing | 289 | 482000 | Rail transportation |
| 90 | 333318 | Other commercial and service industry machinery manufacturing | 290 | 483000 | Water transportation |
| 91 | 333414 | Heating equipment (except warm air furnaces) manufacturing | 291 | 484000 | Truck transportation |
| 92 | 333415 | Air conditioning, refrigeration, and warm air heating equipment manufacturing | 292 | 485000 | Transit and ground passenger transportation |
| 93 | 333413 | Industrial and commercial fan and blower and air purification equipment manufacturing | 293 | 486000 | Pipeline transportation |
| 94 | 333511 | Industrial mold manufacturing | 294 | 48A000 | Scenic and sightseeing transportation and support activities |
| 95 | 333514 | Special tool, die, jig, and fixture manufacturing | 295 | 492000 | Couriers and messengers |
| 96 | 333517 | Machine tool manufacturing | 296 | 493000 | Warehousing and storage |
| 97 | 33351B | Cutting and machine tool accessory, rolling mill, and other metalworking machinery manufacturing | 297 | 511110 | Newspaper publishers |
| 98 | 333611 | Turbine and turbine generator set units manufacturing | 298 | 511120 | Periodical publishers |
| 99 | 333612 | Speed changer, industrial high-speed drive, and gear manufacturing | 299 | 511130 | Book publishers |
| 100 | 333613 | Mechanical power transmission equipment manufacturing | 300 | 5111A0 | Directory, mailing list, and other publishers |
| 101 | 333618 | Other engine equipment manufacturing | 301 | 511200 | Software publishers |
| 102 | 333912 | Air and gas compressor manufacturing | 302 | 512100 | Motion picture and video industries |
| 103 | 333914 | Measuring, dispensing, and other pumping equipment manufacturing | 303 | 512200 | Sound recording industries |
| 104 | 333920 | Material handling equipment manufacturing | 304 | 515100 | Radio and television broadcasting |
| 105 | 333991 | Power-driven hand-tool manufacturing | 305 | 515200 | Cable and other subscription programming |
| 106 | 333993 | Packaging machinery manufacturing | 306 | 517110 | Wired telecommunications carriers |
| 107 | 333994 | Industrial process furnace and oven manufacturing | 307 | 517210 | Wireless telecommunications carriers (except satellite) |
| 108 | 33399A | Other general purpose machinery manufacturing | 308 | 517A00 | Satellite, telecommunications resellers, and all other telecommunications |
| 109 | 33399B | Fluid power process machinery | 309 | 518200 | Data processing, hosting, and related services |
| 110 | 334111 | Electronic computer manufacturing | 310 | 519130 | Internet publishing and broadcasting and Web search portals |
| 111 | 334112 | Computer storage device manufacturing | 311 | 5191A0 | News syndicates, libraries, archives and all other information services |
| 112 | 334118 | Computer terminals and other computer peripheral equipment manufacturing | 312 | 522A00 | Nondepository credit intermediation and related activities |
| 113 | 334210 | Telephone apparatus manufacturing | 313 | 52A000 | Monetary authorities and depository credit intermediation |
| 114 | 334220 | Broadcast and wireless communications equipment | 314 | 523900 | Other financial investment activities |
| 115 | 334290 | Other communications equipment manufacturing | 315 | 523A00 | Securities and commodity contracts intermediation and brokerage |
| 116 | 334413 | Semiconductor and related device manufacturing | 316 | 524113 | Direct life insurance carriers |
| 117 | 334418 | Printed circuit assembly (electronic assembly) manufacturing | 317 | 5241XX | Insurance carriers, except direct life |
| 118 | 33441A | Other electronic component manufacturing | 318 | 524200 | Insurance agencies, brokerages, and related activities |
| 119 | 334510 | Electromedical and electrotherapeutic apparatus manufacturing | 319 | 525000 | Funds, trusts, and other financial vehicles |
| 120 | 334511 | Search, detection, and navigation instruments manufacturing | 320 | 531000 | Real estate |
| 121 | 334512 | Automatic environmental control manufacturing | 321 | 532100 | Automotive equipment rental and leasing |
| 122 | 334513 | Industrial process variable instruments manufacturing | 322 | 532400 | Commercial and industrial machinery and equipment rental and leasing |
| 123 | 334514 | Totalizing fluid meter and counting device manufacturing | 323 | 532A00 | General and consumer goods rental |
| 124 | 334515 | Electricity and signal testing instruments manufacturing | 324 | 533000 | Lessors of nonfinancial intangible assets |
| 125 | 334516 | Analytical laboratory instrument manufacturing | 325 | 541100 | Legal services |
| 126 | 334517 | Irradiation apparatus manufacturing | 326 | 541511 | Custom computer programming services |
| 127 | 33451A | Watch, clock, and other measuring and controlling device manufacturing | 327 | 541512 | Computer systems design services |
| 128 | 334300 | Audio and video equipment manufacturing | 328 | 54151A | Other computer related services, including facilities management |
| 129 | 334610 | Manufacturing and reproducing magnetic and optical media | 329 | 541200 | Accounting, tax preparation, bookkeeping, and payroll services |
| 130 | 335110 | Electric lamp bulb and part manufacturing | 330 | 541300 | Architectural, engineering, and related services |
| 131 | 335120 | Lighting fixture manufacturing | 331 | 541610 | Management consulting services |
| 132 | 335210 | Small electrical appliance manufacturing | 332 | 5416A0 | Environmental and other technical consulting services |
| 133 | 335220 | Major household appliance manufacturing | 333 | 541700 | Scientific research and development services |
| 134 | 335311 | Power, distribution, and specialty transformer manufacturing | 334 | 541800 | Advertising, public relations, and related services |
| 135 | 335312 | Motor and generator manufacturing | 335 | 541400 | Specialized design services |
| 136 | 335313 | Switchgear and switchboard apparatus manufacturing | 336 | 541920 | Photographic services |
| 137 | 335314 | Relay and industrial control manufacturing | 337 | 541940 | Veterinary services |
| 138 | 335911 | Storage battery manufacturing | 338 | 5419A0 | All other miscellaneous professional, scientific, and technical services |
| 139 | 335912 | Primary battery manufacturing | 339 | 550000 | Management of companies and enterprises |
| 140 | 335920 | Communication and energy wire and cable manufacturing | 340 | 561300 | Employment services |
| 141 | 335930 | Wiring device manufacturing | 341 | 561700 | Services to buildings and dwellings |
| 142 | 335991 | Carbon and graphite product manufacturing | 342 | 561100 | Office administrative services |
| 143 | 335999 | All other miscellaneous electrical equipment and component manufacturing | 343 | 561200 | Facilities support services |
| 144 | 336111 | Automobile manufacturing | 344 | 561400 | Business support services |
| 145 | 336112 | Light truck and utility vehicle manufacturing | 345 | 561500 | Travel arrangement and reservation services |
| 146 | 336120 | Heavy duty truck manufacturing | 346 | 561600 | Investigation and security services |
| 147 | 336211 | Motor vehicle body manufacturing | 347 | 561900 | Other support services |
| 148 | 336212 | Truck trailer manufacturing | 348 | 562000 | Waste management and remediation services |
| 149 | 336213 | Motor home manufacturing | 349 | 611100 | Elementary and secondary schools |
| 150 | 336214 | Travel trailer and camper manufacturing | 350 | 611A00 | Junior colleges, colleges, universities, and professional schools |
| 151 | 336310 | Motor vehicle gasoline engine and engine parts manufacturing | 351 | 611B00 | Other educational services |
| 152 | 336320 | Motor vehicle electrical and electronic equipment manufacturing | 352 | 621100 | Offices of physicians |
| 153 | 336350 | Motor vehicle transmission and power train parts manufacturing | 353 | 621200 | Offices of dentists |
| 154 | 336360 | Motor vehicle seating and interior trim manufacturing | 354 | 621300 | Offices of other health practitioners |
| 155 | 336370 | Motor vehicle metal stamping | 355 | 621400 | Outpatient care centers |
| 156 | 336390 | Other motor vehicle parts manufacturing | 356 | 621500 | Medical and diagnostic laboratories |
| 157 | 3363A0 | Motor vehicle steering, suspension component (except spring), and brake systems manufacturing | 357 | 621600 | Home health care services |
| 158 | 336411 | Aircraft manufacturing | 358 | 621900 | Other ambulatory health care services |
| 159 | 336412 | Aircraft engine and engine parts manufacturing | 359 | 622000 | Hospitals |
| 160 | 336413 | Other aircraft parts and auxiliary equipment manufacturing | 360 | 623A00 | Nursing and community care facilities |
| 161 | 336414 | Guided missile and space vehicle manufacturing | 361 | 623B00 | Residential mental health, substance abuse, and other residential care facilities |
| 162 | 33641A | Propulsion units and parts for space vehicles and guided missiles | 362 | 624100 | Individual and family services |
| 163 | 336500 | Railroad rolling stock manufacturing | 363 | 624400 | Child day care services |
| 164 | 336611 | Ship building and repairing | 364 | 624A00 | Community food, housing, and other relief services, including vocational rehabilitation services |
| 165 | 336612 | Boat building | 365 | 711100 | Performing arts companies |
| 166 | 336991 | Motorcycle, bicycle, and parts manufacturing | 366 | 711200 | Spectator sports |
| 167 | 336992 | Military armored vehicle, tank, and tank component manufacturing | 367 | 711500 | Independent artists, writers, and performers |
| 168 | 336999 | All other transportation equipment manufacturing | 368 | 711A00 | Promoters of performing arts and sports and agents for public figures |
| 169 | 337110 | Wood kitchen cabinet and countertop manufacturing | 369 | 712000 | Museums, historical sites, zoos, and parks |
| 170 | 337121 | Upholstered household furniture manufacturing | 370 | 713100 | Amusement parks and arcades |
| 171 | 337122 | Nonupholstered wood household furniture manufacturing | 371 | 713200 | Gambling industries (except casino hotels) |
| 172 | 337127 | Institutional furniture manufacturing | 372 | 713900 | Other amusement and recreation industries |
| 173 | 33712N | Other household nonupholstered furniture | 373 | 721000 | Accommodation |
| 174 | 337215 | Showcase, partition, shelving, and locker manufacturing | 374 | 722110 | Full-service restaurants |
| 175 | 33721A | Office furniture and custom architectural woodwork and millwork manufacturing | 375 | 722211 | Limited-service restaurants |
| 176 | 337900 | Other furniture related product manufacturing | 376 | 722A00 | All other food and drinking places |
| 177 | 339112 | Surgical and medical instrument manufacturing | 377 | 811100 | Automotive repair and maintenance |
| 178 | 339113 | Surgical appliance and supplies manufacturing | 378 | 811200 | Electronic and precision equipment repair and maintenance |
| 179 | 339114 | Dental equipment and supplies manufacturing | 379 | 811300 | Commercial and industrial machinery and equipment repair and maintenance |
| 180 | 339115 | Ophthalmic goods manufacturing | 380 | 811400 | Personal and household goods repair and maintenance |
| 181 | 339116 | Dental laboratories | 381 | 812100 | Personal care services |
| 182 | 339910 | Jewelry and silverware manufacturing | 382 | 812200 | Death care services |
| 183 | 339920 | Sporting and athletic goods manufacturing | 383 | 812300 | Dry-cleaning and laundry services |
| 184 | 339930 | Doll, toy, and game manufacturing | 384 | 812900 | Other personal services |
| 185 | 339940 | Office supplies (except paper) manufacturing | 385 | 813100 | Religious organizations |
| 186 | 339950 | Sign manufacturing | 386 | 813A00 | Grantmaking, giving, and social advocacy organizations |
| 187 | 339990 | All other miscellaneous manufacturing | 387 | 813B00 | Civic, social, professional, and similar organizations |
| 188 | 311111 | Dog and cat food manufacturing | 388 | 814000 | Private households |
| 189 | 311119 | Other animal food manufacturing | 389 | S00500 | Federal general government (defense) |
| 190 | 311210 | Flour milling and malt manufacturing | 390 | S00600 | Federal general government (nondefense) |
| 191 | 311221 | Wet corn milling | 391 | 491000 | Postal service |
| 192 | 311225 | Fats and oil refining and blending | 392 | S00102 | Other federal government enterprises |
| 193 | 311224 | Soybean and other oilseed processing | 393 | GSLGE | State and local government (educational services) |
| 194 | 311230 | Breakfast cereal manufacturing | 394 | GSLGH | State and local government (hospitals and health services) |
| 195 | 311300 | Sugar and confectionery product manufacturing | 395 | GSLGO | State and local government (other services) |
| 196 | 311410 | Frozen food manufacturing | 396 | S00203 | Other state and local government enterprises |
| 197 | 311420 | Fruit and vegetable canning, pickling, and drying | 397 | S00401 | Scrap |
| 198 | 311513 | Cheese manufacturing | 398 | S00402 | Used and secondhand goods |
| 199 | 311514 | Dry, condensed, and evaporated Dairy product manufacturing | 399 | S00300 | Noncomparable imports |
| 200 | 31151A | Fluid milk and butter manufacturing | 400 | S00900 | Rest of the world adjustment |
References
- Deng, L.; Li, S.L.; Zuo, W.C.; Han, Y. Housing production and the structural transformation of China’s real estate development industry. Hous. Stud. 2025, 40, 1017–1042. [Google Scholar] [CrossRef]
- Yu, Q.L. A study of production network transmission effects based on deleveraging and volatility spillovers in Chinese real estate. Investig. Entrep. 2023, 34, 53–55. [Google Scholar]
- Hou, Z.K.; He, Z.J.; Zhou, L.G. The structure of inter-industry market risk dependence and its crisis contagion effects. Res. Financ. Econ. 2018, 33, 71–83. [Google Scholar]
- Zhu, M.; Gong, B. Global economy 2023: The new normal of high inflation. Stud. Int. Financ. 2023, 3–12. [Google Scholar] [CrossRef]
- Luo, S.; Ma, J. International Housing Markets and the U.S. Subprime Crisis. J. Money Credit Bank. 2023, 56, 647–669. [Google Scholar] [CrossRef]
- Ji, Q.; Marfatia, H.; Gupta, R. Information spillover across international real estate investment trusts: Evidence from an entropy-based network analysis. N. Am. J. Econ. Financ. 2018, 46, 103–113. [Google Scholar] [CrossRef]
- Ozcelebi, O.; Yoon, S.M. Impact of financial stress on the REIT market stability. Int. Rev. Econ. Financ. 2025, 100, 104114. [Google Scholar] [CrossRef]
- Office of Policy Studies of the National Development and Reform Commission. World Economy Extends Low Growth Trend Globally Starting a New Interest Rate Cutting Cycle—Analysis of the World Economic Situation in the First Three Quarters of 2024 and Outlook for the Fourth Quarter. Macroecon. Manag. 2024, 7–10. [Google Scholar] [CrossRef]
- Pigou, A.C. Industrial Fluctuations; Taylor and Francis: Abingdon, UK, 2016; p. 433. [Google Scholar]
- Peng, S.Y.; Zhong, D.C. Industrial Chain Risk Exposure and Economic Volatility: A Framework Incorporating Foreign-Invested Enterprises. World Econ. 2025, 48, 961–980. [Google Scholar] [CrossRef]
- Kong, F.W.; Zou, Y.H.; Xiu, H.W. A Study on the Ripple Effect of China’s Construction Industry Based on the Industry Ripple Theory. Constr. Econ. 2018, 39, 22–26. [Google Scholar] [CrossRef]
- Miao, Z.Q. The correlation between macroeconomic fluctuations and industrial structure. Chin. Mark. 2020, 60+126. [Google Scholar] [CrossRef]
- Xiang, X.M.; Zhao, B.X. A study of interregional propagation effect of industrial fluctuations based on k-shell structure—An example of interregional input-output data of 30 provinces, autonomous regions and cities in China. East China Econ. Manag. 2018, 32, 77–86. [Google Scholar] [CrossRef]
- Attilio, L.A.; Mollick, A.V. Oil Price Shocks and Macroeconomic Fluctuations: A GVAR Approach. Manch. Sch. 2025, 93, 170–190. [Google Scholar] [CrossRef]
- Du, P.; Ni, Y.; Chen, H. Carbon emission fluctuations of Chinese inter-regional interaction: A network multi-hub diffusion perspective. Environ. Sci. Pollut. Res. 2023, 30, 52141–52156. [Google Scholar] [CrossRef] [PubMed]
- Huang, W.X.; Ma, H.Y. Research on the Influence of Real Estate Investment and Economic Growth in China. In Proceedings of the International Conference on Management Engineering and Management Innovation (ICMEMI), Changsha, China, 10–11 January 2015; pp. 235–239. [Google Scholar]
- Ruan, L.F.; Shen, L.J. Coordination Degree Analysis of Real Estate Investment and the National Economy in China -Based on Principal Component Analysis Method. In Proceedings of the 3rd International Conference on Advanced Engineering Materials and Technology (AEMT 2013), Zhangjiajie, China, 11–12 May 2013; pp. 2870–2874. [Google Scholar]
- Kong, Y.; Dong, J. Does the size of the housing rental market stabilize regional economic fluctuations? Evidence from China’s large- and medium-sized cities. Habitat Int. 2024, 153, 103189. [Google Scholar] [CrossRef]
- Xu, X.C.; Jia, H.; Li, J.; Li, J.B. A Study of the Role of the Real Estate Economy on China’s National Economic Growth. Soc. Sci. China 2015, 84–101+204. [Google Scholar]
- Qiu, Z.X.; Wang, T. On the Pulling and Driving Role of China’s Real Estate Industry on the National Economy. Econ. Manag. Res. 2010, 24–28. [Google Scholar] [CrossRef]
- Lee, S.; Kim, Y.M. The Asymmetric Effects of Real Estate Uncertainty Shock. J. Real Estate Res. 2025, 47, 28–52. [Google Scholar] [CrossRef]
- Zeng, H.J. Risk transmission and diversification strategies between US real estate investment trusts (REITs) and green finance indices. Kybernetes, 2024; ahead-of-print. [Google Scholar] [CrossRef]
- Chen, X.M.; Ma, G.Q. Study on the characteristics and synergistic effects of industrial complex networks—Empirical evidence from Chinese manufacturing. Kybernetes 2025, 54, 1373–1394. [Google Scholar] [CrossRef]
- Acemoglu, D.; Carvalho, V.M.; Ozdaglar, A.; Tahbaz-Salehi, A. The Network Origins of Aggregate Fluctuations. Econometrica 2012, 80, 1977–2016. [Google Scholar] [CrossRef]
- Xiang, X.M.; Zhao, B.X.; Yin, R.R. A Study on the Impact of Industrial Network Structure on Aggregate Output Fluctuations—Based on Chinese Input-Output Data. J. Shandong Univ. (Philos. Soc. Sci. Ed.) 2016, 19–25. [Google Scholar]
- Zhao, B.X.; Xiang, X.M.; Zhang, M.J. Network Modelling of Interregional Interactions of Aggregate Output Fluctuations. Theory Pract. Syst. Eng. 2017, 37, 2611–2620. [Google Scholar]
- Feng, X.H.; Xu, M.H.; Li, J.X.; Gao, Z.Y. Analysis of China’s industrial network structure and its resilience from the sectoral perspective. Habitat Int. 2024, 153, 103192. [Google Scholar] [CrossRef]
- Wang, L. Input and output models application in analyzing the real estate macroeconomic efficiency in China. Biotechnol. Indian J. 2014, 10, 14–20. [Google Scholar]
- Su, B.P.; Sun, H.; Zhi, H. Empirical Analysis of the Correlation between Real Estate and Relevant Industries of Xi’an. In Proceedings of the International Conference on Construction and Real Estate Management, Beijing, China, 5–6 November 2009; pp. 1036–1038. [Google Scholar]
- Man, X.Y.; Lv, X.Z.; Yi, C.D. Real estate industry and urban economy: An analysis based on the input-output table of Beijing 2000–2012. J. Cent. Univ. Financ. Econ. 2017, 119–128. [Google Scholar]
- Chen, X.Z.; Zhao, B.X.; Xiao, W.W. A Study of Industry-Side Association Networks. China Manag. Sci. 2014, 22, 122–130. [Google Scholar] [CrossRef]
- Liu, Y. Research on Supply and Demand of China’s Real Estate Upstream and Downstream Industries and Real Estate Market—An Empirical Analysis Based on Input-Output Tables from 2002 to 2012. Mod. Manag. Sci. 2016, 91–93. [Google Scholar]
- Zhang, H.; Bi, Z.J.; Yu, A.M. Positioning of China’s Real Estate Industry Based on the Input-Output Method. J. Tsinghua Univ. (Nat. Sci. Ed.) 2023, 63, 153–159. [Google Scholar] [CrossRef]
- Gao, W.; Wei, S.; Geng, C.; He, J.; Li, X.T.; Liu, S.Q. The Role of the Real Estate Sector in the Economy: Cross-National Disparities and Their Determinants. Sustainability 2024, 16, 7697. [Google Scholar] [CrossRef]
- Han, Y.; Zhang, H.T.; Zhao, Y. Structural evolution of real estate industry in China: 2002–2017. Struct. Change Econ. Dyn. 2021, 57, 45–56. [Google Scholar] [CrossRef]
- Hu, W.H.; Pang, J.; Li, W. The Risk Spillover Effects and Network Connectedness Between Real Estate and Other Sectors in China. Sage Open 2024, 14, 21582440241240866. [Google Scholar] [CrossRef]
- Carvalho, V.M.; Tahbaz-Salehi, A. Production Networks: A Primer. Annu. Rev. Econ. 2019, 11, 635–663. [Google Scholar] [CrossRef]
- Xiang, X.M.; Zhao, B.X.; Yu, C.C. The Relationship between Industrial Network Structure and Aggregate Output Fluctuations—An Example from Input-Output Data of Eight Provinces and Cities in China. Syst. Eng. 2017, 35, 81–87. [Google Scholar]
- Liu, H.G.; Pan, Q.L.; Xie, S.N. Comparative analysis of agricultural industrial linkage effects between China and the United States based on input-output modelling. China’s Rural Econ. 2012, 4–10+20. [Google Scholar] [CrossRef]
- Zhao, B.X.; Chen, X.Z.; Chen, G.Q. Construction and analysis of industrial fundamental association trees—A case study of Shandong and Jiangsu provinces. Manag. Comment. 2013, 25, 35–42. [Google Scholar] [CrossRef]
- Song, M. Study on the Path to Enhancing China’s Industrial Chain Resilience. Ind. Eng. Innov. Manag. 2024, 7, 109–121. [Google Scholar]
- Li, X.; Shao, X.; Tao, Z. Hollowing out of the Real Economy: Evidence from China’s Listed FirmsI. Front. Chin. Econ. Engl. Ed. 2016, 11, 390–409. [Google Scholar]
Disclaimer/Publisher’s Note: The statements, opinions and data contained in all publications are solely those of the individual author(s) and contributor(s) and not of MDPI and/or the editor(s). MDPI and/or the editor(s) disclaim responsibility for any injury to people or property resulting from any ideas, methods, instructions or products referred to in the content. |
© 2025 by the authors. Licensee MDPI, Basel, Switzerland. This article is an open access article distributed under the terms and conditions of the Creative Commons Attribution (CC BY) license (https://creativecommons.org/licenses/by/4.0/).