1. Introduction
Three principal approaches are used in professional valuation practice to determine the market value of real property: the cost approach, the income approach, and the sales comparison approach. For specialist property assets often characterised by the absence of active markets or predictable cash flows, valuers frequently adopt the replacement cost method [
1]. While theoretically suitable for infrastructure assets, this approach presents significant challenges for urban assets with placemaking potential, failing to capture their broader contribution to the urban environment and intangible socioeconomic impacts. Urban megaprojects share an array of similarities as this type of specialist property. Urban megaprojects are large-scale complex developments, typically involving mixed-use precincts, major infrastructure, and public amenities, intended to transform the urban fabric. These projects are often advanced through public–private partnerships and are not traded in conventional markets, making their valuation particularly complex. While their physical and economic impacts are well documented, less is known about how they influence nearby residential property values through the transfer of intangible value. Specifically, the extent to which the existence, visibility, and anticipated benefits of such flagship projects are capitalised into local property markets remains underexplored.
Drawing on environmental economics, this study uses the concept of willingness to pay (WTP) to empirically capture the non-market value transferred from megaprojects to surrounding properties. These intangible benefits translate into real estate market dynamics by increasing how much residents, businesses, and investors are willing to pay for proximity to such projects due to enhanced amenities, agglomeration economies, and the existence, option, and bequest generational values attached to these projects. These so-called non-use values are often hidden within price formation, as they become capitalised into surrounding property markets through increased willingness to pay (WTP). Thus, WTP serves as the bridging mechanism between theoretical non-use value and observed market behaviour, making it possible to quantify the broader externalities that megaprojects generate across spatial and economic scales. These components are rarely captured by conventional valuation techniques but can be revealed through hedonic pricing models (HPMs) where the hedonic framework [
2] decomposes the price of a heterogeneous good, such as housing, into the implicit values of its structural, locational, and environmental attributes [
3,
4].
This paper focuses on identifying and quantifying the intangible value transfer associated with urban megaprojects, defined here as the portion of residential property value attributable to spatial proximity to these large-scale developments. The hypothesis is that property markets absorb a value transformation from urban megaprojects in the form of an existence value that is observable and can be revealed via appropriate methods captured in the data. The central hypothesis posits that, all else being equal, residential properties situated in closer proximity to urban megaprojects will attract a price premium compared to those located further away. Specifically, this study focuses on the transfer of intangible value from urban megaprojects to answer the research question: Is there an intangible value transfer from urban megaprojects to surrounding residential property prices?
The analysis is confined to multi-storey residential dwellings such as apartment buildings, thereby excluding detached housing from the scope. The investigation was conducted in Brisbane, Australia, which provides a unique natural experiment due to the simultaneous implementation of several transformative urban megaprojects, namely, the Queen’s Wharf Brisbane, Cross River Rail, and Brisbane Live. These developments are reshaping the inner city, with significant implications for urban livability, accessibility, and investment attractiveness. The co-location and concurrent phasing of these projects offer an exceptional context to examine potential synergy effects on nearby property markets [
5].
A longitudinal dataset covering residential property transactions from 2016 to 2022 was utilised, incorporating detailed property characteristics, sales prices, and distances to each megaproject. By applying hedonic price modelling, this study isolates the price effects associated with spatial proximity to these developments, providing a microeconomic perspective on the valuation of urban regeneration. The methodological approach aligns with the revealed preference theory, enabling the estimation of non-market values based on observed market behaviour.
The contribution of this research is twofold: first, it offers an empirical assessment of the extent to which urban megaprojects influence surrounding residential markets; second, it quantifies these intangible value effects within the context of an actively regenerating CBD. In doing so, this research fills a critical research gap by providing a microeconomic assessment of urban megaprojects’ impacts on Brisbane’s residential property market. The findings will offer novel insights for stakeholders involved in urban planning, real estate investment, and policymaking, supporting informed decision-making aimed at maximising the benefits of urban regeneration while effectively managing associated disruptions.
The structure of the paper is as follows:
Section 2 provides a review of the relevant literature and outlines the development of the research hypothesis.
Section 3 outlines the data sources and the hedonic pricing model specification.
Section 4 presents the empirical results, and
Section 5 discusses the policy and investment implications.
Section 6 concludes the paper, presenting the key findings, acknowledging limitations, and suggesting directions for future research.
2. Literature Review and Hypothesis Derivation
The determination of property values in professional valuation practice often involves implicit assumptions that can significantly influence the outcome. A large body of the literature has explored the factors that significantly influence a property’s value or price. Understanding the determinants of real estate value is a central concern in both professional valuation practice and academic research. Unlike standardised goods, real estate assets are heterogeneous, location-dependent, and influenced by a broad set of tangible and intangible factors. Within this extensive body of research, two conceptual frameworks are particularly relevant to the current study: willingness to pay (WTP) and hedonic pricing models (HPMs). WTP provides a theoretical foundation for valuing non-market goods, while the HPM offers an empirical method to reveal implicit values based on observed market behaviour. This study draws from both traditions, operationalising the analysis through a hedonic pricing framework to examine how urban megaprojects contribute intangible value to surrounding residential markets.
2.1. Applications of Willingness to Pay
The concept of willingness to pay (WTP) is grounded in welfare economics, where it measures the maximum amount an individual is prepared to pay to secure a benefit or avoid a loss. WTP is widely used in the valuation of environmental goods, i.e., public goods that are not directly traded in active markets [
6,
7,
8].
Two broad methodological approaches are used to estimate WTP. Stated preference methods, such as the Contingent Valuation Method (CVM) and Conjoint Analysis (CJA), rely on surveys asking individuals directly about their willingness to pay for hypothetical changes [
9,
10,
11]. In contrast, revealed preference methods infer WTP from observed behaviours in affiliated markets. Techniques such as the hedonic pricing model (HPM) and the Travel Cost Method (TCM) are typical in this tradition [
12]. According to Bateman et al. [
13], the total economic value of public goods can be divided into use values and non-use values. Use values derive from direct or indirect utilisation, while non-use values reflect the satisfaction gained simply from knowing the resource exists. Revealed preference methods like HPMs are particularly effective for quantifying use values in property markets. In contrast, stated preference methods, while valuable, are often criticised for their hypothetical bias and lack of behavioural validation [
14,
15]. This study adopts a revealed preference approach, specifically HPMs, to quantify the intangible value transferred from urban megaprojects to residential property markets.
2.2. Hedonic Price Model
Hedonic pricing models (HPMs) deconstruct the market price of a heterogeneous good into the implicit prices of its constituent attributes [
2]. In the context of housing, relevant attributes encompass structural features (such as property size, number of bedrooms, and build quality), locational elements (including proximity to amenities), and environmental conditions (like air quality and noise levels) [
3,
4]. HPMs are particularly valuable for real estate valuation, as many important property characteristics represent non-market goods. Numerous studies have used HPMs to measure the effects of environmental and infrastructural externalities, including air pollution [
16,
17], aesthetic views [
18], transport infrastructure [
19,
20], and brownfield redevelopment [
21]. The functional form of hedonic regressions typically adopts one of three specifications: linear, semi-logarithmic, or log-log [
22]. Semi-log models are widely used as they allow the estimated coefficients to be interpreted as percentage changes in price. This study adopted the semi-log functional form, consistent with common practice in the field. Despite their strengths, traditional hedonic models have limitations. They often omit spatial interaction effects and synergies arising from multiple co-located projects. Recent methodological advances recommend incorporating interaction terms and spatial dynamics into hedonic analyses to better capture cumulative impacts [
5,
23]. The inherent immobility of real estate underscores the importance of spatial variables in HPMs. Since Von Thünen’s (1826), cited in McDonald & McMillen [
24] early work on land rents and the development of the monocentric city model by Alonso [
25], Mills [
26], and Muth [
27], proximity to city centres and amenities has been recognised as a critical determinant of property value. Straight-line distance, travel time, and travel distance remain the primary metrics used to operationalise spatial accessibility [
28,
29,
30].
2.3. Urban Megaprojects and Intangible Value Transfer
Urban megaprojects, large-scale developments often involving billions in investment, have significant impacts on cities’ spatial and economic structures. Transport megaprojects, such as highways and rail systems, typically exert centrifugal forces by enhancing connectivity and encouraging decentralisation [
31]. In contrast, building megaprojects with placemaking objectives such as iconic cultural centres or integrated urban precincts tends to exert centripetal forces, concentrating economic and social activity toward the urban core [
32,
33,
34].
Flagship projects like the Burj Khalifa or the Sydney Opera House not only fulfil functional purposes but also serve as symbols of urban identity and aspiration, producing long-term economic and social benefits. However, building megaprojects exposes substantial risks, including significant cost overruns and planning complexities [
35]. These projects fundamentally alter the urban environment and can generate intangible value captured in surrounding property markets. While much attention has focused on transport infrastructure, the intangible value effects of building megaprojects, especially mixed-use developments combining residential, commercial, and public spaces, remain underexplored in empirical research. This study seeks to address this gap by examining the spatial capitalisation of building megaprojects into nearby residential property values.
2.4. Research Gap and Hypothesis Development
The literature reveals a critical research gap, that while the impacts of transport infrastructure on property markets are well documented, the intangible value transfer associated with building megaprojects remains insufficiently understood. Moreover, few studies have systematically differentiated between the externalities produced by transport megaprojects and those produced by placemaking-oriented building projects. This study specifically investigates whether residential properties situated close to major projects in Brisbane exhibit a price premium, consistent with the theory of intangible value transfer. Accordingly, the central hypothesis is as follows:
H1: Properties situated closer to urban megaprojects will command a price premium relative to those located farther away, implying an increased value transfer from the property and vice versa, ceteris paribus (c.p).
The findings advance both scholarly understanding and practical applications. For academics, this research contributes to the ongoing debate on the effectiveness and efficiency of megaprojects as a means of urban development and economic growth [
36,
37]. For practitioners, it offers evidence-based guidance for project planning, coordination, and value optimisation in urban regeneration initiatives. These insights can inform policymakers about future projects.
3. Data and Methods
3.1. Study Area and Context
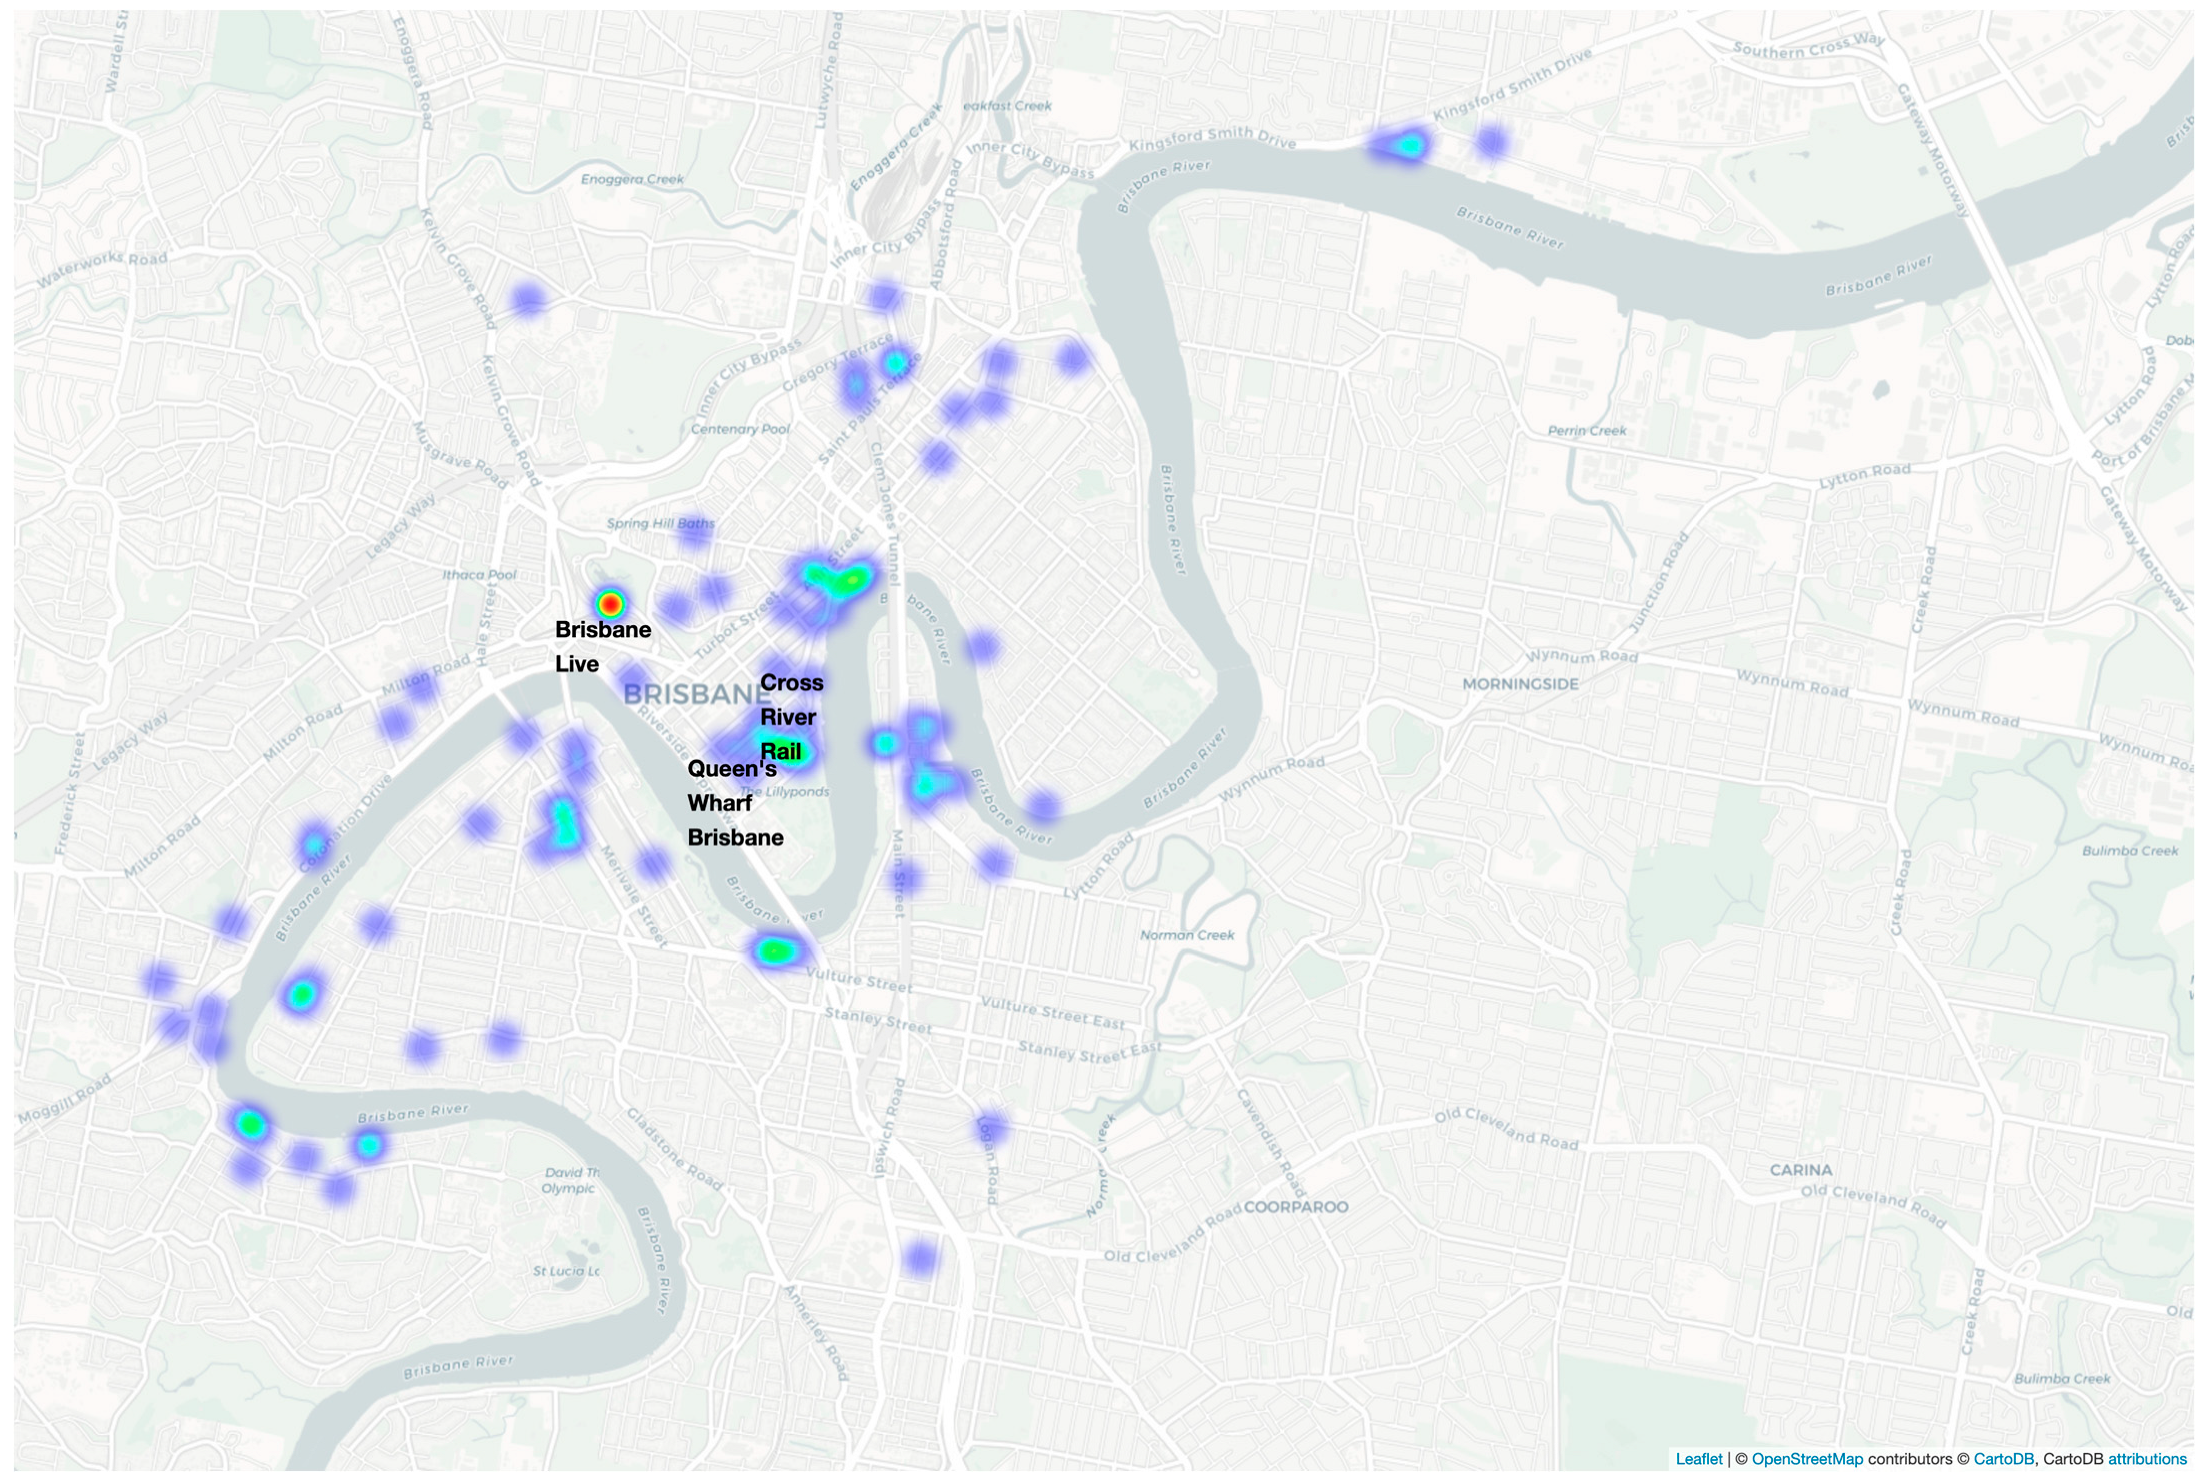
Brisbane, Australia, serves as the study area for this research, allowing the examination of residential property market dynamics during a period when the city experienced a simultaneous development of multiple major urban megaprojects. The simultaneous rollout of these transformative projects, each anticipated to substantially shape Brisbane’s urban landscape, provides a unique opportunity to assess their combined effect on property markets [
5].
Figure A1 in
Appendix A presents a heatmap of residential property sales transactions across Brisbane, with
Table 1 providing an overview about the project descriptions.
3.2. Data Sources and Variables
A two-step approach was followed to obtain sales evidence for a large dataset. Emporis was used to retrieve information about apartment blocks in Brisbane. Mid-to-high-rise apartment blocks were targeted for two reasons. Primarily, these blocks contain a lot of sales evidence within the building for a large dataset, which is needed in a longitudinal dataset, and second, they provide a consistent number of results that can be used in the analysis. Emporis is a global provider of building-related information worldwide. The analytical framework involved compiling a robust dataset (sourced from Pricefinder, PriceFinder web platform, Domain Holdings Australia Limited, Brisbane, QLD, Australia) of residential property transactions from January 2016 to December 2022. Pricefinder is a proprietary database, and in Australia, it is used extensively in professional valuation practice, providing comprehensive data on sales history, property transactions, and information across the Australian property market. Both the building name search function and the address search function were used to cross-check results. Sales data for 108 mid-to-high-rise buildings were obtained with this method. Next, the geospatial data were used in Nearmap (MapBrowser web application, Nearmap Ltd., Sydney, NSW, Australia) to calculate the Euclidean distance, as a straight line or ‘as the crow flies’, to the Megaprojects. The Euclidean distance, as a straight line or ‘as the crow flies’, was employed to quantify the proximity between dwellings and the designated megaprojects. The Euclidean distance (in km) was calculated from the property’s geographic coordinates to the centroid of each megaproject site, using latitude and longitude data sourced from Google Maps and Nearmap’s geographic information systems (GIS). These distance variables serve to represent the spatial relationship between properties and the respective megaproject locations.
Data on the characteristics and timelines of the urban megaprojects in Brisbane were collated and include details such as the project scope, expected completion dates, and key milestones to ensure the reliability of the results. This information was obtained from the official websites of the projects.
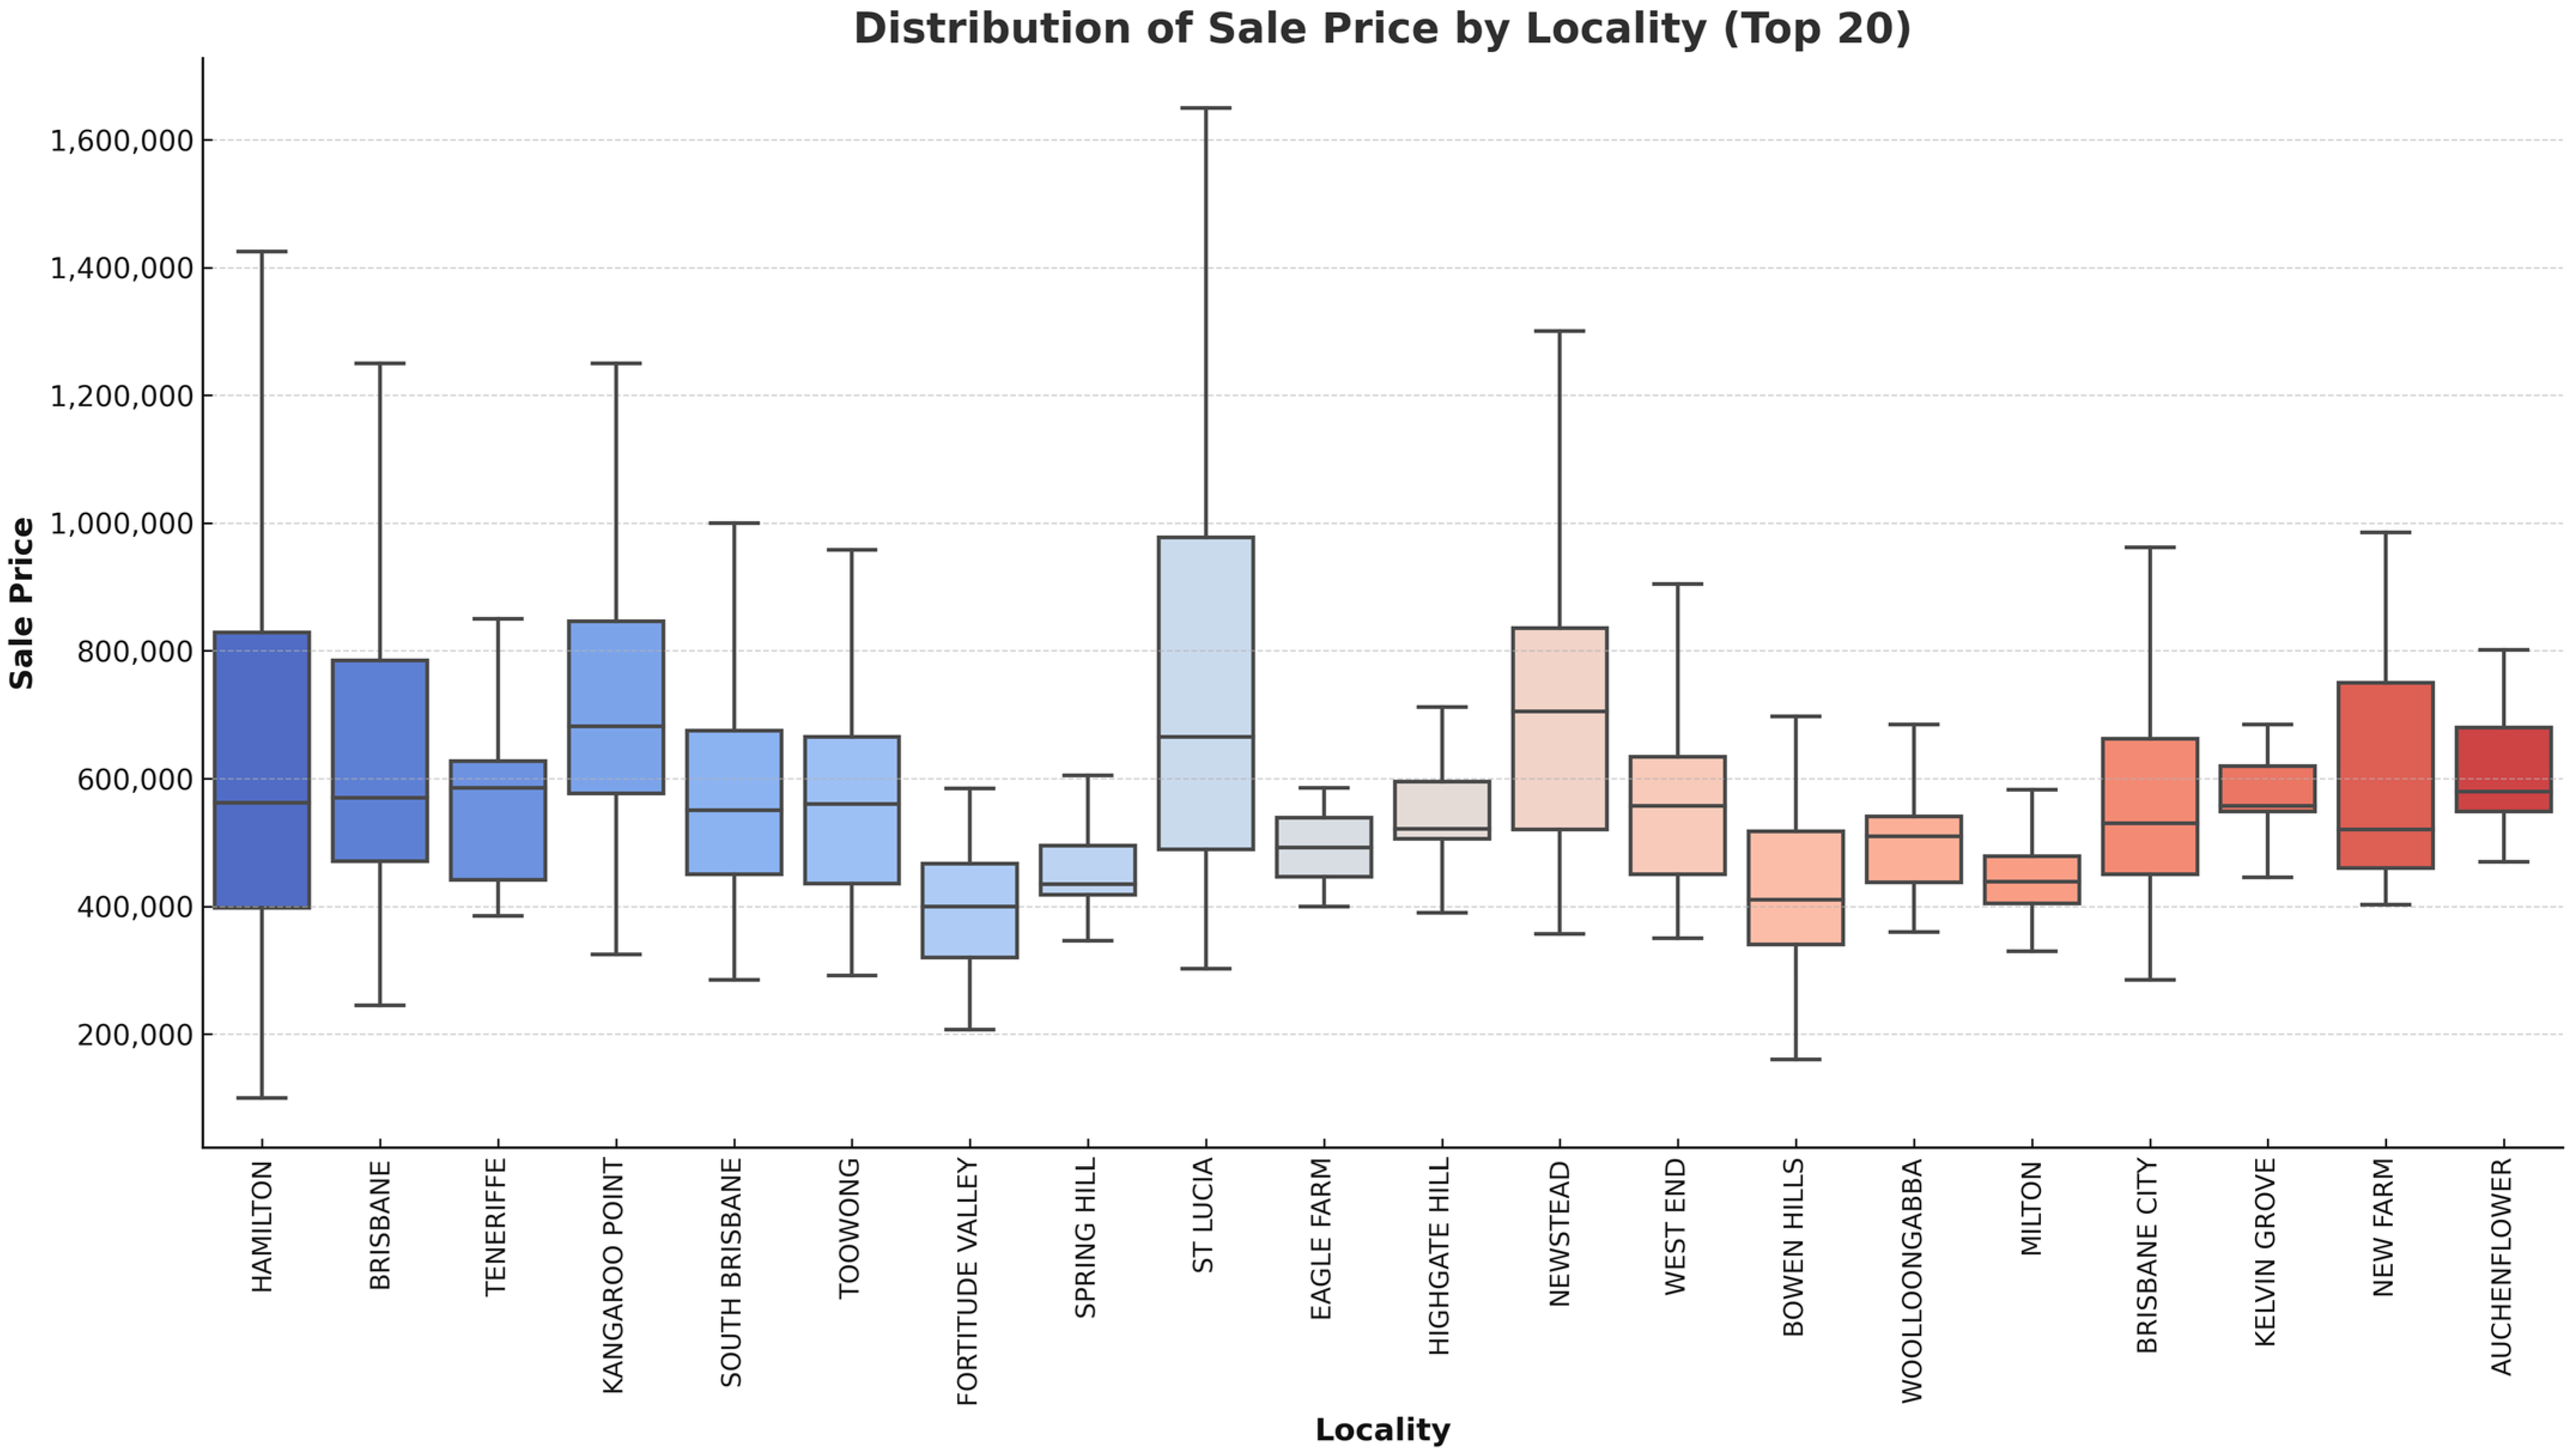
Figure 1 presents the transactional distribution between 2016 and 2022 across the top 20 localities in Brisbane.
Data preprocessing was conducted using a structured approach to ensure dataset robustness and accuracy. Initially, transactions with incomplete or invalid data, such as missing attributes or sale prices that were zero or negative, were excluded.
The dataset was subsequently filtered to include only arm’s length transactions, excluding sales involving related parties or non-market transfers to align with the legal principles of Highest and Best Use and the definition of market value [
44]. Following this refinement, the final sample consisted of 2856 residential property transactions in Brisbane, recorded through to January 2022.
These data challenges are consistent with previous research. For example, Chrostek and Kopczewska [
45] had to discard nearly 90% of their original sample due to missing data, and Cajias and Ertl [
28] reduced the number of hedonic characteristics in their study to mitigate multicollinearity and data loss. Although the data are comprehensive and representative, three key limitations remain. First, the dataset only captures sales reported through the Pricefinder database, potentially omitting unrecorded transactions. Second, detailed property features such as construction quality, renovation history, or energy performance were not available. Third, proximity is measured ‘as the crow flies’ in a straight line rather than actual travel routes or travel time.
Table 2 presents the variables included in the analysis, while
Table 3 details the project timeline and key milestones. The variables are categorised into three groups: property characteristics (structural attributes), location measures (distance-related variables), and project phase indicators (temporal dummies). Key structural variables included property characteristics such as the number of bedrooms, bathrooms, and car parking spaces. Locational proximity was measured using Euclidean distances calculated via geographic information system software, linking property coordinates to the centroids of the three urban megaprojects, namely, Queen’s Wharf Brisbane, Cross River Rail, and Brisbane Live.
3.3. Descriptive Statistics
Table 4 displays the data’s summary statistics. The average sale price was approximately AUD 645,748, with a median of AUD 555,000 and a standard deviation of AUD 362,114, indicating a positively skewed distribution influenced by high-value properties. The typical dwelling featured around two bedrooms, two bathrooms, and one car park, with relatively low variability in these structural attributes. Annual sale volumes ranged from 394 transactions in 2020 to 668 in 2021, with corresponding mean prices showing modest fluctuations across years. The highest mean price occurred in 2019, followed by a dip in 2020, before partially recovering in 2021.
The descriptive statistics table recommended the following treatment methods. We identified the need for a log transformation of the determinant variable due to the dispersion of the variable’s absolute values. Although the Box–Cox method can support a log transformation of the distance variables, we decided not to transform the variables due to ease of interpretation. Outliers were handled using Cook’s distance.
Table 5 reports the Pearson correlation matrix for key variables included in the model. As expected, structural attributes such as the number of bedrooms, bathrooms, and car parks show strong positive correlations with the logarithm of sale price, with coefficients ranging from 0.56 to 0.72, all statistically significant at the 1% level. The distances exhibit relatively weak correlation, with sales prices being generally below 0.11, although they were still statistically significant in some cases, supporting the hypothesis that proximity to megaprojects has a modest influence on property values. As evident from the correlation matrix, the strong inter-variable relationships between the distance variables necessitate careful model specification and diagnostic testing.
3.4. Methodology
The use of hedonic price models in real estate valuation has progressed significantly alongside improvements in empirical modelling techniques and the growing availability of rich datasets. This evolution has led to a variety of model specifications, ranging from traditional parametric forms to more flexible semi-parametric approaches, to enhance the explanatory power. The current scholarly debate has shifted from merely selecting relevant property attributes to addressing issues of model specification and model accuracy [
28,
46]. Ordinary Least Squares (OLS) remains the most widely adopted approach in the empirical estimation of hedonic pricing functions [
3,
4,
47], despite advancements of other models such as Generalised Additive Models (GAMs) [
48,
49,
50,
51]. GAMs offer the advantage of flexibly modelling non-linear relationships; yet, their complexity and limited coefficient interpretability constrain their use in applied valuation contexts. Balancing the advantages and disadvantages of both, we opted to employ an Ordinary Least Squares (OLS) regression model. While Generalised Additive Models (GAMs) provide flexibility in modelling non-linear effects, their complexity and limited interpretability make them less suitable for applied valuation. Further, unlike OLS, GAMs are computationally more demanding and less transparent. Given the large sample size (n = 2856) and the focus on the interpretational power of the results, OLS remains an appropriate method for this analysis, particularly in line with hedonic price modelling practices established by Malpezzi [
3].
The semi-logarithmic hedonic pricing model can be described as follows:
where:
is the natural log of the sale price of the property;
is the constant;
represents the structural characteristics (e.g., bedrooms, bathrooms, and car parks);
represents the temporal fixed effects (e.g., year dummies);
represents the distance measures to each megaproject; and
is the error term.
Coefficient
indicates the marginal percentage change in property prices associated with a one-unit change in proximity to the respective megaproject. Despite its widespread use, OLS carries several limitations, as noted by Zurada et al. [
52], including assumptions of linearity, homoskedasticity, and independence. These assumptions are frequently violated in real estate data, where spatial dependence and heterogeneity are common [
53,
54]. Spatial dependence, as highlighted by Can [
55], arises when property values exhibit clustering due to geographic or market segmentation effects. To mitigate these issues, we implement heteroskedasticity-robust standard errors and conduct diagnostic tests, including the Breusch–Pagan test for heteroskedasticity, the Variance Inflation Factor (VIF) for multicollinearity, and the Ramsey RESET test for model specification. Nevertheless, omitted variable bias remains a challenge when important attributes are not included in the model [
3,
56]. Moreover, the spatial scale and temporal dynamics inherent in real estate markets can have implications for the interpretability of hedonic pricing models [
47,
57,
58]. Given these constraints, researchers have increasingly explored alternatives to OLS, including spatial autoregressive models (SARs) [
55,
59,
60], geographically weighted regression (GWR) [
58,
61], and semi-parametric or non-parametric models such as Generalised Additive Models (GAMs) [
48,
49,
50].
Despite recognised limitations like potential spatial autocorrelation, the choice of the Ordinary Least Squares (OLS) regression methodology is justified by its analytical simplicity, interpretability, and suitability given the large dataset. Robust standard errors were computed to address heteroscedasticity, thus enhancing inference validity. Diagnostic tests, including the Variance Inflation Factors (VIFs) for multicollinearity, the Breusch–Pagan test for heteroscedasticity, and the Ramsey RESET test for model specification, confirmed the model’s appropriateness. However, potential endogeneity in project location choices and the possibility of omitted variables warrant caution when drawing causal inferences from the results.
4. Results
The empirical analysis presents robust evidence for the impact of Brisbane’s urban megaprojects on residential property values, as outlined in
Table 6.
The hedonic pricing model effectively quantified these effects, revealing distinct spatial and temporal patterns. Proximity to the Queen’s Wharf Brisbane (QWB) project exhibited a significant negative coefficient (−0.0374), indicating a premium for properties closer to this mixed-use development. This coefficient implies that a decrease in each unit distance to the QWB is aligned with an approximately 3.17% increase in residential property prices, confirming the hypothesis of intangible value transfer from urban megaprojects. Conversely, proximity to Brisbane Live showed a smaller, yet positive and statistically significant effect (0.0309), suggesting a slightly nuanced market reaction, potentially due to project-specific attributes such as expected entertainment-driven disturbances or differential consumer perceptions regarding residential desirability in this precinct. In contrast, the Cross River Rail proximity coefficient (−0.0118) was not statistically significant, reflecting more subdued impacts from transportation infrastructure alone. Structural property attributes consistently demonstrated strong statistical significance. Specifically, each additional bedroom added approximately 26.49% to property values, and car parks contributed around 19.54%, while additional bathrooms surprisingly showed a positive coefficient (17.16%), likely due to the underlying market segmentation or preferences in apartment configurations. Year-fixed effects revealed temporal fluctuations clearly correlated with project development phases. Notably, relative to 2016, property values faced declines during intensive construction years, with the largest negative impact occurring in 2019 (−8.48%), coinciding with peak excavation and construction activities. Property values generally recovered slightly in subsequent years, reflecting market adaptation and growing recognition of long-term project benefits. Model diagnostics confirmed robustness, with heteroskedasticity adequately addressed via robust standard errors. Variance Inflation Factors (VIFs) were calculated to assess multicollinearity among regressors. The absence of a significant autocorrelation and confirmation of the correct functional form (Ramsey RESET test) further validated the model’s reliability. Overall, the results provide clear empirical evidence that proximity to urban megaprojects significantly enhances residential property values, albeit tempered by short-term disruptions during major construction periods. These findings offer critical quantitative insights for stakeholders involved in property investment, urban planning, and policy formulation.
Figure 2 shows the residuals from the model against fitted values, showing a dispersional cloud around zero. The distribution appears homoscedastic, with residuals showing relatively constant variance across the range of fitted values. No funnel-shaped patterns are observed, supporting the assumption of homoscedasticity. The centred dispersion around the zero line indicates no major functional form misspecification, confirming heteroskedasticity control and validating the model specification. These visual diagnostics support the results from the Breusch–Pagan and RESET tests, confirming the adequacy of the model specification.
5. Discussion
This study adds to the expanding literature on the intersection between urban megaprojects and residential property markets, offering empirical evidence from Brisbane, Australia. The results indicate that spatial proximity to major urban redevelopment initiatives generally exerts a positive influence on residential sale prices, lending support to the hypothesis that megaprojects facilitate the transfer of intangible value to nearby properties. However, the temporal dimension of the analysis reveals a more complex dynamic. Specifically, property values exhibited a relative decline during key construction periods, most notably in 2019. This suggests that short-term negative externalities, including construction-related disturbances, traffic congestion, and noise pollution, can temporarily diminish the perceived desirability of affected locations, offsetting the long-term amenity and prestige gains associated with megaproject completion.
These findings have meaningful implications for stakeholders engaged in urban planning and real estate development. For policymakers, the results indicate the importance of strategic mitigation measures during disruptive phases of project implementation. These may include more transparent communication with the public, careful scheduling of high-impact construction activities, and temporary compensation mechanisms for communities bearing the brunt of transitional disamenities. From the perspective of developers and investors, the evidence highlights the importance of temporal positioning. Investment strategies that account for project timelines and anticipate recovery post-disruption may yield superior returns, particularly in higher-value submarkets where the marginal willingness to pay for location-based attributes is most pronounced.
This study’s methodological rigour enhances the internal validity of the results. Nevertheless, several econometric challenges warrant careful interpretation. Omitted variable bias remains a key concern, as not all property-level attributes, such as build quality, interior condition, or energy efficiency, were available for inclusion. As noted by Hanley and Barbier (2009) [
62], the exclusion of such variables, especially if correlated with the included regressors, risks producing biased and inconsistent coefficient estimates. While the model specification aimed to include all available and relevant predictors, the analysis is inherently limited by the structure of the dataset.
Multicollinearity among the explanatory variables, particularly the spatial distance measures between properties and the multiple megaproject sites, presented additional complexities. Neuger and Susilawati [
5] used the standardisation of the distance variables to address multicollinearity. Given the geographic clustering of megaprojects within Brisbane’s CBD, the associated distance variables were highly intercorrelated, leading to potential instability in the estimation of individual marginal effects. Variance Inflation Factors (VIFs) were used to detect and address this issue by refining the model specification. While all values for primary structural and temporal controls remained within accepted thresholds (VIF < 5), distance variables showed elevated correlations due to the geographic co-location of Brisbane’s megaprojects. This introduces challenges in interpreting marginal distance coefficients in isolation, as each project’s influence may overlap spatially. To address this, the interpretation of the results prioritises the aggregate spatial dynamics rather than over-attributing effects to individual developments.
Moreover, spatial autocorrelation, the tendency for properties within the same neighbourhood to share unobserved characteristics, poses a persistent challenge in property price modelling. While robust standard errors and model diagnostics were applied to mitigate these effects, future studies may benefit from spatial econometric techniques to better capture spatial dependence.
Another layer of complexity arises from market segmentation and varying degrees of willingness to pay across different household and investor profiles. As Hanley and Barbier [
62] discuss, defining an appropriate market scope is nontrivial, where overly broad definitions may mask localised effects, while overly narrow ones may suffer from insufficient statistical power. Therefore, this study focused on mid-to-high-rise apartment sales across a consistent urban geography, but heterogeneity within submarkets remains a potential limitation.
Additionally, data constraints and accessibility continue to hinder real estate scholarship. The commercial and proprietary nature of property transaction databases often restricts access to granular and qualitative information. This challenge is widely acknowledged [
63] and reinforces the importance of collaborative data-sharing arrangements between academia and industry. The dataset used in this study, while comprehensive in terms of transactional records, lacked depth in qualitative housing attributes and relied on straight-line distances rather than network-based travel times, which may influence spatial valuation outcomes.
Furthermore, this study acknowledges the impact of exogenous shocks, particularly the COVID-19 pandemic, which introduced structural breaks in market behaviour. In line with the previous literature [
30], observations from this period were cautiously treated or omitted to prevent distortions in the estimation process.
The research used a quantitative and deductive framework grounded in the revealed preference theory, using a hedonic pricing model. This approach enabled the isolation and quantification of intangible effects attributed to the spatial and temporal proximity of urban megaprojects. While the model offers valuable insights into the interaction between urban development and property markets, the complexity of these systems requires further investigation.
6. Conclusions
This study empirically examined the intangible value transferred from urban megaprojects to surrounding residential property markets in Brisbane, Australia, using hedonic price modelling. The analysis confirms that proximity to significant urban regeneration initiatives, from the Queen’s Wharf Brisbane and the Cross River Rail to Brisbane Live, generally increases sales prices for residential transactions as proxies for property values, thereby supporting the hypothesis that properties closer to these megaprojects attract a price premium.
The key findings reveal notable spatial and temporal dynamics, namely, proximity to urban megaprojects positively impacts property prices, although short-term disruptions during construction phases can temporarily offset these long-term benefits. Specifically, properties closer to the QWB and CRR showed measurable price premiums, highlighting that mixed-use and transportation-focused developments significantly contribute intangible value to surrounding properties.
These findings have considerable implications for stakeholders. Policymakers and urban planners are encouraged to strategically leverage such projects to maximise positive externalities while mitigating temporary negative impacts through coordinated planning and transparent communication with affected communities. Real estate investors and developers can utilise these insights to optimise investment decisions, the timing of property acquisitions, and developments to capitalise on anticipated value uplifts associated with urban megaproject proximity.
This study is subject to four main limitations. First, the analysis was confined to Brisbane, a single city with unique economic and geographic characteristics, hindering the transfer of its findings to other urban contexts. Each city has its own distinct urban morphology, often limiting generalisability to other cities. Future research should expand on this study to triangulate the findings through comparative studies across cities globally with both similar and contrasting macroeconomic and governance structures. Such cross-national comparisons would enrich our understanding of how context-specific dynamics shape the intangible value transfer from urban megaprojects to overall property markets. Second, the relatively short analytical time frame may not fully capture the complete range of post-completion impacts. Third, the use of traditional OLS methods, rather than advanced spatial econometric techniques, implies caution in interpreting causality definitively. Additionally, this study acknowledges potential omitted variable biases due to unavailable qualitative data, such as construction quality, renovation status, or socioeconomic neighbourhood attributes.
Future research could expand by extending analytical time frames to evaluate long-term impacts post-completion. Applying spatial econometric methodologies could enhance the accuracy and reliability of proximity effect estimates. Comparative studies across different urban contexts or project types would further validate the robustness and applicability of these findings. Finally, exploring broader economic impacts such as employment generation, tourism enhancement, and distributional equity in identifying clear beneficiaries and those potentially disadvantaged by urban megaproject developments would provide a richer and policy-relevant narrative. We found that urban megaprojects significantly shape urban property markets, providing substantial intangible value transfers. This research contributes critical empirical insights for enhancing strategic urban planning, real estate investment decision-making, and overall urban regeneration effectiveness.
In conclusion, the interplay between proximity, timing, and perceived value presents a multifaceted relationship that shapes residential market outcomes in areas undergoing large-scale urban transformation. The findings advance scholarly understanding of how intangible benefits and short-term disruptions are capitalised into residential property prices. They also provide practical guidance for policymakers, developers, and investors seeking to optimise the socioeconomic outcomes of urban regeneration initiatives. Future research would benefit from expanded datasets that incorporate qualitative property attributes, the application of spatial econometric models, and comparative analysis across different metropolitan contexts to generalise the observed effects and enhance policy relevance.
Author Contributions
Conceptualisation, M.N. and C.S.; methodology, M.N.; software, M.N.; validation, M.N. and C.S.; formal analysis, M.N.; data curation, M.N.; writing—original draft preparation, M.N.; writing—review and editing, C.S.; visualisation, M.N.; supervision, C.S.; project administration, C.S.; and funding acquisition, C.S. All authors have read and agreed to the published version of the manuscript.
Funding
This research received funding from the Queensland University of Technology PhD Scholarship, QUT Centre for Data Science/Queen’s Wharf Brisbane Scholarship.
Data Availability Statement
The property transaction data used in this study were obtained from Pricefinder, a proprietary source, and are not publicly available. The derived data supporting the findings are available from the authors upon reasonable request.
Acknowledgments
The authors thank the QUT Centre for Data Science for their support and acknowledge the CDS Major Infrastructure Monitoring (MIM) Program.
Conflicts of Interest
The authors declare no conflicts of interest. The funders had no role in the design of this study, the collection, analyses, or interpretation of the data, the writing of the manuscript, or the decision to publish the results.
Abbreviations
The following abbreviations are used in this manuscript:
| QWB | Queen’s Wharf Brisbane |
| CRR | Cross River Rail |
| BL | Brisbane Live |
| VIFs | Variance Inflation Factors |
| WTP | Willingness to Pay |
Appendix A
Figure A1.
Heatmap of residential sales transactions.
Figure A1.
Heatmap of residential sales transactions.
References
- Bienert, S. Grundlagen der Bewertung von Spezial- bzw. Sonderimmobilien. In Bewertung von Spezialimmobilien; Springer Nature: Berlin/Heidelberg, Germany, 2018; pp. 3–18. [Google Scholar] [CrossRef]
- Rosen, S. Hedonic prices and implicit markets: Product differentiation in pure competition. J. Politic. Econ. 1974, 82, 34–55. [Google Scholar] [CrossRef]
- Malpezzi, S. Hedonic Pricing Models: A Selective and Applied Review. In Housing Economics and Public Policy; O’Sullivan, T., Gibb, K., Eds.; Blackwell Science: Oxford, UK, 2002; pp. 67–89. [Google Scholar] [CrossRef]
- Sirmans, G.S.; MacDonald, L.; Macpherson, D.A.; Zietz, E.N. The value of housing characteristics: A meta analysis. J. Real Estate Financ. Econ. 2006, 33, 215–240. [Google Scholar] [CrossRef]
- Neuger, M.; Susilawati, C. Urban Megaprojects from Isolation to Integration: A Property Market Perspective on Flagship Buildings. Buildings 2025, 15, 1156. [Google Scholar] [CrossRef]
- Expósito, A.; Espinosa, M.; Villa-Damas, A. Valuing Visitor Willingness to Pay for Urban Green Space Conservation: Case of Maria Luisa Park in Seville, Spain. J. Urban Plan. Dev. 2021, 147, 5021020. [Google Scholar] [CrossRef]
- Tameko, A.M.; Ndjanyou, L. The willingness to pay for urban parks’ amenities: The economic value of “Bois Sainte Anastasie” in Yaoundé, Cameroon. Int. J. Sustain. Dev. 2020, 23, 48–68. [Google Scholar] [CrossRef]
- Liebe, U.; Preisendörfer, P. Zahlungsbereitschaft für kollektive Umweltgüter: Theoretische Grundlagen und empirische Analysen am Fallbeispiel der Wertschätzung biologischer Vielfalt im Wald/Willingness to Pay for Collective Environmental Goods: Theoretical Foundations and Empirical Analyses Using the Example of Biodiversity in Forests. Z. Soziologie 2007, 36, 326. [Google Scholar] [CrossRef]
- Blake, A.; Eves, C. Assessment of the application of contingent valuation theory to bio-sequestered carbon. In Proceedings of the 6th International Real Estate Research Symposium 2012, Institut Penilaian Negara (INSPEN), Kuala Lumpur, Putrajaya, Malaysia, 24–25 April 2012; Available online: https://eprints.qut.edu.au/58915/ (accessed on 1 April 2023).
- Carson, R.T.; Wilks, L.; Imber, D. Valuing the Preservation of Australia’s Kakadu Conservation Zone. Oxf. Econ. Pap. 1994, 46 (Suppl. S1), 727–749. [Google Scholar] [CrossRef]
- Shen, Z.; Wakita, K.; Oishi, T.; Yagi, N.; Kurokura, H.; Blasiak, R.; Furuya, K. Willingness to pay for ecosystem services of open oceans by choice-based conjoint analysis: A case study of Japanese residents. Ocean Coast. Manag. 2015, 103, 1–8. [Google Scholar] [CrossRef]
- Matthew, N.K.; Shuib, A.; Ramachandan, S.; Mohammad-Afandi, S.H. Economic Valuation using Travel Cost Method (TCM) in Kilim karst Geoforst Park, Langkawi, Malaysia. J. Trop. For. Sci. 2019, 31, 78–89. Available online: https://www.jstor.org/stable/26565762 (accessed on 1 March 2024).
- Bateman, I.J.; Carson, R.T.; Day, B.; Hanemann, M.; Hanley, N.; Hett, T.; Jones-Lee, M.; Loomes, G.; Mourato, S.; Özdemiroglu, E.; et al. Economic Valuation with Stated Preference Techniques: A manual; Edward Elgar Publishing Limited: Cheltenham, UK, 2002; ISBN 1-84064-919-4. [Google Scholar]
- Bienert, S.; Cajias, M.; Hirsch, J. Bewertung des kirchlichen Immobilienbestandes Besonderheiten immaterieller Werte bei der Bewertung von Sakralbauten im Lichte der Nachhaltigkeit. In ESWiD Evangelischer Bundesverband für Immobilienwesen in Wissenschaft und Praxis, Bewertung des Kirchlichen Immobilienbestandes, 1st ed.; Nomos-Verlag: Baden-Baden, Germany, 2016. [Google Scholar] [CrossRef]
- Searle, G.; Legacy, C. Australian Mega Transport Business Cases: Missing Costs and Benefits. Urban Policy Res. 2019, 37, 458–473. [Google Scholar] [CrossRef]
- Ridker, R.G.; Henning, J.A. The Determinants of Residential Property Values with Special Reference to Air. Rev. Econ. Stat. 1967, 49, 246–257. Available online: http://www.jstor.org/stable/1928231 (accessed on 1 March 2024). [CrossRef]
- Leggett, C.; Bockstael, N.E. Evidence of the Effects of Water Quality on Residential Land Prices. In Proceedings of the Annual Meeting of the American Agricultural Economics Association 1998, Salt Lake City, UT, USA, 2–5 August 1998; pp. 1–24. [Google Scholar]
- Jayasekare, A.S.; Herath, S.; Wickramasuriya, R.; Perez, P. The price of a view: Estimating the impact of view on house prices. Pac. Rim Prop. Res. J. 2019, 25, 141–158. [Google Scholar] [CrossRef]
- Cervero, R.; Duncan, M. Transit’s value-added effects: Light and commuter rail services and commercial land values. Transp. Res. Rec. 2002, 1805, 8–15. [Google Scholar] [CrossRef]
- Dubé, J.; Thériault, M.; Des Rosiers, F. Commuter rail accessibility and house values: The case of the Montreal South Shore, Canada 1992–2009. Transp. Res. Part A Policy Pract. 2013, 54, 49–66. [Google Scholar] [CrossRef]
- Haninger, K.; Ma, L.; Timmins, C. The Value of Brownfield Remediation. J. Assoc. Environ. Resour. Econ. 2017, 4, 197–241. [Google Scholar] [CrossRef]
- Herath, S.; Maier, G. The Hedonic Price Method in Real Estate and Housing Market Research. A Review of the Literature; SRE Discussion Papers Series 2010/03; WU Vienna University of Economics and Business: Vienna, Austria, 2010; p. 22. Available online: http://epub.wu.ac.at/2792/ (accessed on 1 March 2024).
- Cottafava, D.; Corazza, L.; Shams Esfandabadi, Z.; Torchia, D. Megaprojects from the lens of business and management studies: A systematic literature review. J. Public Aff. 2024, 24, e2937. [Google Scholar] [CrossRef]
- McDonald, J.F.; McMillen, D.P. Urban Economics and Real Estate: Theory and Policy, 2nd ed.; Wiley: Hoboken, NJ, USA, 2011. [Google Scholar]
- Alonso, W. Agricultural Rent Functions and Bid Price Curves of the Urban Firm. In Location and Land Use: Toward a General Theory of Land Rent; Harvard University Pres Cambridge: London, UK, 1964; pp. 36–58. [Google Scholar] [CrossRef]
- Mills, E.S. An aggregative model of resource allocation in a metropolitan area. Am. Econ. Rev. 1967, 57, 197–210. Available online: https://www.jstor.org/stable/1821621 (accessed on 1 March 2024).
- Muth, R.F. Cities and Housing. The Spatial Pattern of Urban Residential Land Use. The University of Chicago Press: Chicago, IL, USA; London, UK, 1969; Volume XXII, pp. 90, 355. [Google Scholar]
- Cajias, M.; Ertl, S. Spatial effects and non-linearity in hedonic modeling: Will large data sets change our assumptions? J. Prop. Invest. Financ. 2018, 36, 32–49. [Google Scholar] [CrossRef]
- Abidoye, R.B.; Fam, F.; Oshodi, S.O.; Oyetunji, K.A. Impact of light rail line on residential property values-a case of Sydney, Australia. Int. J. Hous. Mark. Anal. 2022, 15, 691–708. [Google Scholar] [CrossRef]
- Herath, S.; Jayasekare, A.S. City proximity, travel modes and house prices: The three cities in Sydney. J. Hous. Built Environ. 2021, 36, 407–431. [Google Scholar] [CrossRef]
- Zegras, C. Metropolitan Governance for Sustainable Mobility. 2017. Available online: https://www.researchgate.net/publication/322328623 (accessed on 1 March 2024).
- Ponzini, D. Large scale development projects and star architecture in the absence of democratic politics: The case of Abu Dhabi, UAE. Cities 2011, 28, 251–259. [Google Scholar] [CrossRef]
- Sklair, L. The Icon Project: Architecture, Cities, and Capitalist Globalization; Oxford University Press: Oxford, UK, 2017. [Google Scholar]
- Fainstein, S.S. Mega-projects in New York, London and Amsterdam. Int. J. Urban Reg. Res. 2008, 32, 768–785. [Google Scholar] [CrossRef]
- Flyvbjerg, B.; Bester, D.W. The cost-benefit fallacy: Why cost-benefit analysis is broken and how to fix it. J. Benefit-Cost Anal. 2021, 12, 395–419. [Google Scholar] [CrossRef]
- Flyvbjerg, B. What you should know about megaprojects and why: An overview. Proj. Manag. J. 2014, 45, 6–19. [Google Scholar] [CrossRef]
- Love, P.E.D.; Ahiaga-Dagbui, D.D. Debunking fake news in a post-truth era: The plausible untruths of cost underestimation in transport infrastructure projects. Transp. Res. Part A Policy Pract. 2018, 113, 357–368. [Google Scholar] [CrossRef]
- DBC. Queens Wharf Brisbane. 2021. Available online: https://queenswharfbrisbane.com.au/ (accessed on 25 February 2024).
- Building Queensland. Cross River Rail Business Case. 2017. Available online: https://cabinet.qld.gov.au/documents/2017/Aug/CRRBusCase/Attachments/BusinessCase.pdf (accessed on 25 February 2024).
- Cross River Rail Delivery Authority. 2024. Available online: https://crossriverrail.qld.gov.au/ (accessed on 25 February 2024).
- DoTMR—Brisbane Cross River Rail—Queensland—Project Profile. London: GlobalData plc. 2018. Available online: https://www.proquest.com/reports/dotmr-brisbane-cross-river-rail-queensland/docview/2069450125/se-2 (accessed on 25 February 2024).
- AEG—Brisbane Live Entertainment Precint—Queensland—Project Profile. London: GlobalData plc. 2018. Available online: https://www.proquest.com/reports/aeg-brisbane-live-entertainment-precint/docview/1999156430/se-2 (accessed on 25 February 2024).
- Brisbane Development. 2024. Available online: https://brisbanedevelopment.com/brisbane-live/ (accessed on 25 February 2024).
- Australian Property Institute (API). Definitions. 2024. Available online: https://www.api.org.au/standards/definitions/ (accessed on 25 February 2024).
- Chrostek, K.; Kopczewska, K. Spatial prediction models for real estate market analysis. Ekonomia 2013, 35, 25–43. [Google Scholar] [CrossRef]
- Cajias, M. Is there room for another hedonic model?: The advantages of the GAMLSS approach in real estate research. J. Eur. Real Estate Res. 2018, 11, 204–245. [Google Scholar] [CrossRef]
- Sirmans, S.; Macpherson, D.; Zietz, E. The Composition of Hedonic Pricing Models. J. Real Estate Lit. 2005, 13, 1–44. [Google Scholar] [CrossRef]
- Brunauer, W.A.; Lang, S.; Wechselberger, P.; Bienert, S. Additive hedonic regression models with spatial scaling factors: An application for rents in Vienna. J. Real Estate Financ. Econ. 2010, 41, 390–411. [Google Scholar] [CrossRef]
- Mason, C.; Quigley, J.M. Non-parametric hedonic house prices. Hous. Stud. 1996, 11, 373–386. [Google Scholar] [CrossRef]
- Pace, K. Appraisal Using Generalized Additive Models. J. Real Estate Res. 1998, 15, 77–99. [Google Scholar] [CrossRef]
- Bourassa, S.; Cantoni, E.; Hoesli, M. Predicting house prices with spatial dependence: A comparison of alternative methods. J. Real Estate Res. 2010, 32, 139–160. [Google Scholar] [CrossRef]
- Zurada, J.; Levitan, A.; Guan, J. Non-Conventional Approaches to Property Value Assessment. J. Appl. Bus. Res. 2006, 22, 1421. [Google Scholar] [CrossRef]
- Anselin, L. Spatial Econometrics: Methods and Models; Springer: Dordrecht, The Netherlands, 1998. [Google Scholar] [CrossRef]
- Basu, S.; Thibodeau, T.G. Analysis of Spatial Autocorrelation in House Prices. J. Real Estate Financ. Econ. 1998, 17, 61–85. [Google Scholar] [CrossRef]
- Can, A. Specification and estimation of hedonic housing price models. Reg. Sci. Urban Econ. 1992, 22, 453–474. [Google Scholar] [CrossRef]
- Kuminoff, N.V.; Parmeter, C.F.; Pope, J.C. Which hedonic models can we trust to recover the marginal willingness to pay for environmental amenities? J. Environ. Econ. Manag. 2010, 60, 145–160. [Google Scholar] [CrossRef]
- Bouchouicha, R.; Ftiti, Z. Real Estate Markets and the Macroeconomy: A Dynamic Coherence Framework. Econ. Model. 2012, 29, 1820–1829. [Google Scholar] [CrossRef]
- Brunsdon, C.; Fotheringham, A.S.; Charlton, M. Geographically weighted summary statistics—A framework for localised exploratory data analysis. Computers. Environ. Urban Syst. 2002, 26, 501–524. [Google Scholar] [CrossRef]
- Bourassa, S.C.; Cantoni, E.; Hoesli, M. Spatial Dependence, Housing Submarkets, and House Price Prediction. J. Real Estate Financ. Econ. 2007, 35, 143–160. [Google Scholar] [CrossRef]
- Pace, R.K.; Gilley, O.W. Using the Spatial Configuration of the Data to Improve Estimation. J. Real Estate Financ. Econ. 1997, 14, 333–340. [Google Scholar] [CrossRef]
- Brunsdon, C.; Fotheringham, A.S.; Charlton, M.E. Geographically Weighted Regression: A Method for Exploring Spatial Nonstationarity. Geogr. Anal. 1996, 28, 281–298. [Google Scholar] [CrossRef]
- Hanley, N.; Barbier, E.B. Pricing Nature: Cost-Benefit Analysis and Environmental Policy; Edward Elgar: Cheltenham, UK, 2009. [Google Scholar]
- McAllister, P.; Nanda, A. Does Real Estate Defy Gravity? An Analysis of Foreign Real Estate Investment Flows. Rev. Int. Econ. 2016, 24, 924–948. [Google Scholar] [CrossRef]
| Disclaimer/Publisher’s Note: The statements, opinions and data contained in all publications are solely those of the individual author(s) and contributor(s) and not of MDPI and/or the editor(s). MDPI and/or the editor(s) disclaim responsibility for any injury to people or property resulting from any ideas, methods, instructions or products referred to in the content. |
© 2025 by the authors. Licensee MDPI, Basel, Switzerland. This article is an open access article distributed under the terms and conditions of the Creative Commons Attribution (CC BY) license (https://creativecommons.org/licenses/by/4.0/).


