1. Introduction
Artificial lighting systems play a crucial role in optimizing visual needs and influencing human behavior within built environments. Their advantages are evident, but precise control is necessary to ensure suitability for workspaces. Maintaining appropriate luminance relationships and variations within defined thresholds is essential for effective indoor lighting design. Beyond achieving the required illuminance levels, it is imperative to address visual performance criteria that enhance user experience. Properly designed lighting should facilitate task execution while promoting visual comfort and well-being, ultimately contributing to productivity, safety, and risk reduction. The key determinants of an optimal luminous environment include luminance distribution, illuminance uniformity, glare mitigation, light directionality, spectral characteristics within the visual field, and the physiological and psychological effects of light exposure [
1,
2,
3]. In this context, the standard for workplace lighting, part 1 (indoor workplaces), UNE-EN-ISO 12464-1:2022 [
4], sets the criteria for the quality and quantity of artificial lighting in various environments.
Another important aspect is the color appearance of light, determined by the correlated color temperature (CCT), which has both a physical and a psychological or aesthetic dimension. The ANSI/IES TM-30-24 Technical Memorandum of the Illuminating Engineering Society [
5] has been incorporated into various fields of industry and research to evaluate the colorimetric performance of light. Accurate calculation of these metrics requires considering multiple factors, including the spectral power distribution (SPD) of the light source.
Traditionally, lighting design and planning have focused solely on meeting visual needs. However, in recent decades, research has demonstrated that light influences human psychological and physiological responses beyond image formation and vision. Human physiology and behavior are governed by circadian rhythms, which synchronize with the 24 h solar cycle through the circadian clock located in the suprachiasmatic nucleus (SCN) of the hypothalamus. The SCN receives environmental light information through the retinohypothalamic tract (RHT), aligning internal biological time with the external light-dark cycle. This synchronization underlies various physiological processes, such as hormonal secretion, body temperature regulation, and cognitive performance. Even in the absence of external stimuli, light affects melatonin production, alertness, and cognitive functions, collectively known as the non-visual effects of light [
6,
7]. The retina contains five types of photoreceptors, each with distinct roles in visual and non-visual functions. Rods and cones are responsible for image-forming vision. Rods operate under low light levels (scotopic vision), while cones, including the S, M, and L subtypes, mediate photopic vision and color perception. Non-image-forming (NIF) effects of light are primarily mediated by intrinsically photosensitive retinal ganglion cells (ipRGCs), which express the photopigment melanopsin and respond maximally to short-wavelength blue light [
8,
9]. Their photosensitivity, driven by melanopsin, exhibits a peak sensitivity of 480 nm and encodes ambient light intensity independently of rods and cones [
10,
11].
IpRGCs play a crucial role in light-induced melatonin suppression during the biological night, emphasizing their importance in NIF processes such as circadian rhythm regulation, the pupillary light reflex (PLR), and the modulation of sleep, mood, concentration, and alertness [
12]. Disruptions in light exposure, particularly at night, can desynchronize circadian rhythms, as seen in shift work, jet lag, and prolonged nighttime light exposure, leading to delayed sleep onset and suppressed drowsiness [
10,
11,
12]. These effects vary significantly among individuals, influenced by factors such as timing, intensity, wavelength, and prior light exposure history [
13,
14,
15]. Optimizing light exposure is essential to maximize health benefits and mitigate adverse effects on circadian health [
16]. Advances in physiology have transformed our understanding of retinal structure and neural connections. While classical visual photoreceptors, such as rods and cones, have been extensively studied, ipRGCs have emerged as a significant discovery [
8,
17]. Individual differences in NIF effects of light via ipRGCs are determined by age, health, sensitivity, and light characteristics. The international standard CIE S 026/E:2018 has marked a key advancement by defining spectral weighting functions for cones, rods, and melanopsin, standardizing light measurement for NIF effects [
18]. This milestone supports mechanistic models of circadian and neuroendocrine phototransduction, enabling the development of consensus-based guidelines to optimize light exposure and improve sleep, alertness, cognitive processes, and overall health [
16]. To properly address both visual and non-visual requirements, it is important to distinguish between horizontal and vertical illuminance. Horizontal illuminance (
Eh) supports visual task performance on desks, while vertical illuminance (
Ev) at eye level is more relevant for circadian stimulation, as it directly affects the amount of light reaching the eye and stimulates ipRGCs, serving as the basis for calculating melanopic equivalent daylight illuminance (mEDI), in accordance with CIE S 026/E:2018 [
18].
The main objective of this study is to analyze the lighting conditions of a classroom, considering specific artificial lighting requirements for task performance in that environment, aiming to achieve optimal photopic and melanopic lighting conditions. To this end, three luminaires with different luminous intensity distribution curves are designed; additionally, an analysis of requirements according to the type of activity in the area is conducted, along with a review of additional recommendations relevant to vision and occupant well-being. These recommendations are linked to photobiological properties, such as light spectrum and intensity, considering both Eh on the work plane and the CIE recommendations for adequate corneal illuminance, Ev.
2. Theoretical Foundation of Circadian Lighting
In this section, the fundamental expressions necessary for developing lighting projects are clearly and concisely presented, considering both photopic and melanopic pathways. The proposed method is calculated based on the traditional relationship between radiometric and photometric quantities, as well as current standards. To establish a complete analogy between the photopic and melanopic components, the value of K
melanopic must be defined. This factor is determined according to the normalizations imposed by various standards and the mEDI defined by the CIE standard [
18,
19,
20], which proposes normalization based on the melanopic illuminance provided by the standard illuminant D65 (daylight with CCT = 6500 K). A D65-type light source provides a photopic illuminance E
photopic,D65 to achieve the same melanopic illuminance E
melanopic,D65. The photometric quantity is defined as E
photopic,D65 = K
m · E
e,photopic,D65. Similarly, for the melanopic component, E
melanopic,D65 = K
melanopic,D65 · E
e,melanopic,D65. Then, for a D65 light source, the relationship between photopic and melanopic illuminance can be expressed as E
photopic,D65 = E
melanopic,D65. Additionally, the relationship between mEDI and E
photopic is derived considering the Melanopic Action Factor (MAF) as mEDI = 1.104 · MAF · E
photopic, as previously described [
21].
3. Materials and Methods
This section outlines the various steps in the procedure carried out for the design of luminaires and the study environment.
3.1. Luminaires Design
To achieve integrative lighting, it is necessary to combine artificial light, making luminaire design a key aspect of the lighting project. Luminaires are lighting components responsible for distributing the luminous emissions from lamps, adapting them to the area to be illuminated. They also house the lamps and the auxiliary electrical equipment required for their operation. Luminaires can be classified based on various characteristics, including the distribution of luminous flux and the percentage of total luminous flux distributed above and below the horizontal axis of the luminaire; luminaires with a direct component are further subdivided according to the beam width they provide, illuminating larger or smaller surfaces [
22]. In this study, three direct-flow luminaires were designed, but with different distribution patterns due to variations in the reflectance and transmittance of the materials used in the reflector’s manufacturing. The profiles of the reflector and diffuser, combined with the reflective and/or transmissive properties of the materials used, determine the shape of the spatial intensity distribution curves [
23,
24,
25]. Luminaires with narrower light distribution patterns tend to direct more light toward horizontal surfaces, typically resulting in higher
Eh and lower
Ev, while those with broader distribution patterns contribute to a more balanced vertical and horizontal illuminance, thereby supporting higher
Ev/
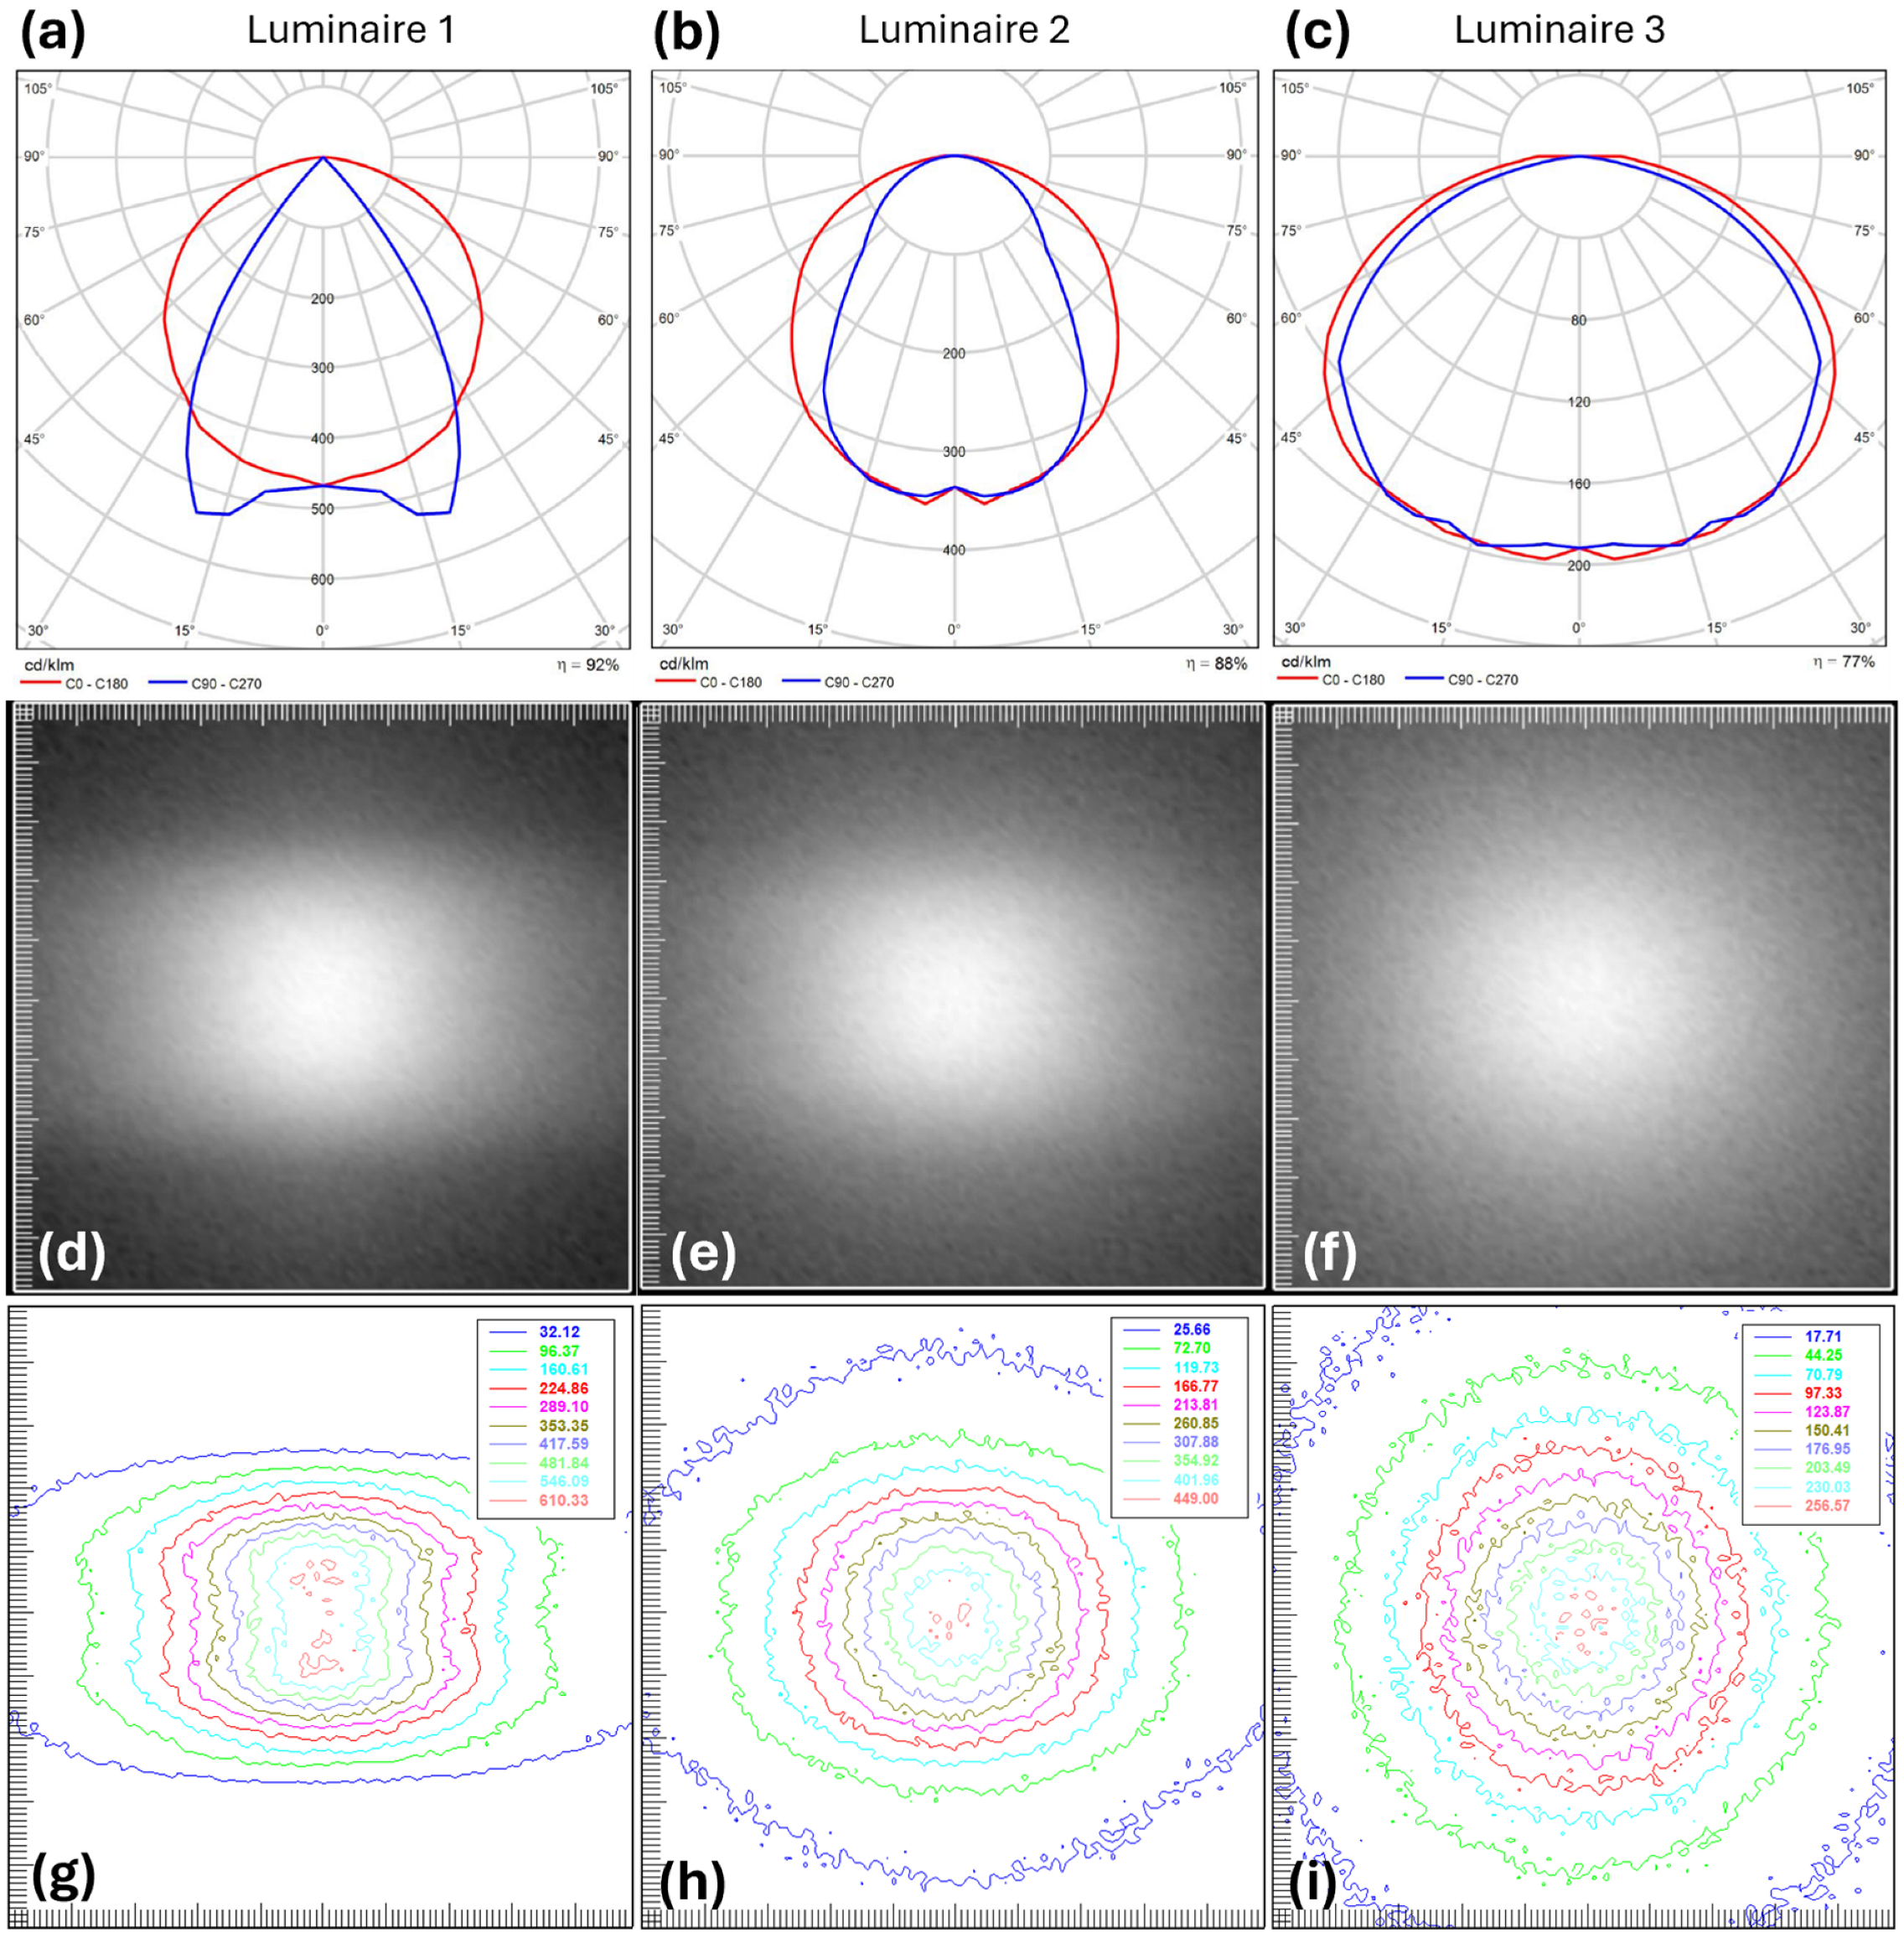
Eh ratios and enhancing melanopic stimulation at the corneal plane. Due to the different materials used, the spatial intensity distribution curves will also differ, making it useful to characterize them [
26]. The chosen representation demonstrates how light is distributed in different directions in space based on photometric C-planes, which are vertical sections around the luminaire, considering transversal (C0°–C180°) and longitudinal (C90°–C270°) [
27]. The luminaire designs were created using Photopia software (v2023.1, LTI Optics, LLC, Boulder, CO, USA, 2023). This software was chosen due to its ability to accurately model and analyze photometric performance using advanced ray-tracing techniques. The goal was to design three luminaires with a common reflector profile but modify the manufacturing materials to obtain three different photometric curves, leading to varied results. In this project, the base luminaire consists of four T8 lamps of 32 W, 2900 lm, selected from the software library, with a reflector producing a medium-width light beam.
The reflector is the component that shapes the luminous flux distribution in the luminaire. The chosen design method was a segment defining the shape as an ‘Extruded Symmetric Polyline’ curve, ensuring that this two-dimensional shape extends symmetrically along the axis, balancing both sides with a parabolic-type reflector created due to its ability to direct light with high precision. The same common reflector was used for all three luminaires; however, the selection of materials was also crucial. Therefore, it was necessary to determine the reflectance and transmittance properties of the materials, particularly for the diffuser, as diffusing materials play a key role in shaping the luminous intensity distribution curves and reducing glare. The Unified Glare Rating (UGR) was evaluated in the next step through simulations performed in DIALux, considering these material properties along with the spatial distribution of light, luminaire placement, observer position, and room characteristics, ensuring a comprehensive approach to glare control and visual comfort. Finally, the luminaire analysis was conducted by performing simulations using the Monte Carlo ray-tracing method, which tracks the path of light rays from the source to the reflector and then from the reflector into the space. This approach determined the luminous intensity distribution curve for each selected luminaire to evaluate their different behavior [
25,
28,
29,
30].
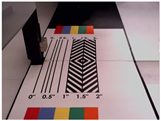
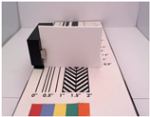
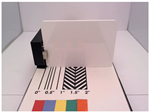
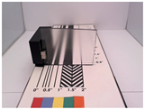
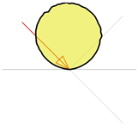
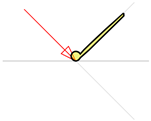
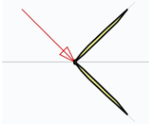
Following this process, the three luminaires in this study were designed. Their characterization was based on the optical properties of the materials, enabling a comparison of these characteristics (
Table 1,
Figure 1).
Luminaire 1: The reflector material is specular aluminum with a dielectric coating, designated as Miro 4 in the software library, with a reflectance of 95% and a mirror-like appearance. This design makes it the most efficient in terms of performance and luminous efficacy.
Luminaire 2: The reflector material is hammered aluminum, designated as PMR 15, with a reflectance of 96%. Due to its surface properties, it reflects light diffusely, scattering it in all directions.
Luminaire 3: The reflector material is high-gloss white aluminum (496 HG), designated as 496 HG, with a reflectance of 95%. Additionally, a diffuser material (A8 Frost) with a transmittance of 64% was incorporated. Despite having an efficient reflector, the addition of the A8 Frost diffuser reduces the efficiency of Luminaire 3 compared to the other two, resulting in lower performance. However, it provides a more diffuse light distribution on the work plane.
The three luminaires were designed using distinct combinations of reflector and diffuser materials to achieve different spatial light distributions and optimize both visual and non-visual lighting performance. Luminaire 1 employed specular aluminum with a dielectric coating (Miro 4), which provides highly directional reflection with minimal scattering, concentrating light on horizontal surfaces and resulting in lower vertical illuminance. Luminaire 2 utilized hammered aluminum (PMR 15), characterized by a textured, diffuse-reflecting surface that redistributes light more uniformly and increases vertical illumination. Luminaire 3 combined high-gloss white aluminum (496 HG) with a micro-prismatic diffuser (A8 Frost), achieving the most uniform luminous distribution and minimizing glare, thus enhancing user comfort, and promoting a favorable Ev/Eh (vertical/horizontal illuminance ratio).
Importantly, while these reflector and diffuser materials significantly affect the spatial distribution of light, they do not substantially modify the SPD of the lamps housed within them, in this case, LED sources. Metallic reflectors like specular and hammered aluminum are spectrally neutral in the visible range, they reflect all wavelengths similarly without selective absorption. Diffusers such as the A8 Frost, while introducing scattering, also have minimal spectral selectivity, particularly in high-quality acrylic materials. As such, the SPD measured at the source remains largely unchanged when emitted into space, although minor spectral shifts (e.g., slight attenuation of short wavelengths) can occur due to scattering or absorption in thicker or tinted diffusers.
3.2. Room Design and Experimental Setup
The lighting simulations were conducted in DiaLux.EVO 12.1. (DIAL GmbH, Lüdenscheid, Germany, 2023), the software used to create a three-dimensional (3D) model of a classroom, following standard practices (UNE-EN-ISO 12464-1:2022) regarding measurement planes [
4]. This program allows for the creation of rooms with their corresponding furniture and enables the planning, calculation, and visualization of indoor lighting for any type of light source. It is also possible to control the reflection (or transmission) values of the objects, walls, ceiling, and floor. The DiaLux.EVO 12.1 software was used to create the study room, where all simulations with the designed luminaires were conducted (
Figure 2). The room, measuring 17.6 m × 13.6 m × 3.0 m, was designed as a large classroom to better analyze the impact of artificial lighting. It features a ceiling reflectance of 0.7, a wall reflectance of 0.5, and a floor reflectance of 0.3. The classroom contains 30 tables arranged in 6 rows of 5, each with two chairs, all oriented toward the blackboard and the teacher’s desk at the front. Five windows, each 1.2 m × 1.8 m, are positioned on the same wall at a height of 1 m, with transparent glass of 0.9 transmittance. Artificial lighting is provided by 35 symmetrical and evenly distributed luminaires. To assess lighting conditions, 18 measurement points were placed throughout the classroom at 0.80 m for
Eh, corresponding to the typical desk height, and 1.20 m for
Ev, corresponding to the average corneal height of seated students, i.e., standard eye level with a straight-ahead gaze. These planes were chosen to reflect the most relevant areas for visual performance and circadian stimulation, respectively.
Three simulations were carried out for the same classroom.
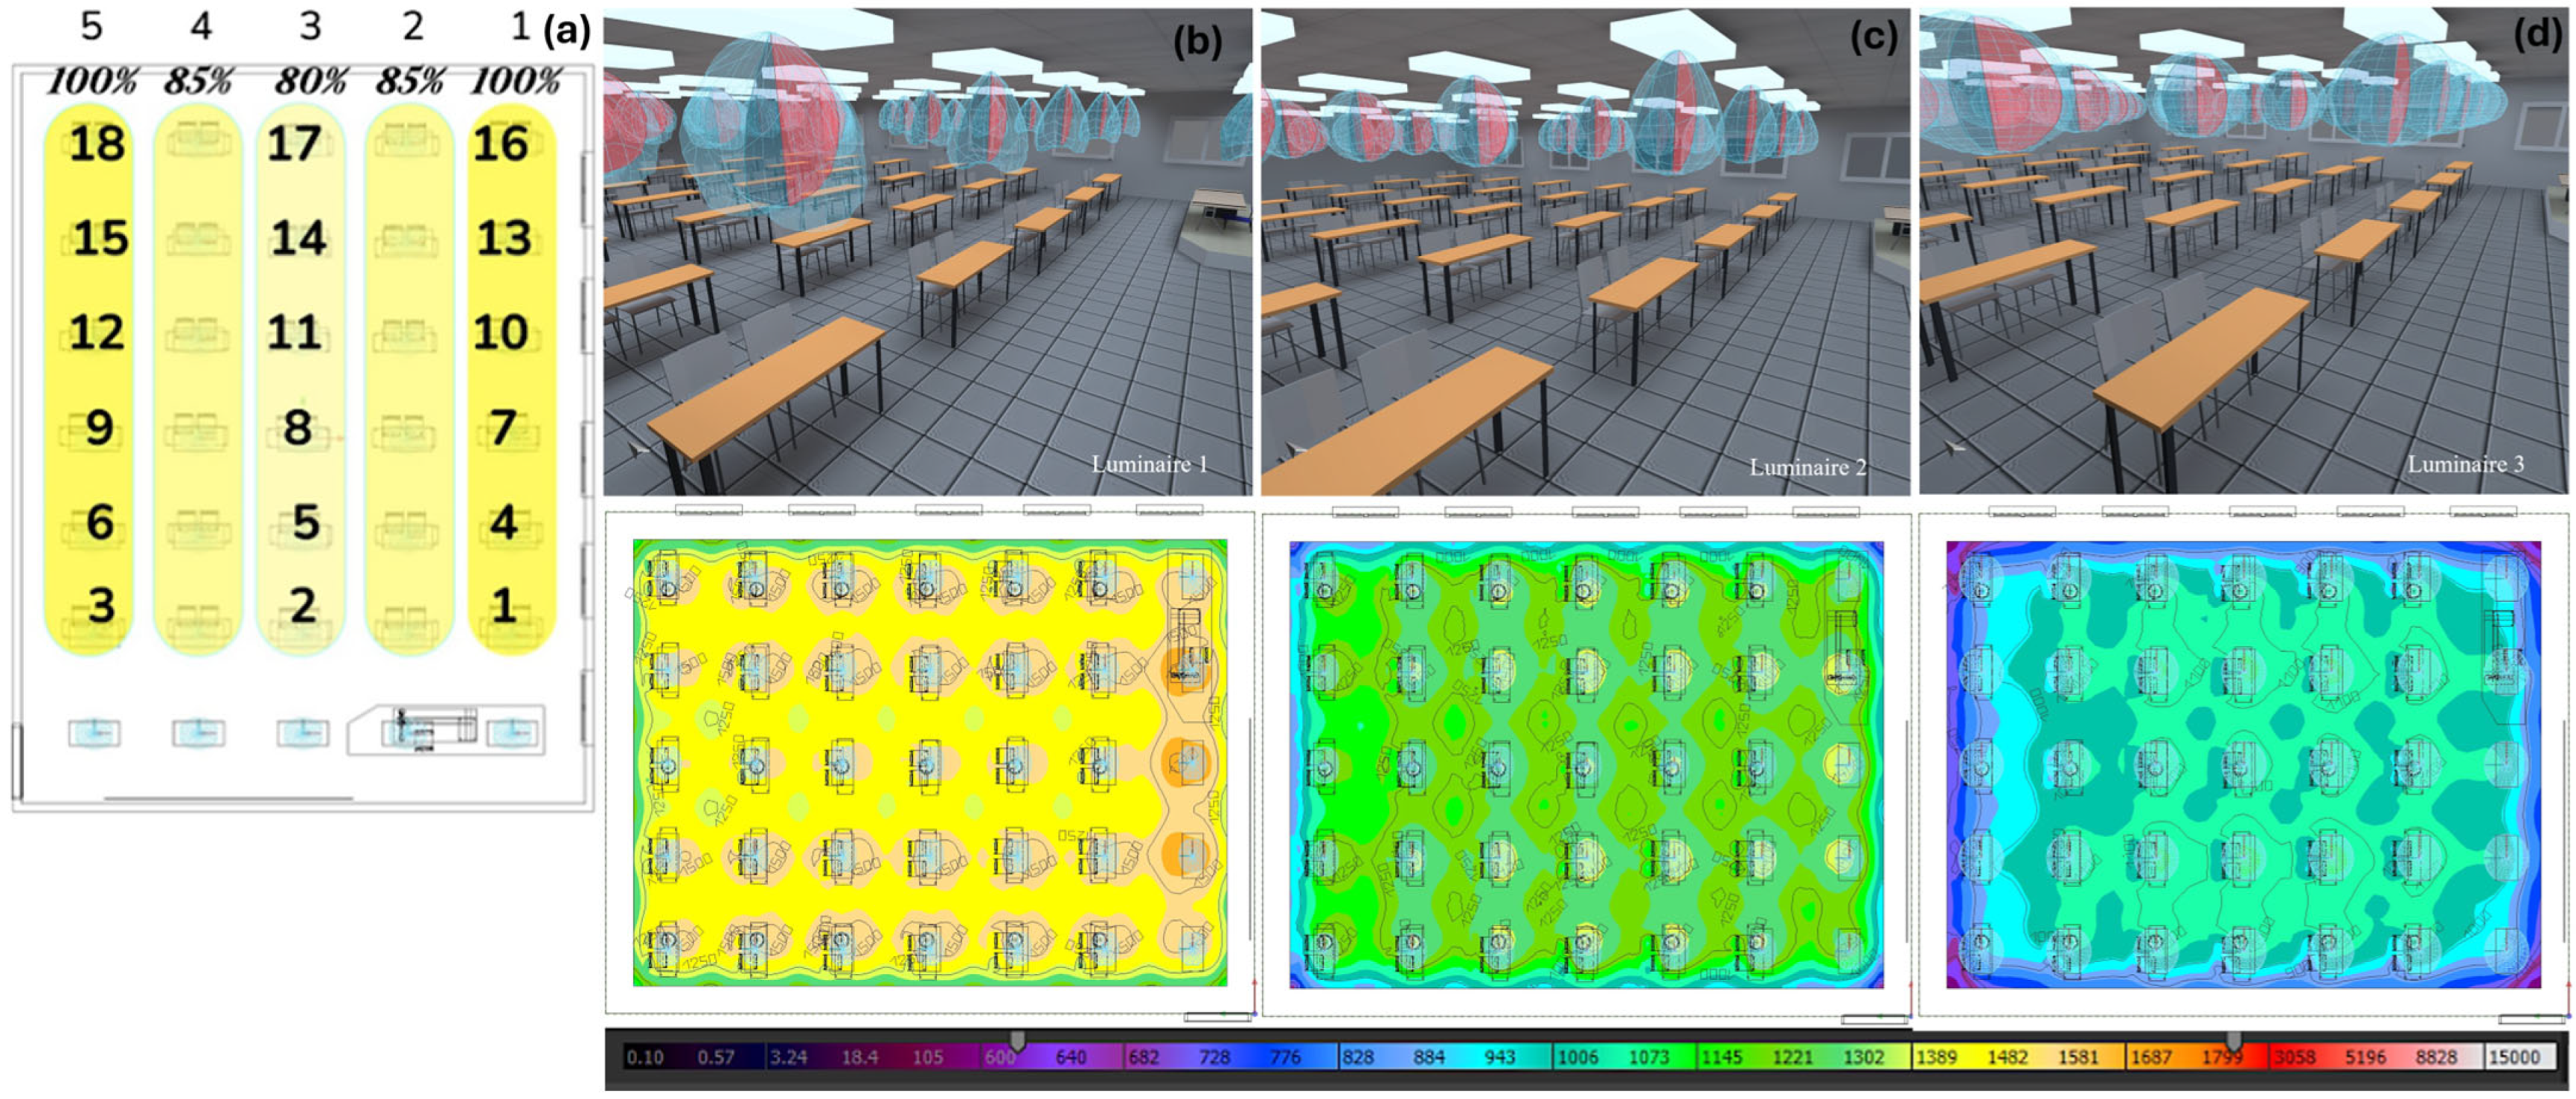
Figure 2a provides a front view of the classroom, with windows located to the right. It was determined that an artificial lighting control system was necessary for all scenarios; this system operates with five control groups, organized according to the luminaires arranged in parallel to the windows. In this system (illustrated in
Figure 2a), the luminaires in groups 1 and 5 operate at 100%, those in groups 2 and 4 are dimmed to 85%, and those in group 3 are dimmed to 80%. This regulation aims to control the illuminance level in the central area of the classroom. Without such regulation, the tables under luminaire group 3 (calculation points 2, 5, 8, 11, 14, and 17) would receive light from luminaires on both sides, resulting in excessively high illuminance levels. Furthermore, the row of luminaires located at the front of the classroom remains continuously at 100% to ensure adequate and uniform illuminance levels in that area.
3.3. Types of Lamps
Until now, only photopic lighting in the classroom has been considered. Therefore, in this section, two different LED lamps have been selected to calculate the melanopic contribution in each of the three designed luminaires, depending on the SPD of the lamp. The selected LEDs differ in their CCT: one with a high CCT (cool white) and another with a low CCT (warm white) to ensure sufficient contrast between them.
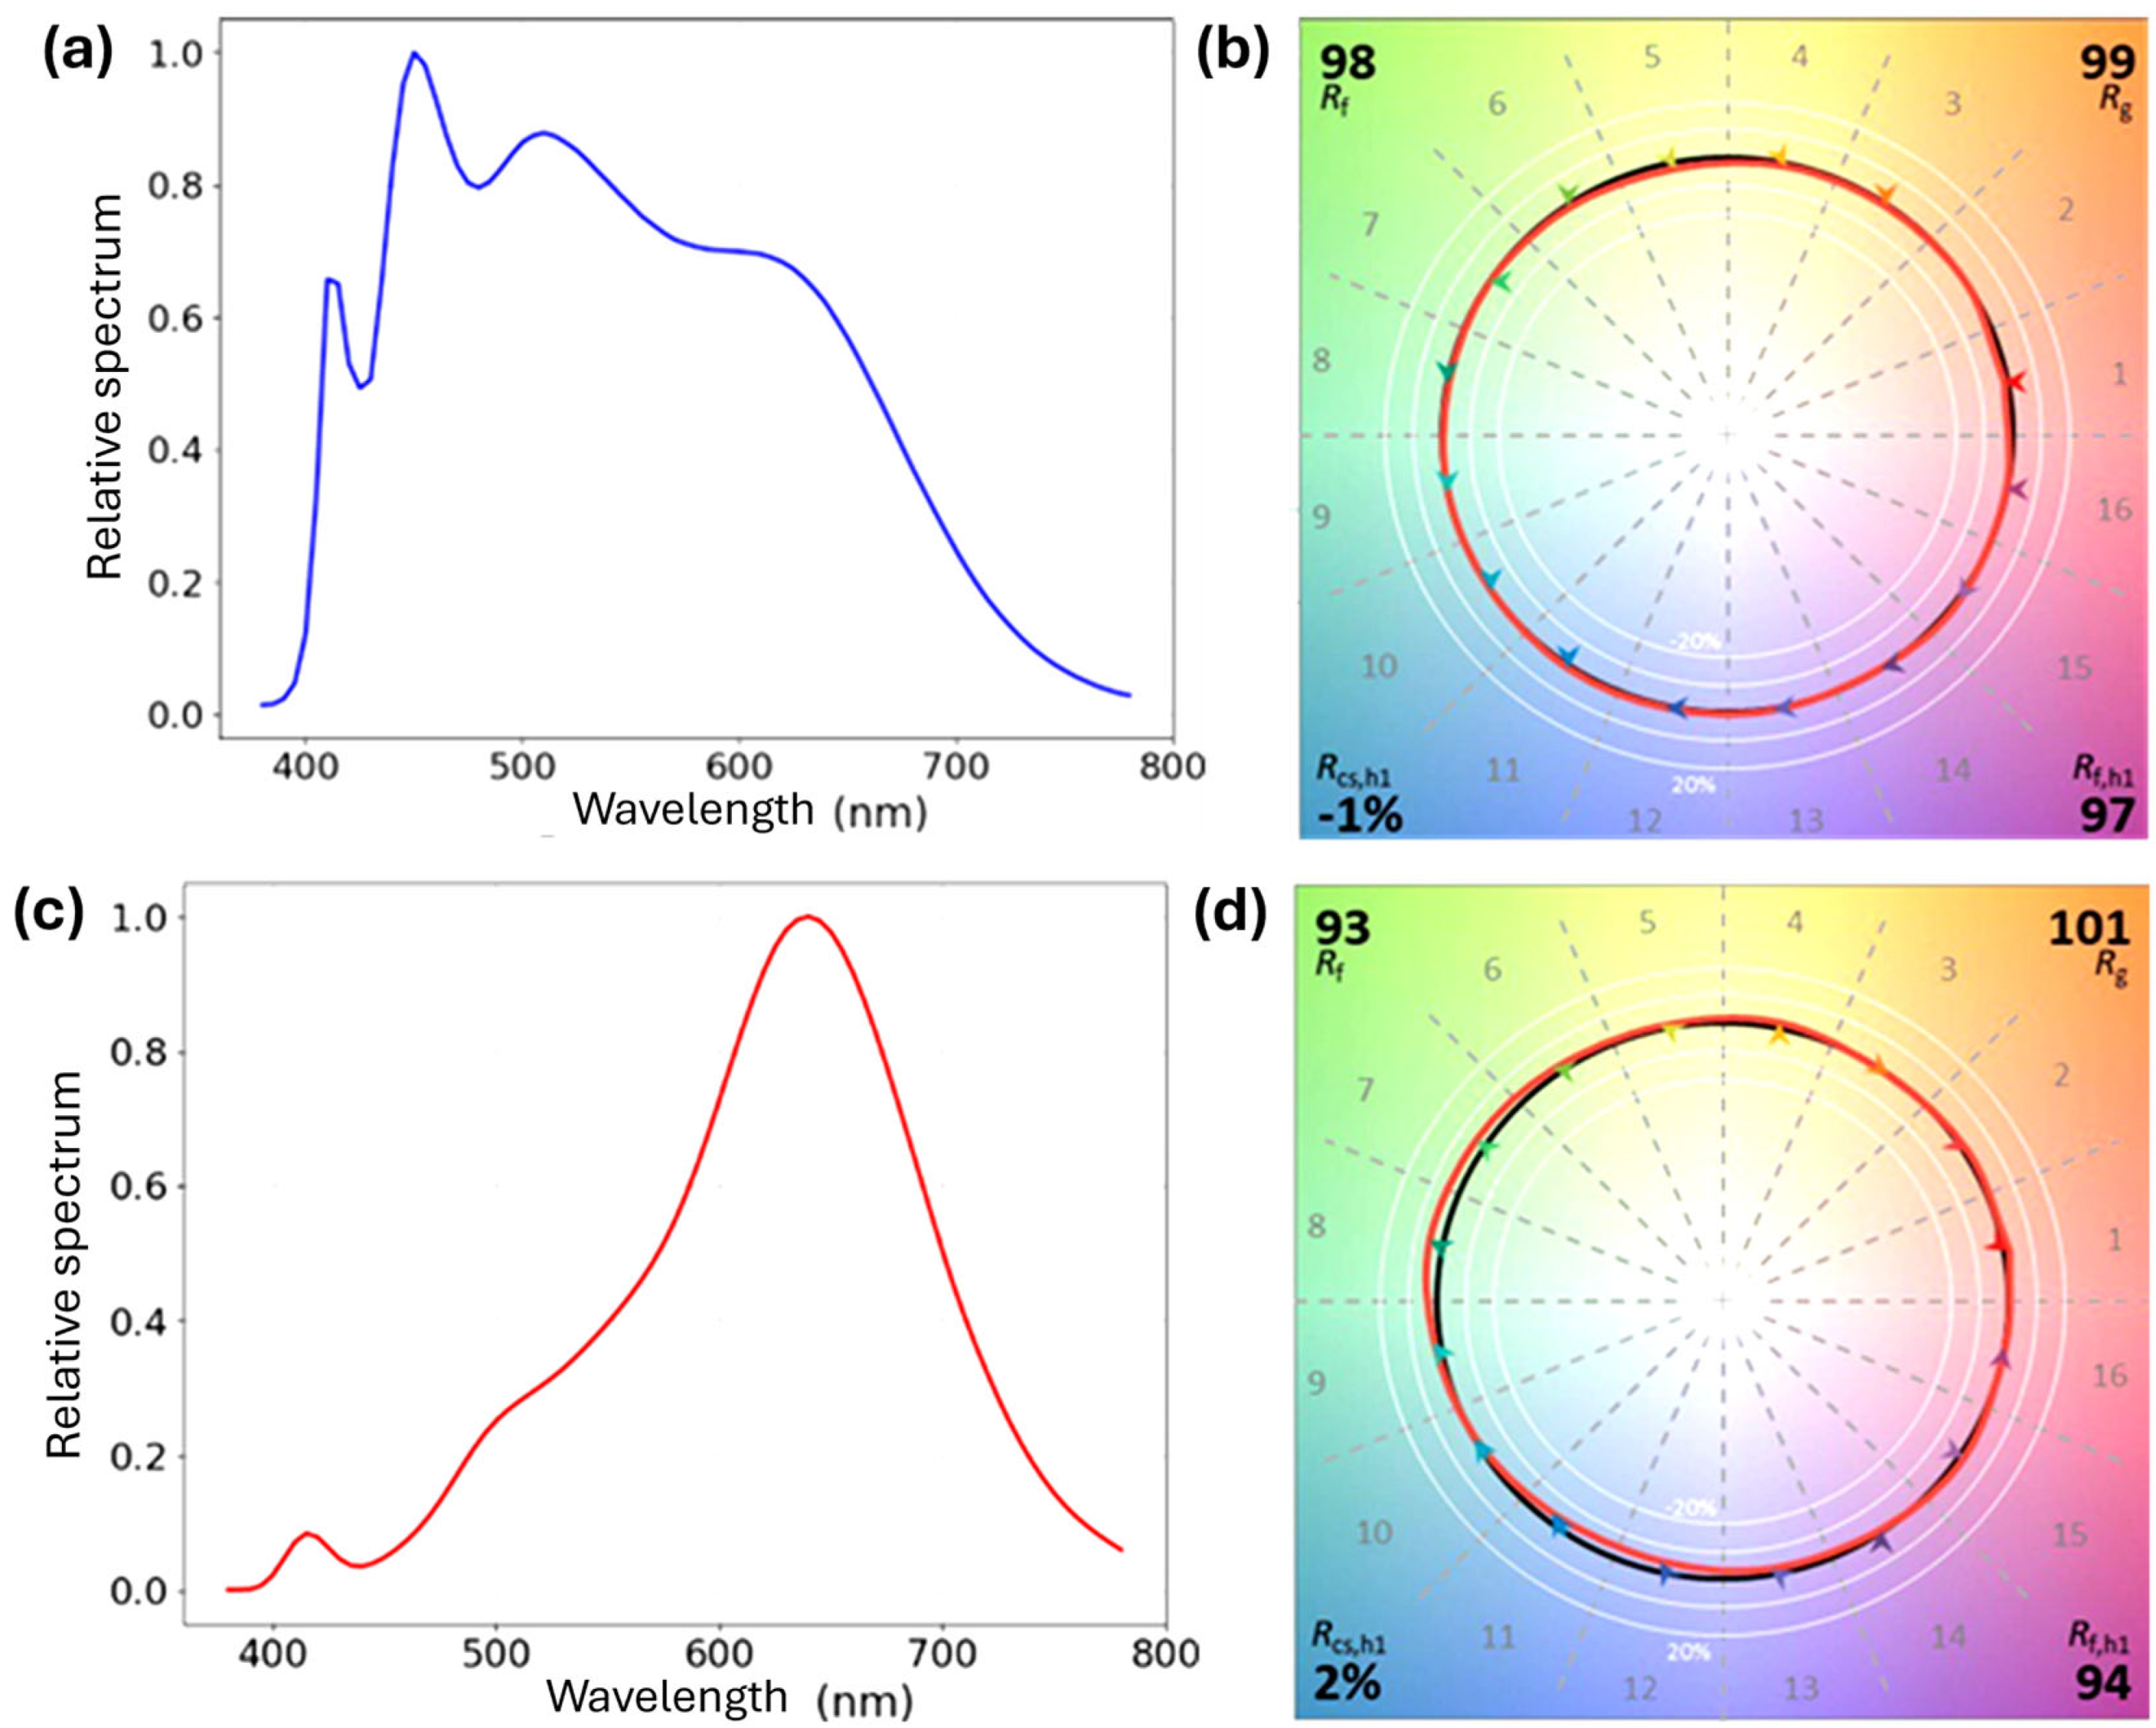
The first analysis focuses on the LED-6500K (SEOUL Semiconductor Co., Ltd., Seoul, Republic of Korea), which is characterized by a full-spectrum SPD, covering the entire visible spectrum. It exhibits a distinctive peak in the blue wavelength region (~450 nm), while the rest of the spectrum closely resembles natural daylight, as shown in
Figure 3. Its CCT is 6487 K, classifying it as a cool white LED. A detailed evaluation of its color rendering can be performed using the ANSI/IES TM-30-24 method [
5] (
Figure 3).
In
Figure 3b, the color vector graphic is displayed, where the black circle represents the reference illuminant (in this case, illuminant D65), and the red curve corresponds to the measurement of the analyzed LED. The closer these two curves align, the better the color rendering performance. If the measured curve falls inside or outside the theoretical one, it indicates oversaturation or desaturation in certain colors. In this case, the two curves are almost perfectly overlapping, and the arrow distribution is nearly circular and centered, indicating balanced color rendering across the entire visible spectrum.
The fidelity index (Rf) measures color accuracy and is nearly perfect in this case, with a value of 98, while the gamut index (Rg) is 99, signifying no color oversaturation or desaturation. These characteristics make this LED an excellent choice for applications requiring precise color rendering and lighting conditions similar to natural daylight.
For the second case, the LED-2250K (Soraa Inc., Fremont, CA, USA) was used. This LED is characterized by having a peak emission around λ∼650 nm, indicating that it mainly emits in the visible spectrum corresponding to red, classified as a warm LED, as shown in
Figure 3c.
Its CCT is 2268 K and, for this LED, the Rf value is lower than in the previous case, at 93, but it still indicates excellent color reproduction. Rg = 101 indicates slight oversaturation in green/blue tones (
Figure 3d). This LED maintains excellent overall color reproduction, making it suitable for applications where color fidelity is necessary while also providing a warm ambiance.
4. Results
Once the luminaires were designed, they were loaded into the classroom model, and the corresponding simulations were carried out.
Figure 2 shows the luminaires placed in the classroom, allowing a 3D visualization of the spatial intensity distribution curves of the three luminaires. The emission direction is represented in red, while the perpendicular direction is shown in blue. The simulations verified that all points in the classroom with a straight-ahead gaze present UGR values below 19, complying with the regulatory limit [
4]; otherwise, users in those areas could experience visual discomfort due to glare.
The melanopic illuminance value on the corneal plane is calculated from the Ev values. It can be observed that the melanopic values follow the same trend as the photopic Ev values, as they are proportional, and their value will depend on the type of luminaire chosen. The key differences lie in the impact each LED has on biological stimulation, with the cool LED being more effective due to its higher MAF of 0.905, compared to the warm LED, which results in lower melanopic values, MAF = 0.336. The joint evaluation of photopic and melanopic values highlights the importance of selecting luminaires that provide an appropriate balance between both types of lighting.
4.1. Luminaire 1
The illuminance distribution throughout the room is highly uniform, with an
Eh of 1397 lx, reaching a uniformity value of 0.58 (
Figure 4). This value is very close to 0.6, which is the uniformity level established by the regulations for a study environment [
4].
The results obtained for
Ev using Luminaire 1 are shown in
Figure 4; it provides low
Ev, with values ranging between approximately 300 and 400 lx. The light distribution is relatively uniform but does not reach high levels of brightness compared to the other luminaires. A well-balanced
Ev/
Eh ratio ensures that vertical surfaces are not excessively dark compared to horizontal ones, contributing to a more harmonized lighting design, with a mean value of 0.253. The mEDI follows a similar pattern when using a cool LED, indicating that this luminaire does not significantly enhance circadian stimulation. With a warm LED, the mEDI values drop considerably, ranging between 110 and 150 lx, making it the least effective option for spaces requiring high melanopic stimulation.
4.2. Luminaire 2
The illuminance values on the work plane and uniformity are similar to those found with Luminaire 1; as shown in
Figure 4, the
Eh reaches 1252 lx, with limited uniformity of 0.56. This luminaire offers significantly higher
Ev, reaching values between 500 and 580 lx. The distribution is well-balanced, providing strong and consistent illumination across the evaluated space. When paired with a cool LED, mEDI values closely match
Ev, confirming its strong impact on circadian lighting. The use of a warm LED reduces mEDI to around 180–220 lx, which still provides better melanopic stimulation than Luminaire 1 but remains notably lower than with a cool LED. This luminaire presents a good compromise between general lighting and circadian effectiveness.
4.3. Luminaire 3
For the results obtained with Luminaire 3, the Eh reaches 1021 lx, with the best uniformity, 0.60. This contrasts with the mean Ev value, 549 lx, observed with Luminaire 3 vs. Luminaire 1, which was approximately 200 lx lower. Luminaire 3 performs similarly to Luminaire 2 but with slightly higher Ev values in some areas, ranging from 530 to 590 lx. It also provides a more uniform light distribution, making it an effective solution for spaces requiring consistent illumination. The mEDI values with a cool LED are the highest among all luminaires, reaching up to 590 lx, making it the most suitable choice for environments where circadian stimulation is a priority. When using a warm LED, mEDI values are comparable to those of Luminaire 2, ranging between 180 and 220 lx, maintaining a moderate level of melanopic response.
In the classroom context, effective lighting design ensures sufficient Ev for academic tasks while also supporting user well-being. The mean Ev values for Luminaires 1, 2, and 3 are 353, 537, and 549 lx, respectively, highlighting the differences in illumination levels. Among them, Luminaire 1 is the least effective in both general and melanopic illumination, making it less suitable for spaces requiring high brightness or circadian stimulation. In contrast, Luminaire 2 strikes a balance between good vertical illuminance and mEDI, offering a viable solution for classrooms and workspaces. Luminaire 3 provides the highest illuminance and melanopic stimulation while maintaining a uniform light distribution, making it the best option for environments that require both visual comfort and a strong circadian impact.
As shown in
Figure 4 and
Figure 5, the cool LED provides a melanopic illuminance mEDI almost equal to the photopic illuminance, with mean values of 353, 537, and 549 lx for Luminaires 1, 2, and 3, respectively. The observed similarity between mean
Ev and mEDI values when using the 6500 K LED is attributable to its high melanopic action, which is characteristic of daylight-spectrum sources and results in closely aligned average vertical and melanopic illuminance values. This confirms that the SPD of the cool LED strongly supports circadian stimulation. However, the warm LED results in much lower mEDI values, with mean levels of 131, 199, and 204 lx for Luminaires 1, 2, and 3, respectively. This significant reduction is due to the warm LED’s lower MAF, limiting its effectiveness for biological regulation.
Furthermore, the highest mEDI values with the cool LED are achieved by Luminaires 2 and 3, reinforcing their suitability for environments prioritizing circadian stimulation. Conversely, for the warm LED, the mEDI values across all three luminaires range between 120 and 200 lx, indicating a reduced impact on circadian rhythms. These findings emphasize the importance of selecting both the appropriate design and material for the luminaires and LED spectrum to achieve optimal lighting conditions tailored to both visual and biological needs (
Table 2).
4.4. Design Proposal
After the design and analysis of the results found, it can be concluded that in this case the optimal luminaire is Luminaire 3, as it is the one that provides the greatest illuminance uniformity to the classroom, and in
Eh, the values specified by UNE-EN-ISO 12464-1:2022 are achieved, in addition to obtaining the relationships
Ev/
Eh closer to 0.6. When the mEDI is studied, Luminaire 3 provides around 550 lx when using the cool LED, a high value that will promote cognitive activation in the user. On the other hand, with the warm LED, values around 200 lx are obtained, a suitable value for performing cognitive activities such as those carried out in a classroom, while also providing an optimal CCT to create a more pleasant atmosphere at the end of the day and relax the body in the hours before sleep. As can be seen, Luminaire 1 gives values that are too low in melanopic illumination, and Luminaire 2, from a visual perspective, has less uniformity. To achieve high activation in the early morning hours and relaxation in the late afternoon, the optimal solution is to opt for dynamic lighting. In the early morning hours, the LED-6500K will be activated, and as the day progresses, the LED-2250K will gradually turn on while the former decreases, until 100% of the LED-2250K is lit. The spectrum of both LEDs combines, resulting in different spectral curves as described in
Figure 5a.
At the same time, in
Figure 5b, the different CCTs through which dynamic light evolves are represented in the eleven steps established for this project.
Table 3 specifies that the photopic illuminance
Ev remains constant, while the mEDI level varies, depending on the SPD of the light used in each of the steps shown in the representation. The CCT, the color rendering index (CRI), and the chromatic coordinates x and y corresponding to each step are also specified in
Figure 5b.
During the day, reaching at least 250 lx of mEDI is feasible, but exposure in the late afternoon should be limited to 10 lx, with almost total darkness at night, which is crucial for maintaining a healthy circadian rhythm, improving sleep quality, and enhancing overall well-being [
16,
19]. Although this may conflict with visibility needs, it is recommended within the integrative lighting design. Therefore, the interaction between the SPD of the LED and the material properties with which the luminaire is built primarily affects how and where the melanopic-effective light is delivered, rather than altering the spectrum of the LED itself. Luminaires with better vertical light distribution (such as Luminaires 2 and 3) make more efficient use of the blue-rich SPD of cool LED, enhancing mEDI at the corneal plane. Conversely, even the same high-SPD LED would be less effective in a luminaire with highly directional output and lower vertical illuminance, as seen with Luminaire 1. In this way, spatial and spectral factors must be jointly considered to optimize circadian-effective lighting. Current lighting standards, based on averages, often overlook individual variability [
15,
31], as light sensitivity differs between people [
32]. This highlights the need for flexible controls and personalized recommendations, especially for individuals active at night, considering their specific activities and exposure to light outside of work. Additionally, NIFs show that systems related to the brain, cardiovascular system, and thermoregulation are activated within 1 to 5 min of exposure to light [
33]. Understanding this is crucial for adapting lighting and enhancing cognitive function, mood, and quality of life. However, how to achieve this is unclear, as the relationship between light exposure and daytime alertness varies significantly, with most dose–response analyses showing no significant correlations [
34]. Today, the CIE recommendations on melanopic lighting have become a key metric for predicting circadian effects and developing integrative lighting projects, offering a valuable tool to assess the impact of light on human physiology [
35].
5. Conclusions
Three luminaires were designed with different spatial intensity distribution curves, employing a common reflector profile with various materials to modify the reflective and transmissive properties. Luminaire 1, with a specular aluminum reflector, stands out for its high performance and luminous efficacy, providing high illumination levels on the horizontal plane but limited uniformity. Luminaire 2, made with a hammered PTFE reflector, maintains the illumination level on the horizontal plane and increases it on the vertical plane. On the other hand, Luminaire 3, which combines a high-gloss white aluminum reflector with a diffuser, achieves slightly lower efficiency but provides a lower horizontal illumination level with greater illuminance uniformity, values closer to 0.6, offering greater visual comfort. Based on these results, Luminaire 3 was chosen as the most suitable option for the classroom designed due to its ability to ensure a better balance between uniformity and visual comfort.
The regulation of artificial lighting to avoid excessive illuminance levels in the central areas of the classroom; a system of regulation for artificial lighting by control groups was necessary. The luminaires closest to the windows should operate at 80–85% of their capacity, while the front row needs to operate at 100% to ensure homogeneous Eh illuminance at all points.
The analysis of the SPDs of two types of LEDs, one cool (6487 K) and one warm (2268 K), allows the evaluation of color reproduction in its visual contribution and its melanopic contribution in its NIF. The cool LED, with a spectrum similar to sunlight and excellent color reproduction, contributes to greater melanopic activation due to its high MAF. The warm LED, with similar chromatic characteristics, provides lower melanopic activation, but its warmer light is ideal for cognitive activities in relaxing environments.
Finally, for the artificial lighting, Luminaire 3 was chosen, proposing dynamic lighting to optimize mEDI levels throughout the day by combining cool and warm LEDs. During the early hours of the day, cool LEDs predominate to provide high melanopic activation, 550 mEDI (lx), while at the end of the day, their intensity is reduced, and warm LEDs are activated, achieving a more relaxing light, 200 mEDI (lx). This strategy allows adjusting both the CCT and mEDI levels, optimizing visual comfort and the circadian well-being of users.
A key limitation of this study is the use of simulation software that does not support integrated spectral analysis. As a result, melanopic metrics were calculated separately using standardized weighting functions rather than being embedded within the spatial simulation workflow. Additionally, while the luminaire designs adhere to established photometric principles, no novel or adaptive optical geometries were proposed.
Future work will address these limitations by utilizing spectrally resolved lighting simulation tools capable of directly modeling non-visual effects and by exploring more advanced luminaire geometries, coatings, and adaptive optics to optimize both spatial and spectral performance for circadian-effective lighting. Moreover, although this study focused on artificial lighting in a controlled simulated environment to isolate spatial and spectral parameters, subsequent research should incorporate daylight analysis through classroom windows. This would allow for the evaluation of combined natural and artificial lighting effects on both visual and non-visual performance and support the development of integrative lighting strategies that adapt dynamically to daylight availability.
To expand the sustainability scope, future studies should also consider energy-efficient control strategies, such as daylight harvesting and dimmable, spectrally tunable systems, which can reduce energy use while supporting circadian health. Furthermore, integrating surface reflectance characteristics, ceiling and wall finishes, and energy performance modeling would enable a more comprehensive assessment of environmental and human-centric lighting impacts.
Finally, empirical validation in real-world educational settings is essential to refine the proposed framework, assess long-term effects on occupant well-being and performance, and ensure its practical applicability in diverse architectural contexts.
In conclusion, the importance of integrating photopic and melanopic lighting in the design of luminaires for interior spaces is highlighted, aiming to optimize spatial distribution curves and spectral characteristics of luminaires and LEDs, respectively. The implementation of a dynamic lighting system allows users to satisfy both visual and photobiological needs, providing an efficient, adaptable solution that complies with current standards and recommendations.


 ,
, 


