Abstract
In order to explore the development trends of intelligent construction technology in the field of construction, this paper constructs a system dynamics (SD) model of the application and development of BIM and the new-generation information technology in the construction industry based on SD theory and a structural equation model (SEM). Vensim DSS is used to explore the relationship between the SD model and six subsystems. The dynamic simulation and the sensitivity analyses are also conducted. Results show that during 2023–2050, as the time series advances, the effect value of the dynamic simulation gradually increases. From 2035, intelligent construction technology shows a trend of rapid development between various subsystems and the SD model. The adjusted model and the status of the subsystem are consistent with the SD model simulation curve. It is verified that intelligent construction technology has good development prospects in the construction field.
1. Introduction
With the rapid expansion of China’s economic construction scale, the construction industry is developing rapidly. In 2020, the total output value of China’s construction industry accounted for about 26% of the GDP with a year-on-year increase of 6.2%, and it will maintain a stable growth trend. However, there are many problems in China’s construction field, such as significant waste of resources [1], low economic benefits [2], serious environmental pollution [3], and extensive production management [4]. The Chinese government has promulgated a series of relevant policies to promote the application and development of intelligent construction technology in the construction field, aiming to vigorously promote the transformation and upgradation of the construction industry. For example, the “Guiding Opinions on Promoting the Coordinated Development of Intelligent Construction and Construction Industrialization” pointed out that it is necessary to use digitized and intelligent upgradation as a driving force, alongside innovate and break-through relevant core technologies, and increase the application of intelligent construction in all aspects of engineering construction. Intelligent transformation can improve the level of building management and construction efficiency, and reduce energy consumption, which is of great significance in promoting the reform of the construction industry [5,6,7].
Intelligent construction technology is an integrated technology with BIM technology at the core, and with the integrated development and application of BIM, the internet of things, cloud computing, big data, artificial intelligence, and other new-generation information technologies for the implementation of intelligent construction [8,9,10]. Intelligent construction has the advantage of the independent and interconnected characteristics of different new-generation information technologies and builds a complete intelligent construction technology system [11]. Intelligent construction fully empowers the engineering production and organization mode, which also promotes the interconnection of the engineering construction process, the integration of online and offline, and the coordination of resources and elements. Besides, intelligent construction can actively promote the formation of synergy between the construction industry and the information industry.
Structural equation modeling (SEM) is a method for quantitative and simplified research on complex data using the covariance between mathematical models and actual data through statistical theory. In recent years, the research around SEM has developed rapidly [12,13]. Oludolapo et al. [14] developed a partial least squares structural equation model (PLS-SEM) using questionnaire survey tools, and studied the impact of BIM technical barriers on BIM awareness throughout the project’s life cycle. Zhang et al. [15] established a SEM method to study the influence of environmental impact degree and product innovation on residents’ willingness to use photovoltaic systems. The research results show that there is a positive correlation between environmental impact degree, product innovation, and use intention.
System dynamics (SD) is an analysis method that integrates the comprehensive knowledge of information theory, system theory, control theory, and decision theory, which can track and simulate the current policy, and then provide a theoretical reference for decision makers [16,17]. Tang et al. [18] constructed an overall SD model framework based on the established causality diagrams among critical success factors, sustainable building completion criteria, and procurement system variables, and analyzed the impact of different procurement systems on sustainable building construction. Shi et al. [19] used SD to establish a public building carbon emission system simulation model, and used Vensim PLE simulation to simulate the changing trend of carbon emission data between 2020 and 2040. Then, based on the carbon emission simulation model of public buildings, the main carbon emission reduction paths such as the optimization of an energy structure, the application of energy-saving technology, and the application of renewable energy are obtained.
Gao et al. [20] embedded the ship owner’s psychological mechanism and behavior evolution into the dynamic model, and used empirical data to explore its evolution law. A Structural Equation Model (SEM) was constructed based on four variables, and the Three Gorges Project was taken as an example to conduct an empirical test on its influential relationship and degree. Finally, the SD model was used to simulate its dynamic evolution process. Ma et al. [21] proposed a dynamic laboratory safety assessment method integrating SEM and SD in view of the characteristics of insufficient and uncertain laboratory safety assessment data. Based on the questionnaire survey, the SEM was used to determine the influencing factors of laboratory safety, and their weights were embedded into the SD model. A sensitivity analysis was performed through a case study, identifying the variables that contributed most to improving laboratory safety. Albahri [22], utilizing a two-stage analysis combining Structural Equation Modeling (SEM) and Artificial Neural Networks (ANN), innovatively introduced a novel approach to linear and non-compensatory relationships. A comprehensive investigation across 11 industries over the past 6 years was conducted, involving the scrutiny of 239 articles, with meticulous screening and categorization resulting in 60 selected studies. The research findings highlighted the manufacturing and technology sectors as focal points, while the fields of construction and small-to-medium enterprises exhibited comparatively fewer studies. In discussing future work, the author proposed exploring determinants influencing the adoption of autism therapy in the healthcare domain. Upon contrasting the research outcomes, it is evident that the SEM-ANN model demonstrates significant advantages in static simulation, and it is adept at accommodating nonlinear factors within complex systems. However, it grapples with challenges such as overfitting and a decline in model interpretability. In comparison, the SEM-SD model focuses on causal relationships among variables and the dynamic evolution of systems, offering a more comprehensive consideration of both static and dynamic factors. It simulates policy impacts, providing theoretical references for decision makers.
Traditional project management focuses on phased, hierarchical and sequential management, which makes it difficult to change and creates low efficiency for information transmission [23]. Intelligent construction technology is characterized by informatization and intelligence. With the help of advanced technologies such as BIM, artificial intelligence, and big data analysis, the efficiency and adaptability of project collaboration are improved. The research shows that the organizational integration characteristics of BIM are helpful to overcome this conflict of interest, realizing the whole life cycle management, and improving the scientific nature of project management and the effectiveness of owner design management, and ensuring the orderly and efficient implementation of design work [24]. In addition, Yasin Celik proposed a BIM data traceability model based on a blockchain, which provides new technology for information exchange for construction projects. The bridge construction test shows that this method improves the BIM identification ability and improves the BIM implementation process [25]. Basem S designed a conceptual model for the integration of BIM and machine learning, which was applied to the final model for verification after use cases. It can predict the impact of design changes, assist decision making, and avoid time and cost waste [26].
From the above review, it can be seen that most of the current research explores the effectiveness of the integration of BIM and single information technology applied to a certain construction detail through practical engineering cases, and has limited contribution to the research on the overall development trend of intelligent construction technology in the construction field. At the same time, due to the large number of tasks, processes, and participants in engineering construction [27], it is less feasible to explore the impact of intelligent construction technology on the development of the construction industry with practical engineering as a case. Therefore, based on the theory of system dynamics and structural equation model, this paper constructs a system dynamics model (SD model of F7) for the application and development of BIM and new-generation information technology in the construction industry, and it uses Vensim DSS simulation to explore the relationship between six subsystems (F1-F6) and F7, and compares the simulation output results and sensitivity analyses under different conditions, so as to evaluate the development prospect of intelligent construction technology in the construction field.
2. System Dynamics’ Overview
2.1. Principles of System Dynamics
System dynamics (SD) combines qualitative and quantitative methods, information theory and cybernetics, and uses computer simulation technology to establish models to deal with complex nonlinear problems. SD judge the degree of fit of a data curve simulation and the similarity of a predicted development trend through the simulation curve formed by the evolution of the data along with the time series. The change of the trend of different curves will be an important sign of the behavioral characteristics of the system to deal with complex problems and carry out dynamic simulation for its future development.
2.2. System Dynamics Modeling Steps
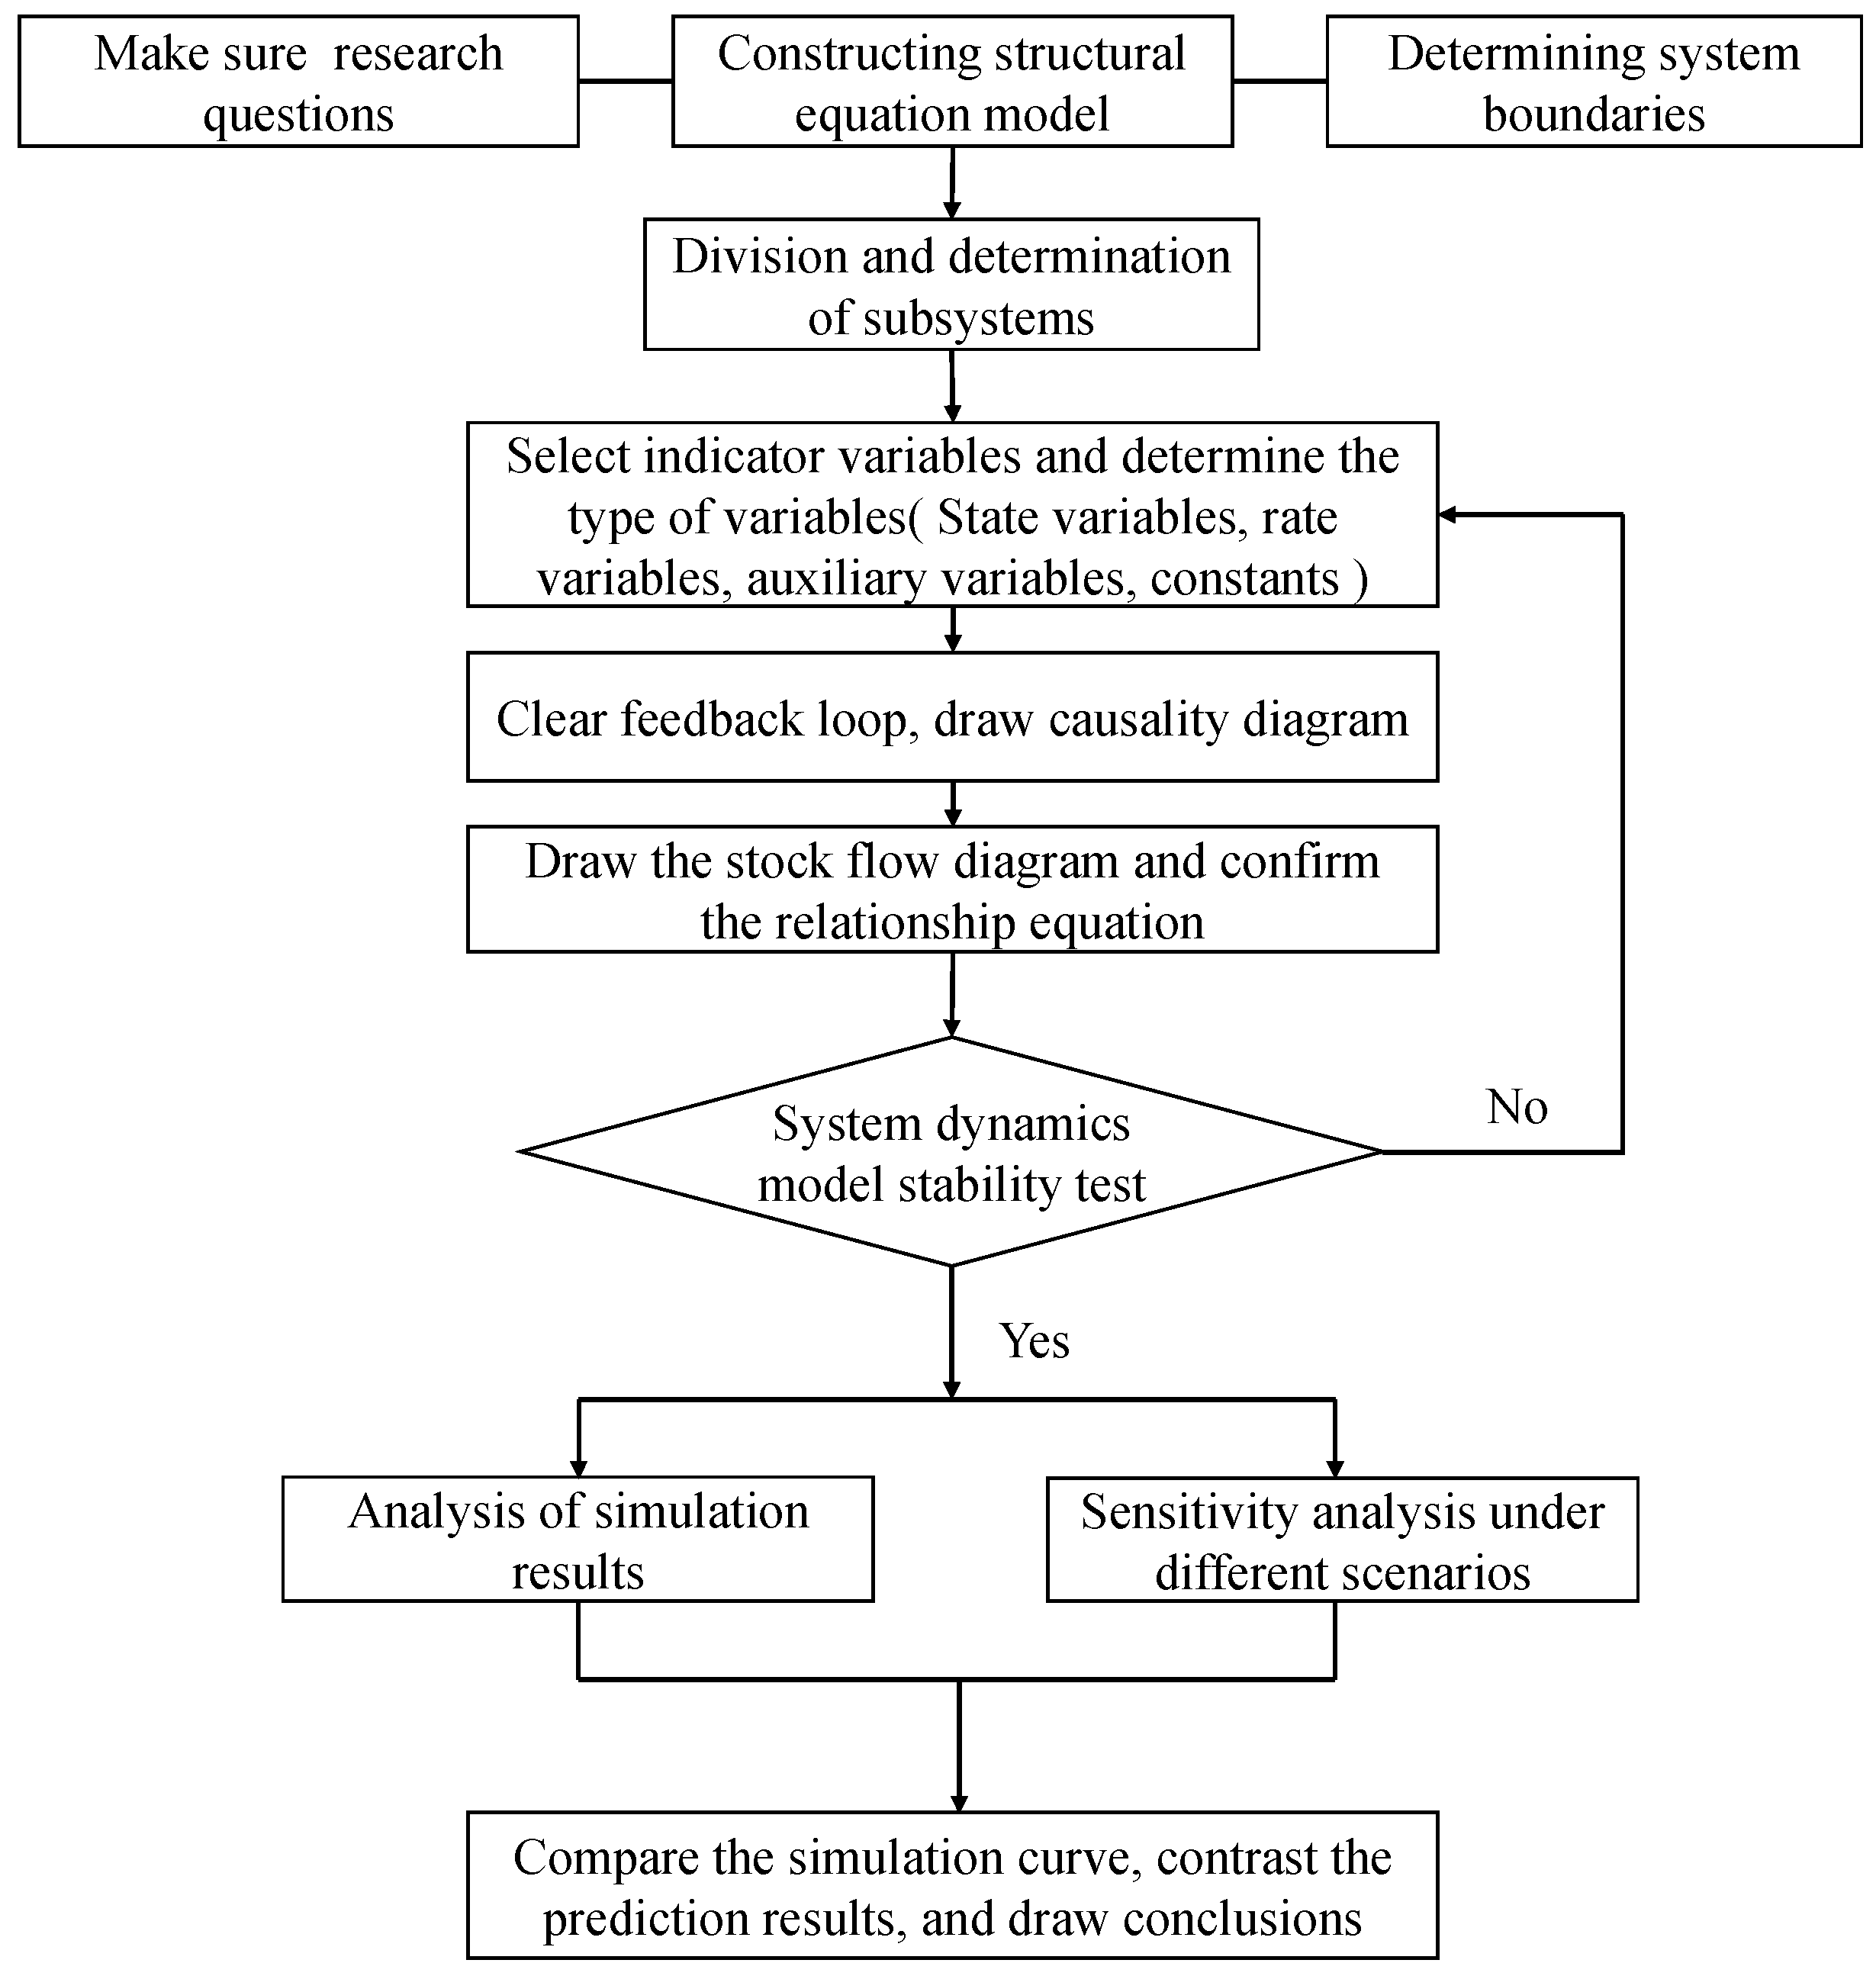
The establishment of a system dynamics model is generally carried out according to the following analysis process: (1) define the problem and divide the boundary of the system, (2) propose assumptions, (3) determine the influencing factors, (4) establish a causal relationship diagram, (5) analyze the causal relationship, (6) draw a stock flow diagram, (7) determine the model, (8) set the model parameters, (9) test the model, (10) analyze simulation results, and (11) perform sensitivity analysis under different scenarios [28]. The specific steps are shown in Figure 1.
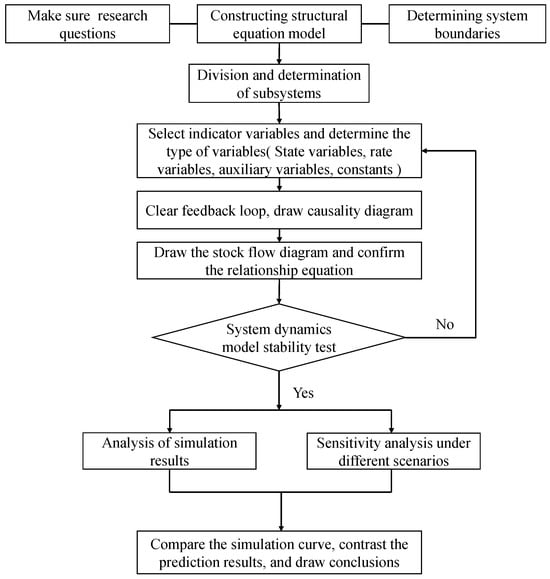
Figure 1.
Process of system dynamics modeling.
3. System Dynamics Modeling
3.1. Construction of Structural Equation Model
This paper screened out the key variables affecting the intelligent transformation of the construction industry using the literature, research, and questionnaires. These variables were then condensed into six common factors using SPSS 26.0 software. Finally, AMOS 24.0 software was used to construct a structural equation model between the six common factors and the application and development of BIM and the new generation of information technology (F7) in the construction industry. At the same time, the factor analysis method is used to verify the results. The results show that the variables in this paper are scientific, and the structural equation model has good adaptability.
3.1.1. Data Sources
Online and offline surveys were conducted to experts, professors, and practitioners in the construction industry. The respondents were mainly from universities, design institutes, governments, construction, supervision, and other related sectors. The determination of the sample size is primarily contingent upon the specific circumstances of the questionnaire survey, taking into account factors such as the surveyed population, budget constraints, and acceptable error rates. Research results indicate that setting the sample size within the range of 200–400 is deemed appropriate [29]. A total of 280 questionnaires were sent out, and 265 responses were recovered, of which 251 were valid, with an effective recovery rate of 94.72%. The contents of the questionnaire and the basic data of the subjects are shown in Table 1 and Table 2.

Table 1.
Contents of the questionnaire.
Table 2.
Basic information of interviewees.
3.1.2. Sample Data Test
SPSS 26.0 was used to analyze the reliability of the sample data of this survey. The reliability coefficient of the questionnaire was 0.954, and the survey results had good reliability and internal consistency. Before using the factor analysis method, it is necessary to test whether the sample data is applicable, that is, using a validity test. A KMO test and Bartlett sphericity test were used to calculate the KMO value and significance probability value (p value) with SPSS 26.0 After testing, the KMO value of the sample data was 0.948, and the p value was 0. The calculation results show that there is a strong correlation between the various factors of the sample data, and the factor analysis method can be used for research and analysis.
3.1.3. Extracting Common Factors
Firstly, the principal component analysis method is used to solve the eigenvalues of the sample data, and then the total variance explanation is obtained using SPSS 26.0 analysis, as shown in Table 3. According to the extraction principle of an eigenvalue greater than one, the first six factors are extracted as common factors, and the cumulative variance contribution rate of the first six common factors is 73.54%, which can summarize most of the factor variables and basically reflect the essential information of the sample data.
Table 3.
Total variance explanation.
3.1.4. Common Factor Explanation
The rotated component matrix is obtained through the maximum variance orthogonal rotation transformation. Then, the index information carried by each common factor is obtained, and the important factor variables are identified. The relationship between the factor variables can be better understood. When the load value of the sample data is greater than 0.5, it has an effective explanatory power, and the relevant factor variables can be summarized as the corresponding common factors. In the component matrix after the rotation of the sample data, the load value of X16 has two factors that meet the requirements of interpretation, so there is a phenomenon of conceptual ambiguity. The X20 load values did not reach an effective explanation, so the X16 and X20 factor variables were deleted. Therefore, the factor variables contained in each common factor are shown in Table 4. The common factors F1-F6 represent the function of BIM and the new generation of information technology (F1); the application degree of the new generation of information technology in the construction industry (F2); the development trend of building informatization (F3); the characteristics of construction project management information products (F4); the actual situation of the construction process (F5); and the development of BIM-based information integration service platform (F6).
Table 4.
Common factor explanation.
3.1.5. Establishment of a Second-Order Structural Equation Model
The maximum likelihood method is used to evaluate the parameters of the measurement model, and the fitting degree of the observed variables and the potential variables is judged according to the path coefficient and the fitting index. According to the correlation between the variables, the suitability of the measurement model is obtained. Hair et al. proposed that the test of ‘violation estimation’ must be carried out before evaluating the goodness of fit of the model. The measure of violation estimation is usually the presence of negative error variance and the standardization index that exceeds or is too close to one [30].
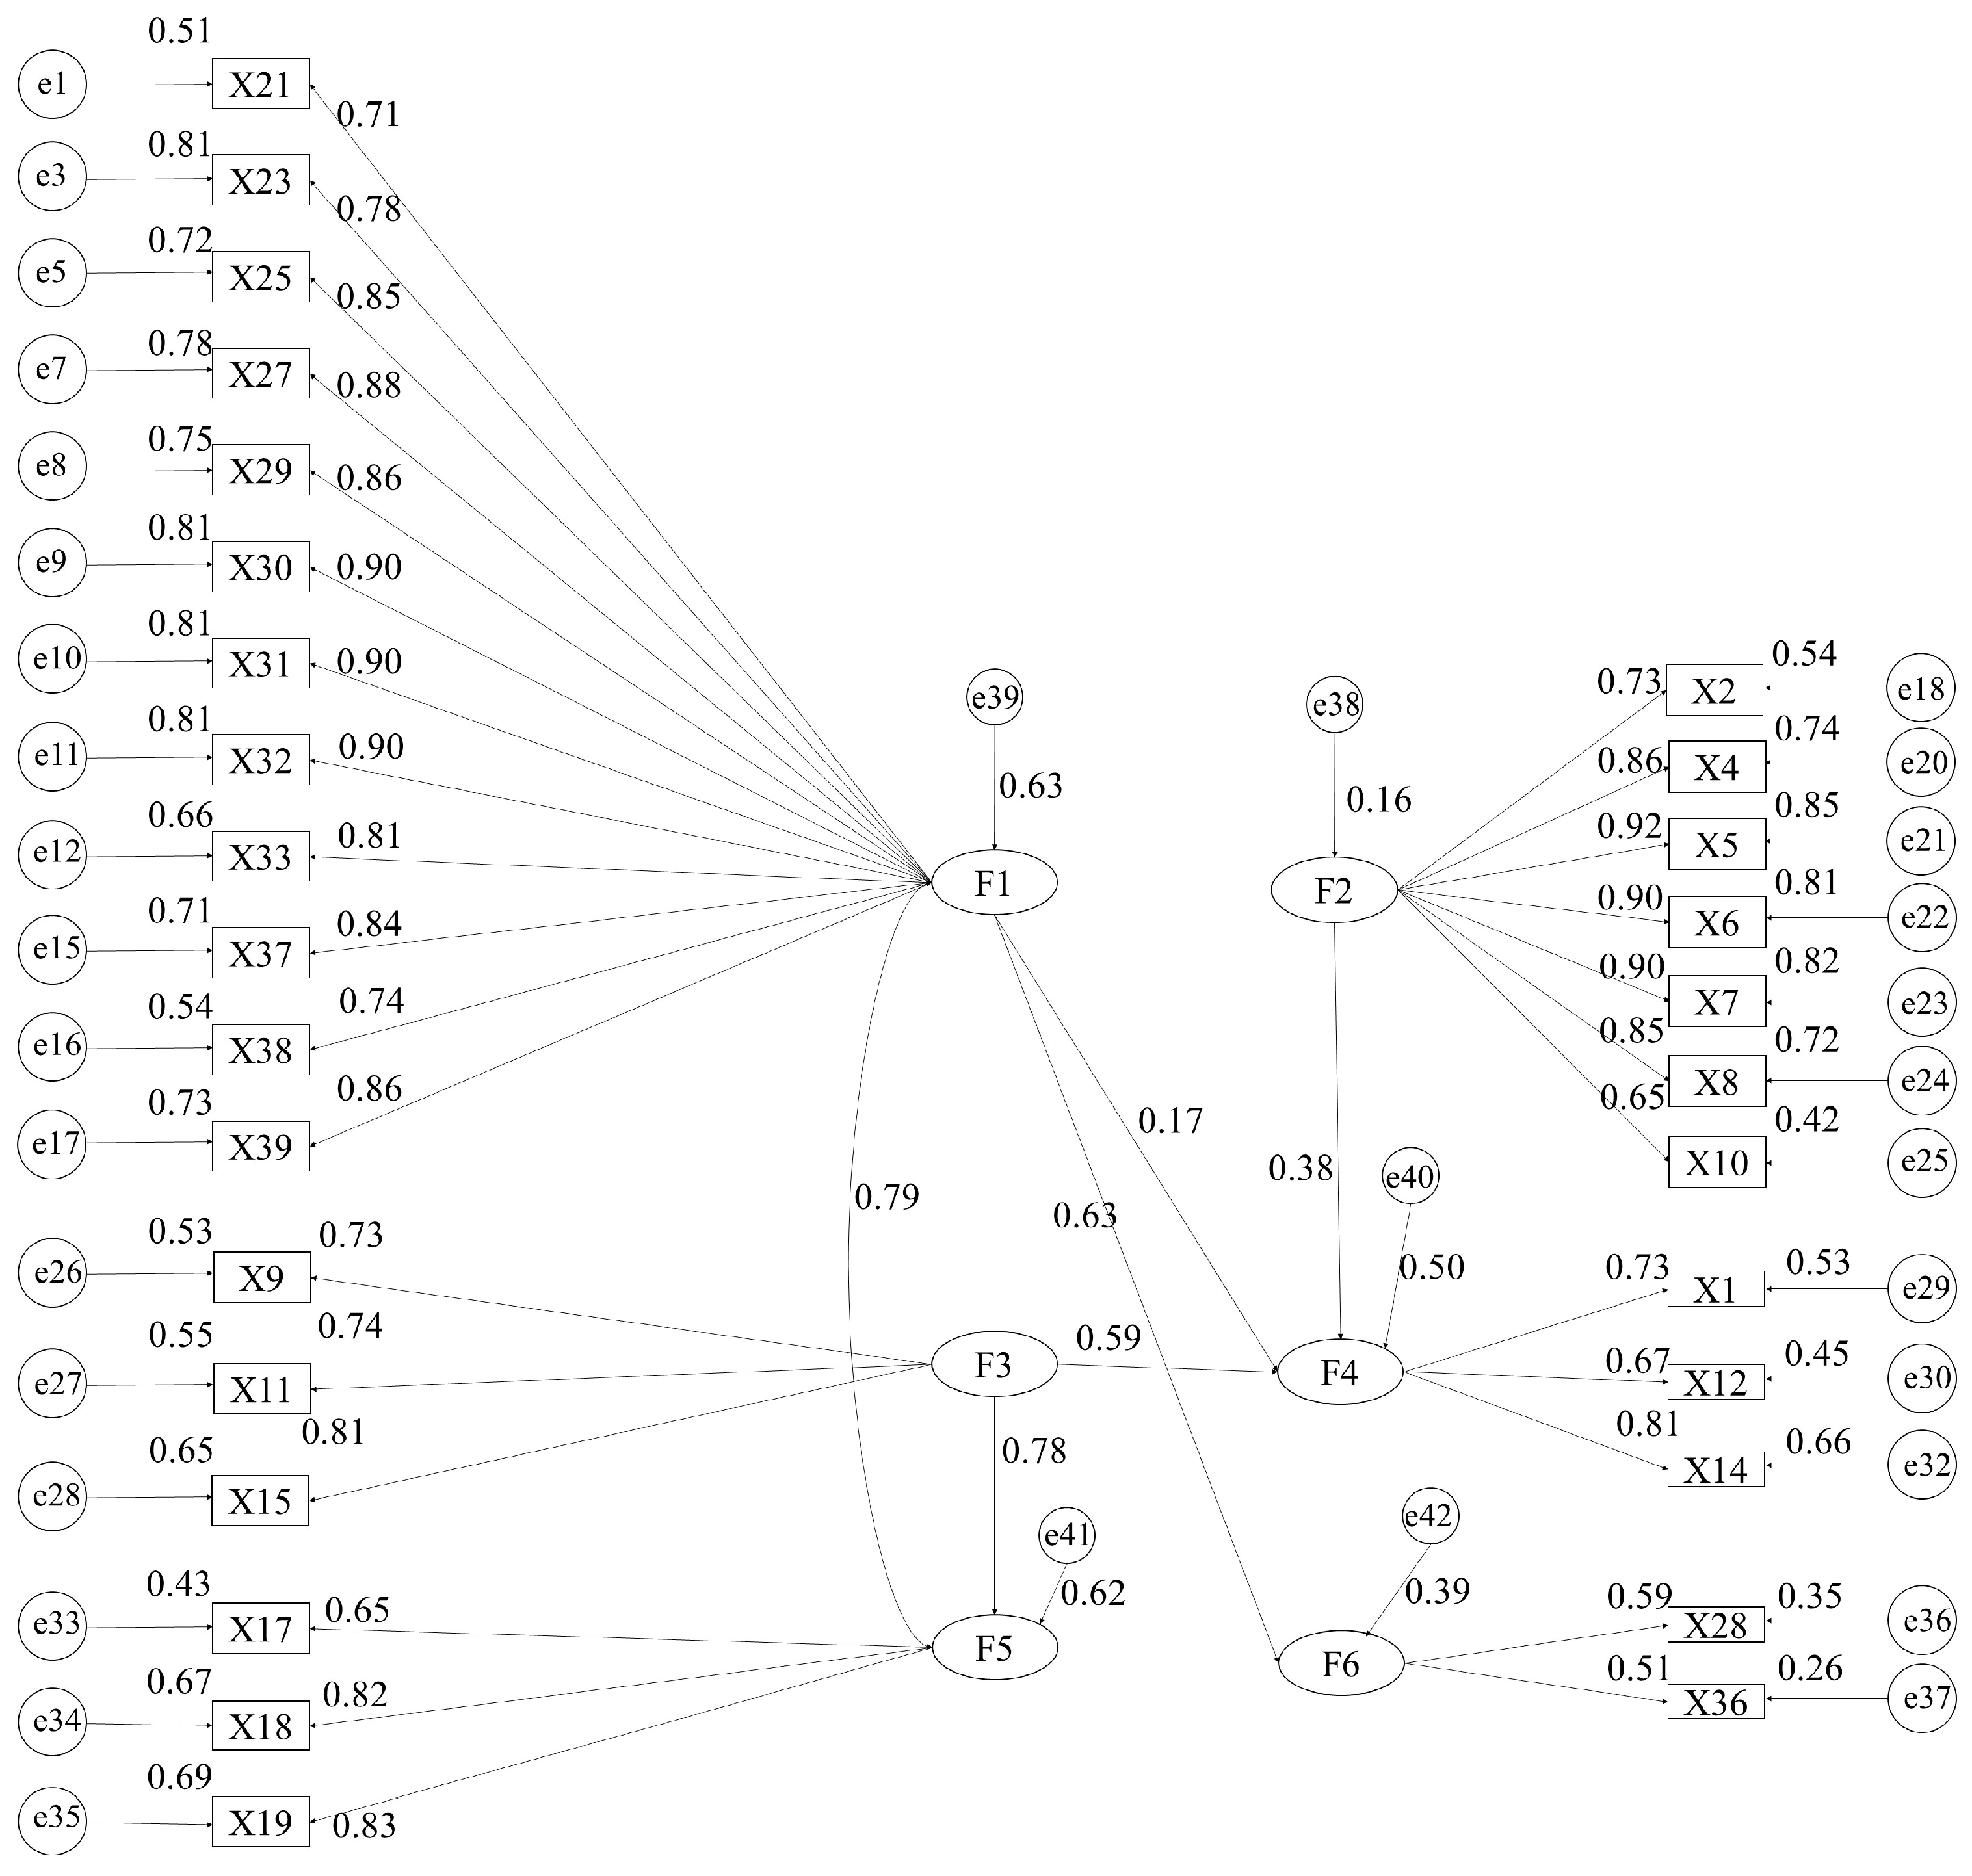
There is no negative error variance in the measurement model, and the absolute value of the standardized coefficient does not exceed 0.95, indicating that the model does not violate the estimation, and the overall model fitting degree can be tested, as shown in Figure 2. However, some of the indicators of the uncorrected measurement model did not meet the requirements, and the degree of adaptation was poor, as shown in Table 5. According to M.I. values provided by AMOS 24.0, the model is corrected one by one, from large to small, and the adaptation index of the corrected measurement model meets the adaptation standard. In the measurement model, e represents the residual term between variables, reflecting the part of the structural equation that has not been explained. If a negative value occurs, it indicates that the data processing is abnormal. At the same time, the residual term in the modified measurement model is positive, the path coefficient meets the standard, and the adaptation index meets the requirements. Therefore, the overall fitting degree of the model is good, as shown in Table 6.
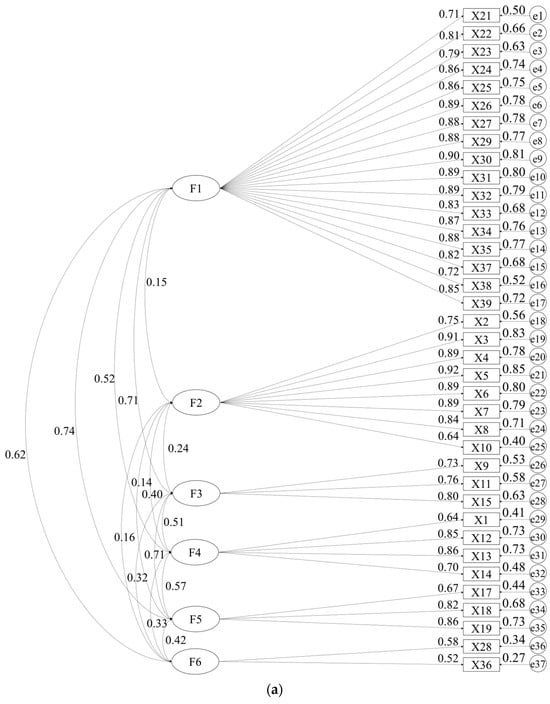
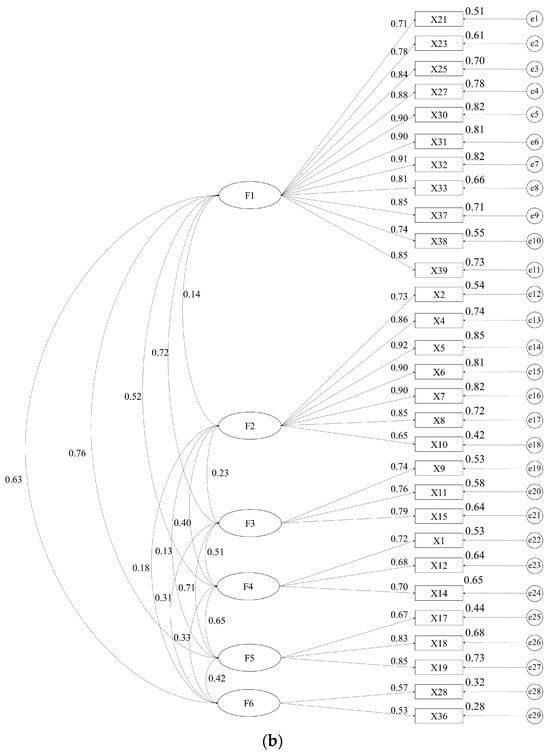
Figure 2.
Confirmatory factor analysis model of measurement model. (a) Unmodified measurement model. (b) Modified measurement model.
Table 5.
The overall adaptation index of the unmodified measurement model.
Table 6.
The overall adaptation index of the modified measurement model.
Based on the revised measurement model, a first-order structural model was constructed. Utilizing first-order confirmatory factor analysis on the structural model, assumptions among various latent variables were tested, as illustrated in Figure 3. Following confirmatory factor analysis, the structural model exhibits favorable fit indices, including an RMSEA value of 0.065 (<0.08), CMIN/DF value of 2.060 (<3), GFI value of 0.821 (>0.8), TLI value of 0.924 (>0.8), IFI value of 0.931 (>0.9), and CFI value of 0.930 (>0.9). Upon examination, all model indicators meet the established standards, affirming the good fit of the structural equation model.
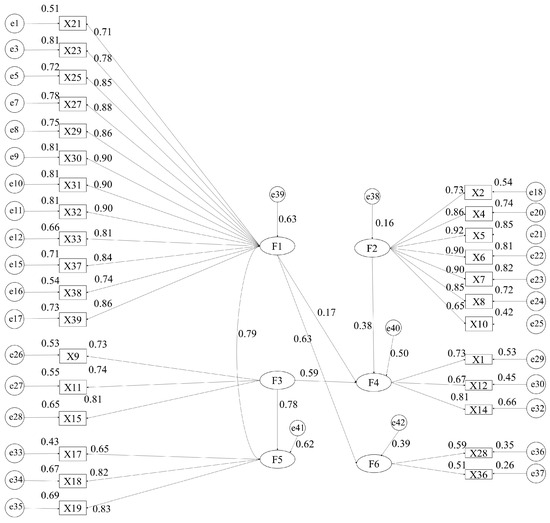
Figure 3.
First-order confirmatory factor analysis on the structural model.
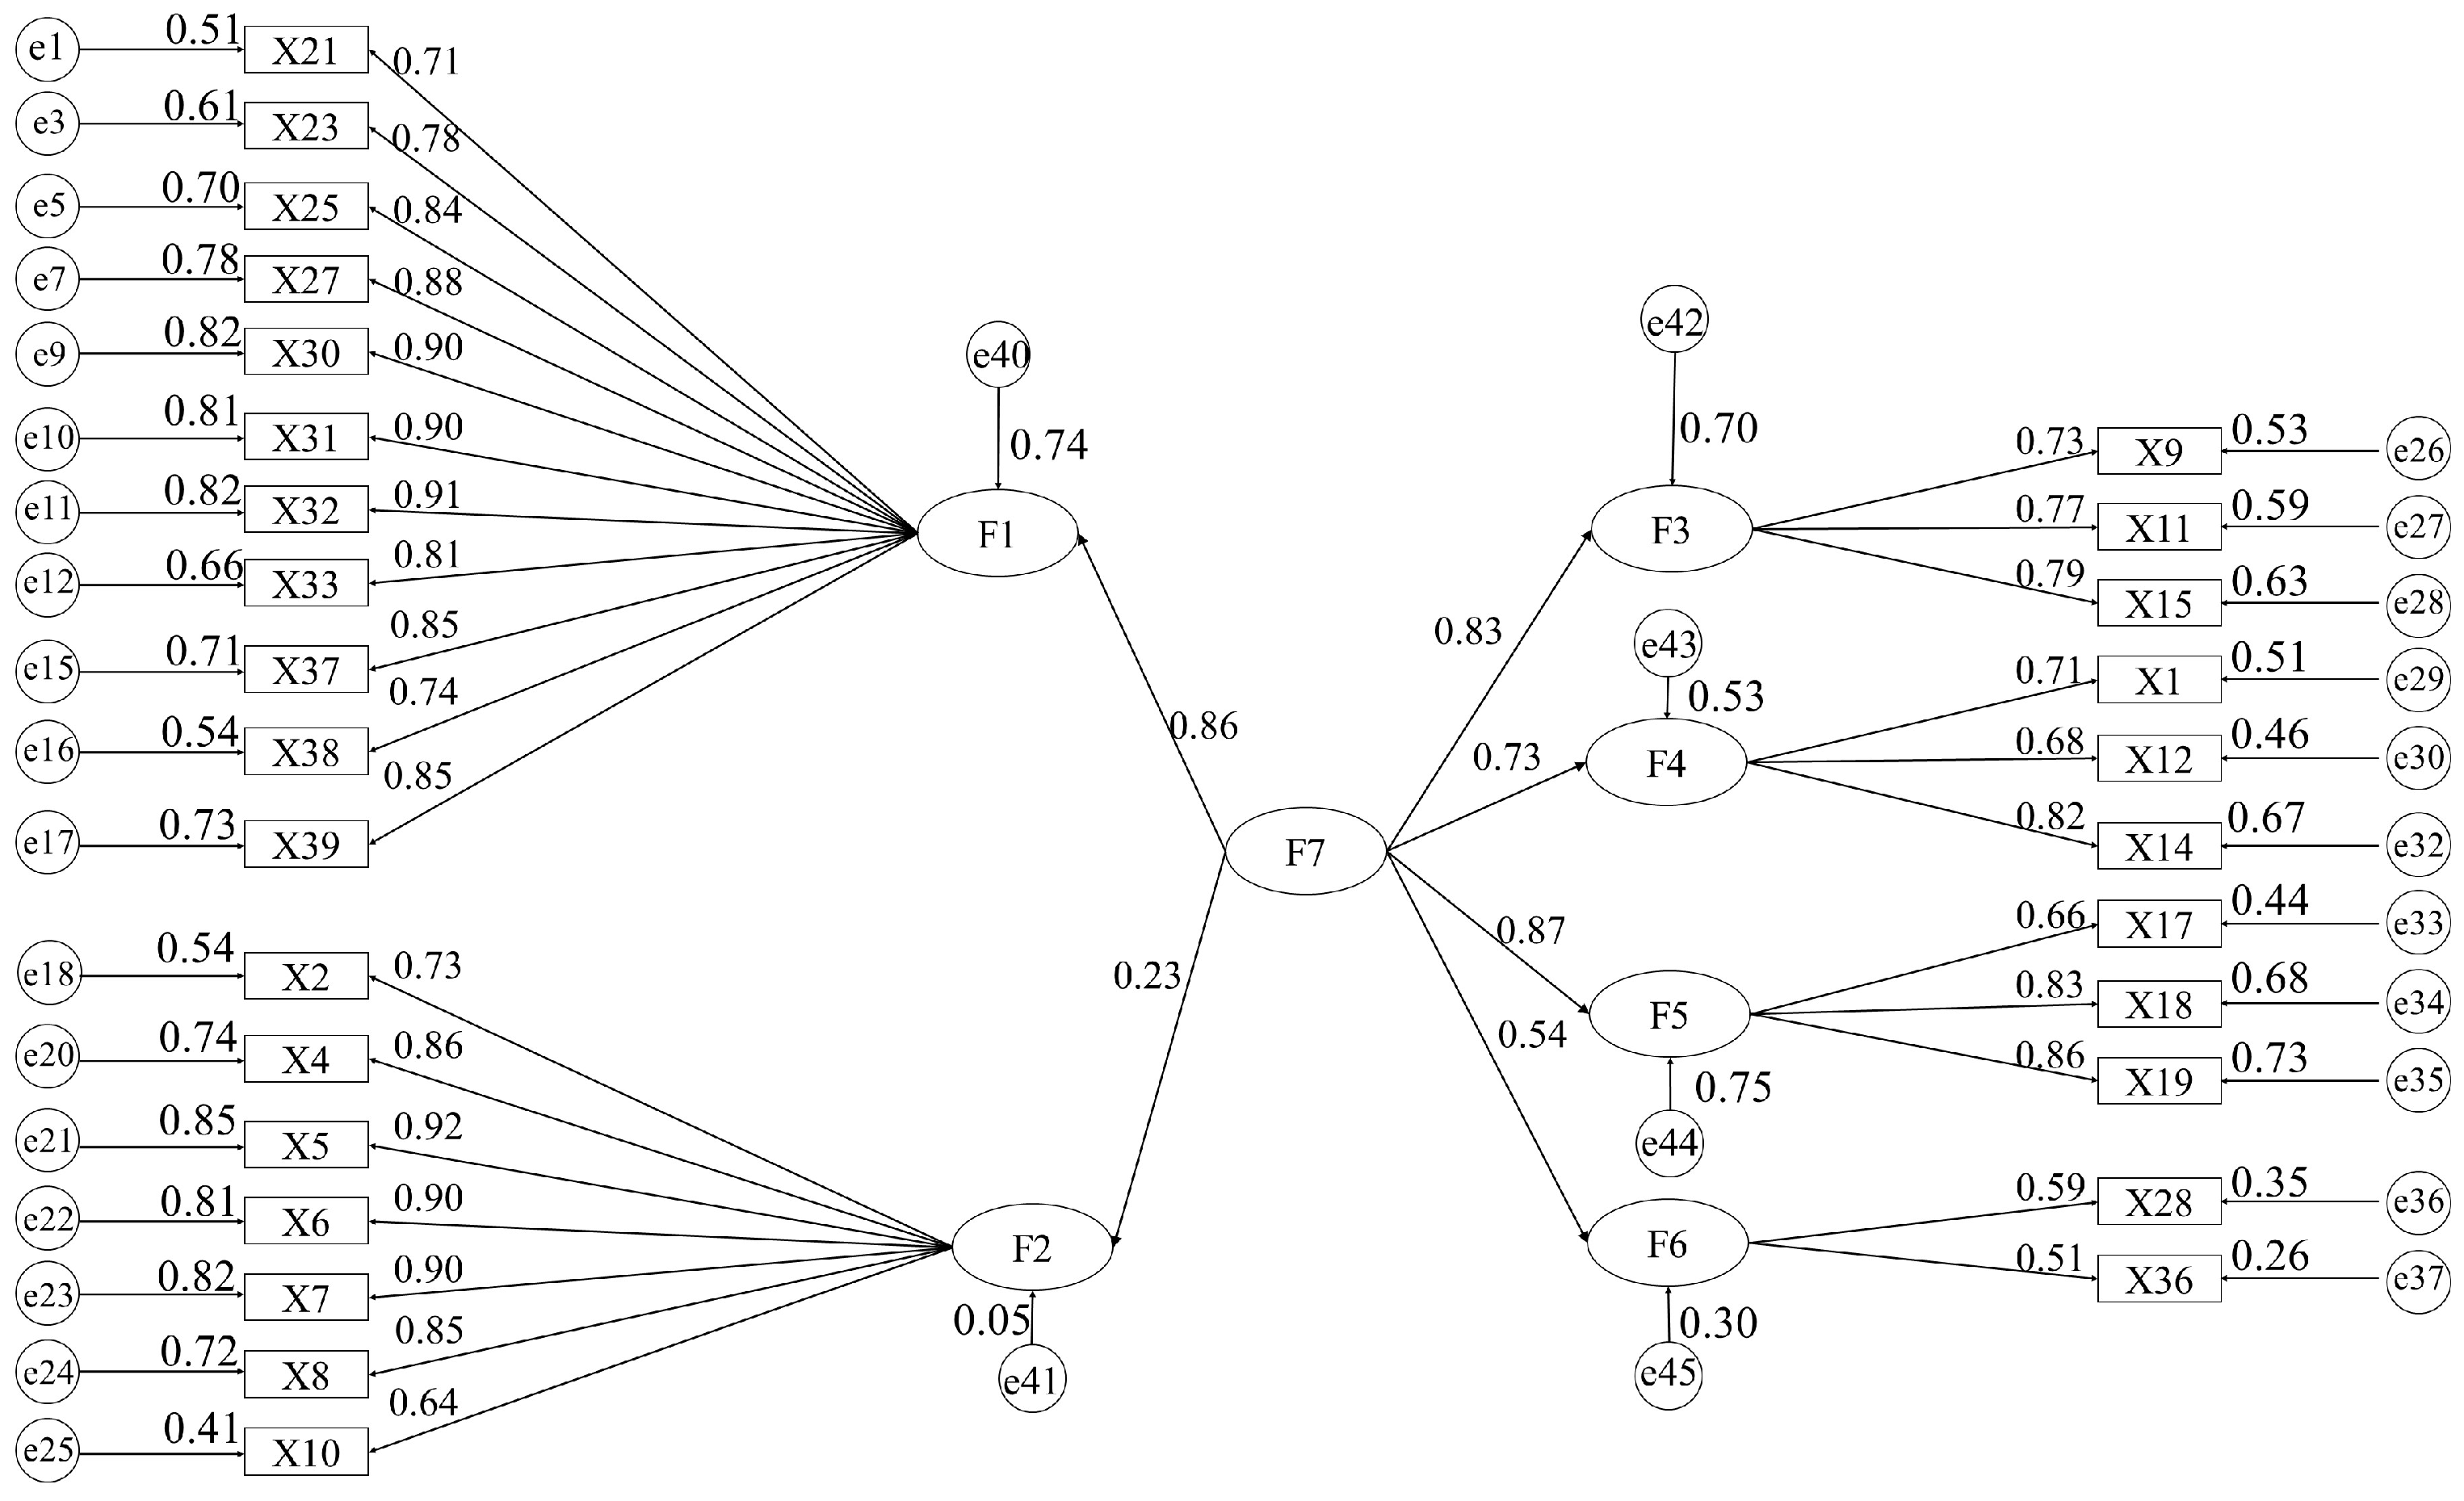
According to the standardized path coefficients between the latent variables in the modified first-order structural model, it is found that the correlation between the latent variables is strong, and the model with a good overall fitting degree after correction still has more observed variables. Therefore, there is a higher level of common factor in the six potential factors of the modified first-order structural model; that is, the external potential variable is the application and development of BIM and new-generation information technology in the construction industry (F7). Then, AMOS 24.0 is used to build the second-order confirmatory factor analysis model, and the maximum likelihood method is used to estimate the parameters. The analysis results are shown in Figure 4. As shown in Table 7, each index of the second-order confirmatory factor analysis model meets the standard [20], and the fitting degree of the structural equation model is good.

Figure 4.
The second-order confirmatory factor analysis model of the structural model.
Table 7.
The fitting index of the second-order confirmatory factor analysis model.
3.2. Boundary Determination
The determination of the system boundary is based on the system feedback structure and internal factors in the system behavior, while the external factors have little influence on its behavior. Therefore, the process of defining the system dynamics model mainly includes the division of systems and subsystems, and the determination of positive and negative correlations between related variables.
3.3. SD Model Construction
As shown in Figure 4, based on the relationship and the path distribution of nodes in the second-order SEM mathematical model, this paper divides the SD model of application and development of BIM and new-generation information technology (F7) into six subsystems which are the function of BIM and the new-generation information technology (F1); the application degree of new-generation information technology in construction industry (F2); the development trend of building informationization (F3); the characteristics of construction project management information products (F4); the reality of the engineering construction process (F5); and the development of an information integration service platform based on BIM (F6). The factors included in the SD model and subsystem are shown in Table 8, which is based on Table 1.
Table 8.
The composition of the SD model.
3.4. Cause–Effect Diagram
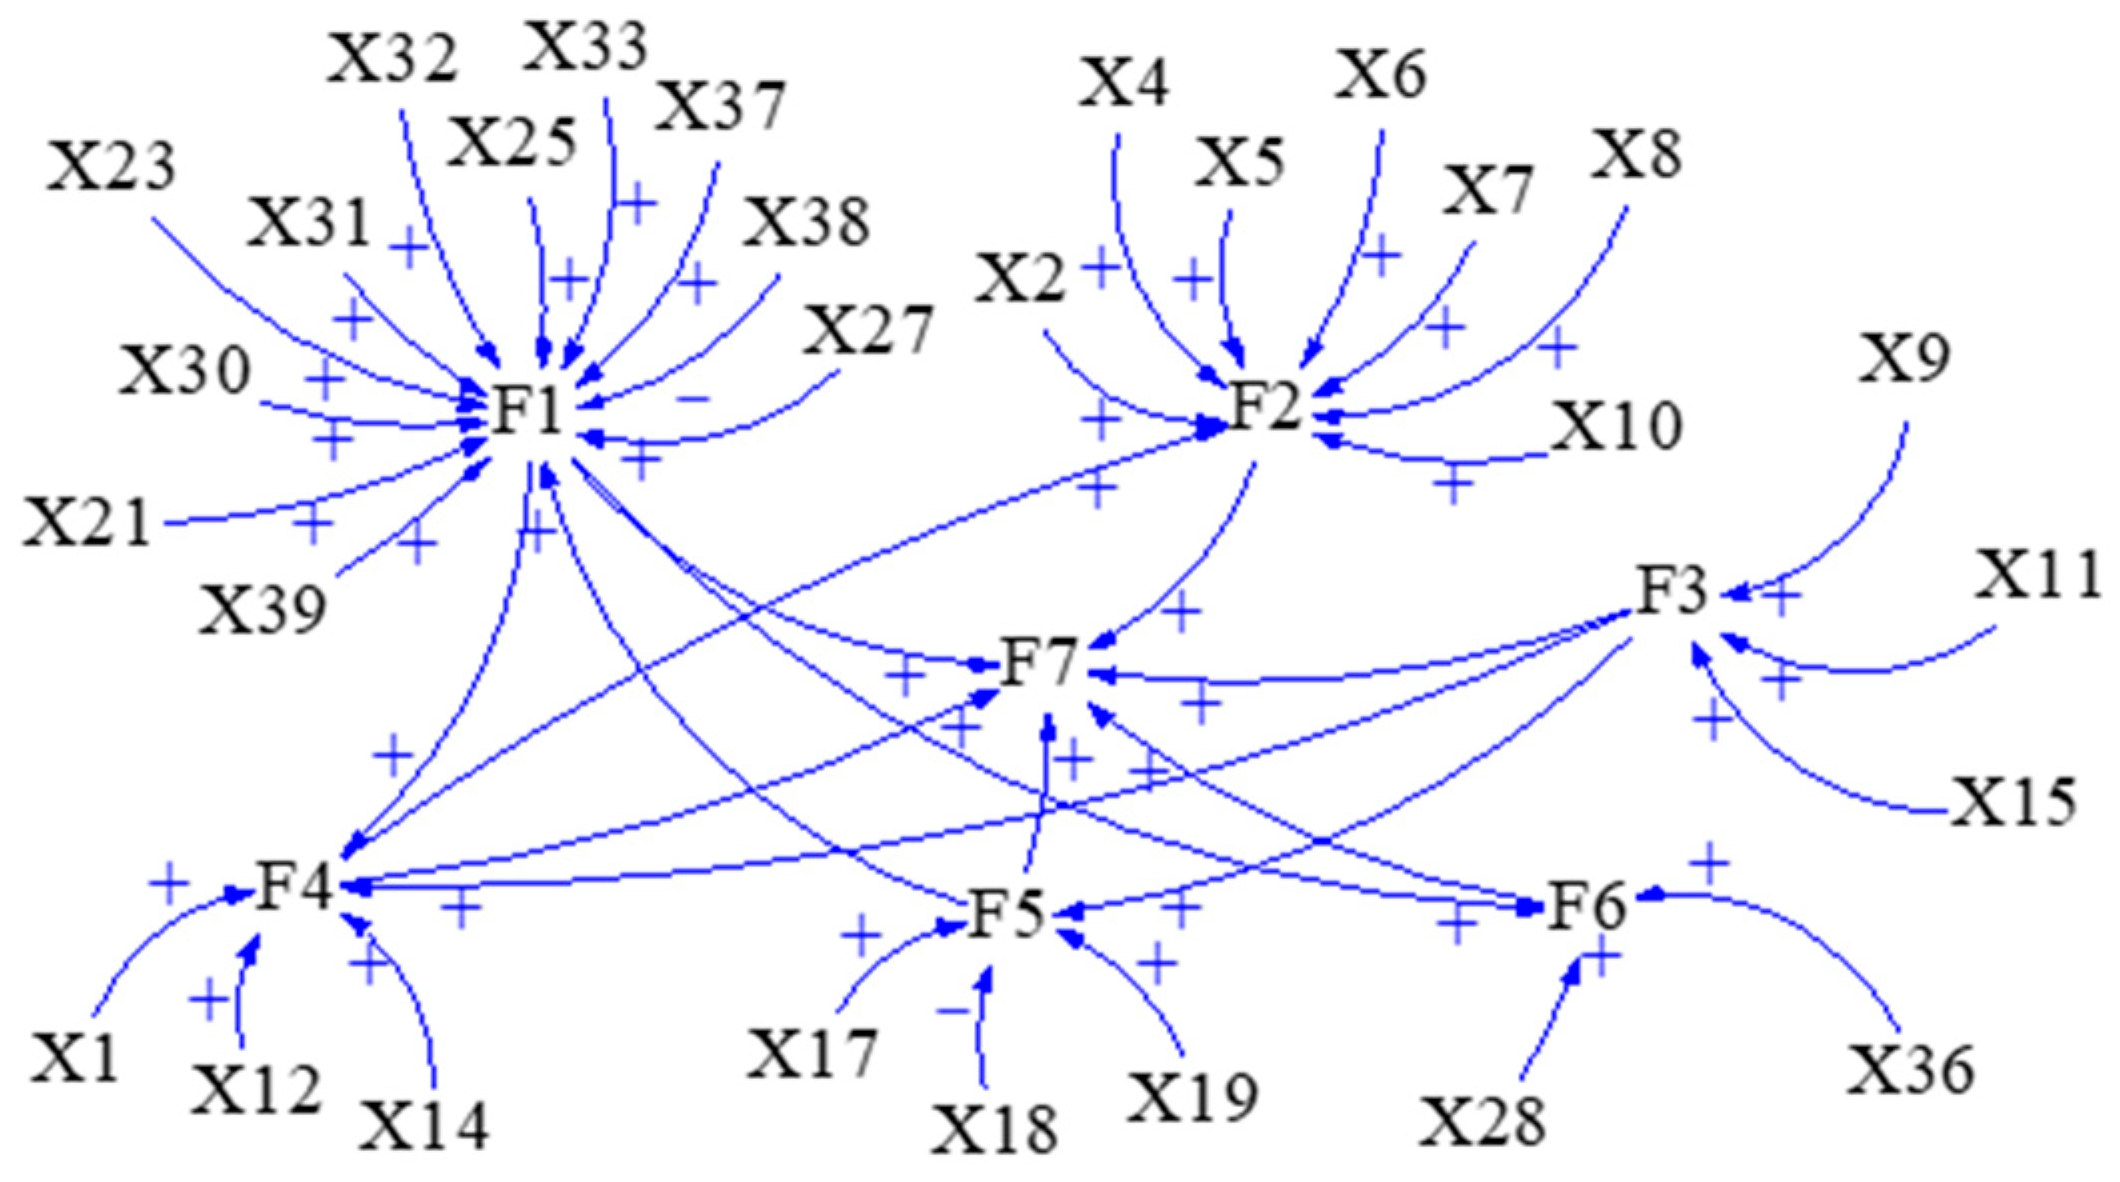
Based on the structural equation model of Figure 3 and Figure 4, the positive and negative correlations between SD models and subsystems which are shown in Table 8, the cause–effect diagram of the SD model is established (as shown in Figure 5), which provides the basis for drawing the stock–flow diagram and determining the model equations and parameters.
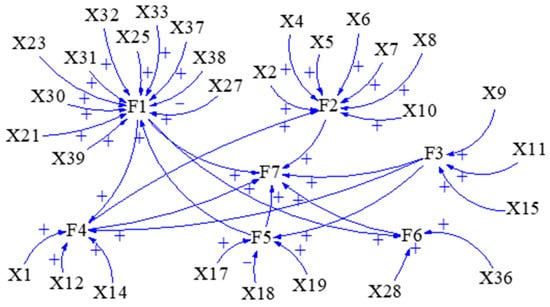
Figure 5.
The cause–effect diagram of SD model.
3.5. Stock–Flow Diagram
3.5.1. Setting Variables in the System
Before drawing the flow diagram, it is necessary to clarify the variables in the system, which are classified into state variables, rate variables and constants, as shown in Table 9. The state variable in the table refers to the accumulation effect of the description system, reflecting the stock formed by the change of material flow or information flow over time. The rate variable refers to the change in the amount of stock per unit time.
Table 9.
Variables in the SD model.
3.5.2. Drawing the Stock–Flow Diagram
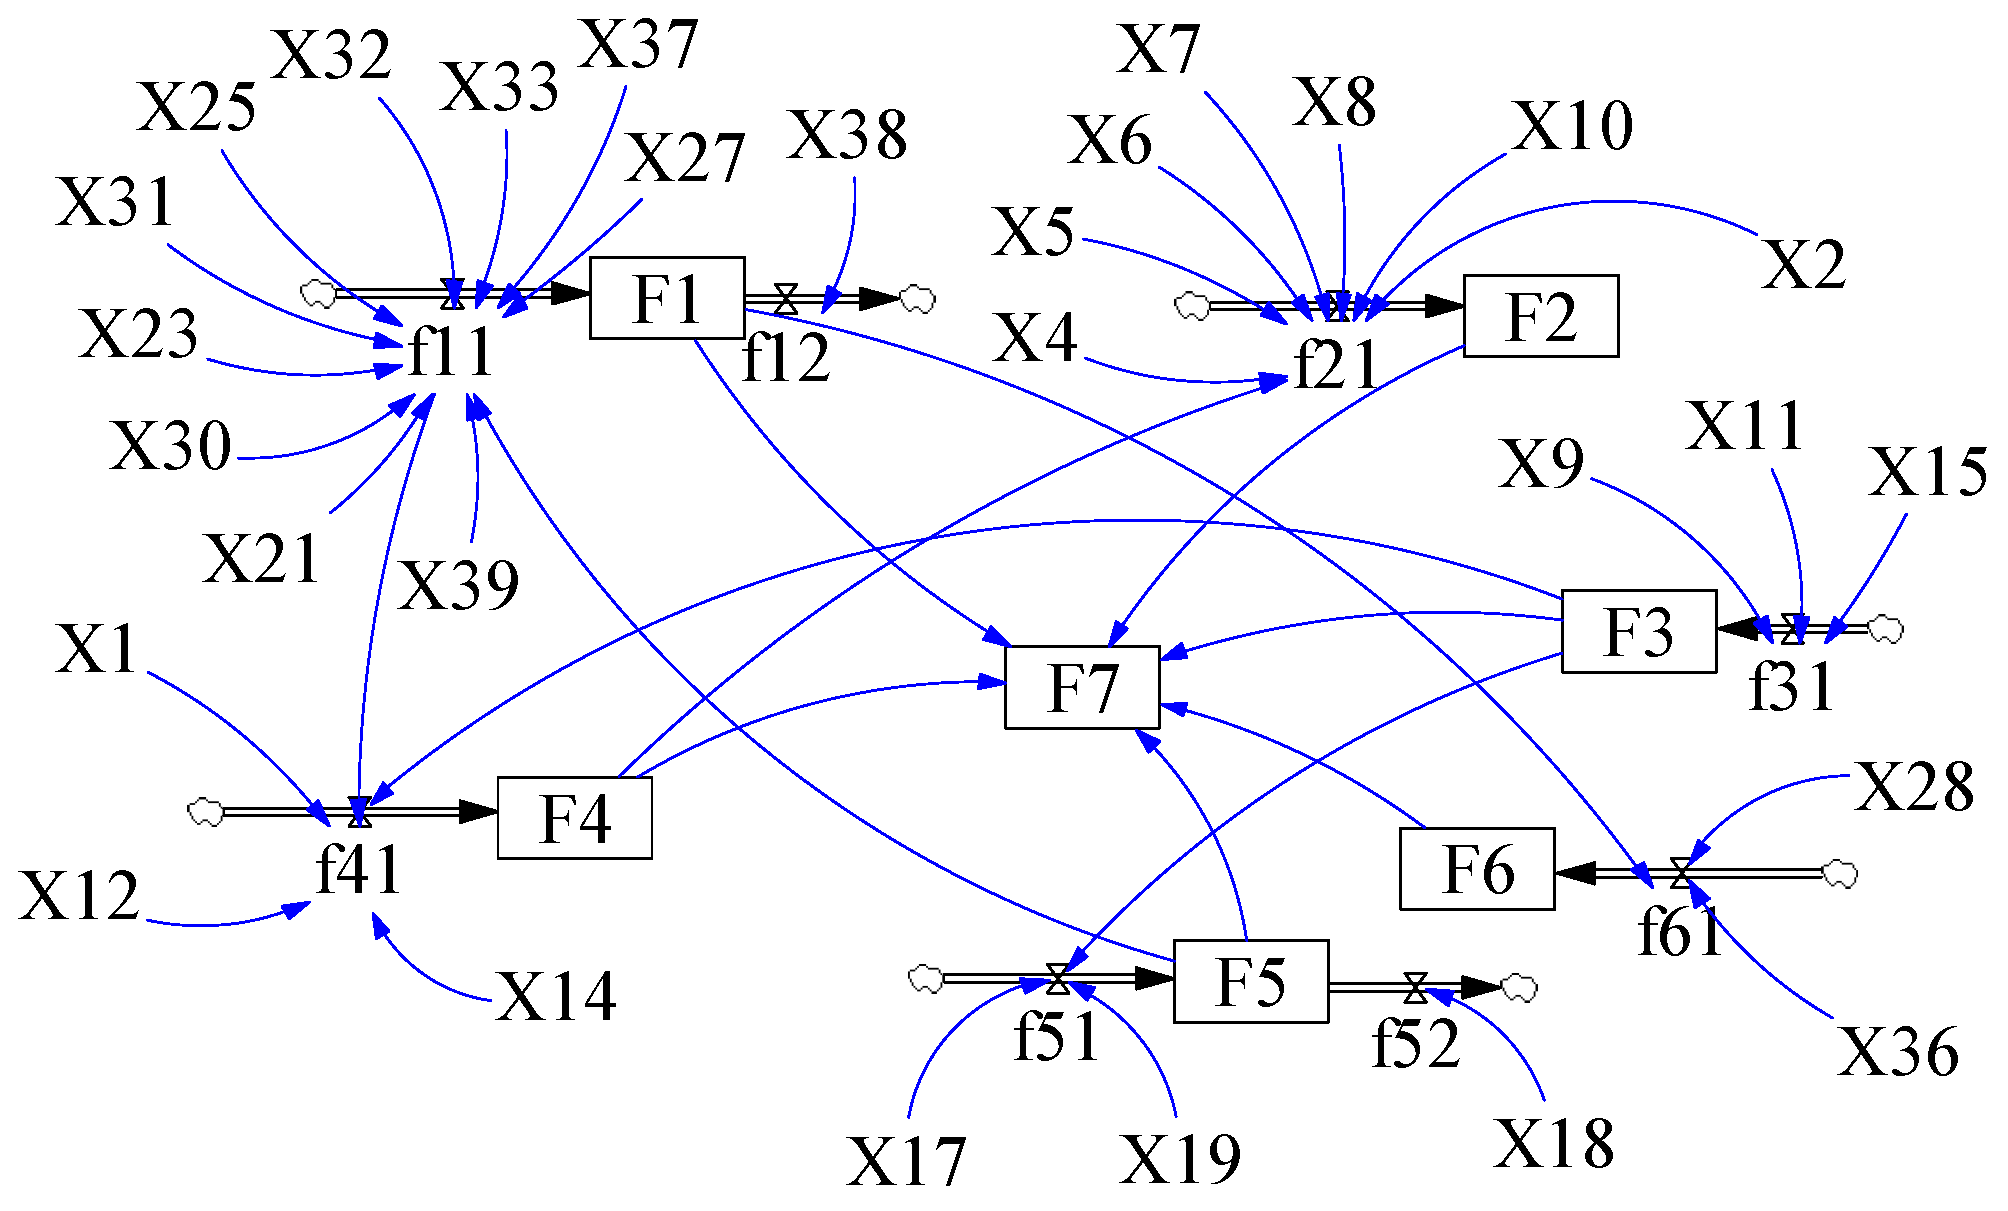
According to the cause–effect diagram in Section 3.2, combined with the set variables and six subsystems, the stock–flow diagram of SD model is drawn as shown in Figure 6.
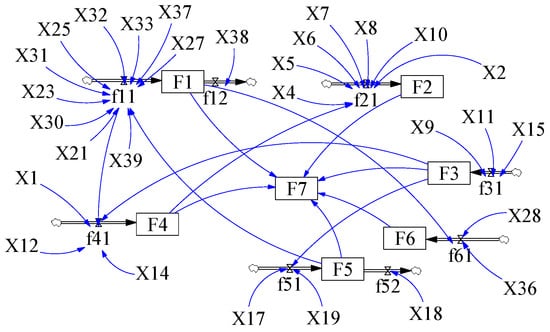
Figure 6.
The stock–flow diagram of SD model.
3.6. Model Equation Setting
3.6.1. Weight Value and Mathematical Equation Determination
The relevant influence coefficients and weight values in the SD model are calculated based on the path coefficients and factor loads in the SEM. According to the second-order confirmatory factor analysis model, the weights of the relevant indicators are calculated using path coefficients to determine the weight coefficients (Fi) for each indicator. The formula is as follows:
ki represents the path coefficients of the six primary latent variables, and the denominator denotes the sum of the path coefficients of these six primary latent variables.
The weights of the state variables and constants in Table 10 provide a reference for determining the model equations. The mathematical equations in the SD model are shown in Table 11, where the initial value and unit of each subsystem are set to NA and Undefined, respectively.
Table 10.
The weight of variables in the system model.
Table 11.
Equation function.
The paper takes F2 as an example of the formulation method for the equation functions in Table 11 which is as follows:
| F2 = f21 variation + F2 initial value + F4 impact variable × 0.38 |
| f21 variation = X2 × 0.126 + X4 × 0.148 + X5 × 0.159 + X6 × 0.155 + X7 × 0.155 + X8 × 0.147 + X10 × 0.11 |
| F2 initial value = 0 |
3.6.2. Parameter Value Determination
The parameter values used in this chapter come from the data obtained from the questionnaire survey. The calculation method of the parameter value of the state variable is obtained by multiplying the constant parameter value and its weight in each subsystem, and then adding them together. For example, the F3 parameter value = X9 (weight × parameter value) + X11 (weight × parameter value) + X15 (weight × parameter value). Meanwhile, the parameter value of the set constant is the sum of the mean statistics and mean error of the measurement index (influencing factor). Therefore, parameter values in the model are shown in Table 12.
Table 12.
Parameter values in the model.
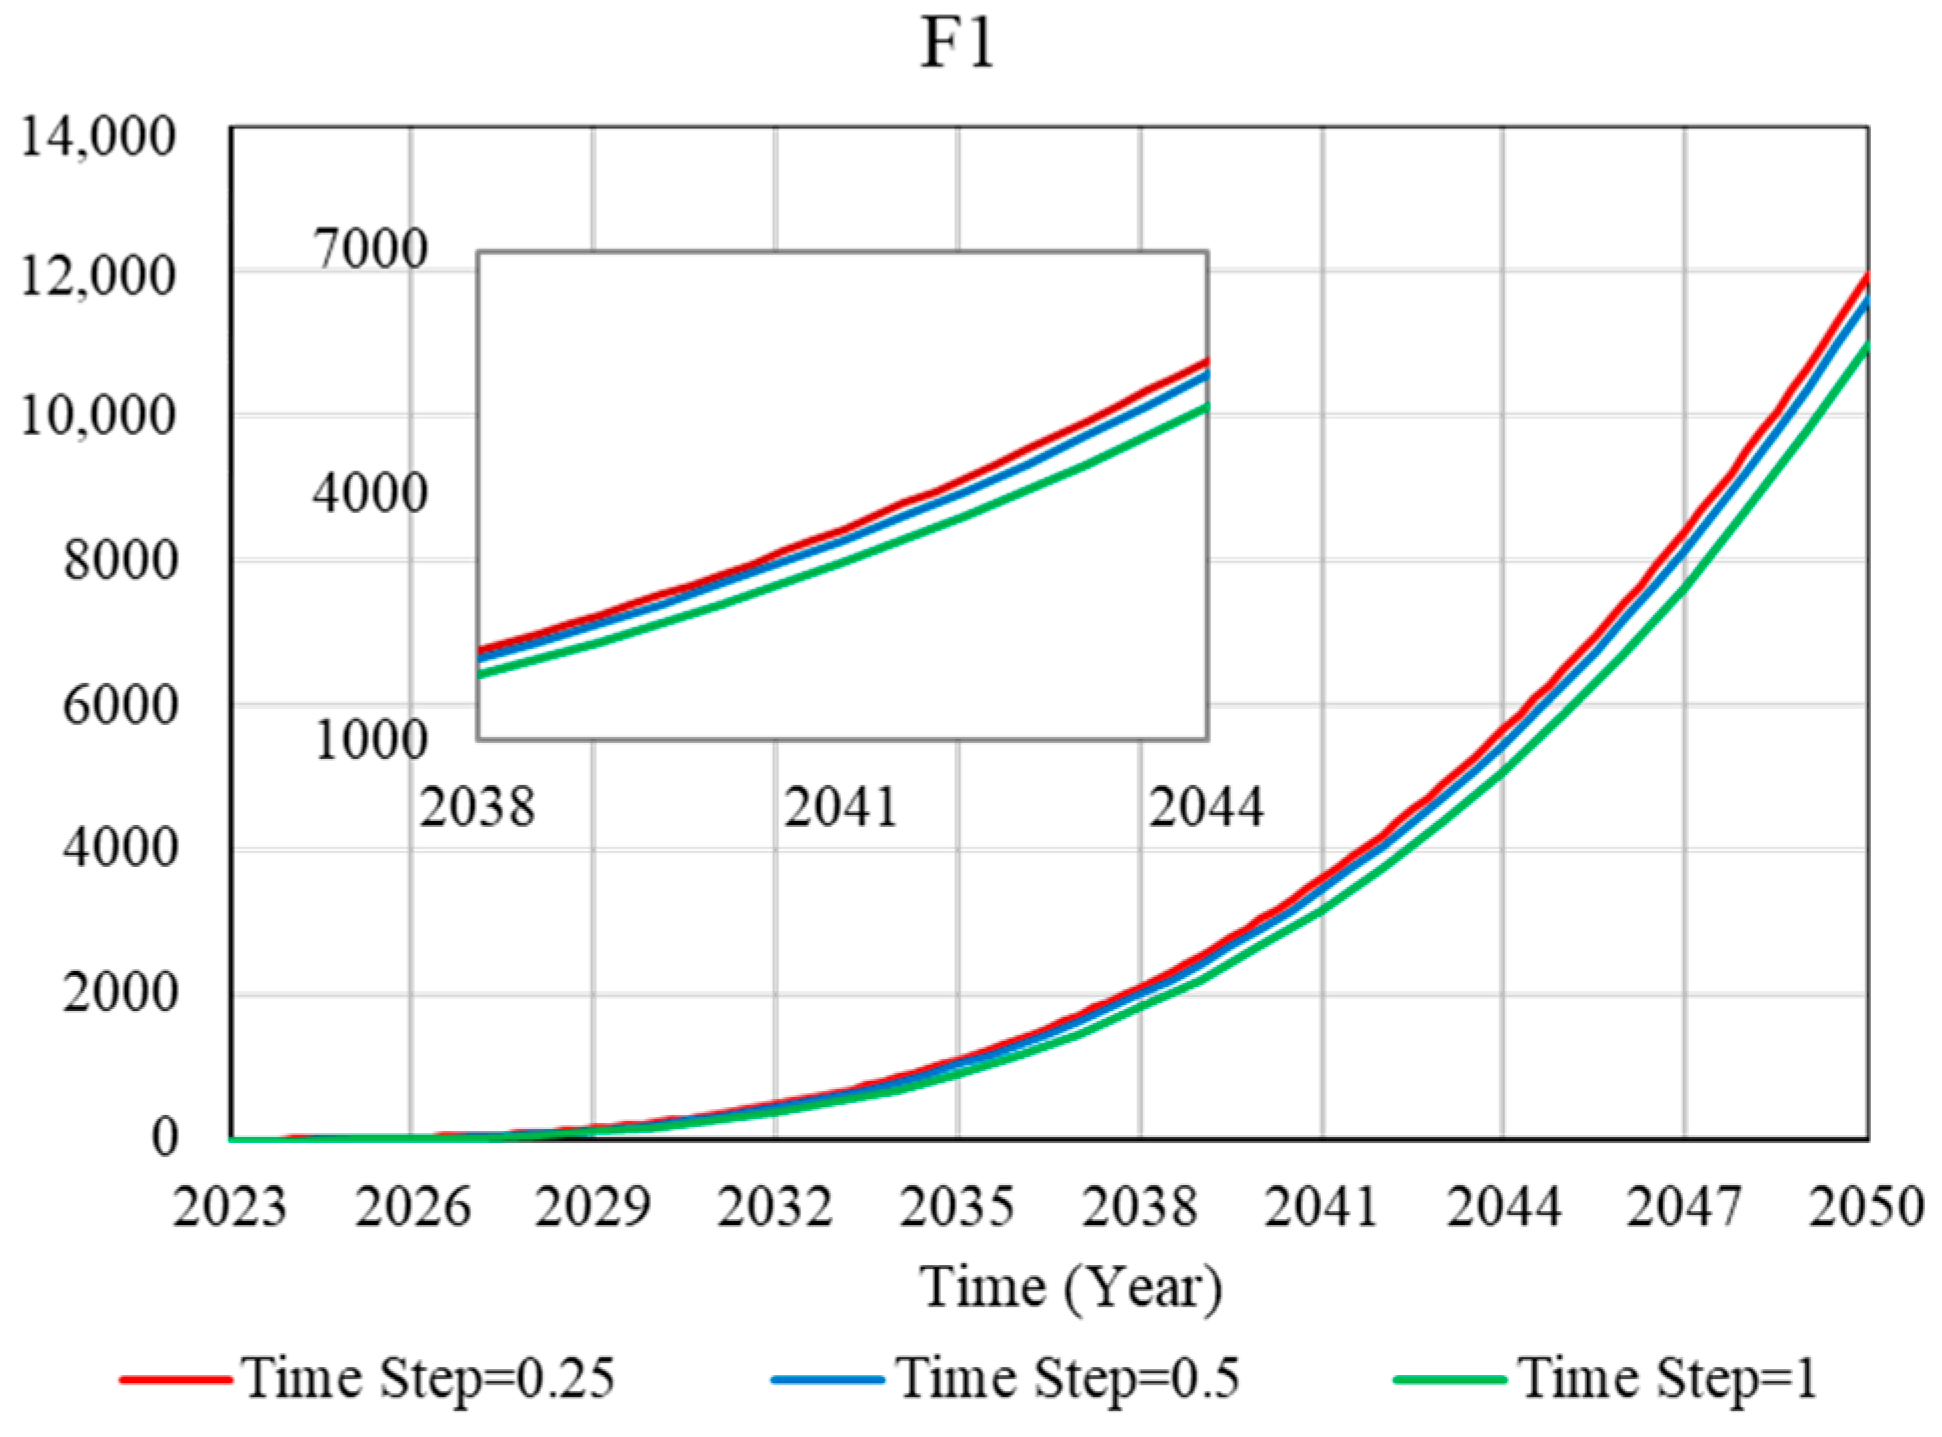
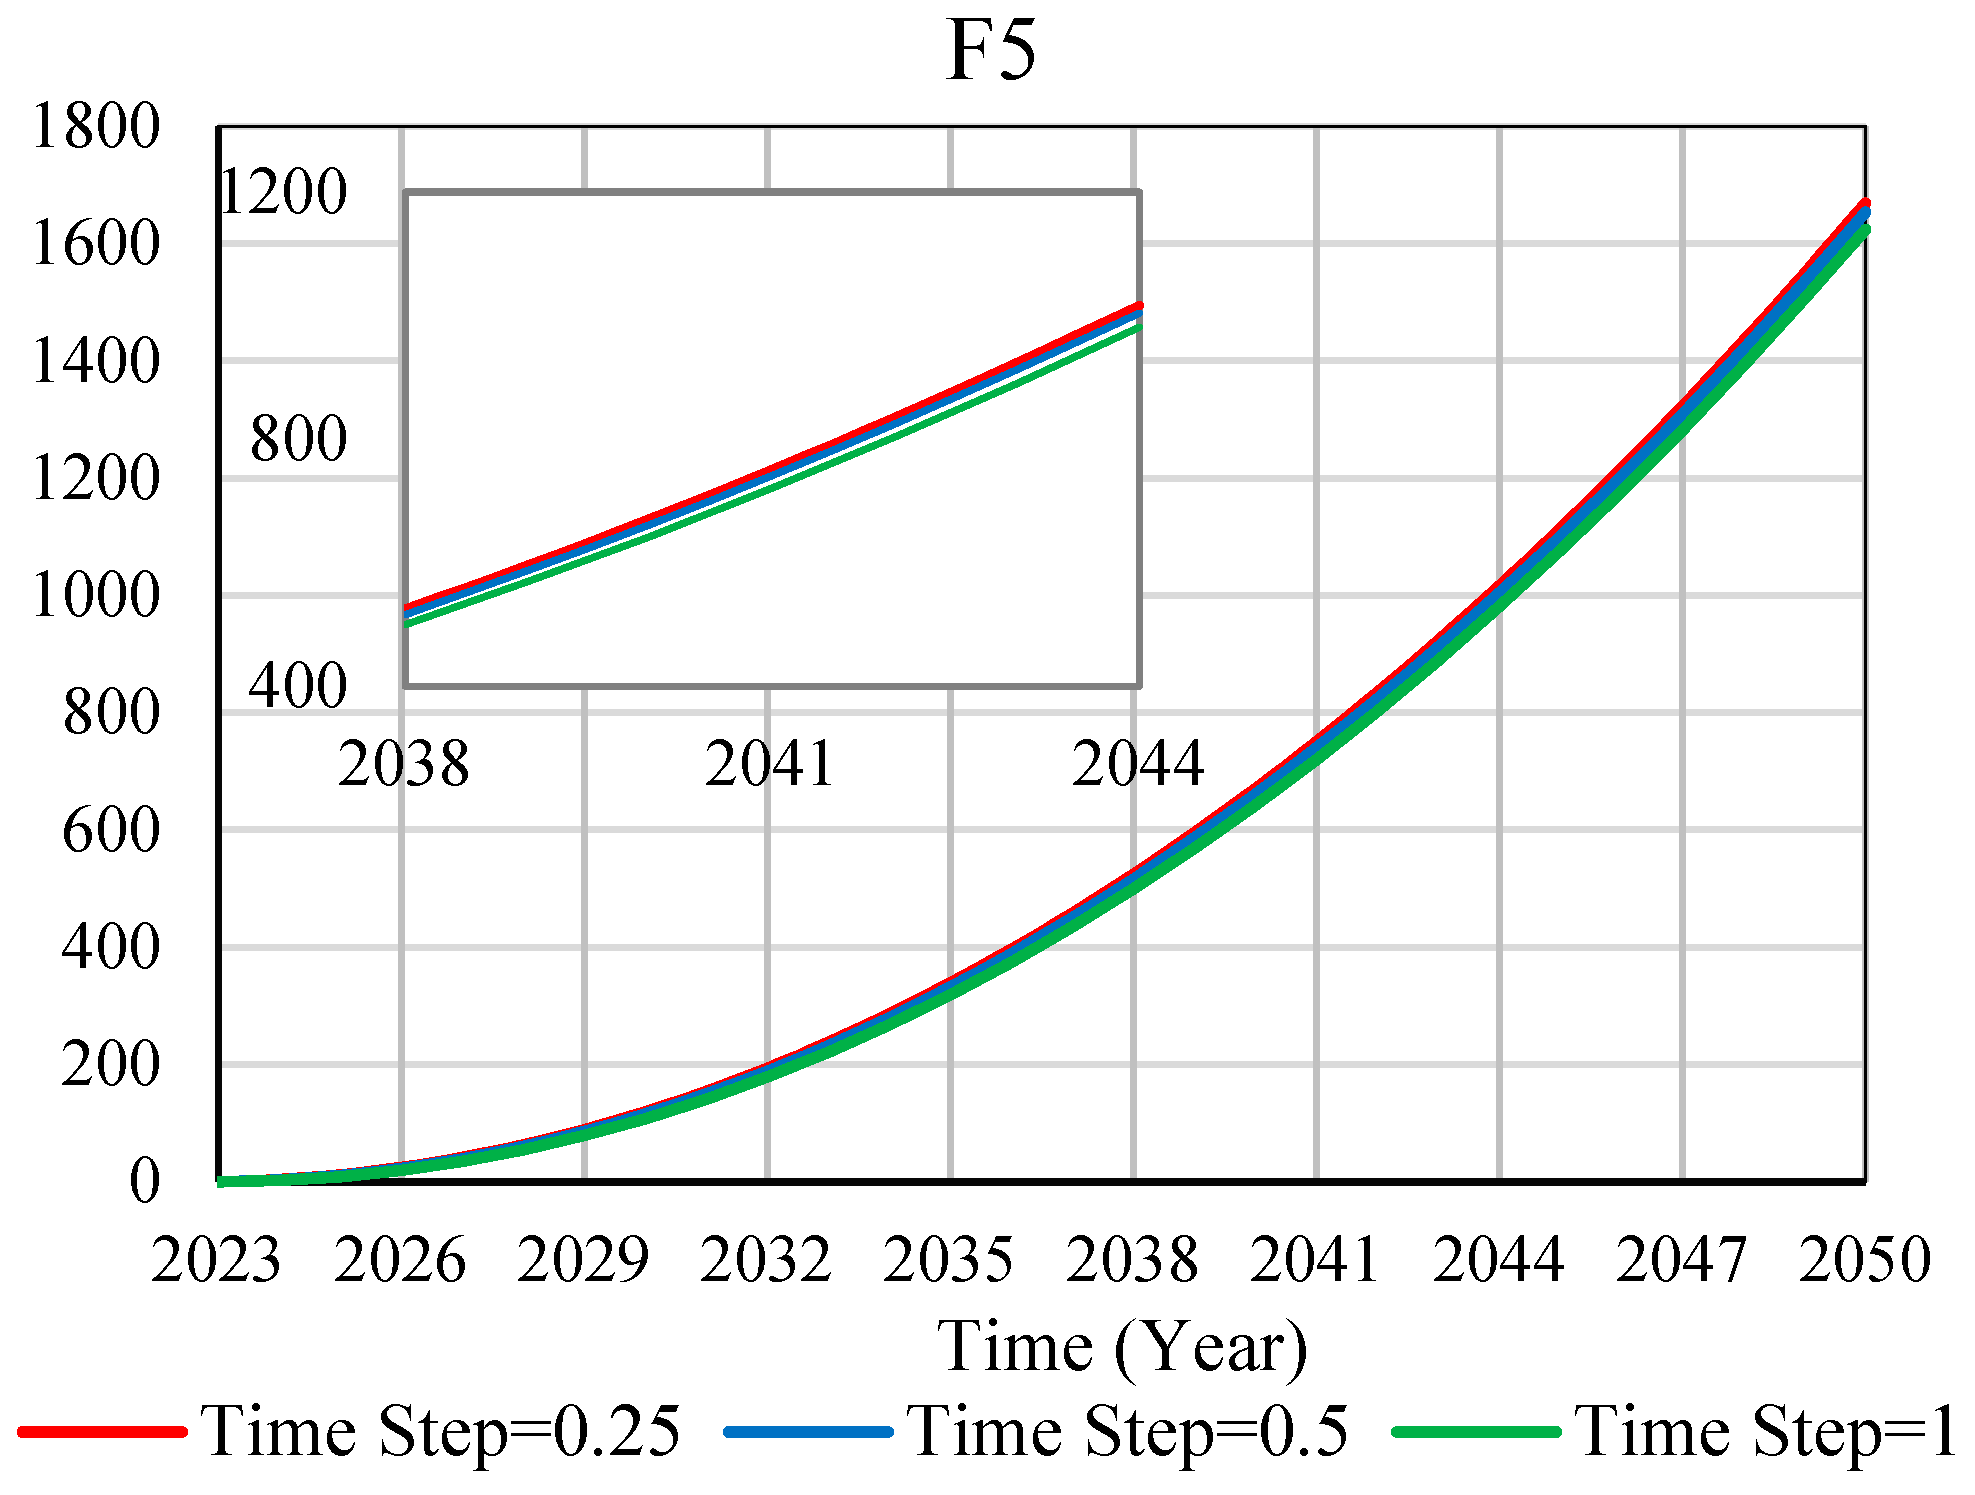
3.7. SD Model Stability Test
The stability test is to study the development trend of the curve in different situations and the stability of the fitting situation under different situation settings. The subsystem of BIM and new-generation information technology integration (F1) and the subsystem of the reality of the construction process (F5) are tested. Three different step sizes are set for them, namely 0.25, 0.5, and 1. The time unit of the test is the year, and the time interval starts from 2023 to 2050. The development trends of the two subsystems at different step lengths are highly consistent, indicating that the system has good stability (as shown in Figure 7).
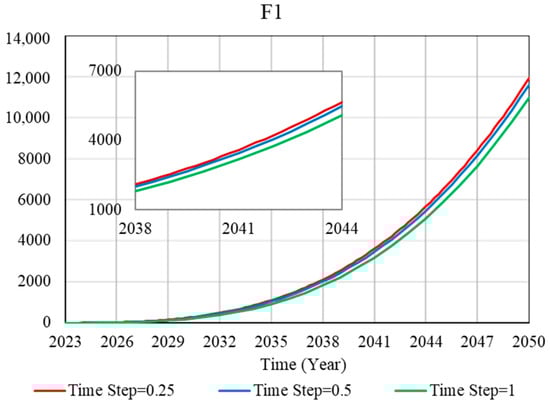
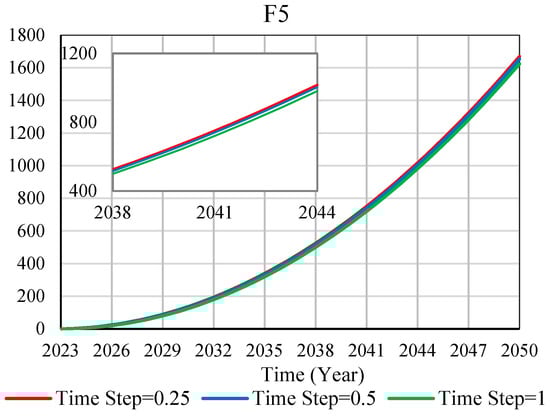
Figure 7.
Stability test.
4. Dynamic Simulation Predictive Analysis
The SD model is tested using Vensim DSS, and the simulation results are analyzed. The SD model is set as follows: INITIAL TIME = 2023, FINAL TIME = 2050, TIME STEP = 1, Units for Time: Year. The set model parameters are substituted into the corresponding mathematical equations to observe the dynamic changes and development of each subsystem and SD model.
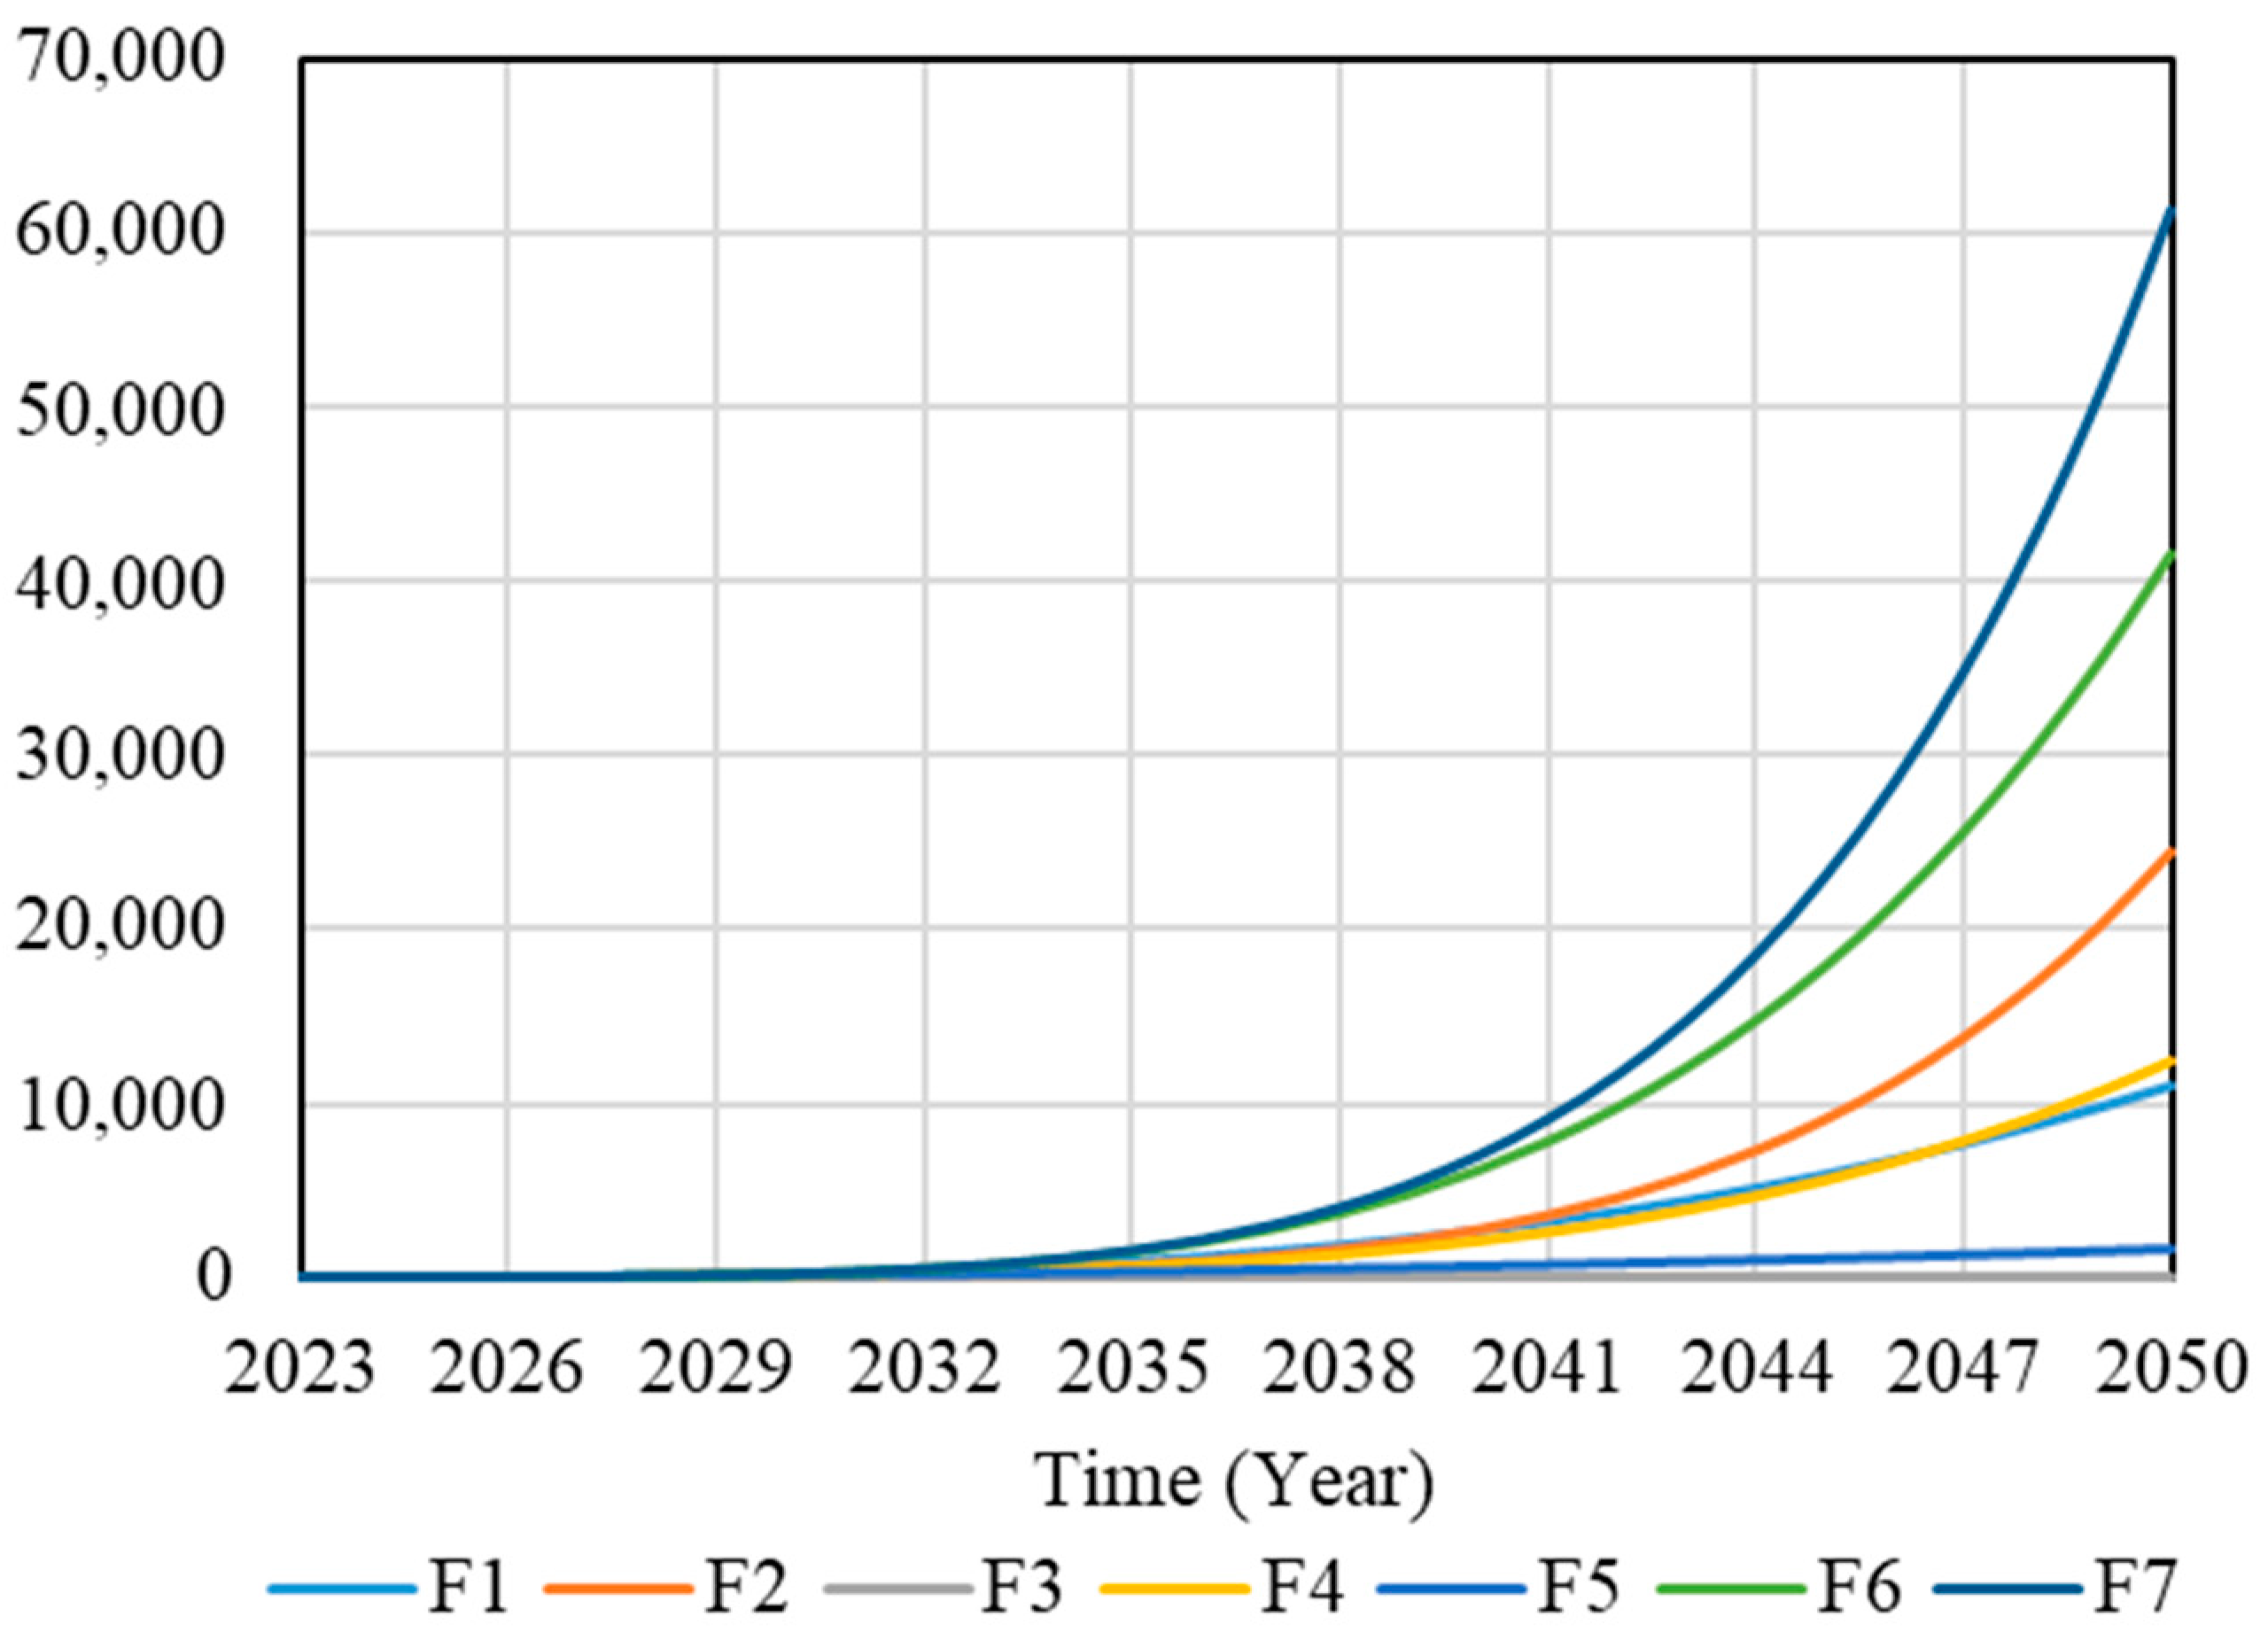
4.1. Evolution Trend of the System Dynamics Model
The dynamic simulation prediction of the established SD model of the application and development of BIM and the new-generation information technology (F7) and subsystems (F1-F6) in the construction industry is carried out within a set time period, as shown in Figure 8. F7 is a common index of F1-F6, and it can be seen from Figure 4 that the SD model of F7 includes the SD model of F1-F6 subsystems. According to Figure 8, as the abscissa time series advances, the corresponding ordinate effect value also gradually increases. The expression presented is an exponential growth generated by the positive feedback structure, and its growth trend is that the first growth is slower. The effect presented is still not obvious when it reaches 2033, indicating that the application of this technical means is not yet mature. However, every three years after 2035, the effect value will increase by multiples, which means that the application and development of technology at this time show a trend of rapid development. To sum up, the overall development trend of the F1-F6 subsystem and the F7 SD model during 2023–2050 is consistent, indicating that the application of BIM and the new generation of information technology is conducive to the transformation and development of the construction industry.
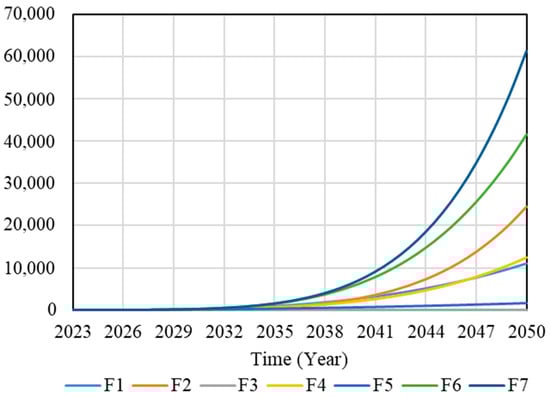
Figure 8.
SD model dynamic simulation curve.
4.2. Sensitivity Analyses under Different Scenarios
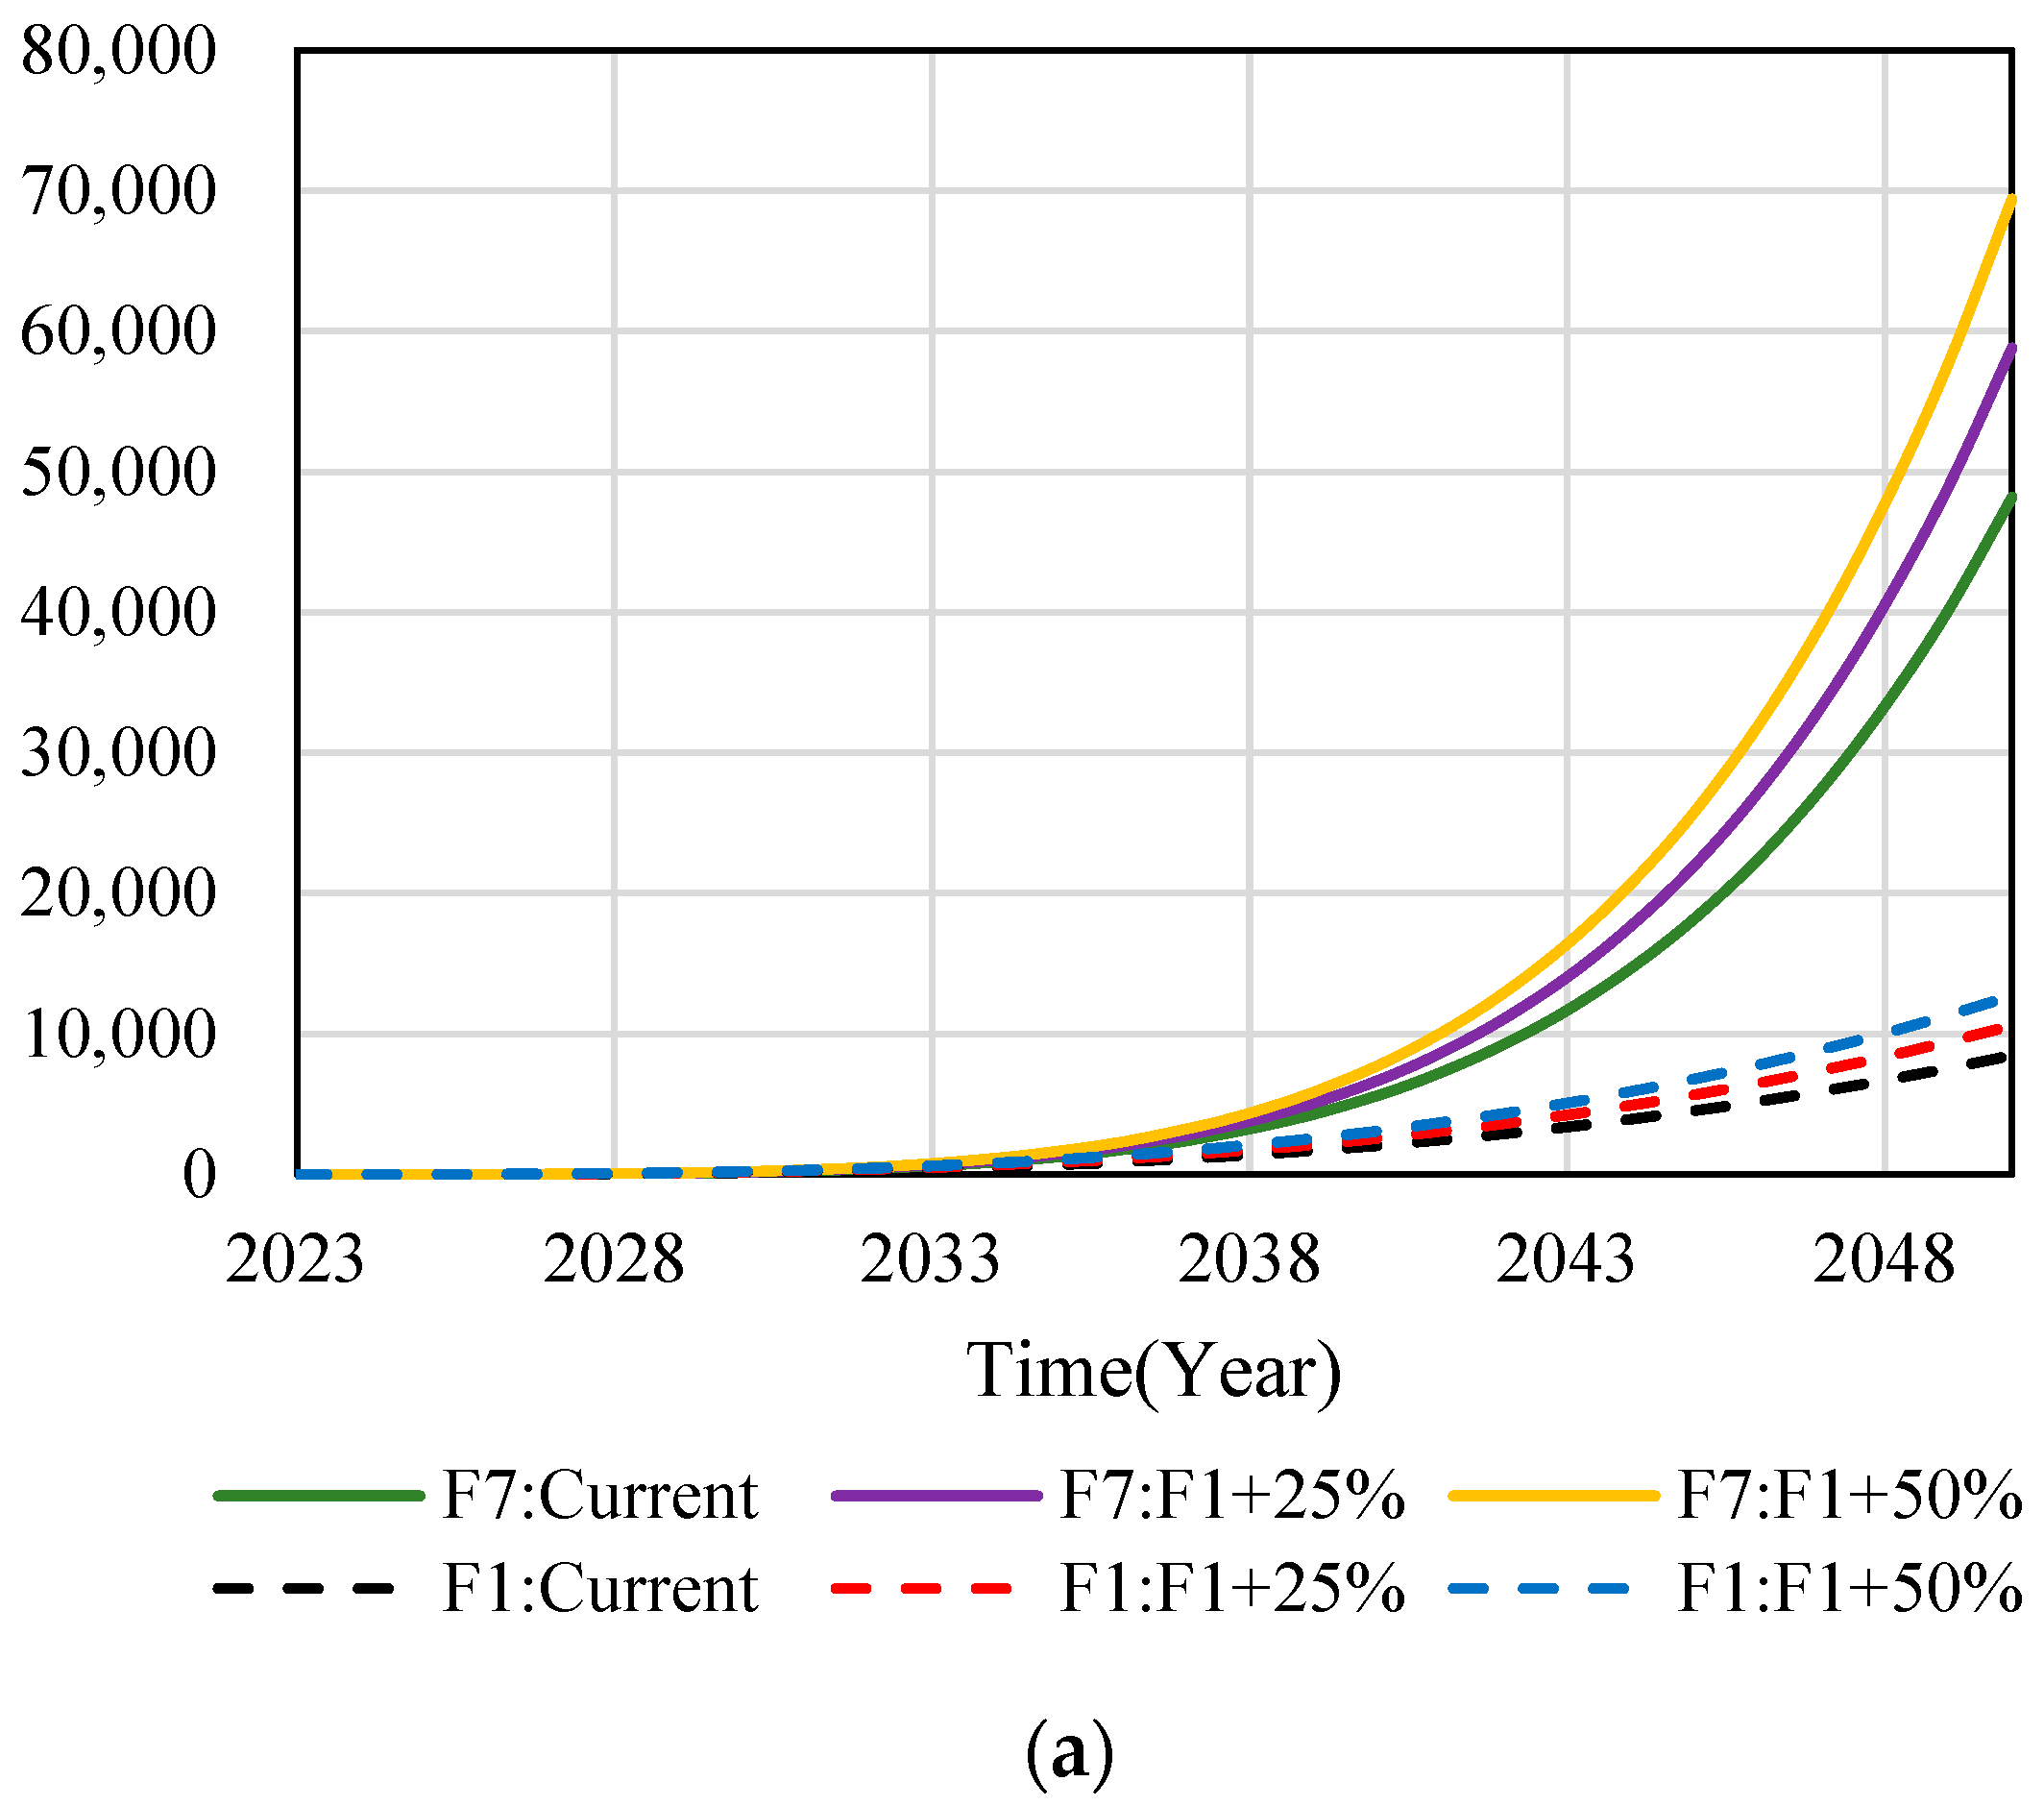
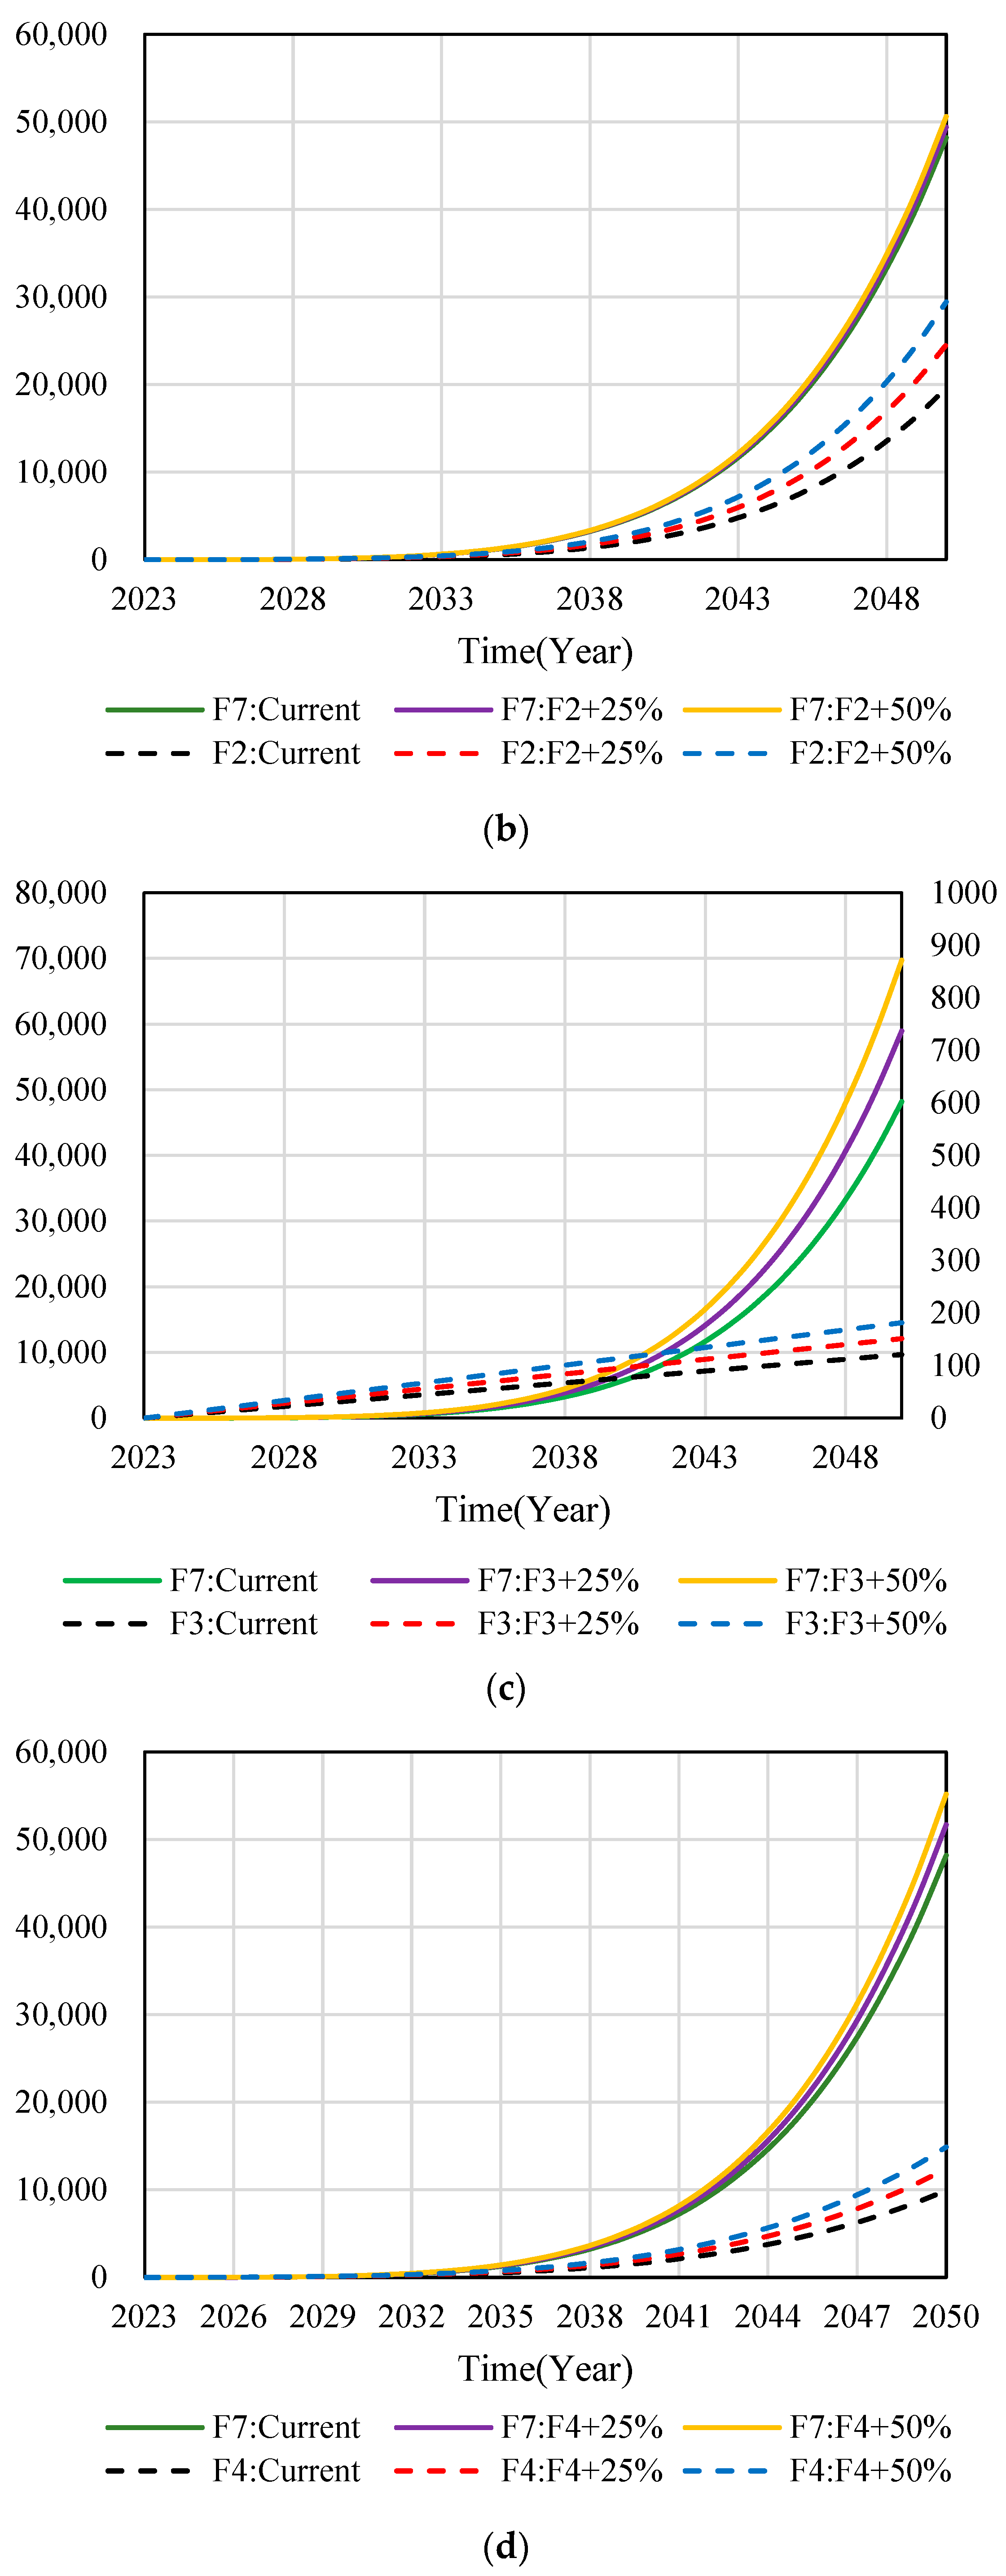
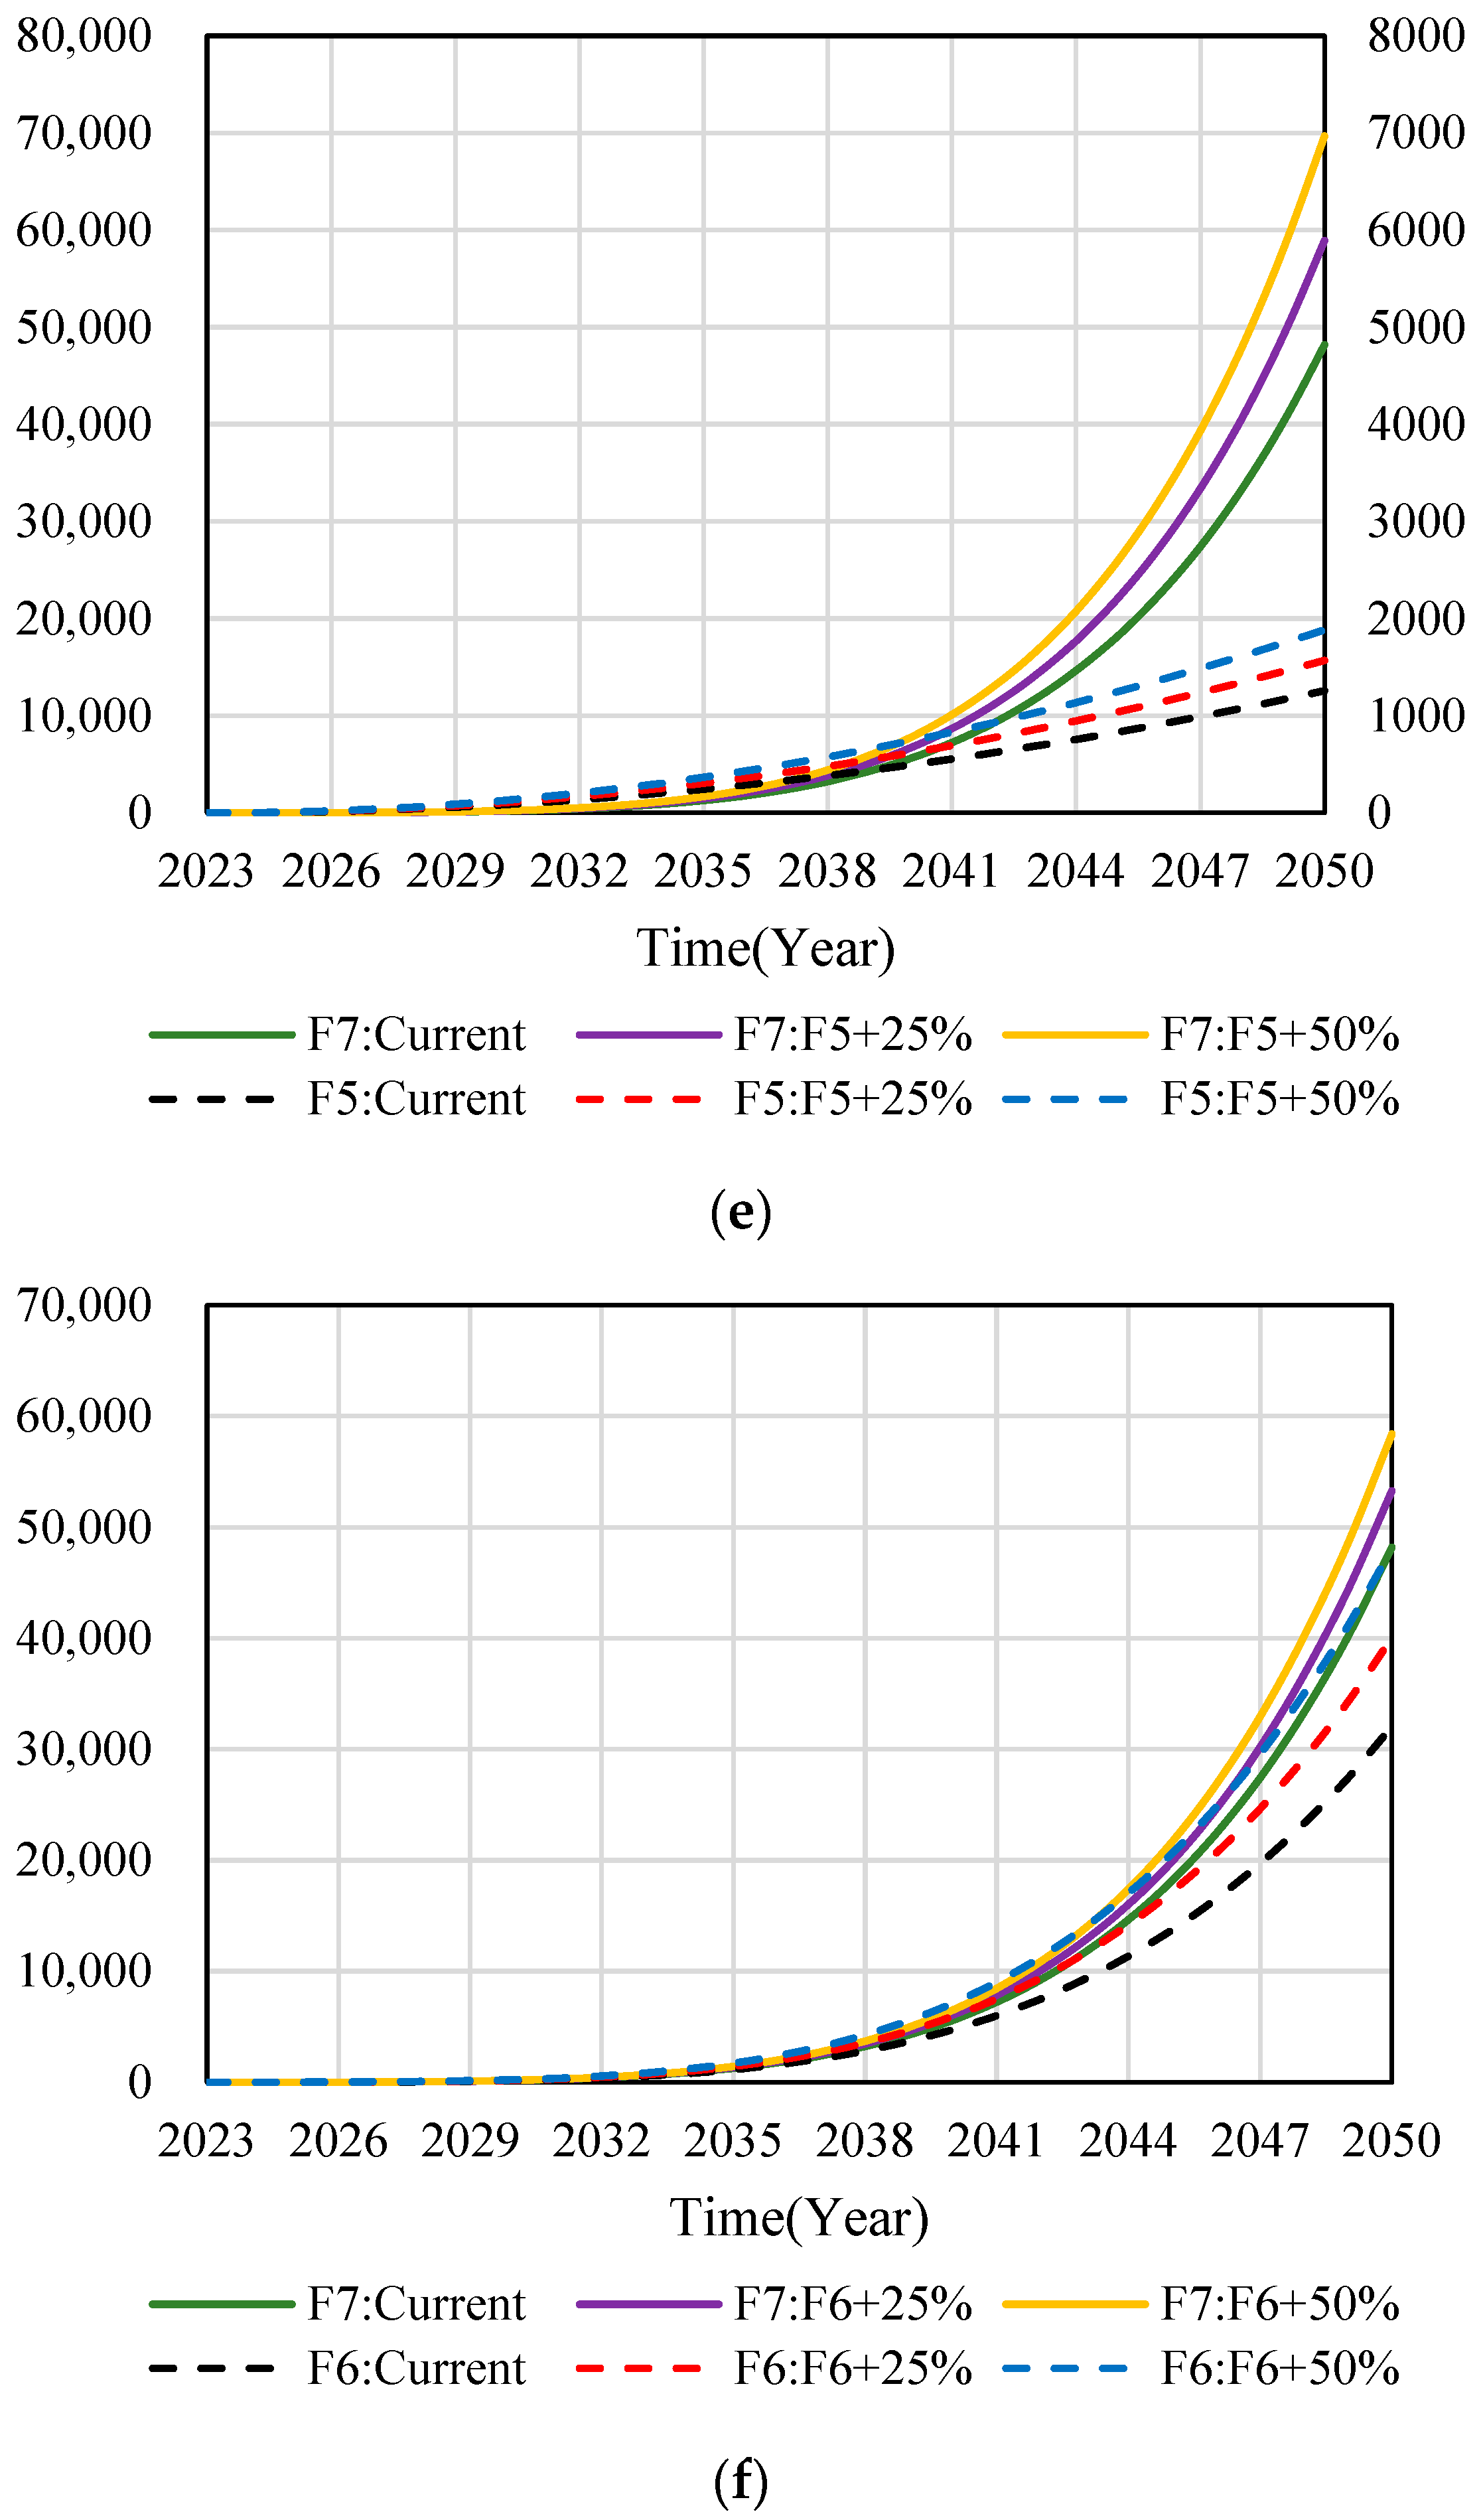
Sensitivity analysis is an effective evaluation method to study the sensitivity of simulation results of a SD model when parameters or conditions change. Through changing the mathematical equations in the subsystems, the changes of the dynamic simulation curves are shown in Figure 9:
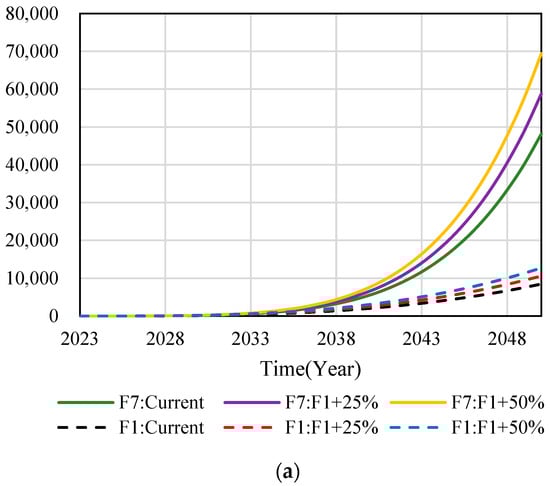
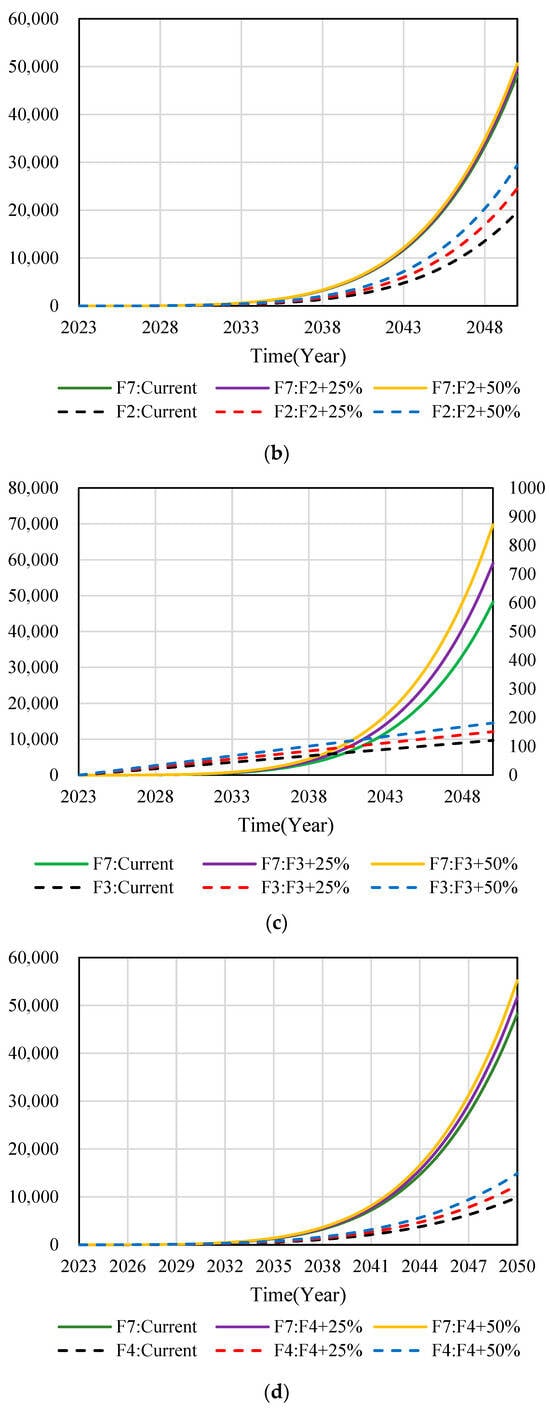
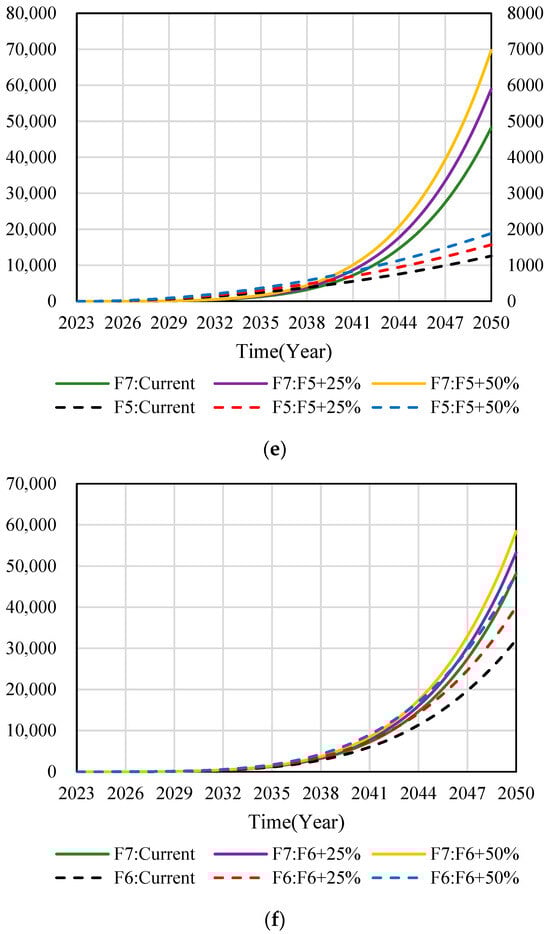
Figure 9.
SD model sensitivity analysis. (a) Changes of simulation curve with adjusting F1. (b) Changes of simulation curve with adjusting F2. (c) Changes of simulation curve with adjusting F3. (d) Changes of simulation curve with adjusting F4. (e) Changes of simulation curve with adjusting F5. (f) Changes of simulation curve with adjusting F6.
The mathematical equations of F1-F6 subsystems are improved by 25% and 50%, respectively, when comparing their development trends with the current state of the subsystems, and comparing the adjusted subsystem model equations with the development trends of the F7 SD model. According to Figure 9, the dotted curves in Figure 9 represent the development status of the F1-F6 subsystem model and the dynamic simulation prediction of the adjusted development trend. The solid line curves represent the development status of the F7 SD model and the dynamic simulation prediction of the development trend of each subsystem after adjustment.
From the evolution of the dotted curves in Figure 9a,b,d,f after improving F1, F2, F4 and F6 subsystems by 25% and 50%, it is found that their predicted development trends are consistent, and the corresponding effect value increases with the enhancement of the subsystem. At the same time, it can be seen from the evolution law of the solid line curve that the adjusted F1, F2, F4, and F6 subsystem models maintain a similar growth pattern between 2023 and 2038. However, with the evolution of time between 2038 and 2050, the effect value of the subsystem also changed greatly, indicating that F1, F2, F4, and F6 subsystems all have important influences on the SD model of F7.
The dotted and solid curves in Figure 9c,e correspond to the left and right ordinate axes, respectively. From the development law of the dotted curves in Figure 9c,e, after improving the F3 and F5 subsystems by 25% and 50%, it is found that their predicted development trends are consistent, and with the enhancement of subsystems, the corresponding effect value increases, approximately showing a linear growth trend. At the same time, it can be seen from the development law of the solid line curve that the adjusted F3 and F5 subsystem models maintain a similar growth law between 2023 and 2041. However, with the evolution of time between 2041 and 2050, the effect value of the subsystem also changed greatly, indicating that both F3 and F5 subsystems have important influences on the SD model of F7.
To sum up, the changes of the dotted curve in Figure 9 represent the comparison between the adjusted subsystem model and the current status of the subsystem, which verifies that the development trend of the adjusted subsystem model is consistent with the simulation curve of the current status of the subsystem. Meanwhile, the changes of the solid line curve in Figure 9 represent the comparison between the adjusted subsystem and the SD model of F7, and it can be concluded that the impact of each subsystem on the SD model of F7 is positively correlated and has an important influence.
5. Conclusions and Prospect
This paper constructs a system dynamics model (F7 SD model), combined with system dynamics theory and structural equation model, for the application and development of BIM and new-generation information technology in the construction industry. After the stability test of the constructed system dynamics model, the evolution trend of the system dynamics model and the sensitivity analysis under different scenarios are carried out. The results show the following:
- The data collected through questionnaire surveys indicate that the majority of the respondents hold a positive attitude towards the application of intelligent construction technology in the field of construction. They believe it can protect and enhance productivity, reduce construction time, and decrease carbon emissions.
- Using Vensim DSS, the SD model (F7) of the application and development of BIM and the new generation of information technology in the construction field and the causality diagram, stock flow diagram, model parameters, and mathematical equations of the six subsystems are established.
- Through the stability test, different step sizes are set for the SD model. The development trend of the F1-F6 subsystem is highly consistent with that of the F7 system. Therefore, the SD model proposed in this paper has good stability.
- With the evolution of time (2023–2050), the corresponding effect values of the SD model constructed in this paper show an exponential growth trend. In the dynamic numerical simulation, the growth rate is slow before 2033, indicating that the application of the technical means is not yet mature. Since 2035, it has shown multiple growth states, which means that the technical application at this time shows a rapid development trend.
- Through the sensitivity test, the mathematical equations of F1, F2, F4, and F6 subsystems were increased by 25% and 50%, respectively. The effect values of the above subsystems and F7 system increased significantly, and showed an exponential growth trend after 2038. By increasing the F3 and F5 subsystems by 25% and 50%, respectively, the effect value growth of the F7 system is more significant than that of each subsystem, and after 2041, it shows an exponential growth trend. Therefore, intelligent construction technology has a good development prospect in the construction field.
The data collected in this paper are limited by region, time, and quantity. Therefore, it is suggested that the following research can adopt diversified data and use other computational technologies for deep mining analysis to verify the scientificity of the problem again.
Author Contributions
Y.W. and J.Z. contributed to the conception of the study, the development of the methodology. Y.W. and N.G. developed computer models, and simulated and analyzed data. J.Z. and F.S. contributed to the whole revision process. Y.W., J.Z., F.S. and N.G. wrote the manuscript. All authors have read and agreed to the published version of the manuscript.
Funding
This work was supported by the Ministry of Education of the People’s Republic of China [grand number IRT_16R67].
Data Availability Statement
The data presented in this study are available on request from the corresponding author. The data are not publicly available due to [privacy].
Conflicts of Interest
The authors declare no conflicts of interest.
References
- Xiao, S.; Dong, H.; Geng, Y.; Brander, M. An overview of China’s recyclable waste recycling and recommendations for integrated solutions. Resour. Conserv. Recycl. 2018, 134, 112–120. [Google Scholar] [CrossRef]
- Xie, H.; Wang, W. Exploring the spatial-temporal disparities of urban land use economic efficiency in China and its influencing factors under environmental constraints based on a sequential slacks-based model. Sustainability 2015, 7, 10171–10190. [Google Scholar] [CrossRef]
- Cheng, Z.; Hu, X. The effects of urbanization and urban sprawl on CO2 emissions in China. Environ. Dev. Sustain. 2023, 25, 1792–1808. [Google Scholar] [CrossRef]
- Chen, Y.; Yin, Y.; Browne, G.J.; Li, D. Adoption of building information modeling in Chinese construction industry: The technology-organization-environment framework. Eng. Constr. Archit. Manag. 2019, 26, 1878–1898. [Google Scholar] [CrossRef]
- Qiao, H.; Xu, J.R.; Zhang, S. Research on the Impact of Community E-commerce Value Creation Based on System Dynamics. Syst. Eng.-Theory Pract. 2023, 43, 2615–2631. [Google Scholar] [CrossRef]
- Yan, J.K.; Zheng, Z.; Zhou, Y.C.; Lin, J.R.; Deng, Y.C.; Lu, X.Z. Recent Research Progress in Intelligent Construction: A Comparison between China and Developed Countries. Buildings 2023, 13, 1329. [Google Scholar] [CrossRef]
- Chen, Y.; Wang, X.; Liu, Z.; Cui, J.; Osmani, M.; Demian, P. Exploring Building Information Modeling (BIM) and Internet of Things (IoT) Integration for Sustainable Building. Buildings 2023, 13, 288. [Google Scholar] [CrossRef]
- Lu, C.; Liu, J.; Liu, Y.; Liu, Y. Intelligent construction technology of railway engineering in China. Front. Eng. Manag. 2019, 6, 503–516. [Google Scholar] [CrossRef]
- Zhu, H.; Hwang, B.G.; Ngo, J.; Tan, J.P.S. Applications of smart technologies in construction project management. J. Constr. Eng. Manag. 2022, 148, 4022010. [Google Scholar] [CrossRef]
- Pan, Y.; Zhang, L. Integrating BIM and AI for smart construction management: Current status and future directions. Arch. Comput. Methods Eng. 2023, 30, 1081–1110. [Google Scholar] [CrossRef]
- Wang, Y.; Wang, Z.; Ma, T.; Li, G.; Tie, H. Research on the Realization Path of Railway Intelligent Construction Based on System Engineering. Sustainability 2022, 14, 6945. [Google Scholar] [CrossRef]
- Syafiq, M.; Purwoko, A. Integrated structural equation modeling and causal steps in evaluating the role of the mediating variable. MethodsX 2022, 9, 101777. [Google Scholar] [CrossRef] [PubMed]
- Mia, M.M.; Zayed, N.M.; Islam, K.M.A.; Nitsenko, V.; Matusevych, T.; Mordous, I. The Strategy of Factors Influencing Learning Satisfaction Explored by First and Second-Order Structural Equation Modeling (SEM). Inventions 2022, 7, 59. [Google Scholar] [CrossRef]
- Olanrewaju, O.I.; Kineber, A.F.; Chileshe, N.; Edwards, D.J. Modelling the relationship between Building Information Modelling (BIM) implementation barriers, usage and awareness on building project lifecycle. Build. Environ. 2022, 207, 108556. [Google Scholar] [CrossRef]
- Zhang, W.; Chou, L.; Chen, M. Consumer perception and use intention for household distributed photovoltaic systems. Sustain. Energy Technol. Assess. 2022, 51, 101895. [Google Scholar] [CrossRef]
- Fontes, C.H.D.O.; Freires, F.G.M. Sustainable and renewable energy supply chain: A system dynamics overview. Renew. Sustain. Energy Rev. 2018, 82, 247–259. [Google Scholar]
- Bastan, M.; Zarei, M.; Tavakkoli-Moghaddam, R. A new technology acceptance model: A mixed-method of grounded theory and system dynamics. Kybernetes 2022, 51, 1–30. [Google Scholar] [CrossRef]
- Tang, Z.W.; Ng, S.T.; Skitmore, M. Influence of procurement systems to the success of sustainable buildings. J. Clean. Prod. 2019, 218, 1007–1030. [Google Scholar] [CrossRef]
- Shi, X.; Liu, Y.S. Energy Conservation and Emission Reduction Path of Public Buildings Based on System Dynamics. J. BEE 2023, 51, 137–144. [Google Scholar]
- Gao, P.; Li, S.; Zhao, X.; Hu, B. A study on shipowner’s behavior intention to cross dam by integrating SEM-SD model. Int. J. Model. Simul. Sci. Comput. 2023, 14, 2350041. [Google Scholar] [CrossRef]
- Ma, L.; Ma, X.; Zhang, J.; Yang, Q.; Wei, K. A Methodology for Dynamic Assessment of Laboratory Safety by SEM-SD. Int. J. Environ. Res. Public Health 2021, 18, 6545. [Google Scholar] [CrossRef]
- Albahri, A.S.; Alnoor, A.; Zaidan, A.A.; Albahri, O.S.; Hameed, H.; Zaidan, B.B.; Peh, S.S.; Zain, A.B.; Siraj, S.B.; Masnan, A.H.B.; et al. Hybrid artificial neural network and structural equation modelling techniques: A survey. Complex Intell. Syst. 2022, 8, 1781–1801. [Google Scholar] [CrossRef]
- Shenhar, A.J.; Dvir, D. Toward a typological theory of project management. Res. Policy 1996, 25, 607–632. [Google Scholar] [CrossRef]
- Jiao, Y.; Cao, P. Research on Optimization of Project Design Management Process Based on BIM. Buildings 2023, 13, 2139. [Google Scholar] [CrossRef]
- Celik, Y.; Petri, I.; Barati, M. Blockchain supported BIM data provenance for construction projects. Comput. Ind. 2023, 144, 103768. [Google Scholar] [CrossRef]
- Abdulfattah, B.S.; Abdelsalam, H.A.; Abdelsalam, M.; Bolpagni, M.; Thurairajah, N.; Perez, L.F.; Butt, T.E. Predicting implications of design changes in BIM-based construction projects through machine learning. Autom. Constr. 2023, 155, 105057. [Google Scholar] [CrossRef]
- Liu, D.; Wang, H.; Zhong, B.; Ding, L. Servitization in construction and its transformation pathway: A value-adding perspective. Engineering 2022, 19, 166–179. [Google Scholar] [CrossRef]
- Wang, L. Research on the Mechanism of Enhancing Sustainable Construction in Construction Enterprises from the Perspective of Green Innovation. Ph.D. Thesis, Dalian University of Technology, Dalian, China, 2021; pp. 84–90. [Google Scholar]
- Zhang, Z.H.; Zhang, J.H.; Liu, Z.H.; Zheng, Y.; Yang, M. Application standard of questionnaire survey in tourism research. Prog. Geogr. 2016, 35, 368–375. [Google Scholar]
- Hair, J.F.; Tatham, R.L.; Anderson, R.E.; Black, W. Multivariate Data Analysis; Prentice Hall: Upper Saddle River, NJ, USA, 1998. [Google Scholar]


Disclaimer/Publisher’s Note: The statements, opinions and data contained in all publications are solely those of the individual author(s) and contributor(s) and not of MDPI and/or the editor(s). MDPI and/or the editor(s) disclaim responsibility for any injury to people or property resulting from any ideas, methods, instructions or products referred to in the content. |
© 2024 by the authors. Licensee MDPI, Basel, Switzerland. This article is an open access article distributed under the terms and conditions of the Creative Commons Attribution (CC BY) license (https://creativecommons.org/licenses/by/4.0/).