Abstract
Formulations of structural optimization problems are proposed in this paper to automatically find the best grouping of columns in 3D steel buildings. In these formulations, the conflicting objective functions, minimized simultaneously, are the weight of the structure and the number of different groups of columns. In other words, the smaller the number of different groups of columns, the greater the weight of the structure, and the greater the number of groups, the smaller the structure’s weight. The design variables are the bracing system configuration, column cross-section orientation, and assigned W-shaped profile indices for columns, beams, and braces. The design constraints are the allowable displacements, strength, and geometric considerations. After solving the multi-objective optimization problem, the result is a Pareto front, presenting non-dominated solutions. Three evolutionary algorithms based on differential evolution are adopted in this paper to solve three computational experiments. Even if preliminary groupings of columns are adopted, considering architectural aspects such as the symmetry of the structure, it is possible to discover other interesting structural configurations that will be available to the decision maker, who will be able to make their choices based on the impacts on manufacturing, cutting, transporting, checking and welding.
1. Introduction
Designers often face issues that require extensive experience, especially when dealing with spatial frames designed with steel structures. For instance, selecting suitable bracing systems, aligning columns with their principal axes of inertia, and grouping columns for structural, aesthetic, and architectural purposes are all complex tasks. These definitions are generally challenging and involve a trial-and-error process, which can be costly and does not guarantee the achievement of the optimal structural design. In this sense, this paper proposes that all these aspects can be incorporated and formulated within the framework of structural optimization problems.
In the conceptual design of spatial structures, the height of the structure is extremely important in terms of the challenges to be considered, especially concerning the pronounced influence of wind action and the consequent horizontal displacements, global stability, and dynamic response. Bracing systems have emerged as a solution widely used by designers to solve these issues. However, selecting the most effective geometric arrangement is challenging due to the numerous options commonly adopted in the design of steel structures. Furthermore, the orientations of the main axes of inertia of the columns can directly affect the global behavior of the structure. This is also a challenging task for the designer to solve. Consequently, searching for the optimum configuration demands studies and complex analyses involving many design variables ranging from the best choice of bracing system, the best column orientations, and desirable architectural and aesthetic aspects, among many others. In the context of structural engineering, many studies have been carried out regarding bracing systems for steel space structures. Among them, several propose distinct approaches to consider the configuration of bracing systems as a design variable within the formulations of structural optimization problems. Noteworthy contributions in this regard include important works by various researchers, such as those referenced as [1,2,3,4,5,6,7].
In addition to aspects related to bracing systems, designing structures made up of bars, like trusses and frames, commonly involves considering the potential advantages of grouping members to meet the designer’s goals. These benefits may include architecture, manufacturing, transportation, assembly, and final checking. However, determining the optimal member grouping can be non-trivial, requiring significant design experience and leading to a costly and time-consuming trial-and-error process. Furthermore, achieving the best member grouping for the final design is not guaranteed even after optimization.
Some of the main works in the context of optimal groupings of structural elements were addressed by Grierson and Cameron [8], Biedermann and Grierson [9], Biedermann and Grierson [10], Biedermann [11], Galante [12], Shea et al. [13], Barbosa and Lemonge [14,15], Herencia and Haftka [16], Herencia et al. [17], Liu et al. [18], Angelo et al. [19], Carvalho et al. [20], Azad et al. [21], Woudenberg and Meer [22], and Turay et al. [23]. More details on these references can also be found in a recent work of Carvalho et al. [24].
A method for addressing the challenge of determining the optimal grouping of bars is to formulate it as a MOSOP, with conflicting objectives to minimize the weight of the structure and the different number of cross sections or profiles used in the optimized design. Galante [12] addressed this optimization problem for the well-known 10-bar truss by combining these two objective functions into a single-objective problem and obtaining a Pareto front (PF) using pairs of values ranging from 0 to 1 to weight the objectives. In contrast, Greiner et al. [25] applied two evolutionary algorithms such as the improved strength Pareto evolutionary algorithm (SPEA2) and the nondominated sorting genetic algorithm II (NSGA-II), to solve the MOSOP of a 55-bar planar frame. In addition, they conducted several analyses to investigate the algorithms’ mutation rates and convergence behavior.
Although the approach to finding the optimal grouping of members was briefly discussed earlier, it still needs to be fully explored, expanded, and applied to other structural optimization problems. Therefore, the main objective of this paper is to use the formulation and solution of MOSOPs to face the challenge of determining the ideal grouping of members of spatial steel frames, even if groupings based on symmetry, architectural, aesthetic aspects, and the designer’s experience are possible in the conceptual design of the structure. In this context, this paper proposes a formulation for a MOSOP that seeks to simultaneously minimize the total weight of the structure and the distinct number of assigned W-shapes to structural members. These objectives inherently present a conflict with each other.
Using a MOSOP to find the best member grouping of bars has several advantages over other strategies in the literature. These advantages can be summarized as follows: (i) The MOSOP addressed in this paper overcomes difficulties by solving a single optimization problem by using cardinality constraints to find the best member grouping (see complete details in [15], for example). (ii) Complex strategies involving dynamic section elimination or search space reduction during optimization are unnecessary. (iii) Analyzing the internal actions of members is unnecessary for grouping bars with similar structural behavior. (iv) The method may alleviate the designers from time-consuming and expensive trial-and-error processes in searching for the optimal member grouping, except in cases where symmetry is mandatory. (v) Finally, the method is straightforward and easily implementable using multi-objective evolutionary algorithms (MOEAs). Considering these aspects, the main contributions of this paper are as follows:
- We propose a formulation for a multi-objective structural optimization problem in which the structure’s weight and the number of distinct groups of columns in steel frames are the conflicting objective functions to be minimized simultaneously;
- We set the columns’ orientations, the indexes for W-shapes, and bracing systems configurations as the design variables;
- We use evolutionary algorithms based on differential evolution to find PFs with non-dominated solutions;
- We provide the decision makers with various structural configurations with different groups of columns, their respective orientations, and the best bracing systems to choose according to their preferences.
Despite the initial definition of groupings based on symmetry in the design, the potential exists to uncover alternative configurations that could capture the attention of decision makers involved in the manufacturing, cutting, transportation, checking, and welding processes. This work is a continuation of a study, in the same context, recently carried out on grouping truss bars using multi-objective structural optimization problem formulations recently proposed by Carvalho et al. [24]. This paper presents the results of three structural multi-objective optimization experiments conducted on 3D frames of varying dimensions. The first experiment involved a 6-story and 4-bay frame, the second a 10-story and 12-bay 3D frame, and the third a 12-story and 12-bay frame, each with a uniform story height of three meters. The design variables are divided into subsets of integer indexes concerning the bracing system configuration, the orientation of the cross section of the columns concerning the major and weak axes’ moment of inertia, and the indexes of the W-shaped commercial profiles assigned to the columns, beams, and bracer elements. The design constraints can be categorized into displacement, strength, and geometric.
Evolutionary algorithms that deal with multiple conflicting objectives are referred to as multi-objective evolutionary algorithms (MOEAs). These algorithms are designed to optimize solutions in a way that simultaneously considers multiple, often conflicting, objectives. MOEAs aim to find a set of solutions representing a trade-off between these conflicting objectives, known as the PF, allowing decision makers to choose the most suitable solution based on their preferences and requirements. Several MOEAs were proposed in the literature to solve MOSOPs. Recently, several works were addressed to solve structural optimization problems, such as those of Tejani et al. [26], Kumar et al. [27], Jafari et al. [28], Eid et al. [29], Khodadadi et al. [30], Jelovica and Cai [31], Kumar et al. [32], Sadeeq and Abdulazeez [33], Zhong et al. [34], and Meng et al. [35]. Additional references about new methodologies and approaches, MOSOPs, MOEAs, and new approaches can be found in [24].
In this paper, MOEAs based on differential evolution (DE) [36] were adopted to solve the MOSOPs: success history-based adaptive multi-objective differential evolution (SHAMODE), SHAMODE with whale optimization (SHAMODE-WO) from reference [37], and a multi-objective meta-heuristic with iterative parameter distribution estimation (MMIPDE) [38]. To evaluate their performance, these MOEAs were recently assessed in solving MOSOPs [24], and their results were compared with the results obtained in the literature.
The remainder of this paper is structured as follows. Section 2 describes the multi-objective optimization problems addressed in this study. Section 3 presents a summarized overview of the MOEAs adopted in this paper. Following this, Section 4 describes the computational experiments, presenting a detailed analysis of the obtained results. Finally, this paper concludes with Section 5, with concluding remarks and a discussion on potential extensions for future studies.
2. Formulation of the Multi-Objective Optimization Problem
The MOSOP formulation addressed in this paper is given by Equation (1), in which the total weight of the frame ()) and the number of different profiles assigned to the columns () are the two conflicting objective functions to be minimized simultaneously. The design variables and the search space are described in Section 4.3. The lower and upper bounds of the design variables are denoted by and , respectively. The total weight of the structure (Equation (2)) is determined by the specific mass of the material denoted by , the cross-sectional area , and length of the i-th element:
2.1. Design Constraints
The design constraints discussed in this paper can be categorized into three groups: displacement, strength, and geometric.
2.1.1. Displacement Constraints
The constrained multi-objective optimization problem analyzed in this paper is subject to two structural displacement constraints. The first constraint is regarding the maximum horizontal displacement at the top of the building, denoted by , and is defined by Equation (3). Here, the maximum allowable displacement is represented by , where H denotes the structure’s height. The second constraint is concerning the the inter-story drift of the i-th floor of the building, which is expressed by and is defined by Equation (4). In this case, the maximum allowable inter-story drift is denoted by , where h is the ceiling height, and represents the total number of stories:
2.1.2. Strength Constraints
The structural members in the problems addressed in this paper are designed according to Load and Resistance Factor Design (LRFD) equations [39], which consider axial and unsymmetrical bending and shearing effects. These equations apply to doubly symmetric cross-sectional members according to the guidelines established in AISC [39] and Brazilian Codes for Steel Construction [40]. The LRFD equations (Equations (5) and (6)) require that the available axial and flexural strengths, designated as , , , must satisfy the required axial strength and the flexural strengths about the major and minor axis and . Similarly, the available and required shearing strengths are denoted as and , respectively.
The available strengths are evaluated under Brazilian technical codes and AISC [39,40], taking into account the reduction in section effectiveness due to local and global buckling, as well as the effective buckling length. The effective buckling length is as recommended in [40] for multi-story braced frames:
2.1.3. Geometric Constraints
Geometric constraints can effectively address a number of structural aspects, particularly concerning beam-to-column and column-to-column connections. Here, constraints regarding beam–column connections aim to prevent the attachment of a beam with a flange that is wider than either the column web’s height or the column flange itself. On the other hand, connections between pillars are subject to constraints that prevent profiles with a greater depth or mass from being fitted over profiles with lower values.
The connections between the members of a structural system are depicted in Figure 1. In this Figure, , , and refer to the height of the web, the width of the flange, and the depth of the i-th member, respectively. Additionally, and represent the flange width of the k-th and j-th members, while denotes the depth of the n-th member.
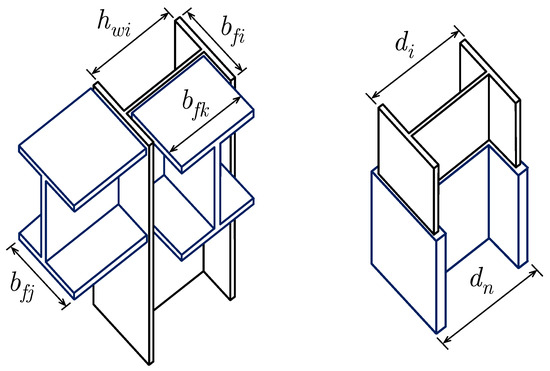
Figure 1.
Column-to-beam and column-to-column geometric constraints.
3. Materials and Methods
Multi-objective optimization is a common problem in which conflicting multiple objectives are considered simultaneously. The solution to this problem is a set of non-dominated solutions generating a PF. This front is essentially a trade-off curve, which displays the relations between the different objectives and the corresponding solutions.
3.1. Dominance and Optimal PF
The concept of dominance is employed to rank the solutions obtained in a multi-objective problem. This approach is similar to the one introduced by [41]. In a minimization problem, a solution A dominates another solution B () if one of two conditions holds: either A is better than or equal to B in all objective functions ( for all i = 1, 2,…, n, where n is the number of objectives), or A is strictly better than B in at least one objective function ( for at least one value of i).
3.2. Multi-Objective Evolutionary Algorithms Adopted
The algorithms adopted in this paper are all based on differential evolution, namely, (i) the success history-based adaptive multi-objective differential evolution (SHAMODE) introduced by [37]; (ii) the success history-based adaptive multi-objective differential evolution with whale optimization (SHAMODE-WO), which incorporates the spiral movement from the whale optimization algorithm (WOA) proposed by [42], also developed by [37]; and (iii) the multi-objective meta-heuristic with iterative parameter distribution estimation (MMIPDE) proposed by [38]. These MOEAs can be summarized as follows:
- SHAMODE, introduced by Panagant et al. [37], is an extension of success history-based adaptive differential evolution (SHADE) [43] designed for multi-objective optimization problems (MOOPs). In SHAMODE, the differential evolution (DE) parameters undergo iterative updates based on the historical memory of success, guiding the selection of future parameter values. Additionally, SHAMODE incorporates an external archive to store all non-dominated solutions discovered throughout the algorithm’s execution. A variant called SHAMODE-WO [37] modifies SHAMODE by providing the mutant vector with the option of being updated using the whale optimization algorithm (WOA) [42].
- MM-IPDE, as presented by Wansasueb et al. [38], employs two primary procedures: modified multi-objective differential evolution (MODE) and population-based incremental learning for multi-objective optimization (PBILM). Within MM-IPDE, these procedures operate concurrently, with MODE dedicated to searching for optimal solutions, while PBILM estimates differential evolution (DE) parameters, dynamically adapting to utilize the most effective values throughout the algorithm’s execution. MM-IPDE incorporates various DE reproduction schemes for generating trial vectors in DE operations, employs a non-dominated sorting scheme to categorize its population, and utilizes an external archive to store all non-dominated solutions discovered.
For the three algorithms to determine the next set of candidate solutions for future generations, the concepts of dominance and crowding distance, as described by [44], are used. This approach ensures a robust selection process, enabling the identification of high-quality solutions in a multi-objective optimization problem.
These algorithms were adopted due to their superior performance in obtaining non-dominated solutions compared to several MOEAs, which can be observed in [24,45]. The constraints were handled using the constraint-based non-dominated sorting technique [44], or constraint dominance principles, in which for any two solutions x and y, (i) if x is feasible and y is infeasible, x is ranked above y; (ii) if x and y are both infeasible, the one with the smaller constraint violation is ranked higher; and (iii) if x and y are both feasible the one dominating the other is ranked higher. The parameters adopted in the algorithms were those indicated in the original references [37,38]. None of the sensitivity analyses of parameters and standards of the adopted MOEAs were tested.
4. Computational Experiments
The present work comprises computational experiments to minimize the weight and the maximum number of profiles assigned to the columns of three different spatial frames, such as (i) a frame consisting of 6 floors and 4 bays (F6_4), (ii) a frame with 10 floors and 12 bays (F10_12), and (iii) a 12-story frame with 12 bays (F12_12). A PF is generated for each experiment, consisting of a set of non-dominated solutions. From this PF, solutions are selected and presented in figures and tables. These selected solutions are subjected to a detailed analysis of their results. Performance indicators are applied to the three multi-objective algorithms to facilitate comparative analysis. This analysis is conducted at the end of this section, allowing for an objective performance evaluation and comparison of the algorithms. Each experiment involved ten independent runs for each algorithm, with 50 candidate vectors and 500 generations per run. This approach aimed to ensure robustness and capture a wide range of potential solutions for analysis.
4.1. General Considerations
This paper presupposes that the rotation of columns will not affect the building’s internal layout. The structures being studied are commercial buildings that include interior walls and glass facades. Additionally, the range of possible column shapes is restricted to H-sections with flange widths approximately equal to their depths. Seismic design is not included in the optimization process, as it is not mandatory according to Brazilian codes [40]. However, at least two load combinations are considered for each structure, considering wind pressure acting in two orthogonal directions. Lateral displacements are assessed in these directions.
The methodology employed in this study to incorporate the influence of slabs on the structure involves the master–slave multi-freedom constraints approach as outlined by Felippa et al. [46]. This approach assumes a rigid diaphragm behavior of the floor plane, enabling the incorporation of slab stiffness in determining the structure’s displacements. It is important to mention that the weight of the slabs is not included in the optimization problem’s consideration of the structure’s weight. Only the steel frames are taken into account.
The structures used in the experiments are all braced spatial steel frames, with the beam-to-column connections assumed to be pin-connect. This means that only the web of the profile is attached to the column using two angle bars as shown in Figure 2a,b. On the other hand, the columns are assumed to be rigidly connected by the flanges and web as depicted in Figure 2c. The beams are considered to be laterally supported by the slab using shear studs to prevent any loss of effectiveness due to lateral torsional buckling.

Figure 2.
Connections. (a) Beam-to-column (flexible); (b) beam-to-column (flexible); (c) column-to-column (rigid).
4.2. Design Loads
The design loads for the structure can be categorized into three types: dead loads (), live loads (), and wind loads (). Dead loads refer to the weight of the steel structure, slabs, and other constructive elements, such as dividing walls and glass facades. Live loads represent the weight imposed by the occupancy and use of the structure, while wind loads are the actions generated by the dynamic pressure of the wind. In this paper, all experiments consider the self-weight of the steel frame, a slab dead load of 2.4 kN/m (), an inner partition dead load acting on the inner beams of 5.85 kN/m (), a glass facade dead load acting on the outer beams of 0.6 kN/m (), a live load of 1.5 kN/m (), and a set of nodal wind loads for each experiment evaluated according to [47] for a basic velocity of 37 m/s. For each experiment, two load combinations are considered, accounting for wind direction, and are defined according to [40,48]. The load combinations can be written as and , where and are the wind loads acting on the and directions, respectively. It is essential to emphasize that nodal wind loads are subject to fluctuations according to the effective pressure area associated with each node. Specifically, within the architectural framework examined in this study, it is observed that the facade corner nodes shoulder fifty percent of the load borne by the facade middle nodes. Additionally, the geometric characteristics of the structure contribute to the phenomenon where the loads acting in both the x and y directions exhibit a notable similarity. Each experiment’s specific gravity and wind loads are provided in their respective descriptions.
4.3. Design Variables and Search Space
In this paper, the design variables candidate vector is divided into five subsets of integer indexes. The first subset determines the bracing system configuration that will stiffen the structure, with possible values ranging from one to , where is the number of available bracing system configurations in the problem. The second subset of indexes is a binary choice that determines the orientation of the cross section of the columns, indicating the position of the highest and lowest principal moment of inertia concerning the global x-axis of the structure. The third subset of variables corresponds to the W-shaped commercial profiles assigned to the columns, with each index assigned to a group of elements depending on the numerical experiment, such as corner columns (CCs), outer columns (OCs), and inner columns (ICs), with each group linked to an orientation from the previous subset. The last two subsets of variables are associated with the commercial profiles assigned to the beams and bracer elements. The search space for these subsets comprises 29 profiles for the columns and 56 profiles for the beams, which are detailed in Table 1. Figure 3 provides a detailed representation of the candidate vector showing the design variable linking.

Table 1.
Search space comprises two commercial W-shape profile subsets.
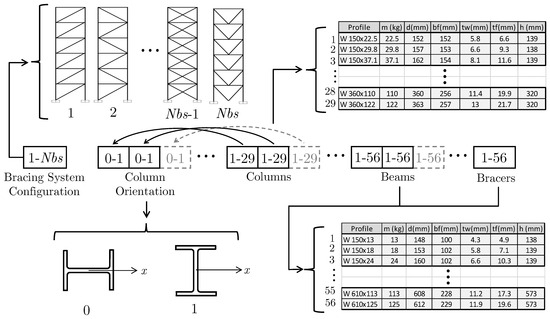
Figure 3.
Candidate vector for a general problem, which includes the bracing system configuration, column orientation and commercial profiles variables.
4.4. Experiment 1—6-Story and 4-Bay 3D Frame (F6_4)
The first experiment conducted in this paper is a three-dimensional frame comprising six stories and four bays, represented in Figure 4. CC, OC, and IC are appropriately labeled the column groups within the frame. Figure 5 depicts five distinct bracing system possible configurations for this experiment. A repeating pattern was implemented regarding the layout of columns and beams (outer beams (OBs) and inner beams (IBs)), with each column group recurring every two stories and beams recurring every three levels. The load combinations employed in this experiment encompassed a gravity load acting on the beams. Specifically, the inner beams were subjected to a gravity load of 22.21 kN/m, while the outer beams with a gravity load of 7.85 kN/m. Additionally, nodal wind loads were applied to the structure. Table 2 shows the specific values for these nodal wind loads.
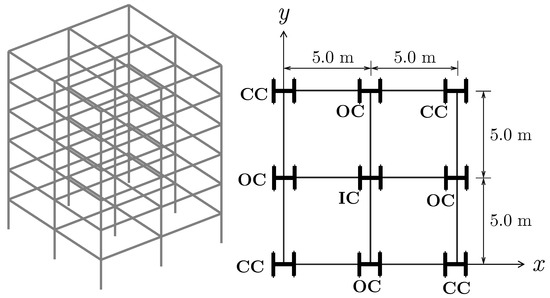
Figure 4.
Experiment 1—6-story and 4-bay frame 3D and plain view.
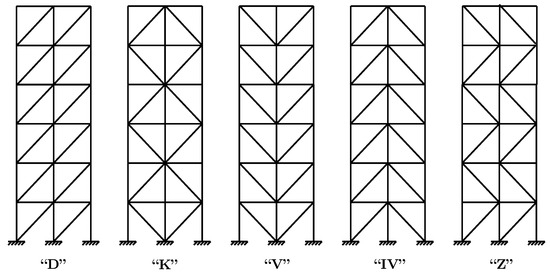
Figure 5.
Experiment 1—Bracing system configurations. From left to right, diagonal, K, V, inverted V (IV) and Z geometric configurations.

Table 2.
Experiment 1—Wind loads acting on facade nodes.
The PFs of dominated and non-dominated solutions are provided in Figure 6a,b, respectively. Table 3 provides the detailed results obtained from Experiment 1 concerning the four non-dominated solutions, such as the type of bracing systems, the profiles for each one of the columns’ groups, the orientations for these columns, the constraints and objective functions, and a relative percentage of final weight concerning these solutions.
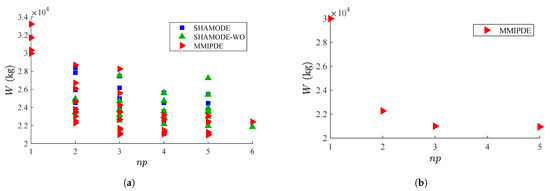
Figure 6.
Pareto fronts of Experiment 1. (a) Dominated and non-dominated solutions; (b) non-dominated solutions.

Table 3.
The best results found for F6_4, providing details of the W-shapes assigned to each member group, constraints, and objective function values.
Figure 7 shows the four non-dominated solutions with details of the bracing system configuration, the column group’s orientation, and the different profiles assigned to the columns highlighted in different colors.
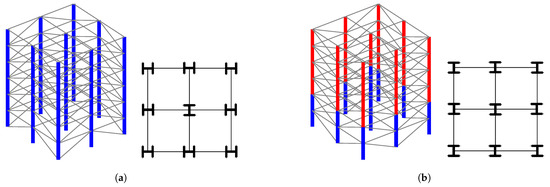
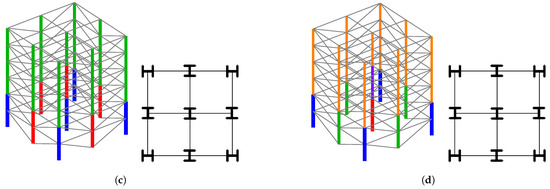
Figure 7.
Experiment 1—Four non-dominated solutions with details of the bracing system configuration, the columns’ groups orientation, and the different profiles assigned to the columns highlighted in different colors. (a) = 29,978 kg, = 1; (b) = 22,271 kg, = 2; (c) = 20,992 kg, = 3; (d) = 20,947 kg, = 5.
Table 3 provides the detailed results obtained from Experiment 1 concerning the four non-dominated solutions, such as the type of bracing systems, the profiles for each one of the columns’ groups, the orientations for these columns, the constraints and objective functions, and a relative percentage of final weight concerning these solutions.
From a detailed analysis of the four non-dominated solutions obtained from Table 3, it becomes evident that the “V” configuration of the bracing system was the most suitable choice for the problem, as it was selected for all solutions except for the case with , where the “IV” bracing system was adopted instead.
Setting the weight of the heaviest structure ( 29,978 kg, ) as a reference point with 100% of weight (i.e., “the maximum weight among non-dominated solutions”), it can be observed that by increasing the number of profiles from to , the solution achieves a weight of 22,271 kg, which corresponds to 74.29% of the “maximum weight”. This represents a reduction of 25.71% in weight. Subsequently, when the increase occurs from to , the weight further decreases from 22,271 kg to 20,992 kg, which corresponds to 70.02% of the weight of the heaviest structure, resulting in a weight reduction of 4.27%. Consequently, among the four non-dominated solutions, the solution with = 2 emerges as the most competitive option. It demonstrates the minimum increase in the number of profiles used while significantly reducing the structure’s overall weight.
Even though only four solutions are non-dominated, it is possible to observe, in this case, that the dominated solution with four different columns is very competitive with the solutions with three and five columns. In this sense, it can also be a solution to be chosen by the decision maker.
4.5. Experiment 2—10-Story and 12-Bay 3D Frame (F10_12)
The second experiment analyzed in this paper is a three-dimensional frame comprising ten stories and twelve bays, represented in Figure 8. Analogously to the previous experiment, the structure was labeled by CC, OC, and IC column groups. Figure 9 depicts the available bracing systems configurations.
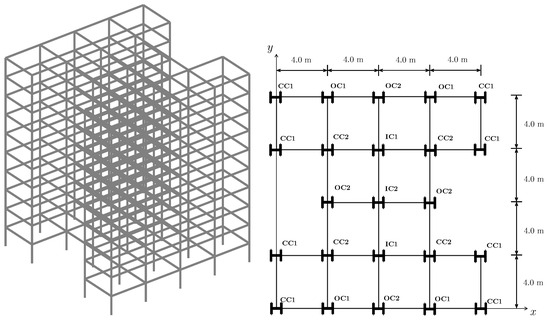
Figure 8.
Experiment 2—10-story and 12-bay frame 3D and plain view.
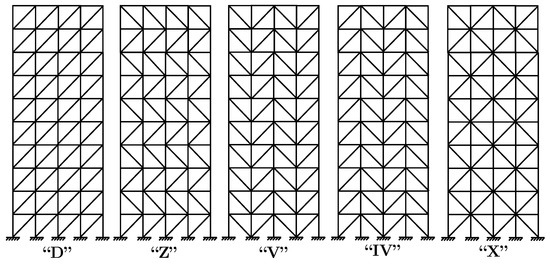
Figure 9.
Experiment 2—Bracing systems configurations.
The layout of the columns and beams followed a recurring pattern, with each column group repeating every two stories and beams recurring every five levels. The experiment encompassed a gravity load acting upon the beams regarding load combinations. Specifically, the inner beams experienced a gravity load of 19.41 kN/m, while the outer beams were subjected to a gravity load of 6.45 kN/m. Additionally, nodal wind loads were applied to the structure in addition to the gravity load. Table 4 shows detailed information on the specific nodal wind loads employed. It is pertinent to emphasize that the middle node indicated in Table 4 refers to the middle node on the facade as depicted in the elevation view of the building. Notably, in the overall plan view, the building exhibits an “H” shape, rendering the referred middle node to function as a corner node.

Table 4.
Experiment 2—Wind loads acting on facade nodes.
The PFs of dominated and non-dominated solutions are provided in Figure 10a and Figure 10b, respectively. Figure 11 shows the six non-dominated solutions with details of the bracing system configuration, the columns’ groups orientation, and the different profiles assigned to the columns highlighted in different colors.
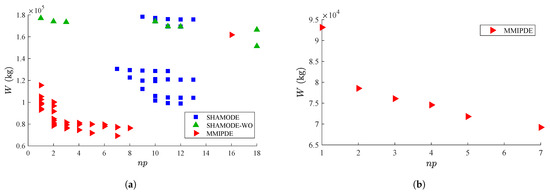
Figure 10.
Pareto fronts of Experiment 2. (a) Dominate and non-dominate solutions; (b) non-dominated solutions.
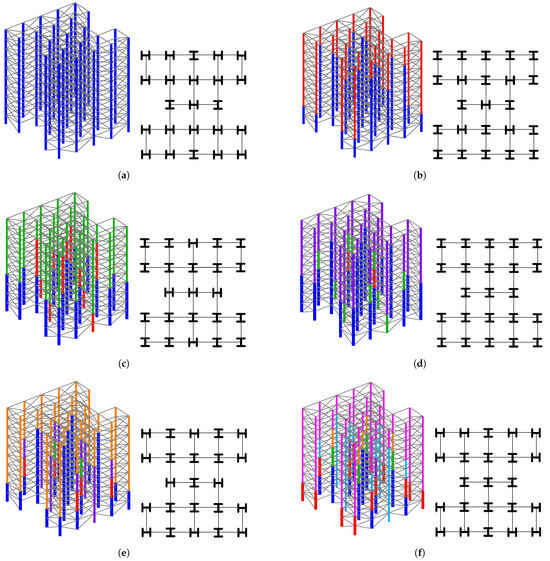
Figure 11.
Experiment 2—Six non-dominated solutions with details of the bracing system configuration, the columns’ groups orientation, and the different profiles assigned to the columns highlighted in different colors. (a) = 93,150 kg, = 1. (b) = 78,549 kg, = 2. (c) = 76,089 kg, = 3. (d) = 74,573 kg, = 4. (e) = 71,502 kg, = 5. (f) = 69,213 kg, = 7.
Table 5 provides the detailed results obtained from Experiment 2 concerning the six non-dominated solutions, such as the type of bracing systems, the profiles for each one of the columns’ groups, the orientations for these columns, the constraints and objective functions, and a relative percentage of final weight concerning these solutions.

Table 5.
Best results found for the six solutions obtained for the F10_12, providing details of the W-shapes assigned to each member group, constraints, and objective function values.
4.6. Experiment 3—12-Story and 12-Bay 3D Frame (F12_12)
The final experiment analyzed in this paper is a three-dimensional frame with ten stories and twelve bays as illustrated in Figure 12, showing the CC, OC, and IC groups of columns at the right side of this figure. A diverse set of five alternative bracing system configurations is available as potential solutions as presented in Figure 13. The arrangement of columns and beams adhered to a recurring layout, with each column group repeating every two stories and beams recurring every four stories. The experiment incorporated load combinations encompassing a gravity load acting on the beams. Specifically, the inner beams were subjected to a gravity load of 22.21 kN/m, while the outer beams experienced a gravity load of 7.85 kN/m. Furthermore, nodal wind loads were applied to the structure and the gravity load. Table 6 shows the complete data on the applied nodal wind loads.
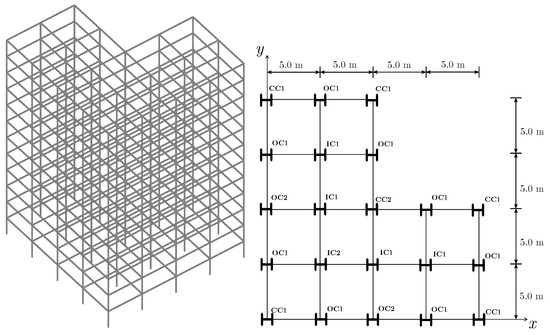
Figure 12.
Experiment 3—12-story and 12-bay frame 3D and plain view.
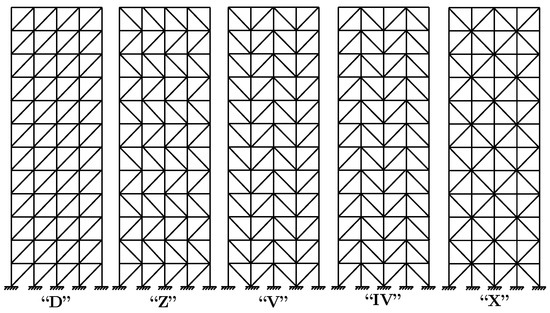
Figure 13.
Experiment 3—Possible bracing systems configurations.

Table 6.
Experiment 3—Wind loads acting on facade nodes.
The PFs are displayed in Figure 14a,b. In this experiment, only the MM-IPDE algorithm found feasible non-dominated solutions. Table 7 provides the detailed results obtained from Experiment 3 concerning the six non-dominated solutions, such as the type of bracing systems, the profiles for each one of the columns’ groups, the orientations for these columns, the constraints and objective functions, and a relative percentage of final weight concerning these solutions. Ten non-dominated solutions are depicted in Figure 15 highlighting the different profiles assigned to the columns and the bracing system configuration, and Figure 16 provides details of the columns’ groups orientation for the six extracted solutions.
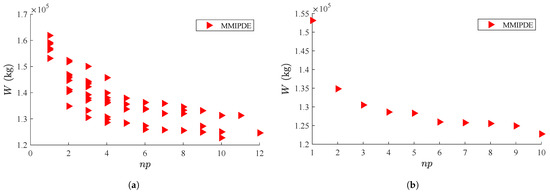
Figure 14.
Pareto fronts of Experiment 3. (a) Dominated and non-dominated solutions; (b) non-dominated solutions.

Table 7.
Best results found for six of the ten solutions obtained for the F12_12, providing details of the W-shapes assigned to each member group, constraints, and objective function values.
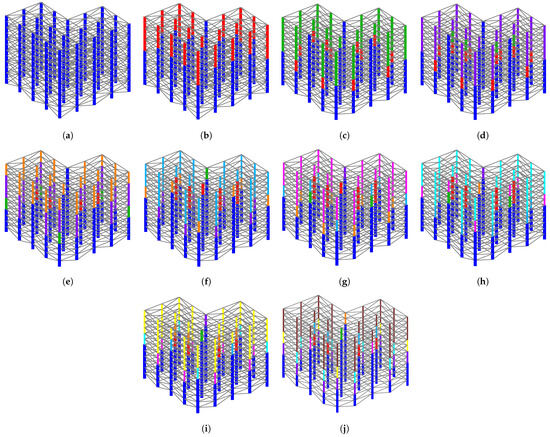
Figure 15.
Experiment 3—All ten non-dominated solutions with the different profiles assigned to the columns highlighted in colors. (a) = 153,140 kg, = 1. (b) = 134,845 kg, = 2. (c) = 130,513 kg, = 3. (d) = 128,622 kg, = 4. (e) = 128,311 kg, = 5. (f) = 125,959 kg, = 6. (g) = 125,771 kg, = 7. (h) = 125,549 kg, = 8. (i) = 124,929 kg, = 9. (j) = 122,763 kg, = 10.
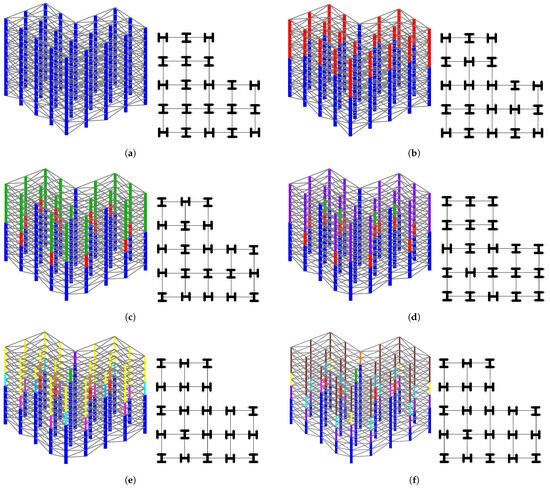
Figure 16.
Experiment 3—Six non-dominated solutions with details of the bracing system configuration, the columns’ groups orientation, and the different profiles assigned to the columns highlighted in different colors. (a) = 153,140 kg, = 1. (b) = 134,845 kg, = 2. (c) = 130,513 kg, = 3. (d) = 128,622 kg, = 4. (e) = 124,929 kg, = 9. (f) = 122,763 kg, = 10.
From the results provided in Table 7, six out of the ten non-dominated solutions with = 1, = 2, = 3, = 4, = 9, and = 10 were compared. Initially, it is noteworthy to observe the bracing system configurations presented by these solutions. The two heaviest solutions (=1, = 2) adopt the “X” bracing system, whereas the “V” configuration is predominantly more suitable for the other solutions. Another crucial aspect of the analysis is the trade-off between the total weight of the structure and the number of different profiles assigned to the columns. Considering the solution with = 1 as a reference, which accounts for 100% of the weight ( = 153,140 kg), an increase in one profile in the solution, turning into = 2, results in a weight reduction to 134,845 kg, representing a decrease of 11.95%. Furthermore, the solution with ten different profiles ( = 10) presents a weight of 122,763 kg, indicating a reduction of 19.84% compared to = 1 and 7.89% compared to = 2. Consequently, to achieve a weight reduction of less than 8% compared to = 2, it is necessary to increase the utilization of eight different profiles. This demonstrates a significant advantage of obtaining the Pareto front through the solution of a multi-objective problem, as it provides valuable information for the designer. The designer can explicitly assess the weight reduction attainable by reducing the number of profiles employed. Upon visual analysis of Figure 14b, the non-dominated solutions = 2, = 3, and = 10 are very competitive alternatives when compared to their neighboring solutions.
4.7. Summary of W Profiles Assigned to Columns
Table 8 presents the best weights , the number of different columns , and the respective W profiles assigned to columns obtained in each experiment.

Table 8.
Summary of the different profiles assigned to columns.
4.8. Performance Evaluation of the Algorithms
The performance of MOEAs adopted in this paper is evaluated using two indicators: Hypervolume [49] and the inverted generational distance plus [50]. Furthermore, analyzing the data generated by these indicators involved using performance profiles (PPs) [51]. Let P represent a set of n problems and denote a set of algorithms. For any desired indicator , which is evaluated for problem p using algorithm s, the performance ratio and the performance profile are defined as follows:
The performance ratio represents the ratio of the performance of algorithm s on problem p compared to the minimum performance achieved by any algorithm in set . On the other hand, the PP calculates the proportion of problems out of the total n problems in set P, for which the performance ratio is less than or equal to a given threshold . The PP of algorithm s is a constant function that indicates the percentage of problems from set P, where the algorithm’s performance falls within a factor of compared to the best-performing algorithm. The overall performance indicator is determined by the area under the curves of the performance profiles. A larger area achieved by an algorithm signifies greater global efficiency [52].
The results, as depicted in Table 9, indicate that MMIPDE reached superior performance overall. However, it is worth noting that for the F6_4 experiment, SHAMODE achieved the best result in terms of the HV evaluation. This analysis confirms the intuitive observation from the results since all the non-dominated solutions obtained concerning the three experiments originated from the MMIPDE algorithm. Furthermore, Figure 17 presents the performance profile for the three experiments, evaluating the best performance based on the area under the curve. Notably, the MMIPDE algorithm outperformed the others in both indicators, demonstrating its superiority in addressing the problems analyzed in this paper.

Table 9.
Performance indicators.
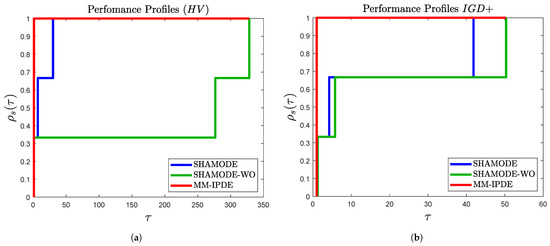
Figure 17.
Performance profiles. (a) HV normalized area: MMIPDE = 1.00; SHAMODE = 0.96; SHAMODE-WO = 0.39; (b) IGD+ normalized area: MMIPDE = 1.00; SHAMODE = 0.70; SHAMODE-WO = 0.63.
5. Conclusions
A multi-objective approach was formulated to address the challenge of automatically identifying groups of three-dimensional steel frame columns, even after defining initial groupings based on symmetry. This method efficiently organizes design variables related to the number of column groups while minimizing the structure’s weight.
This strategy eliminates the requirement to predefine intuitive variable links, enabling MOEAs to exploit variable linking automatically to identify the most effective member groupings. Although the initial definition of groupings was based on symmetry, it was possible to discover other competitive configurations relevant to decision makers in manufacturing, cutting, transportation, checking, and welding.
The versatility of these MOSOPs applies to complex real-world structural optimization issues and various forms of optimization challenges. As a result, the suggested MOSOPs offer a beneficial enhancement to the designer’s optimization toolkit. Minimizing the variety of distinct components adopted in an optimized design streamlines cost savings linked to employing a more limited range of sizes—advantages that are difficult to quantify through other means.
Future work should consider, for example, topological structural optimization mainly in bracing systems, other load cases such as seismic loads, and other objective functions, such as the natural frequencies of vibration and critical load factors concerning the structure’s global stability.
Author Contributions
C.R.: Methodology, Software, Formal analysis, Writing—original draft. L.F.M.: Supervision, Conceptualization, Investigation, Writing—review and editing. A.L.: Supervision, Conceptualization, Investigation, Writing—review and editing. P.H.: Supervision, Conceptualization, Investigation, Writing—review and editing. J.C.: Methodology, Software, Formal analysis. J.M.: Methodology, Software, Formal analysis. All authors have read and agreed to the published version of the manuscript.
Funding
This study was financed in part by the Coordenação de Aperfeiçoamento de Pessoal de Nível Superior—Brazil (CAPES)—Finance Code 001, and Conselho Nacional de Desenvolvimento Científico e Tecnológico (Grants 308105/2021-4 and 303221/2022-4), FAPEMIG (Grants TEC PPM-00174-18 and APQ-00869-22), and Federal University of Juiz de Fora, Brazil.
Data Availability Statement
The authors confirm that the data supporting the findings of this study are available within the paper.
Conflicts of Interest
The authors declare that they have no known competing financial interests or personal relationships that could have appeared to influence the work reported in this paper.
Abbreviations
The following abbreviations are used in this manuscript:
| ACO | Ant Colony Optimization |
| AISC | American Institute of Steel Construction |
| BB-BC | Big Bang–Big Crunch |
| BC | Braces |
| CC | Corner Columns |
| DE | Differential Evolution |
| ETE | Explore-Then-Exploit |
| F10_12 | 10-story and 12-bay 3D frame |
| F12_12 | 12-story and 12-bay 3D frame |
| F6_4 | 6-story and 4-bay 3D frame |
| GA | Genetic Algorithm |
| HV | Hypervolume |
| IB | Inner Beams |
| IC | Inner Columns |
| IGD+ | Inverted Generational Distance Plus |
| LRFD | Load and Resistance Factor Design |
| MMIPDE | Multi-objective Meta-heuristic with Iterative Parameter Distribution Estimation |
| MOEA | Multi-objective Evolutionary Algorithm |
| MOSOP | Multi-objective Structural Optimization Problem |
| MSCSS | Multi-set Charged System Search |
| NSGA-II | Nondominated Sorting Genetic Algorithm II |
| OB | Outer Beams |
| OC | Outer Columns |
| PF | Pareto Front |
| PSO | Particle Swarm Optimization |
| SHAMODE | Success History-Based Adaptive Multi-objective Differential Evolution |
| SHAMODE-WO | SHAMODE with Whale Optimization |
| SODA | Structural Optimization Design and Analysis |
| SPEA2 | Improved Strength Pareto Evolutionary Algorithm |
| WOA | Whale Optimization Algorithm |
References
- Papadrakakis, M.; Lagaros, N.; Plevris, V. Multi-objective optimization of skeletal structures under static and seismic loading conditions. Eng. Optim. 2002, 34, 645–669. [Google Scholar] [CrossRef]
- Kicinger, R.; Arciszewski, T. Multiobjective evolutionary design of steel structures in tall buildings. In Proceedings of the AIAA 1st Intelligent Systems Technical Conference, Chicago, IL, USA, 20–22 September 2004; American Institute of Aeronautics and Astronautics, Inc.: Chicago, IL, USA, 2004. [Google Scholar]
- Liu, M.; Burns, S.A.; Wen, Y.K. Multiobjective optimization for performance-based seismic design of steel moment frame structures. Earthq. Eng. Struct. Dyn. 2005, 34, 289–306. [Google Scholar] [CrossRef]
- Yazdi, H.M.; Sulong, N.H.R.; Mosalman, F. Fuzzy multi-objective genetic algorithm in determination of optimum mid connection location of off-centre bracing system. In Proceedings of the 2010 3rd International Conference on Advanced Computer Theory and Engineering, Chengdu, China, 20–22 August 2010; Volume 3. [Google Scholar]
- Richardson, J.N.; Nordenson, G.; Laberenne, R.; Coelho, R.F.; Adriaenssens, S. Flexible optimum design of a bracing system for façade design using multiobjective genetic algorithms. Autom. Constr. 2013, 32, 80–87. [Google Scholar] [CrossRef]
- Babaei, M.; Sanaei, E. Multi-objective optimal design of braced frames using hybrid genetic and ant colony optimization. Front. Struct. Civ. Eng. 2016, 10, 472–480. [Google Scholar] [CrossRef]
- Gholizadeh, S.; Baghchevan, A. Multi-objective seismic design optimization of steel frames by a chaotic meta-heuristic algorithm. Eng. Comput. 2017, 33, 1045–1060. [Google Scholar] [CrossRef]
- Grierson, D.; Cameron, G. SODA-Structural Optimization Design and Analysis; Waterloo Engineering Software: Waterloo, ON, Canada, 1987. [Google Scholar]
- Biedermann, J.; Grierson, D. Training and using neural networks to represent heuristic design knowledge. Adv. Eng. Softw. 1996, 27, 117–128. [Google Scholar] [CrossRef]
- Biedermann, J.; Grierson, D. A generic model for building design. Eng. Comput. 1995, 11, 173–184. [Google Scholar] [CrossRef]
- Biedermann, J. Representing design knowledge with neural networks. Comput.-Aided Civ. Infrastruct. Eng. 1997, 12, 277–285. [Google Scholar] [CrossRef]
- Galante, M. Genetic algorithms as an approach to optimize real-world trusses. Int. J. Numer. Methods Eng. 1996, 39, 361–382. [Google Scholar] [CrossRef]
- Shea, K.; Cagan, J.; Fenves, S. A shape annealing approach to optimal truss design with dynamic grouping of members. J. Mech. Des. 1997, 119, 388–394. [Google Scholar] [CrossRef]
- Barbosa, H.; Lemonge, A. A genetic algorithm encoding for a class of cardinality constraints. In Proceedings of the 7th Annual Conference on Genetic and Evolutionary Computation, Washington, DC, USA, 25–29 June 2005; ACM Press: New York, NY, USA, 2005; pp. 1193–1200. [Google Scholar]
- Barbosa, H.; Lemonge, A.; Borges, C. A genetic algorithm encoding for cardinality constraints and automatic variable linking in structural optimization. Eng. Struct. 2008, 30, 3708–3723. [Google Scholar] [CrossRef]
- Herencia, J.; Haftka, R. Structural optimization with limited number of element properties. Struct. Multidiscip. Optim. 2010, 41, 817–820. [Google Scholar] [CrossRef]
- Herencia, J.; Haftka, R.; Balabanov, V. Structural optimization of composite structures with limited number of element properties. Struct. Multidiscip. Optim. 2013, 47, 233–245. [Google Scholar] [CrossRef]
- Liu, X.; Cheng, G.; Wang, B.; Lin, S. Optimum design of pile foundation by automatic grouping genetic algorithms. ISRN Civ. Eng. 2012, 2012. [Google Scholar] [CrossRef]
- Angelo, J.; Bernardino, H.; Barbosa, H. Ant colony approaches for multiobjective structural optimization problems with a cardinality constraint. Adv. Eng. Softw. 2015, 80, 101–115. [Google Scholar] [CrossRef]
- Carvalho, J.; Carvalho, A.L.E.; Bernardino, P.H.H. Truss optimization with multiple frequency constraints and automatic member grouping. Struct. Multidiscip. Optim. 2018, 57, 547–577. [Google Scholar] [CrossRef]
- Azad, S.; Aminbakhsh, S.; Shaban, S. Multi-stage guided stochastic search for optimization and standardization of free-form steel double-layer grids. Structures 2021, 34, 678–699. [Google Scholar] [CrossRef]
- van Woudenberg, T.; van Der, M.; Frans, P. A grouping method for optimization of steel skeletal structures by applying a combinatorial search algorithm based on a fully stressed design. Eng. Struct. 2021, 249, 113299. [Google Scholar] [CrossRef]
- Turay, B.; Fernández-Cabán, P.; Thomson, K. Effect of member grouping and pool size of discrete cross-sections on the optimal design of a large-scale 3D steel frame. Eng. Struct. 2022, 258, 114098. [Google Scholar] [CrossRef]
- Carvalho, J.P.G.; Vargas, D.E.; Jacob, B.P.; Lima, B.S.; Hallak, P.H.; Lemonge, A.C. Multi-objective structural optimization for the automatic member grouping of truss structures using evolutionary algorithms. Comput. Struct. 2024, 292, 107230. [Google Scholar] [CrossRef]
- Greiner, D.; Winter, G.; Emperador, J.; Galván, B. Gray Coding in Evolutionary Multicriteria Optimization: Application in Frame Structural Optimum Design. In Proceedings of the Evolutionary Multi-Criterion Optimization, Guanajuato, Mexico, 9–11 March 2005; Coello Coello, C.A., Hernández Aguirre, A., Zitzler, E., Eds.; Springer: Berlin/Heidelberg, Germany, 2005; pp. 576–591. [Google Scholar]
- Tejani, G.; Pholdee, N.; Bureerat, S.; Prayogo, D. Multiobjective adaptive symbiotic organisms search for truss optimization problems. Knowl.-Based Syst. 2018, 161, 398–414. [Google Scholar] [CrossRef]
- Kumar, S.; Jangir, P.; Tejani, G.; Premkumar, M.; Alhelou, H. MOPGO: A new physics-based multi-objective plasma generation optimizer for solving structural optimization problems. IEEE Access 2021, 9, 84982–85016. [Google Scholar] [CrossRef]
- Jafari, M.; Salajegheh, E.; Salajegheh, J. Elephant clan optimization: A nature-inspired metaheuristic algorithm for the optimal design of structures. Appl. Soft Comput. 2021, 113, 107892. [Google Scholar] [CrossRef]
- Eid, H.; Garcia-Hernandez, L.; Abraham, A. Spiral water cycle algorithm for solving multi-objective optimization and truss optimization problems. Eng. Comput. 2022, 38, 963–973. [Google Scholar] [CrossRef]
- Khodadadi, N.; Talatahari, S.; Dadras, A. MOTEO: A novel multi-objective thermal exchange optimization algorithm for engineering problems. Soft Comput. 2022, 26, 6659–6684. [Google Scholar] [CrossRef]
- Jelovica, J.; Cai, Y. Improved multi-objective structural optimization with adaptive repair-based constraint handling. Eng. Opt. 2022, 56, 118–137. [Google Scholar] [CrossRef]
- Kumar, S.; Jangir, P.; Tejani, G.; Premkumar, M. A decomposition based multi-objective heat transfer search algorithm for structure optimization. Knowl.-Based Syst. 2022, 253, 109591. [Google Scholar] [CrossRef]
- Sadeeq, H.; Abdulazeez, A. Giant trevally optimizer (GTO): A novel metaheuristic algorithm for global optimization and challenging engineering problems. IEEE Access 2022, 10, 121615–121640. [Google Scholar] [CrossRef]
- Zhong, C.; Li, G.; Meng, Z.; Li, H.; He, W. Multi-objective SHADE with manta ray foraging optimizer for structural design problems. Appl. Soft Comput. 2023, 134, 110016. [Google Scholar] [CrossRef]
- Meng, Z.; Yıldız, B.; Li, G.; Zhong, C.; Mirjalili, S.; Yildiz, A. Application of state-of-the-art multiobjective metaheuristic algorithms in reliability-based design optimization: A comparative study. Struct. Multidiscip. Optim. 2023, 66, 191. [Google Scholar] [CrossRef]
- Storn, R.; Price, K. Differential Evolution—A Simple and Efficient Heuristic for global Optimization over Continuous Spaces. J. Glob. Optim. 1997, 11, 341–359. [Google Scholar] [CrossRef]
- Panagant, N.; Bureerat, S.; Tai, K. A novel self-adaptive hybrid multi-objective meta-heuristic for reliability design of trusses with simultaneous topology, shape and sizing optimisation design variables. Struct. Multidiscip. Optim. 2019, 60, 1937–1955. [Google Scholar] [CrossRef]
- Wansasueb, K.; Pholdee, N.; Panagant, N.; Bureerat, S. Multiobjective meta-heuristic with iterative parameter distribution estimation for aeroelastic design of an aircraft wing. Eng. Comput. 2020, 38, 695–713. [Google Scholar] [CrossRef]
- AISC 360-16; Specification for Structural Steel Buildings. AISC: Chicago, IL, USA, 2016.
- NBR 8800; Design of Steel Structures and Composite Structures of Steel and Concrete for Buildings. ABNT Editora: Rio de Janeiro, Brazil, 2008.
- Deb, K. Multi-Objective Optimization Using Evolutionary Algorithms; John Wiley & Sons: Kanpur, India, 2001. [Google Scholar]
- Mirjalili, S.; Lewis, A. The whale optimization algorithm. Adv. Eng. Softw. 2016, 95, 51–67. [Google Scholar] [CrossRef]
- Tanabe, R.; Fukunaga, A. Success-history based parameter adaptation for Differential Evolution. In Proceedings of the 2013 IEEE Congress on Evolutionary Computation, Cancun, Mexico, 20–23 June 2013; pp. 71–78. [Google Scholar]
- Deb, K.; Pratap, A.; Agarwal, S.; Meyarivan, T. A fast and elitist multiobjective genetic algorithm: NSGA-II. IEEE Trans. Evol. Comput. 2002, 6, 182–197. [Google Scholar] [CrossRef]
- Carvalho, J.; Carvalho, E.; Vargas, D.; Hallak, P.; Lima, B.; Lemonge, A. Multi-objective optimum design of truss structures using differential evolution algorithms. Comput. Struct. 2021, 252, 106544. [Google Scholar] [CrossRef]
- Felippa, C.A. Introduction to Finite Element Methods; University of Colorado: Boulder, CO, USA, 2004; Volume 885. [Google Scholar]
- NBR 6123; Forces Due to Wind on Buildings. ABNT Editora: Rio de Janeiro, Brazil, 1988.
- NBR 8681; Actions and Safety in Structures—Procedure. ABNT Editora: Rio de Janeiro, Brazil, 2002.
- Zitzler, E.; Thiele, L. Multiobjective evolutionary algorithms: A comparative case study and the strength Pareto approach. IEEE Trans. Evol. Comput. 1999, 3, 257–271. [Google Scholar] [CrossRef]
- Ishibuchi, H.; Masuda, H.; Tanigaki, Y.; Nojima, Y. Modified distance calculation in generational distance and inverted generational distance. In Proceedings of the Evolutionary Multi-Criterion Optimization: 8th International Conference, EMO 2015, Guimarães, Portugal, 29 March–1 April 2015; Proceedings, Part II 8. Springer: Berlin/Heidelberg, Germany, 2015; pp. 110–125. [Google Scholar]
- Dolan, E.; Moré, J. Benchmarking optimization software with performance profiles. Math. Program. 2002, 91, 201–213. [Google Scholar] [CrossRef]
- Barbosa, H.; Bernardino, H.; Barreto, A. Using performance profiles to analyze the results of the 2006 CEC constrained optimization competition. In Proceedings of the 2010 IEEE Congress on Evolutionary Computation (CEC), Barcelona, Spain, 18–23 July 2010; pp. 1–8. [Google Scholar]
Disclaimer/Publisher’s Note: The statements, opinions and data contained in all publications are solely those of the individual author(s) and contributor(s) and not of MDPI and/or the editor(s). MDPI and/or the editor(s) disclaim responsibility for any injury to people or property resulting from any ideas, methods, instructions or products referred to in the content. |
© 2024 by the authors. Licensee MDPI, Basel, Switzerland. This article is an open access article distributed under the terms and conditions of the Creative Commons Attribution (CC BY) license (https://creativecommons.org/licenses/by/4.0/).