Abstract
The mode of urban renewal in China has changed from incremental expansion to a value-added stage, and the development of cities has increasingly focused on the human experience and quality improvement. However, Cultural Street Vending and the unique street spaces in the historic districts that bear important connotations to the city have shown a trend of rapid decline and even disappearance. Therefore, how to identify the characteristics and connotations of such street vending spaces, grasp the relationship between perception of locality and built environment elements in different states and formulate targeted protection and renewal strategies is presently an urgent problem to be solved. Many studies have now discussed in detail the identification of elements, street perception and preservation strategies for historic districts. However, the Cultural Street Vending space, which carries special urban memory connotations, has been neglected, especially the characterisation of this type of space in different time dimensions. This paper takes the Cultural Street Vending space as a research object and focuses on the perceptual differences between its market day and non-market day, aiming at grasping the perceptual characteristics and constituent elements of this type of street space in different time states, as well as the patterns of changes they undergo. This paper took the Baxian Temple, a typical Cultural Street Vending space in a historic district of Xi’an, as the research object and took 30 architecture students as the evaluators to score 33 pairs of adjectives and recall the elements of nine streets. This paper compared and analysed the differences in the structure of people’s psychological perception of the street in the state of market day and non-market day by SD method. It was found that the activities of the vendors obviously promoted people’s positive emotions, and three commonality factors including impression, vitality and morphosis were extracted through the factor analysis. Moreover, through the element recall method to understand the change in element perception on the market day, we found that the range of people’s perception was smaller on the market day and summarised the element map of the space and the element components of high, medium and low characteristics. The correlation analysis between psychological quantities and environmental elements revealed that people’s positive psychology has a positive correlation with vendors, goods and street components and a negative correlation with greening, colour and texture. This study can provide an important research basis for the development of conservation and renewal strategies for this type of Cultural Street Vending space.
1. Introduction
Driven by urban renewal policies, China’s urban development model has transformed from incremental expansion [1] 30 years ago to stock optimisation [2] while gradually moving towards a new urbanisation phase with people at its core [3] and a human-scale perspective becoming key to renewal [4,5]. Many historic districts in cities represent the identity of the city [6] and embody the collective memory and sense of place of its citizens [7]. The conservation and utilisation of historic districts play important roles in the continuation of the city’s historical heritage and cultural legacy and in promoting high-quality urban development.
However, the rapid expansion of cities in the past has led to the disappearance of a large number of historic districts through large-scale demolition, monolithic management and the relocation of indigenous people; for example, the number of hutongs in Beijing has decreased by about 50% since 1949, and the population living in historic districts has decreased by about 44%. In addition, 160 cultural heritage sites have been demolished in Tianjin since 1980, and other phenomena have occurred throughout the country [8]. The number of Cultural Street Vending spaces in historic districts has decreased even more precipitously. For example, Xi’an, a historic and cultural city, has gone from having 95 traditional bazaars [9] in 1959 to less than 10 today. In recent years, the national and local governments have started to address this issue by proposing policies and optimisation guidelines such as “one city, one policy” and “one street, one policy” [10]. However, the unification of management and implementation, the homogenisation of development models [11], the imbalance between physical space and immateriality [12] and so on have led to a decline in and even the disappearance of the local character of the city, and the phenomenon of “constructive destruction” still prevails.
The reason for the disappearance of the local characteristics of the Cultural Street Vending space is that in the past, the renovation and upgrading of historic districts focused more on the “material” characteristics, while the “immaterial” characteristics such as culture and activities, which carry the important connotations of the market space, were often abandoned. At the same time, human perceptions have been neglected, as each person creates his or her own memory map [13] of the environment, especially for the differences in perception between different states of time. Many scholars at home and abroad have begun to carry out urban space research from the traditional parcels as the core gradually shifted to the street scale, such as Kevin Lynch [14], Jan Gehl [15], Stephen Marshall [16] and other scholars who created classic theories. The objects also include commercial streets, historical and cultural streets and residential streets [17,18]. At the same time, it has also gradually shifted from the material components of the built environment to humanised needs. The methodology has also shifted from qualitative to qualitative–quantitative combination to grasp the characteristics of the street space [19]. However, many studies still consider street space as a static object and lack a comprehensive discussion of multiple temporal dimensions. Streets may present significant spatial differences due to different times of the day, especially Cultural Street Vending spaces, which carry special urban memory connotations, presenting two completely different street atmospheres on market days and non-market days. Therefore, considering the differences in urban street spaces in different time states helps to grasp the characteristics of the research object more comprehensively. In this study, the Cultural Street Vending space is included in the urban street research object to grasp the law of the changes occurring in its spatial perception according to the different time states, including the semantic perceptual structure difference, the elemental perception difference and the correlation between the semantic perception and the built environment elements. This study provides a methodological addition to the identification of the connotative characteristics of this type of space in urban streets while complementing it with a more comprehensive semantic scale and elemental library.
2. Literature Review
2.1. Identification of Historic District Elements
In the process of urban regeneration, clarifying the composition of the characteristic elements of historic districts helps to preserve heritage resources. In Streets and Patterns, Stephen Marshall [16] quantitatively analysed a large sample of streets and established a systematic rating system, and his perspective on thinking about quantitative analysis has influenced subsequent scholars. Numerous scholars, on the one hand, have identified the elements of historic districts through different research perspectives. The spatial pattern characteristics [20] and built environment elements [21] of historic districts can be summarised through the analysis of historical data. Massimiliano Masullo et al. [22,23] discussed the restorativeness of historic districts from four perspectives: architectural elements, environmental elements, activities and the acoustic environment; Li Xin et al. [24] further explored the complex relationship between restoration effects, landscape character, preferences and site linkage factors; Rahman Tafahomi [25] discussed the differences in the spatial distributions of physical and non-physical elements in historic districts; Yue Hu [26] discussed the sustainable assessment of heritage resources in historic districts from the perspective of elements such as the landscape, ancient trees and protected buildings; and Jiang Haobo [27] emphasised the importance of colour elements in urban regeneration. On the other hand, the strengths of the characteristics of each element of an urban street space can be grasped through a psychological evaluation combined with a quantitative analysis. At the urban scale, the characteristics of the elements can be grasped through their proximity and distance distribution [28]. In contrast to urban parcel-scale studies, Street Urbanism [29] proposes that streets are characterised by more informal activities, more important functions as carriers of urban imagery and more pronounced transient differences. At the street space scale, the combination of psychological and physical quantities can guide the conservation and regeneration strategy of the historic district [30]. In terms of street types, most of the current research focuses on commercial streets, historical and cultural streets and residential streets. There are a small number of studies involving streets with informal vendors’ activities such as food stalls [31] and vegetable markets [32] in terms of the object of study, and focusing on the total amount of data or averaging the data over the statistical time span in terms of the analytical perspective. However, there is still a lack of research on Cultural Street Vending spaces, which carry special urban memory connotations, especially the comparative analysis of their spatial perceptual characteristic differences in different time states, which needs to be further studied.
2.2. Environmental Perception
Kevin Lynch argued that cities can be perceived, and he emphasised the connection between constituent elements of cities and their impressionability [14]. The results of user perception are often used to evaluate elements of historic districts. One of these measures is visual perception. An evaluation of streetscape images can provide direct insight into people’s visual preferences [33] or an evaluation of spatial quality [34]. Image material can be actively acquired by the researcher to explore the contribution of the variation between the feature elements to perception [35] or by having the subject evaluated [36,37]. Images can also be provided by users, and the acquisition of web images is effectively a passive participatory approach, with large amounts of image data being used to explore correlations between street elements [38] and the distribution of visitor interest in the historic district [39]. Based on City Imagery Theory, the subjects can also actively point out visual or impressionistic elements. The psychology of place further developed this theory, e.g., Mental Maps [40], The Psychology of Place [41]. In terms of operational methods, scholars use the element recall method [42], in which the relationship between the frequency with which each element is pointed out and the psychological perception outcome is applicable to the evaluation of the influence of the environment on human perception [30]. Eye tracking is one way of improving efficiency [43,44].
Another measurement method is semantic perception, which determines the dimensions of element evaluation. The semantic differential method (hereafter referred to as the SD method) was first proposed by Osgood [45]. Unidimensional semantic evaluations are usually satisfaction or preference ratings and are suitable for cross-sectional comparisons between multiple elements [46]. Semantic dimensions can also be multidimensional. Zhuang Weimin et al. [47] attempted to evaluate historic districts using six semantic dimensions, rich, safe, pretty, energetic, boring and frustrating, through machine learning. Wang Jiangjun et al. [48] used 22 semantic dimensions to conduct a perceptual study of the colour spaces in historic districts and found a strong correlation between colour schemes and pleasantness. Wang Xingyi et al. [49] used 40 adjective pairs to psychologically evaluate improvements to historic districts, elucidating the effects of urban landscape improvements.
Currently, many studies have analysed the characteristics of street space and its value through quantitative methods such as the element recall method, SD method, etc., but there is a lack of evaluation methods to adapt to the spatial characteristics of many different time dimensions. In particular, there is a lack of scientific analysis of the internal law of changes in the perceived characteristics of the street vending space in different time dimensions. However, by combining the SD method with the element recall method, the relationship between semantic perception and built environment elements can be well clarified, thus guiding the preservation and renewal strategies under multiple time dimensions.
2.3. Conservation and Renewal of Historic Districts
Scholars have focused on the unique functions and cultural values of historic districts, and their conservation strategies have been based on different perspectives. Jan Gehl emphasised early on the importance of human subjectivity in physical space and proposed a series of design rationales for enhancing the humanistic quality of cities [15]. From the perspective of value, people and heritage resources in historic districts are considered to be important expressions of value [50], and the revitalisation of heritage resources brings obvious economic benefits to the surrounding urban lots [51]. From the perspective of compatibility, in addition to the tangible physical indicators of new buildings themselves, district location, architectural culture, social customs and value perceptions affect the evaluation of historic districts [52]. From the perspective of social relationship networks, scholars have emphasised the importance of adapting the spatial and functional patterns of historic districts to the values and needs of their users [53]. In terms of differentiation from other areas of the city, historic districts reflect a stronger restorativeness in their positive emotional impact on pedestrians [54] as well as a different form of attraction for tourism [55], but the value needs of tourists often do not coincide with those of local residents [56]. In terms of resource integration, historical resource assessment tools [57], the relationship between historical architectural resources and street spaces [58] and cultural landscape resources [59] are also applied to conservation and regeneration tools. Scholars have discussed in detail the unique functions of historic districts, their cultural values and their preservation strategies from different perspectives, but there is a lack of a research perspective that considers humanistic activities and historic districts as a whole. That is, the special selling goods, activities and vendors in the Cultural Street Vending space are regarded as important constituent elements for the identification and extraction of the local characteristics of the historic district.
In summary, although many scholars’ research perspectives on historic districts have been mainly focused on the street scale, the research methodology has also been through quantitative means of analysis, such as environmental perception. However, there is a lack of research on street vending spaces with special human activities, especially comparative analysis of changes in spatial perceptual characteristics and their differences under different time dimensions. This study inherits the concept of quantitative street-scale research in Street Urbanism, and takes the Cultural Street Vending space as the object of study, adding to the theory the scope of discussion of the changing attributes of streets in the time dimension. Meanwhile, by combining the SD method with the element recall method to explore the internal law of changes in spatial perceptual characteristics under different time dimensions, it provides a methodological supplement for the identification of connotative characteristics of this type of street space. In this paper, from a spatio-temporal perspective, we took the historic district of Baxian Temple in Xi’an, China, as the research object to explore the perceptual characteristics of the street space and the changing law under the state of market day and non-market day. The results of the study can provide an effective design basis for conservation renewal strategies under the multi-temporal dimension of this type of street space.
3. Materials and Methods
3.1. Materials
This study chose seven streets of Baxian Temple historic district (Figure 1) in Xi’an, Shaanxi Province, China (Table 1) as the research object, which is also a national cultural heritage unit. The Baxian Temple has two annual temple fairs, held on the first and fifteenth days of the year, which are also recognised on the national intangible cultural heritage list. In addition, there is also a market in this area every Sunday, where vendors gather from all over the city.
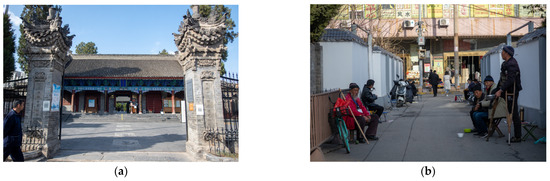
Figure 1.
Baxian Temple Historic District: (a) Baxian Temple; (b) fortune-telling street vending. Source: https://www.zentravel.cc/xianbaxian.html, accessed on 12 December 2023.

Table 1.
Objects of study. Source: authors’ own.
The Cultural Street Vending space in Baxian Temple mainly hosts activities such as antiques, painting, calligraphy and fortune-telling services. Meanwhile, the time for this type of Cultural Street Vending activity is relatively fixed.
3.2. Methods
Seven streets with vendors around Baxian Temple were selected and numbered【1】 to 【7】. We took videos of each street on a non-market day and a market day, numbering the street videos as 【1N】 to 【7N】 on the non-market day and 【1M】 to 【7M】 on the market day. That is, each street was recorded as two videos, which were used for participants to conduct the perception experiment. In order to avoid the perception bias caused by different viewpoints, we kept the same person, shooting at a height of 1.6 m with a frontal angle. And each video recorded the street from the start point to the endpoint, and then from the endpoint back to the start point. For the shooting time, we chose 10:00–11:00 at the beginning of the busiest phase of the market day. To avoid weather and time of day bias, we chose the same weather and time for the non-market days.
In Table 1, we show the information on the experimental streets in detail. We looked at a total of seven streets, of which 【6】 and 【7】 were divided into two sections by an intersection, resulting in a large difference in the landscape between the two sections, and therefore the street was divided into two parts for examination. Each street has two codes, such as 【1M】 and 【1N】, which represent the state of street 【1】 on market days and non-market days, respectively. The length of each street is in the range of 70–220 m, with an average length of about 120 m. The width ranges from 4 to 20 m, with an average width of about 12 m. The number of vendors in each street on the market day ranged from 28 to 137.
3.2.1. Selection of Adjective Pairs
Strictly speaking, there is no strict rule for the number of adjective pairs in the SD method. However, as a reference value, a relatively fixed thesaurus of adjective pairs related to street space has been summarised based on the literature, and it is suggested that about 30 pairs of adjectives are optimal [42]. At the same time, three principles of adjective selection are given. It is easier to form completely opposite adjective pairs, adjective pairs that are symmetrical on both sides as the centre point and adjective pairs that are used frequently. On the basis of related research [28,30,49], combined with the characteristics of the experimental street, such as “spontaneous” and “bustling”, 33 adjective pairs were finally selected (Figure 2).
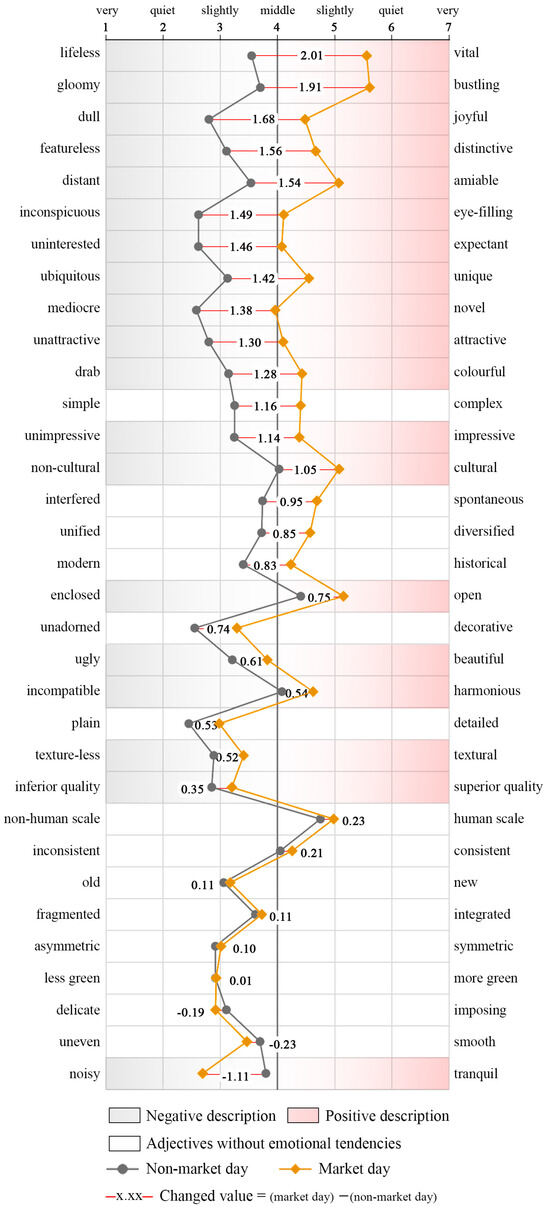
Figure 2.
Semantic perception evaluation results. Source: authors’ own.
3.2.2. Selection of Participants
The larger the number of participants, the more representative and accurate the results will be, but there are practical limitations of the survey. According to the literature [42], as well as many current studies [28,30,49], the number of participants is usually around 20–50. In this study, a total of 30 people were selected to participate in the psychological perception experiment. At the same time, the participants were all architecture students. The reason is that the distinction of semantic differences between adjectives in the SD method requires the support of architectural knowledge background [42]. In particular, in the elemental recall method, the participants need to have some architectural knowledge in order to more accurately describe the recalled elements, such as “moon gate” and “screen wall”.
3.2.3. Experimental Procedure
First, each video was shown to the participants and rated on a questionnaire scale of 1 to 7 using 33 pairs of adjectives, e.g., dull–joyful: 1 (very dull), 2 (quite dull), 3 (slightly dull), 4 (middle), 5 (slightly joyful), 6 (quite joyful) and 7 (very joyful). Second, the elements that characterise the site are captured through the element recall method (Note 1). Immediately after completing the SD questionnaire for each video, the participants were asked to recall the specific and non-specific elements. The non-specific elements were submitted as text and the specific elements were submitted as text with pictures.
3.3. Analytic Techniques
After collecting the SD method questionnaires and obtaining all adjective pairs scores, factor analysis was conducted for three types. They were overall factor analysis, market day factor analysis and non-market day factor analysis. The overall factor analysis included all the data from both market day and non-market day, for a more comprehensive understanding of the overall perception of the space. The factor analysis of market day and non-market day and the comparison of the two were helpful in understanding the difference in psychological perception in the space of two different times. In the three types of factor analysis, the adjective pairs with the highest correlation in each type of factor were selected from 33 adjective pairs. Therefore, these adjective pairs can be used as important adjective pairs for analysing semantic perceptions.
After collecting the element recall questionnaires, all the specific and non-specific elements pointed out by the participants were counted. If an element was mentioned by several participants, this high-frequency element represented a common impression of the street, to a certain extent excluding the influence of differences in individual perception. Elements mentioned with different frequencies were categorised and counted in the Element Bank tables (Appendix A) and Cognitive Map (Appendix B).
Finally, we correlated correlation analysis between semantic perception results and element statistics results, so as to explore the interactions between psychological quantities and built environment elements. In order to exclude the correlation error caused by individual differences, the SD questionnaires and the element recall questionnaires used the same group of participants. At the same time, we compared and analysed the differences in the environmental elements of each street, so as to understand the differences in emotional cognition produced when a certain spatial–physical element is changed. The research framework is shown in Figure 3.
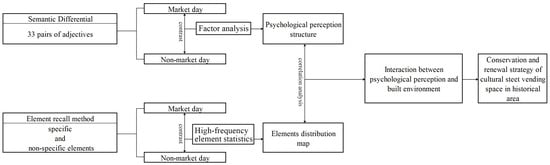
Figure 3.
Research framework. Source: authors’ own.
4. Results
4.1. Semantic Perception Analysis
4.1.1. Market Day and Non-Market Day Semantic Evaluation
Figure 2 shows the results of the SD method questionnaires. According to Chinese semantics, adjectives with obvious positive emotions are placed on the right side and indicated by the red area, while adjectives with obvious negative emotions are placed on the left side and indicated by the grey area. And adjective pairs without colour areas indicate no obvious emotional tendency. Secondly, two lines were obtained by averaging the evaluation scores of each adjective pair for the seven streets on the non-market day and the market day (hereafter referred to as 【N】 and 【M】). The results for 【N】 are represented in the graph by a grey line, and the results for 【M】 are represented in orange. The change values represent the magnitude of the increase or decrease in the score of 【M】 compared to that of 【N】, and the adjective pairs are arranged vertically in the order of the change values from largest to smallest.
The highest score for 【N】 was 4.75 for “non-human scale–human scale”, and the lowest score was 2.45 for “plain–detailed”. 【N】 could be described overall as “plain” > “unadorned” > “mediocre” > “uninterested“ > “inconspicuous” > “unattractive” > “dull” > “inferior quality“ > “texture-less” > “asymmetrical” > “less green”. Of these, 63.6% of the descriptions were negative adjectives, indicating that the historical and cultural elements of the Baxian Temple street space did not evoke positive affective changes strongly enough in the non-market day state.
On 【M】, the highest score of 5.61 was for “gloomy–bustling” and the lowest score of 2.69 was for “noisy–tranquil”. 【M】 could be described overall as “bustling” > “vital” > “noisy” > “open” > “delicate” > “less green” > “cultural” > “amiable” > “plain”. Of these, 55.6% were positive descriptions and 11.1% were negative descriptions. This shows that the vendors and vending activities in the market day state had a positive impact on people’s perceptions while changing the structure and outcome of people’s perceptions of the street elements.
By comparing the change values on 【M】 and 【N】, it was found that 93.3% of the adjective pairs with an absolute value of change >1 had a clear emotional tendency. Among them, 78.6% of the adjective pairs shifted significantly from negative to positive evaluations when 【N】 shifted to 【M】. For example, “lifeless” to “vital”, “dull” to “joyful” and so on. In addition, “noisy–tranquil”, which had the largest negative change value (−1.11), and “gloomy–bustling” can describe opposite emotional tendencies towards the same thing in Chinese semantics, with the latter having an even larger change value (1.91), indicating that positive feelings (“bustling”) take precedence over negative feelings (“noisy”) on 【M】. Of the adjective pairs with an absolute value of change <0.5, 88.9% had no significant affective tendency.
4.1.2. Factor Analysis
Table 2 shows the results of factor analysis. The factor analysis was performed on the 33 pairs of adjective score values for all streets of 【1–7N】 and 【1–7M】 (hereafter referred to as 【W】) with principal component analysis to obtain factors with eigenvalues >1, and with rotation method of maximum variance. The result of the KMO sphericity test was 0.927, with a significance of less than 0.001, indicating that the data were suitable for use in the factor analysis. Table 2 helped us understand which factors make up the overall semantic cognitive structure of the Baxian Temple Cultural Street Vending space and find the representative adjective pairs with the highest relevance in each factor.
Table 2.
Whole semantic perception factor analysis. Each factor is represented by a different background color, in order to better illustrate which factor each adjective pair belongs to. Source: authors’ own.
The result was that six factors were extracted, with a cumulative contribution of 62.9%. The factors, in descending order of contribution, were ① the impression factor, for which the representative adjective pair was “uninterested–expectant”; ② the vitality factor, for which the representative adjective pair was “lifeless–vital”; ③ the morphosis factor, for which the representative adjective pair was “even–smooth”; ④ the organicity factor, for which the representative adjective pair was “less green–more green”; ⑤ the affinity factor, for which the representative adjective pair was “delicate–imposing”; and ⑥ the symmetry factor, for which the representative adjective pair was “asymmetry–symmetry”. In contrast, the adjective pairs with the largest contributions, ① the impression factor and ② the vitality factor, overlapped greatly with the adjective pairs with absolute values of change >1 in Figure 2, indicating that factors ①–② were mainly influenced by vendors and vending activities, while the remaining factors ③–⑥ overlapped greatly with the adjective pairs with absolute values of change <0.5 in Figure 2, indicating that factors ③–⑥ were mainly influenced by the physical spatial characteristics of the street itself.
Figure 4 shows the results of the factor analysis for 【N】 and 【M】. A total of six factors were extracted from 【N】 (hereafter referred to as Fa①–⑥【N】). A total of eight factors were extracted from 【M】 (hereafter referred to as Fa①–⑧【M】). Comparing the results of the factor compositions of 【N】 and 【W】, we found that 63.6% of the adjective pairs in Fa①【N】 originated from Fa①【W】 and defined 63.6% as the degree of overlap of Fa①【N】 to Fa①【W】. Then, the degrees of overlap of Fa②–⑥【N】and 【W】 were 88.9%, 50%, 100%, 50% and 66.7%, respectively. Similarly, the degrees of overlap of Fa①–⑧【M】 and 【W】 were 100%, 100%, 75%, 75%, 66.7%, 66.7%, 100% and 50%, respectively. By connecting the factors with >80% overlap with solid lines and connecting those with 80–60% overlap with dashed lines, the correlations between the factors 【N】, 【M】 and 【W】 were found. ① The impression factor, ② the vitality factor and ③ the morphosis factor were the commonality factors of 【N·M·W】, and these three factors can be regarded as important factor evaluation scales for the Baxian Temple street space.

Figure 4.
Comparison of market day and non-market day. Each factor is represented by a different background color, in order to better illustrate which factor each adjective pair belongs to. Source: authors’ own.
4.2. Characteristic Element Identification
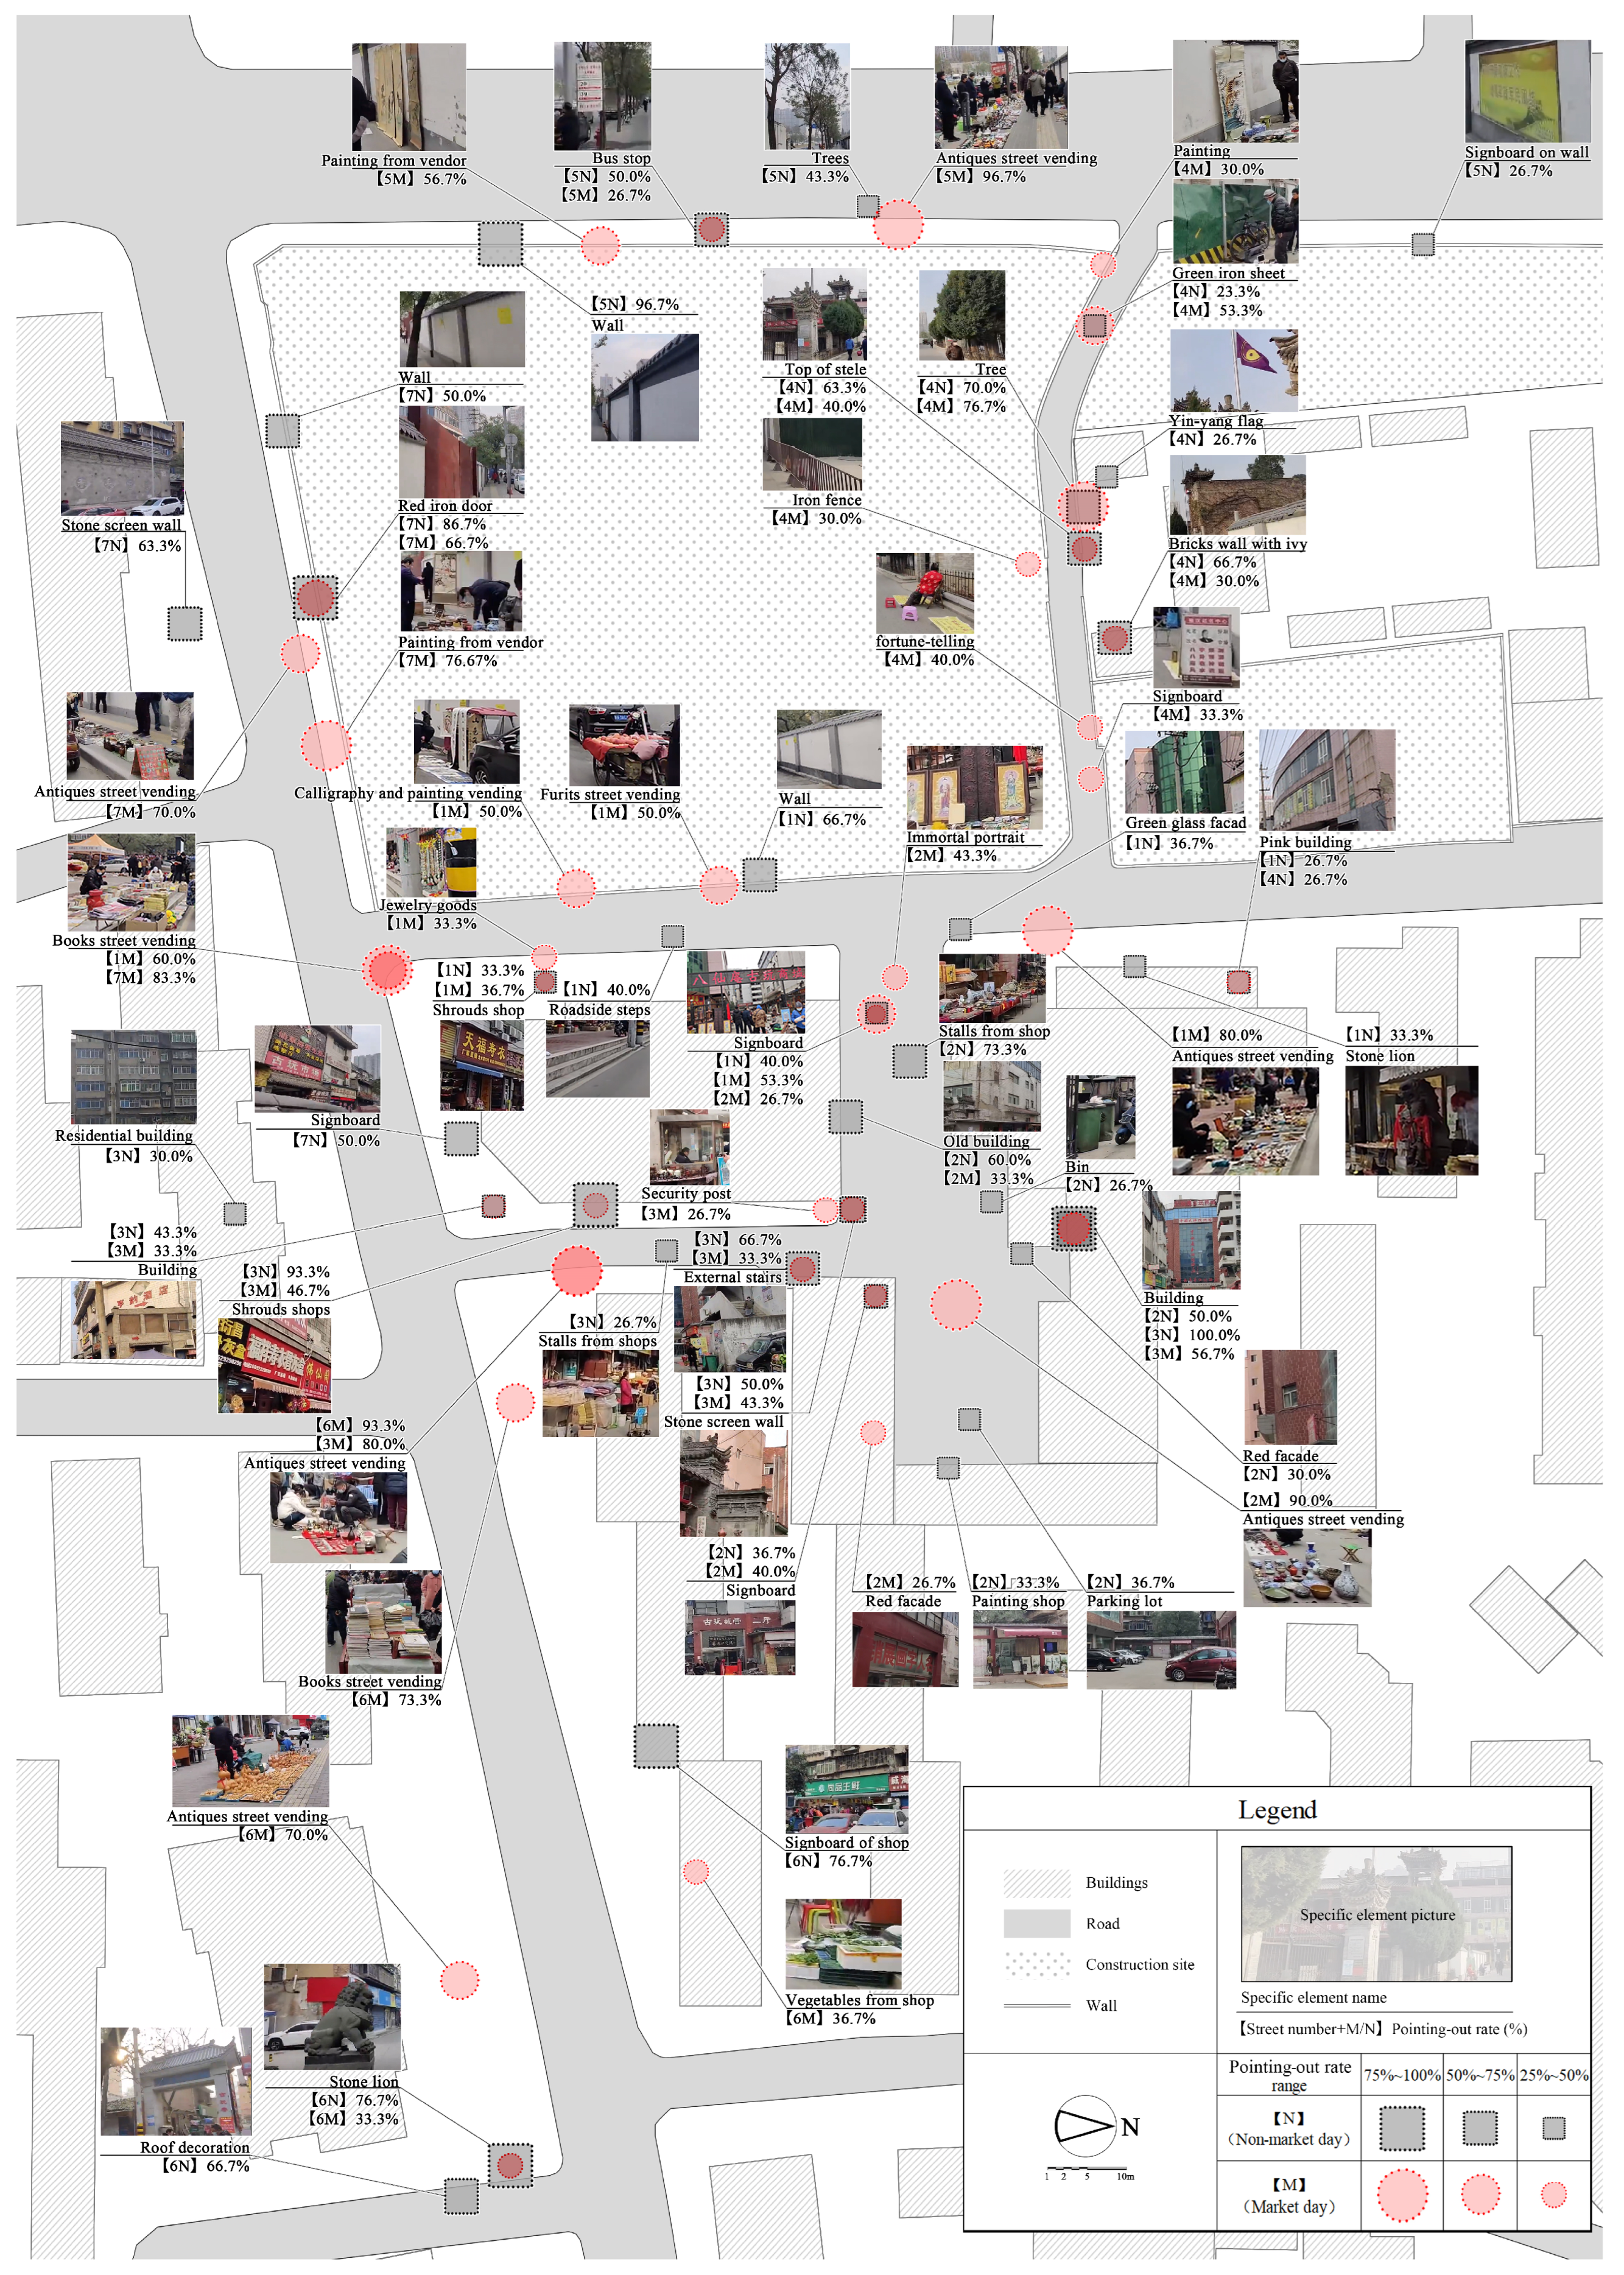
After the participants had completed the SD questionnaire, they were required to engage in repeated recall until no more elements could be recalled. Elements that were not unique in their recall were defined as non-specific elements, such as “many cars”, “red”, “many shops”, etc. The number of people pointing out the same element as a percentage of the total number of people was defined as the pointing out rate, and the non-specific elements with pointing out rates greater than 25% on the market day and non-market day were counted for each street, as shown in Table A1, Table A2, Table A3, Table A4, Table A5, Table A6 and Table A7 (Appendix A). Figurative and identified elements in the participants’ recalled content were defined as specific elements. Participants were asked to take images from the test video as specific elements to be counted. Because their orientations could be determined, the specific elements with pointing out rates greater than 25% were marked on a map, and the results of the tally are shown in Figure A1 (Appendix B). Figure 5 illustrates the street scenes corresponding to each street code.
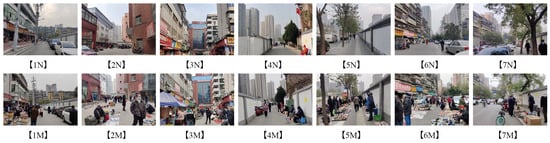
Figure 5.
Street scenes corresponding to street codes. Source: authors’ own.
4.2.1. Non-Specific Elements
Overall, “wall”, “telegraph poles”, “signboards”, “street lamps”, “trees”, “shops”, “goods” and “buildings” all had higher pointing out rates on 【N】, while the rates in each street decreased on 【M】. On 【M】, the elements with increased rates were “pedestrians”, “road”, “goods from vendors”, indicating that the street vending narrowed the range of people’s perception.
For all streets, the pointing out rates for “cars” were high. In streets 【1N, 2N and 5N】, cars were the first element. Except for street 【6M】, all the streets on 【M】 had the first element of “street vending”, while the pointing out rates for cars decreased in streets 【1–2M, 5M and 7M】. Thus, street vending diminished the perception of the “cars”. In streets 【3M, 4M and 6M】, however, the pointing out rate increased rather than decreased, as more cars occupied the pavement.
In terms of the number of elements, except for street 【4】, the total number of elements on 【M】 all slightly increased relative to 【N】. People’s concerns about colour did not change much between 【N】 and 【M】, but the components that contributed to the pointing out rates changed. For example, in street 【5N】, the white colour came mainly from the “wall” and “road signs”. In street 【5M】, the white colour came mainly from the “sky”, while the rates of walls and road signs dropped significantly. A comparison of similar situations on the other streets showed that, on 【M】, people were more sensitive to large areas of colour at longer distances.
4.2.2. Specific Elements
Overall, the specific elements pointed out by most participants were “street vending”, street components (e.g., walls, stone photomontage sculptures, etc.), and building components (e.g., shop signs, carvings, glass, etc.), in each street of Baxian Temple. Few participants pointed out an entire building.
Comparing the specific elements with the non-specific elements, it was clear that the non-specific elements with high pointing out rates, such as “cars”, “street lamps”, “telephone poles” and “street trees”, on most streets were absent in Figure A1. Although these elements were perceived due to large numbers, they lacked sufficient characteristics to form a coherent and tangible perception. These elements could be regarded as low-characteristic elements. The non-specific elements of “wall” and “signboards” were still pointed out among the specific elements by many participants. Due to a significant decrease in the pointing out rate, they could be defined as medium characteristic elements. In contrast to the non-specific elements, the specific elements with rising pointing out rates were “stone screen wall”, “top of stele”, “steps”, “brick wall” and buildings with distinctive facade features, which could be considered high-characteristic elements. Compared to non-specific elements, the pointing out rates of “street vending” in specific elements were slightly lower, but their types were richer and more clearly defined. For instance, in 【7M】, the rate of “street vending” as a non-specific element was 86.6% (Table A7), while in the specific elements, it was divided into “books street vending”, with a rate of 83.3%; “painting from vendors”, with a rate of 76.7%; and “antiques street vending” with a rate of 70.0% (Figure A1). Therefore, it was also possible to consider the vendors’ and the goods’ high-characteristic elements.
Comparing the results of the pointing out rates for the specific elements on 【N】 and 【M】, it was found that the range of people’s perception was narrowed to a greater extent, which was similar to the pattern for the non-specific elements. For example, in street 【7N】 (Figure A1), the pointing out rates for “red iron gate”, “stone screen wall” and “wall” were high, at 86.7%, 63.3% and 50.0%, respectively, while on 【M】 “red iron gate” dropped to 66.7% and “stone screen wall” and “wall” dropped below 25%, indicating that the street vending narrowed the range of people’s perception horizontally. The highest rate (100.0%) for all specific elements was the “hotel building” in street 【3N】, which dropped to 56.7% on the market day. Similar results were found for street 【1N】 “pink building”, street 【2N】 “old building”, street 【3N】 “residential building” and “hotel building”, street 【4N】 “top of stele” and street 【6N】 “roof decoration”, which all had decreasing pointing out rates on market day, indicating that street vending made the height of the core of people’s perception drop in the vertical direction of space. Comparing the spatial distribution characteristics of specific elements, we found that the location of elements in 【M】 was related to the location of the street vending; for example, elements in street 【1–4M】 were distributed at both ends of the road, and elements in street 【6 and 7M】 were distributed on the right side of the road, which was consistent with the distribution of the street vending (Figure A1).
4.2.3. Relationship between Vendors and Elements Perception
We categorised all the elements recalled by the participants. The non-specific elements were divided into “buildings”, “building components” (e.g., walls, windows, signboards, etc.), “street components” (e.g., street lamps, road signs, garbage cans, etc.), “means of transportation” (e.g., cars, motorbikes, bicycles, etc.), “green”, “goods”, “humans” (e.g., vendors, cyclists, people walking, etc.), “texture” (e.g., brick, red paint, glass, etc.), “color”, “road” and “distant view” (e.g., tall buildings in the distance, sky, etc.). The classification of character elements added “street space” to the non-specific elements as characteristic nodal spaces, such as outdoor car parks, small squares, road intersections, etc., which also appeared in the submissions. The statistical results are shown in Table 3.
Table 3.
Statistics of specific and non-specific elements by type. Source: authors’ own.
The number of vendors and the number of elements in each category were subjected to a correlation analysis (Pearson), and the types of elements with significance values lower than 0.05 and correlations with absolute values greater than 0.5 were counted. The results are shown in Figure 6. The total number of elements, building components, street components, goods and humans were all found to be significantly correlated with the number of vendors. Humans of the specific elements had the highest relevance coefficient with the number of vendors. In conjunction with the findings in Section 4.2.1 and Section 4.2.2, the total number of elements is positively correlated with the number of vendors, indicating that although the physical perceptual range was reduced, the perceptual capacity increased. On the other hand, the building components were negatively correlated with the number of vendors. This indicates that on 【M】, although people’s perceptual capacity was expanded, it was only at a smaller physical scale, whereas for elements at greater distances, the perceptual capacity was actually reduced. In addition, the slope of change was greater for specific elements than for non-specific elements, suggesting that people had a stronger ability to visualise proximate things on 【M】.
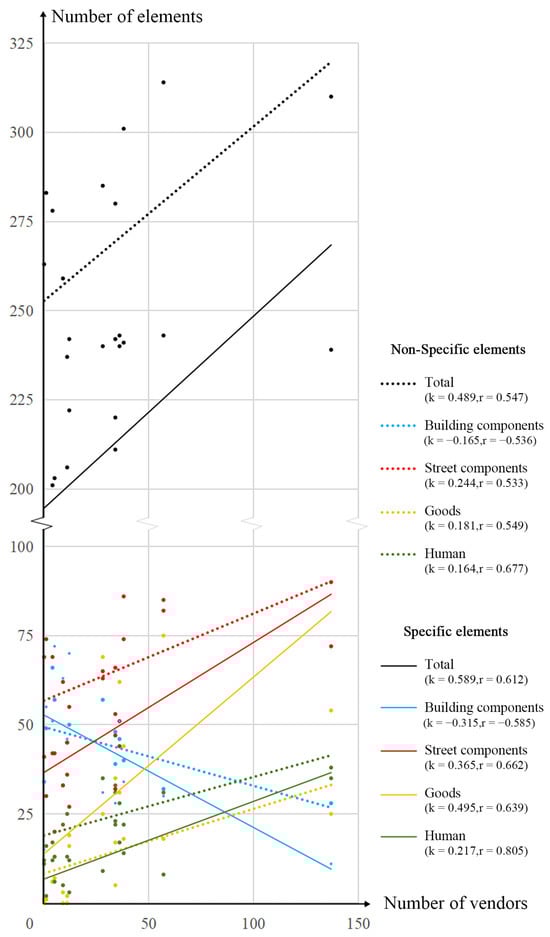
Figure 6.
Correlations between vendors and elements. Source: authors’ own.
Combined with the above analysis, human perception of 【M】 exhibited the characteristics of Figure 7:

Figure 7.
Market day perception change law. Source: authors’ own.
- People’s perceptual focus was more clustered both horizontally and vertically over the physical range.
- For elements at close distances, the number of perceived elements increased and the figurative ability increased.
- The perception of colour was more sensitive for larger areas at a distance.
4.3. Correlation Analysis of Semantic and Elemental Perception
4.3.1. Relationship between Street Elements and Fa①–⑥【W】
Comparative analysis of the mean values of representative adjective pairs of 【M】 and 【N】 in Fa①–⑥【W】 was shown in Figure 8. The difference was mainly in the impression factor and vitality factor. On 【N】, the scores of “uninterested–expectant” and “lifeless–vital” were 2.6 and 3.5, which were negative descriptions, while in 【M】, the scores increased to 4.1 and 5.6, respectively, with an increase in positive feelings. The mean values of the two adjective pairs on each street were analysed for correlations (Pearson) with the numbers of specific and non-specific elements and results with significance values lower than 0.05 and correlations with absolute values greater than 0.5 were counted, as shown in Figure 9.
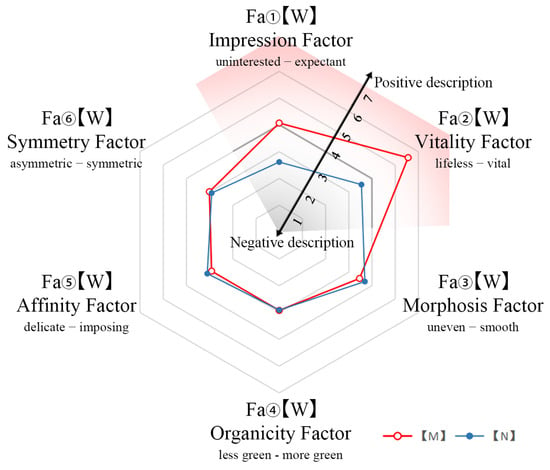
Figure 8.
Differences in psychological perception between the market day and the non-market day. Source: authors’ own.
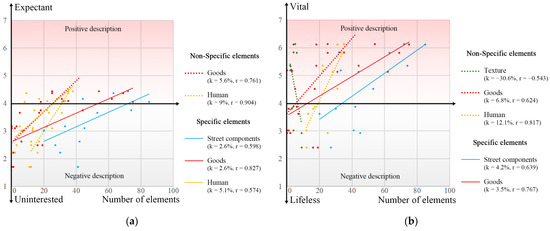
Figure 9.
Correlation analysis of representative adjective pairs and element perception: (a) impression factor (“uninterested–expectant”); (b) vitality factor, (“lifeless–vital”). Source: authors’ own.
For the “uninterested–expectant” value, the number of scores was found to be positively correlated with “goods” and “humans” for the non-specific elements and positively correlated with “street components”,” goods” and “human” for the specific elements. The correlation coefficient for “humans” was the highest in the non-specific elements, and “goods” was the highest in the specific elements, indicating that the vending activities in 【M】 caused a sense of anticipation. The number of street components increased in 【M】 due to the people’s increased perceptual capacity in a small area. A similar correlation was seen for the “lifeless–vital” value, where vending activities made people feel that the street was vital, and they also perceived more street components. The difference was that the perception of vitality did not correlate with the figurative “humans”. It was negatively correlated with texture, which, when combined with the results of the elemental recall method, indicated that the main source of texture was the upper parts of the buildings, such as the “surface of old residential building”, “walls with peeling surfaces”, “glass”, etc. When people paid more attention to the surfaces of the buildings, the “lifeless feeling” also increased.
The scores of representative adjective pairs from Fa①–⑥【W】 for each street were averaged separately and then correlated with the number of every element type, and the results are shown in Figure 10. The scores are shown as line graphs in the figure, and a table of the correlation results is provided below. The overall sense of expectation of each street was rated negatively. In terms of the vitality factor, in addition to the conservation and renewal of street components, it is also necessary to consider the material of the upper and middle facades of the buildings, which can be repainted or designed with characteristic facades. In terms of the morphosis factors, the results did not correlate with the form of the lower parts of the buildings or the concave and convex shapes of the building components but rather with the number of “distant view” elements due to the fact that in street 【4】 and 【5】 there were only continuous walls on both sides of the street, so the wall was the main factor influencing the sense of smoothness. For the organicity factor, a small number of trees have a substantial uplift effect on the street space, but too much planting has little effect. There was little difference in the affinity factor between the streets, which all had a “delicate” feeling. In terms of the symmetry factor, the perceived number of signboards and intersections was positively correlated with the “symmetric” value.
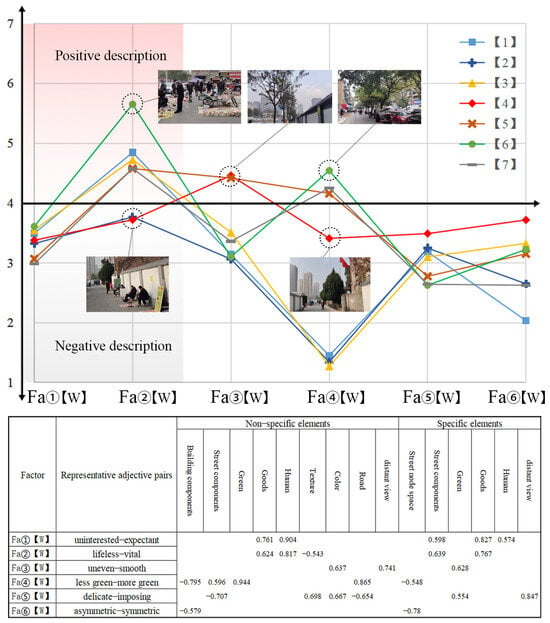
Figure 10.
Built environment elements and psychological perception correlation of 【W】. Source: authors’ own.
4.3.2. Relationship of Street Elements to Fa①–⑥【N】 and Fa①–⑧【M】
The averages of the representative adjective pairs from Fa①–⑥【N】 scored for each street on 【N】 were correlated with the number of every element type, and the results are shown in Figure 11a.
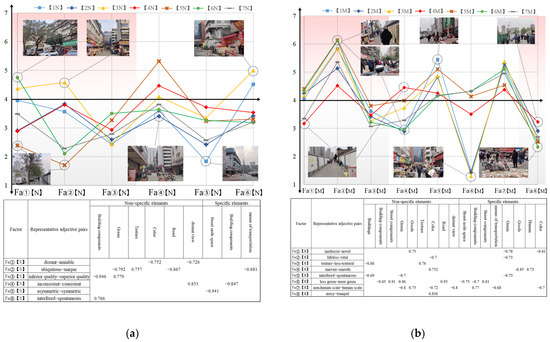
Figure 11.
Built environment elements and psychological perception correlation: (a) non-market day; (b) market day. Source: authors’ own.
In street 【6N】, “signboards” and “stores” had a high pointing out rate among the non-specific elements and contained a rich variety of colours but did not leave a certain impression of a certain colour, whereas in street 【5N】, grey and white became the uniform colour of the whole street so that the high pointing out rate of “white” created a “distant” feeling. In addition, the smaller the view and the smaller, which means the width-to-height ratio of the streets, the more positive the feeling. A sense of consistency is related to the degree of openness of views and the building components. It was also found that dilapidated building components can give a sense of “inferior quality” as well as a sense that the street is “spontaneous”.
The averages of the representative adjective pairs from Fa①–⑧【M】 scored for each street on 【M】 were correlated with the number of every element type, and the results are shown in Figure 11b.
Compared to the case of 【N】, colour showed more correlations across the adjective pairs in 【M】, with negative correlations with “mediocre–novel“ and “lifeless–vital” and positive correlations with “noisy–tranquil“. Combined with the perceptual characteristics of people on 【M】, we found that although street vending enriched the colour diversity of the street to a large extent, the amount of information was so great that the number of perceived colour elements actually became smaller, while the colours of larger areas at a distance were more easily perceived. The richness of the colours of the street vending therefore gave a “novel” and “vital” feeling.
In addition, a concentrated distribution of vendors stimulated positive feelings more strongly. For example, street 【4M】 had a shorter street length and a relatively even distribution of vendors, with a high density of vendors per metre and the lowest ratings for “novel” and “vital”. In contrast, 【6M】 was the longest street and actually had a lower density of vendors, but because most of the vendors were concentrated in one area, the rating was very high.
5. Discussion
This study investigated the difference in the perception of street space between market day and non-market day. The findings confirm that this difference does exist and is significant. Through the SD method, it was found that vendor activities caused people’s semantic perceptions to show a shift from negative to positive. Through the element recall method, it was found that vendor activities made participants’ perceptions narrow and perceptual density increase. After factor extraction of the survey data from the SD method and correlation analysis of the factor results with the number of each type of element, we found the relationship between the representative adjective pairs in each factor and the street elements. Among them, the impression factor and the vitality factor had the greatest difference between market day and non-market day. The difference was mainly caused by the vendor activities, while we found that the centralised distribution of vendors performed better. As vendors led to a change in the semantic perceptual structure, the street elements affecting psychological quantities also differed in their performance on market day versus non-market day. In the non-market day, non-specific elements have a greater impact on the overall perception of the street, and more attention needs to be paid to recurring low-characteristic elements, especially building components. On the other hand, on market day, the influence of specific elements on the perception of the street increases, and people are more likely to pay attention to street elements with high characteristics, especially street components and vendor goods.
In terms of results, the signboards of the lower parts of the buildings had a strong appeal to people. The greenery and street dimensions had a greater impact on the psychological evaluation, while historic buildings had limited appeal, which was consistent with previous studies [30,60]. In practice, however, street perceptions may change due to differences in topographic elevation, which may lead to concerns about ground coverings [30], which were not reflected in this study because the difference in elevation was not significant in our streets. In addition, we found that although the physical characteristics of the street itself did not change on market day, the results of the evaluation of these elements of the street were more positive, and the psychological structure changed due to the influence of vendor activities. In general, the perception of the street vending space is negative. It is perceived as noisy, disruptive to traffic, and problematic in terms of environmental pollution [61]. In our study, however, Cultural Street Vending spaces mainly sell cultural goods and cultural services. Compared with problems such as pollution and traffic congestion that are easy to appear in snack-type stalls, they are not presented to the same extent within Cultural Street Vending. The focus of the street experiencer differs from that of the planning designer [62], who tends to be more concerned with the spatial pattern, the historic buildings, the history, the building construction, etc. From the perspective of the experiencer, we found that the three elements that were most frequently noted were the architectural components (e.g., signboards, windows, walls, etc.), street components (e.g., street lamps, road signs, sculptures, etc.), and dynamic components (e.g., motorised vehicles, non-motorised vehicles, vendors and pedestrians). This was in general agreement with the findings of Tsumita Hiroshi et al. [30], with the difference being that non-architecture-related elements of the cultural market space in the market day state, such as vendors and vendor goods, were noted in large numbers by the participants, and there was a structural change in the perceptual patterns of the physical character elements of the street.
Based on the theoretical framework of Street Urbanism, this paper focuses on comparing different time states of Cultural Street Vending space, which complements the theory’s scope of temporal variation attributes about streets. Meanwhile, the connotative characteristics of this type of space are further scientifically grasped through the combination of the SD method and the element recall method in environmental cognitive psychology. Firstly, the positive transformation of negative semantics in non-market days in market days, and the difference between the perceptual elements on the non-market day and market day confirm the existence of temporal differences in the street space, and the differences are significant. Secondly, regarding the aspect of temporal variation attributes of streets, we found a law of narrowing the perceptual range and expanding the perceptual capacity of participants in market days and multiple correlations between semantic perceptions and elements of the built environment.
This study can be improved in the future in the following ways:
- The SD method, with 33 pairs of adjectives, has a large semantic dimension and is slightly more difficult to understand, so 30 architecture students were chosen as evaluators. In the future, based on the representative adjective pairs extracted from the factor analysis, experiments can be conducted with people from different social backgrounds on the basis of reducing the number of semantic meanings to increase the size and diversity of the sample.
- There is a need for more street objects of this type to explore how perceptual patterns and cognitive maps differ across Cultural Street Vending spaces.
- The conservation renewal strategy that was proposed based on the results of the analysis of psychological perception and elemental perception lacks empirical research. In the future, a secondary evaluation can be conducted by simulating the effect of improved streets [49] to verify the actual effect of the improved strategies on psychological perception.
- In this paper, the negative effects of Cultural Street Vending, such as noise, have not been further investigated. In the future, questionnaire surveys of nearby residents can be used to verify whether the negative problem exists and how serious it is.
- This paper makes an attempt at the combination of the SD method and element recall method in terms of methodology for the temporal variation attributes of streets in Street Urbanism. However, at the theoretical level, a complete explanatory model between cognitive elements and built environment elements has not yet been established, which needs to be improved by more street samples in the future. At the same time, exploring the temporal variation attributes of streets in the future can not only be based on semantic cognition and memory image cognition but also include other data acquisition means advocated in the DAD (data augmented design) [29]. This will also be one of the attempts of this paper in the future.
6. Conclusions
By comparing the perceptual differences between the seven streets of the Baxian Temple historic district on a market day and a non-market day using the SD method and the element recall method, we grasped the psychological perception structure of the Cultural Street Vending space in daily and non-daily conditions and then identified and extracted the local characteristic elements. Then, we made a map of the distribution of the elements. Through correlation analysis, we explained the relationship between psychological quantities and elemental perceptions. The main conclusions are as follows:
- The SD method revealed that street vending brought more positive feelings. Six factors were extracted in 【W】 through factor analysis, and the overall characteristics of the Baxian Temple Cultural Street Vending space were “expectant” and “vital”, which were mainly caused by the activities of the vendors. Six factors were extracted in 【N】, and the main characteristics were “distant” and “ubiquitous”. In 【M】, eight factors were proposed, and the characteristics of “novel” and “vital” were highlighted. It can be said that the activities of the vendors on the market day significantly elicited positive evaluations, reflecting the local characteristics of the street space in Baxian Temple. On the other hand, the representative adjective pairs of each factor could be used for the spatial evaluation of the historic streets of Baxian Temple for the whole space or in different states. Among them, the impression factor, vitality factor, and morphosis factor were found to be the three commonality factors in 【N·M·W】.
- Specific and non-specific elements were identified through the element recall method. A comparison of the specific and non-specific elements identified the local element components with high, medium, and low local characteristics. The contrast between 【N】 and 【M】 revealed that human perception was smaller in scope, larger in volume and more figurative on market day.
- A correlation analysis between psychological perception and elemental perception uncovered the relationship between the psychological quantities and the physical environments of the streets. People’s positive psychology has a positive correlation with the perceived number of elements of vendors, goods, street components and the way vendors are distributed, while a negative correlation with the perceived number of elements of greenery, colour and texture.
Based on the results of the above analyses, suggestions for improvement are proposed for this type of street vending space. On the whole, vendors are the core factor affecting perception. Measures such as strengthening the category characteristics of vendors’ goods, providing guiding cues for vendors to congregate in a certain area to sell their goods, and designing the vendors’ activity areas, etc., can strengthen the perception of the locality of the Baxian Temple historical street space. For example, guide signs can be set up at the more open node space of each street section, or ground materials and colours can be used to differentiate the vending areas. At the architectural level, a more unified design language should be adopted for windows, cornices and external equipment. In particular, the colours of the facade should be considered as a unified neighbouring colour for the upper part of the building, while the lower part of the building can be more colourful. As for the material texture, the designer should pay attention to the fact that the way of renewing the material has two sides. The old material will reduce the sense of quality, but at the same time also make people feel that the street is “spontaneous”. In terms of street elements, the existing high-characteristic elements should be protected, such as stone lions, walls, decorative ancient roofs, and so on. In terms of greenery, the best results can be achieved by locally placing a small number of trees.
In this paper, this special Cultural Street Vending space is included in the object of urban space research, by grasping the characteristics of the perception difference in different time states and the interaction between the perception and the built environment. Theoretically, it can not only expand the research scope of Street Urbanism but also provide a new perspective for analysing the space in both time and space dimensions. At the same time, it can also provide a method for the identification of other similar spatial characteristics. According to the results of this study, for the urban renewal of this type of Cultural Street Vending space, urban management, planners and designers will be able to effectively learn from and refer to the specific evaluation scale, the differentiation of the space between market day and non-market day, and the elements that need to be optimised.
Author Contributions
Conceptualisation, methodology, resources, writing—original manuscript preparation: Y.Q., L.Y., T.G., D.Z., M.W. and Y.Y.; software, validation, formal analysis, and visualisation: L.Y.; data collation: T.G.; writing—review and editing, survey: L.Y., T.G., Y.R. and Y.L.; funding acquisition: Y.Q. and M.W. All authors have read and agreed to the published version of the manuscript.
Funding
This research was funded by the National Natural Science Foundation of China (No. 52108030) and the Natural Science Basis Research Plan in Shaanxi Province of China (No. 2023-JC-QN-0622).
Data Availability Statement
The materials and the data that support the findings of this study are available from the corresponding author.
Conflicts of Interest
The authors declare no conflict of interest.
Appendix A
This appendix shows the statistics of non-specific elements in each street on market days and non-market days. The white background in the table represents the data during non-market days and the red background represents the data during market days. Bolded words indicate that the element has increased on market days, or that the element is one that does not appear on non-market days.
Table A1.
Statistics of non-specific elements in street 【1】. Source: authors’ own.
Table A1.
Statistics of non-specific elements in street 【1】. Source: authors’ own.
| Street Number | Element Name | Pointing Out Rate | Pointing Out Rate Range | Number of Elements | Total Elements |
|---|---|---|---|---|---|
| 【1N】 | Cars | 83.33% | 75–100% | 1 | 8 |
| Wall | 70.00% | 50–75% | 4 | ||
| Telegraph poles | 66.67% | ||||
| Funeral supplies shop | 56.67% | ||||
| Signboards | 50.00% | ||||
| Trees | 33.33% | 25–50% | 3 | ||
| Pedestrians | 30.00% | ||||
| Street lamps | 26.67% | ||||
| 【1M】 | Street vending | 83.33% | 75–100% | 2 | 8 |
| Cars | 80.00% | ||||
| Wall | 66.67% | 50–75% | 3 | ||
| Pedestrians | 56.67% | ||||
| Telegraph poles | 50.00% | ||||
| Goods from vendors | 46.67% | 25–50% | 3 | ||
| Signboards | 36.67% | ||||
| Funeral supplies shop | 33.33% |
Table A2.
Statistics of non-specific elements in street 【2】. Source: authors’ own.
Table A2.
Statistics of non-specific elements in street 【2】. Source: authors’ own.
| Street Number | Element Name | Pointing Out Rate | Pointing Out Rate Range | Number of Elements | Total Elements |
|---|---|---|---|---|---|
| 【2N】 | Cars | 86.67% | 75–100% | 2 | 8 |
| Stalls from shop | 80.00% | ||||
| Buildings | 56.67% | 50–75% | 1 | ||
| Antique shops | 40.00% | 25–50% | 5 | ||
| Antiques | 36.67% | ||||
| Signboards | 36.67% | ||||
| Red | 33.33% | ||||
| Parking lot | 33.33% | ||||
| 【2M】 | Street vending | 80.00% | 75–100% | 1 | 10 |
| Goods from vendors | 70.00% | 50–75% | 3 | ||
| Cars | 66.67% | ||||
| Pedestrians | 60.00% | ||||
| Buildings | 43.33% | 25–50% | 6 | ||
| Antique shops | 40.00% | ||||
| Red | 33.33% | ||||
| Glass | 26.67% | ||||
| Signboards | 26.67% | ||||
| Stalls from shop | 26.67% |
Table A3.
Statistics of non-specific elements in street 【3】. Source: authors’ own.
Table A3.
Statistics of non-specific elements in street 【3】. Source: authors’ own.
| Street Number | Element Name | Pointing Out Rate | Pointing Out Rate Range | Number of Elements | Total Elements |
|---|---|---|---|---|---|
| 【3N】 | Shops | 83.33% | 75–100% | 1 | 7 |
| Signboards | 60.00% | 50–75% | 3 | ||
| Stalls from shop | 53.33% | ||||
| Buildings | 50.00% | ||||
| Cars | 46.67% | 25–50% | 3 | ||
| Pedestrians | 33.30% | ||||
| Wires | 30.00% | ||||
| 【3M】 | Street vending | 73.33% | 50–75% | 4 | 8 |
| Goods | 70.00% | ||||
| Pedestrians | 63.33% | ||||
| Cars | 60.00% | ||||
| Shops | 43.33% | 25–50% | 4 | ||
| Signboards | 40.00% | ||||
| Buildings | 33.33% | ||||
| Wires | 26.67% |
Table A4.
Statistics of non-specific elements in street 【4】. Source: authors’ own.
Table A4.
Statistics of non-specific elements in street 【4】. Source: authors’ own.
| Street Number | Element Name | Pointing Out Rate | Pointing Out Rate Range | Number of Elements | Total Elements |
|---|---|---|---|---|---|
| 【4N】 | Wall | 93.33% | 75–100% | 3 | 7 |
| Trees | 80.00% | ||||
| Street vending | 76.67% | ||||
| Cars | 66.67% | 50–75% | 2 | ||
| White | 50.00% | ||||
| Pedestrians | 43.33% | 25–50% | 2 | ||
| Iron fence | 33.33% | ||||
| 【4M】 | Street vending | 86.67% | 75–100% | 4 | 12 |
| Wall | 86.67% | ||||
| Trees | 80.00% | ||||
| Cars | 76.67% | ||||
| Pedestrians | 56.67% | 50–75% | 2 | ||
| White | 53.33% | ||||
| Stool | 36.67% | 25–50% | 4 | ||
| Road | 33.33% | ||||
| Iron fence | 30.00% | ||||
| Ancient building stone carving | 26.67% |
Table A5.
Statistics of non-specific elements in street 【5】. Source: authors’ own.
Table A5.
Statistics of non-specific elements in street 【5】. Source: authors’ own.
| Street Number | Element Name | Pointing Out Rate | Pointing Out Rate Range | Number of Elements | Total Elements |
|---|---|---|---|---|---|
| 【5N】 | Cars | 93.33% | 75–100% | 3 | 11 |
| Wall | 86.67% | ||||
| Trees | 83.33% | ||||
| Street lamps | 46.67% | 25–50% | 8 | ||
| White | 40.00% | ||||
| Sidewalk | 36.67% | ||||
| Garbage cans | 33.33% | ||||
| Sky | 33.33% | ||||
| Road signs | 30.00% | ||||
| Distant buildings | 30.00% | ||||
| Road | 30.00% | ||||
| 【5M】 | Street vending | 90.00% | 75–100% | 3 | 12 |
| Cars | 80.00% | ||||
| Trees | 76.67% | ||||
| Wall | 73.33% | 50–75% | 2 | ||
| Pedestrians | 73.33% | ||||
| Goods from vendors | 40.00% | 25–50% | 7 | ||
| Street lamps | 36.67% | ||||
| White | 36.67% | ||||
| Sidewalk | 33.33% | ||||
| Road | 26.67% | ||||
| Garbage cans | 26.67% | ||||
| Sky | 26.67% |
Table A6.
Statistics of non-specific elements in street 【6】. Source: authors’ own.
Table A6.
Statistics of non-specific elements in street 【6】. Source: authors’ own.
| Street Number | Element Name | Pointing Out Rate | Pointing Out Rate Range | Number of Elements | Total Elements |
|---|---|---|---|---|---|
| 【6N】 | Trees | 86.67% | 75–100% | 2 | 8 |
| Cars | 80.00% | ||||
| Shops | 66.67% | 50–75% | 3 | ||
| Pedestrians | 66.67% | ||||
| Buildings | 63.33% | ||||
| Signboards | 40.00% | 25–50% | 3 | ||
| Telegraph poles | 33.33% | ||||
| Sidewalk | 26.67% | ||||
| 【6M】 | Cars | 93.33% | 75–100% | 3 | 8 |
| Street vending | 86.67% | ||||
| Trees | 76.67% | ||||
| Shops | 66.67% | 50–75% | 2 | ||
| Buildings | 53.33% | ||||
| Goods from vendors | 43.33% | 25–50% | 3 | ||
| Signboards | 43.33% | ||||
| Pedestrians | 33.33% |
Table A7.
Statistics of non-specific elements in street 【7】. Source: authors’ own.
Table A7.
Statistics of non-specific elements in street 【7】. Source: authors’ own.
| Street Number | Element Name | Pointing Out Rate | Pointing Out Rate Range | Number of Elements | Total Elements |
|---|---|---|---|---|---|
| 【7N】 | Trees | 86.67% | 75–100% | 3 | 11 |
| Wall | 76.67% | ||||
| Cars | 76.67% | ||||
| Telegraph poles | 73.33% | 50–75% | 3 | ||
| Shops | 66.67% | ||||
| Buildings | 53.33% | ||||
| Signboards | 36.67% | 25–50% | 5 | ||
| Garbage cans | 33.33% | ||||
| Street lamps | 33.33% | ||||
| White | 26.67% | ||||
| Pedestrians | 26.67% | ||||
| 【7M】 | Street vending | 86.67% | 75–100% | 2 | 12 |
| Trees | 76.67% | ||||
| Cars | 73.33% | 50–75% | 4 | ||
| Pedestrians | 70.00% | ||||
| Wall | 60.00% | ||||
| Telegraph poles | 60.00% | ||||
| Shops | 46.67% | 25–50% | 6 | ||
| Goods from vendors | 46.67% | ||||
| Buildings | 43.33% | ||||
| Road | 30.00% | ||||
| Signboards | 30.00% | ||||
| Garbage cans | 26.67% |
Appendix B
This appendix shows the statistics of specific elements in each street on market days and non-market days.
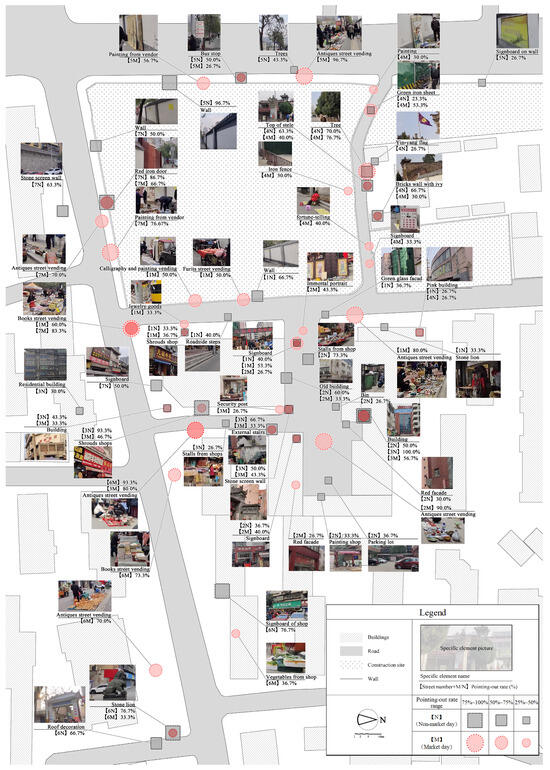
Figure A1.
Map of the distribution of specific elements. Source: authors’ own. Note 1: Japanese scholars often use the element recall method when exploring the relationship between physical space and mental perception. In this study, participants repeatedly recalled the names of all the elements related to the street by collecting images of the street. The recall process was not restricted or guided, so it was a free recall method [42].
References
- Zheng, B.; Masrabaye, F.; Guiradoumngué, G.M.; Zheng, J.; Liu, L. Progress in Research on Sustainable Urban Renewal Since 2000: Library and Visual Analyses. Sustainability 2021, 13, 4154. [Google Scholar] [CrossRef]
- Lin, J.; Ye, Z.; Yang, H. Thoughts on the Underused Urban Land Redevelopment in the Era of Inventory Planning. China Land Sci. 2019, 33, 1–8. (In Chinese) [Google Scholar] [CrossRef]
- Zhu, M.; Chen, J.; Guo, M.; Yue, W. Perception-Signal-Emotion: Experimental Research and Exploration of Human scale Spatial Perception Based on Physiological Signals. Urban Plan. Int. 2023, 38, 19–28. (In Chinese) [Google Scholar] [CrossRef]
- Biddulph, M. Sustainable Urban design: An environmental approach, 2nd Edition. URBAN DESIGN Int. 2010, 15, 68–70. [Google Scholar] [CrossRef]
- Long, Y.; Ye, Y. Human-Scale Urban Form: Measurements, Performances, and Urban Planning & Design Interventions. South Archit. 2016, 175, 41–47. (In Chinese) [Google Scholar] [CrossRef]
- Hawas, M.A.; Hawas, M.A. Heritage Planning: Adaptation of the “Old & New Approach” Towards Estblishing Conservation Areas in Metropolitan Cities. Procedia-Soc. Behav. Sci. 2016, 225, 348–363. [Google Scholar] [CrossRef]
- Yung, E.H.K.; Zhang, Q.; Chan, E.H.W. Underlying social factors for evaluating heritage conservation in urban renewal districts. Habitat Int. 2017, 66, 135–148. [Google Scholar] [CrossRef]
- Shan, J. Protection of Historical and Cultural Blocks; Tianjin University Press: Tianjin, China, 2015. (In Chinese) [Google Scholar]
- Xi’an Local Records Compilation Committee. Xi’an Chronicle; Xi’an Publishing House: Xi’an, China, 2000. (In Chinese)
- Yang, L.; Zhang, K. Study on the Evolution of Urban Form in Beijing Old City Based on Spatial Syntax. Urban. Archit. 2023, 20, 97–101. (In Chinese) [Google Scholar] [CrossRef]
- Huang, L.; Zheng, W.; Hong, J.; Liu, Y.; Liu, G. Paths and strategies for sustainable urban renewal at the neighbourhood level: A framework for decision-making. Sustain. Cities Soc. 2020, 55, 102074. [Google Scholar] [CrossRef]
- Xu, X.; Xue, D.; Huang, G. The Effects of Residents’ Sense of Place on Their Willingness to Support Urban Renewal: A Case Study of Century-Old East Street Renewal Project in Shaoguan, China. Sustainability 2022, 14, 1385. [Google Scholar] [CrossRef]
- Yoshimura, Y.; He, S.; Hack, G.; Nagakura, T.; Ratti, C. Quantifying Memories: Mapping Urban Perception. Mob. Netw. Appl. 2020, 25, 1275–1286. [Google Scholar] [CrossRef]
- Lynch, K. The Image of the City; MIT Press: Cambridge, UK, 1962. [Google Scholar]
- Gehl, J. Life Between Buildings: Using Public Space; Island Press: Renmark, Australia, 2011. [Google Scholar]
- Marshall, S. Streets and Patterns; Routledge: London, UK, 2004. [Google Scholar]
- Long, Y.; Zhou, Y. Quantitative evaluation on street vibrancy and its impact factors: A case study of Chengdu. New Archit. 2016, 1, 52–57. (In Chinese) [Google Scholar] [CrossRef]
- Xu, l.; Meng, R.; Huang, S.; Chen, Z. Healing Oriented Street Design: Experimental Explorations via Virtual Reality. Urban Plan. Int. 2019, 1, 38–45. (In Chinese) [Google Scholar] [CrossRef]
- He, H.; Fang, Y.; Zhang, T.; Zhang, Q.; Li, M.; Su, C. The Present and Future of Street Space Quality Research: Quantitative Analysis Based on the Visualization Literature at Home and Abroad in the Past Ten Years. Shanghai Urban Plan. Rev. 2022, 6, 73–81. (In Chinese) [Google Scholar] [CrossRef]
- Kiang, H.C. Visualizing Everyday Life in the City. J. Soc. Archit. Hist. 2014, 73, 91–117. [Google Scholar] [CrossRef]
- Li, X.; Yang, X. Planning Of “Ciyun Ancient Street”—A Practical Exploration Based OnTypo-Morphological Approach. Urban Dev. Stud. 2019, 26, 12–16+21. (In Chinese) [Google Scholar]
- Masullo, M.; Castanò, F.; Toma, R.A.; Maffei, L. Historical Cloisters and Courtyards as Quiet Areas. Sustainability 2020, 12, 2887. [Google Scholar] [CrossRef]
- Masullo, M.; Ozcevik Bilen, A.; Toma, R.A.; Akin Guler, G.; Maffei, L. The Restorativeness of Outdoor Historical Sites in Urban Areas: Physical and Perceptual Correlations. Sustainability 2021, 13, 5603. [Google Scholar] [CrossRef]
- Li, X.; Zhang, X.; Jia, T. Humanization of nature: Testing the influences of urban park characteristics and psychological factors on collegers’ perceived restoration. Urban For. Urban Green. 2023, 79, 127806. [Google Scholar] [CrossRef]
- Tafahomi, R. Application of physical and nonphysical elements in the conservation of historic core of city. S. Afr. J. Geomat. 2022, 10, 75–86. [Google Scholar] [CrossRef]
- Hu, Y. A Novel Planning of Vest-Pocket Park in Historic Urban Area in Metropolis: A Case Study of Beijing. In Green Intelligent Transportation Systems; Lecture Notes in Electrical Engineering; Springer: Singapore, 2018; pp. 1035–1053. [Google Scholar]
- Jiang, H.; Lu, S.; Xiao, Y. Method of Urban Color Evaluation for Historic and Cultural Areas in Shanghai Based on Street View Technology. Urban Plan. Forum 2022, 111–118. (In Chinese) [Google Scholar] [CrossRef]
- Tsumita, H.; Hamamoto, S. Analysis on Spacial Structure by Composition of Indication Elements in the City Spaces. J. Archit. Plan. (Trans. AIJ) 2008, 73, 109–116. (In Japanese) [Google Scholar] [CrossRef]
- Long, Y. Street Urbanism A New Perspective for Urban Studies and City Planning in the New Data Environment. Time Archit. 2016, 2, 128–132. (In Chinese) [Google Scholar] [CrossRef]
- Tsumita, H.; Miwata, M. A Study on Psychological Evaluation of Street Space and Composition of Indication Elements on Gulangyu Island and Xiamen Island in Xiamen City. J. Archit. Plan. (Trans. AIJ) 2021, 86, 771–781. (In Japanese) [Google Scholar] [CrossRef]
- Huang, G.; Xue, D.; Jin, L. Micro-location decision making of urban street vendors: Evidence from interviews with 200 vendors in guangzhou. Hum. Geogr. 2016, 1, 57–64. (In Chinese) [Google Scholar] [CrossRef]
- Sheng, Q.; Yang, Z. The Influence of Topological Spatial Form on Commercial Transaction Behaviour in Xinmin Market. World Archit. 2022, 06, 91–95. (In Chinese) [Google Scholar] [CrossRef]
- Deghati Najd, M.; Ismail, N.A.; Maulan, S.; Mohd Yunos, M.Y.; Dabbagh Niya, M. Visual preference dimensions of historic urban areas: The determinants for urban heritage conservation. Habitat Int. 2015, 49, 115–125. [Google Scholar] [CrossRef]
- Tang, J.; Long, Y. Measuring visual quality of street space and its temporal variation: Methodology and its application in the Hutong area in Beijing. Landsc. Urban Plan. 2019, 191, 103436. [Google Scholar] [CrossRef]
- Kiruthiga, K.; Thirumaran, K. Visual perception on the architectural elements of the built heritage of a historic temple town: A case study of Kumbakonam, India. Front. Archit. Res. 2017, 6, 96–107. [Google Scholar] [CrossRef]
- McMullen, M. Seeing history: A visual assessment of the historic-grounding of Old Western tourist towns. J. Herit. Tour. 2017, 13, 411–425. [Google Scholar] [CrossRef]
- Nagaoka, A.; Ogawa, R.; Tsuchiya, T. Affective Engineering for Streetscape Analysis: Evaluation of Traditional Japanese Mud Walls Using a Self-Organizing Map. In Proceedings of the 2013 IEEE International Conference on Systems, Man, and Cybernetics, Manchester, UK, 13–16 October 2013; pp. 1132–1137. [Google Scholar]
- Wang, F.; Hu, W.; Zhu, Y.; Jiang, C. The locality of Beijing historic areas from a dynamic perspective based on geo-tagged photos. Int. J. Tour. Cities 2019, 5, 75–89. [Google Scholar] [CrossRef]
- Kuo, C.-L.; Chan, T.-C.; Fan, I.C.; Zipf, A. Efficient Method for POI/ROI Discovery Using Flickr Geotagged Photos. ISPRS Int. J. Geo-Inf. 2018, 7, 121. [Google Scholar] [CrossRef]
- Gould, P.R.; White, R. Mental Maps; Penguin: London, UK, 1974. [Google Scholar]
- Canter, D. The Psychology of Place; St. Martin’s Press: New York, NY, USA, 1977. [Google Scholar]
- Architectural Institute of Japan. Survey and Analysis Methods for Architecture and Urban Planning; Inoueshoin: Tokyo, Japan, 2012. (In Japanese) [Google Scholar]
- Li, Z.; Sun, X.; Zhao, S.; Zuo, H. Integrating eye-movement analysis and the semantic differential method to analyze the visual effect of a traditional commercial block in Hefei, China. Front. Archit. Res. 2021, 10, 317–331. [Google Scholar] [CrossRef]
- Ming, D.U.; Zheng, C.; Yiyan, C. Designing Attention—Research on Landscape Experience Through Eye Tracking in Nanjing Road Pedestrian Mall (Street) in Shanghai. Landsc. Archit. Front. 2022, 10, 52. [Google Scholar] [CrossRef]
- Osgood, C.E. Commentary on “the Semantic Differential and Mediation Theory”. Linguistics 1971, 9, 88–96. [Google Scholar] [CrossRef]
- Xu, L.; Yong, C. Resident Satisfaction Research on the Conservation Renewal of Traditional Li-long Case Studies of Shanghai Chunyangli and Chengxingli. Archit. J. 2021, 137–143. Available online: http://lab408.org/upload/thesis/1658118225.pdf (accessed on 10 November 2023). (In Chinese).
- Wang, Z.; Zhuang, W. Research on Block Renewal Post Occupancy Evaluation Methods Based on Image Deep Learning: A Case Study of Shichahai in Beijing. New Archit. 2022, 5–8. (In Chinese) [Google Scholar] [CrossRef]
- Wan, J.; Zhou, Y.; Li, Y.; Su, Y.; Cao, Y.; Zhang, L.; Ying, L.; Deng, W. Research on Color Space Perceptions and Restorative Effects of Blue Space Based on Color Psychology: Examination of the Yijie District of Dujiangyan City as an Example. Int. J. Environ. Res. Public Health 2020, 17, 3137. [Google Scholar] [CrossRef]
- Wang, X.; Nishina, D.; Jiang, R.; Liu, N.; Kindaichi, S.; Mizuta, S. The Influence of Townscape-Improvement on the Psychological Evaluation in Saijo Sakagura Area. J. Environ. Eng. (Trans. AIJ) 2021, 86, 215–225. (In Japanese) [Google Scholar] [CrossRef]
- Duan, J.; Lan, W.; Jiang, Y. An evaluation approach to spatial identity in historic urban areas from a humanistic perspective. Front. Archit. Res. 2022, 11, 806–814. [Google Scholar] [CrossRef]
- Jayantha, W.; Yung, E. Effect of Revitalisation of Historic Buildings on Retail Shop Values in Urban Renewal: An Empirical Analysis. Sustainability 2018, 10, 1418. [Google Scholar] [CrossRef]
- Khalaf, R.W. The search for the meaning of ‘compatibility’ between new construction and heritage in historic areas: An exploratory study. Hist. Environ. Policy Pract. 2016, 7, 60–80. [Google Scholar] [CrossRef]
- Liu, Z.; Wang, S.; Wang, F. Isolated or integrated? Planning and management of urban renewal for historic areas in Old Beijing city, based on the association network system. Habitat Int. 2019, 93, 102049. [Google Scholar] [CrossRef]
- Bornioli, A.; Parkhurst, G.; Morgan, P.L. Psychological Wellbeing Benefits of Simulated Exposure to Five Urban Settings: An Experimental Study From the Pedestrian’s Perspective. J. Transp. Health 2018, 9, 105–116. [Google Scholar] [CrossRef]
- Gil, E.; Ahn, Y.; Kwon, Y. Tourist Attraction and Points of Interest (POIs) Using Search Engine Data: Case of Seoul. Sustainability 2020, 12, 7060. [Google Scholar] [CrossRef]
- Deng, Z.; Chen, D.; Qin, X.; Wang, S. Comprehensive assessment to residents’ perceptions to historic urban center in megacity: A case study of Yuexiu District, Guangzhou, China. J. Asian Archit. Build. Eng. 2021, 20, 566–580. [Google Scholar] [CrossRef]
- Hong, Y.; Chen, F. Evaluating the adaptive reuse potential of buildings in conservation areas. Facilities 2017, 35, 202–219. [Google Scholar] [CrossRef]
- Hegazi, Y.S.; Fouda, M. Re-imaging Rosetta historic core through Space Syntax. Archnet-IJAR Int. J. Archit. Res. 2019, 13, 645–669. [Google Scholar] [CrossRef]
- López Sánchez, M.; Linares Gómez Del Pulgar, M.; Tejedor Cabrera, A. Historic construction of diffuse cultural landscapes: Towards a GIS-based method for mapping the interlinkages of heritage. Landsc. Res. 2021, 46, 916–931. [Google Scholar] [CrossRef]
- Li, Y.; Huang, J.; Liang, J.; Zhang, Y.; Chen, Y. Research on Visual Attraction and Influencing Factors of Perception of Commercial Street Space in Cultural Heritage Site: Taking Gulangyu Longtou Road as an Example. J. Hum. Settl. West China 2022, 37, 114–121. (In Chinese) [Google Scholar] [CrossRef]
- Liu, Y.; Liu, Y. Detecting the city-scale spatial pattern of the urban informal sector by using the street view images: A street vendor massive investigation case. Cities 2022, 131, 103959. [Google Scholar] [CrossRef]
- Tan, J.; Chang, J.; Xie, D. Micro Renovation Of Yongqing Block, Enning Road, Guangzhou. Planners 2018, 34, 62–67. (In Chinese) [Google Scholar]
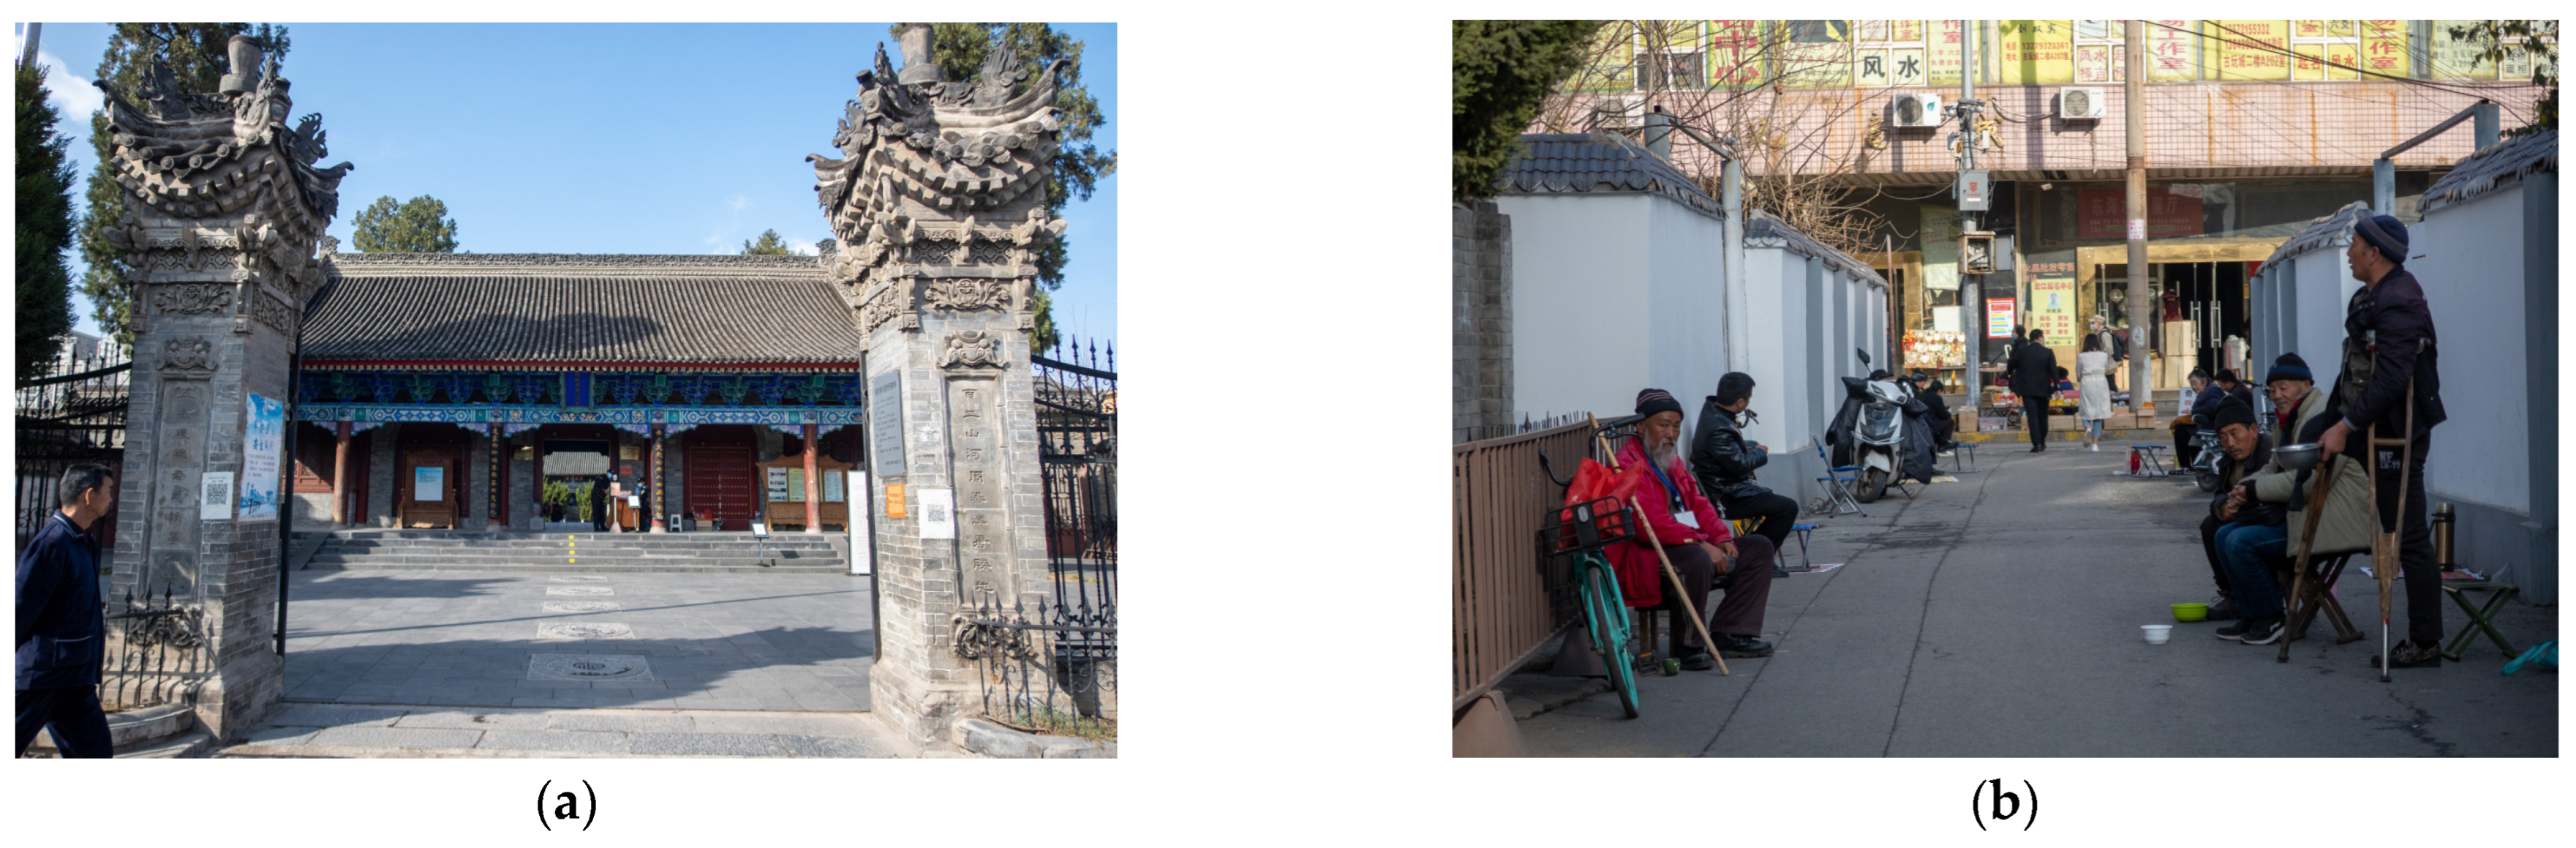
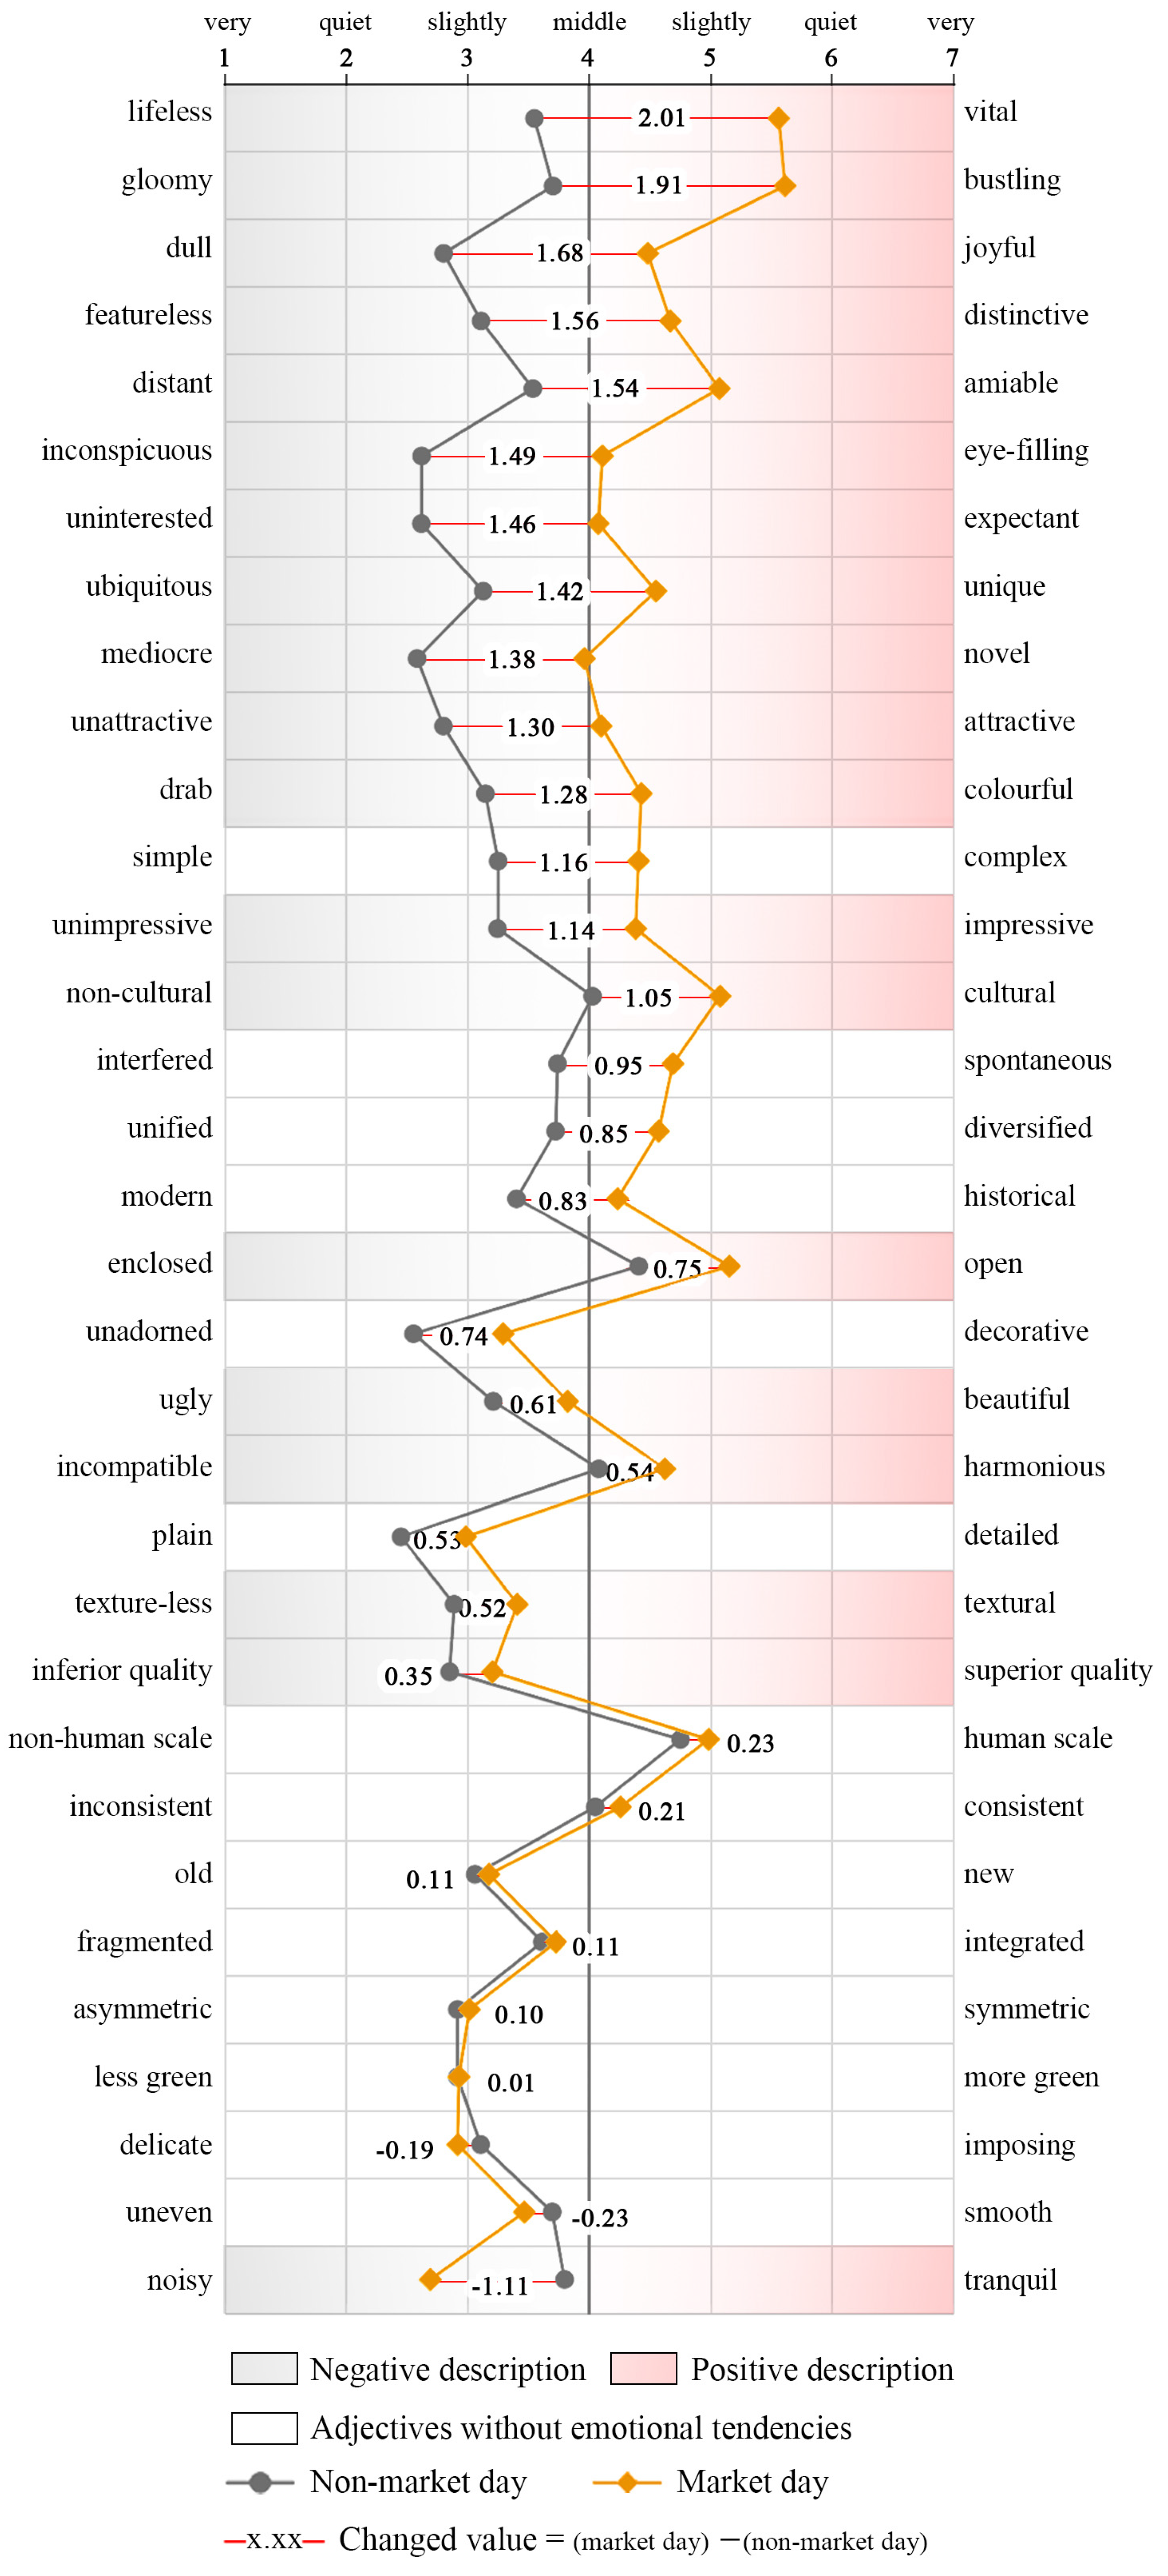

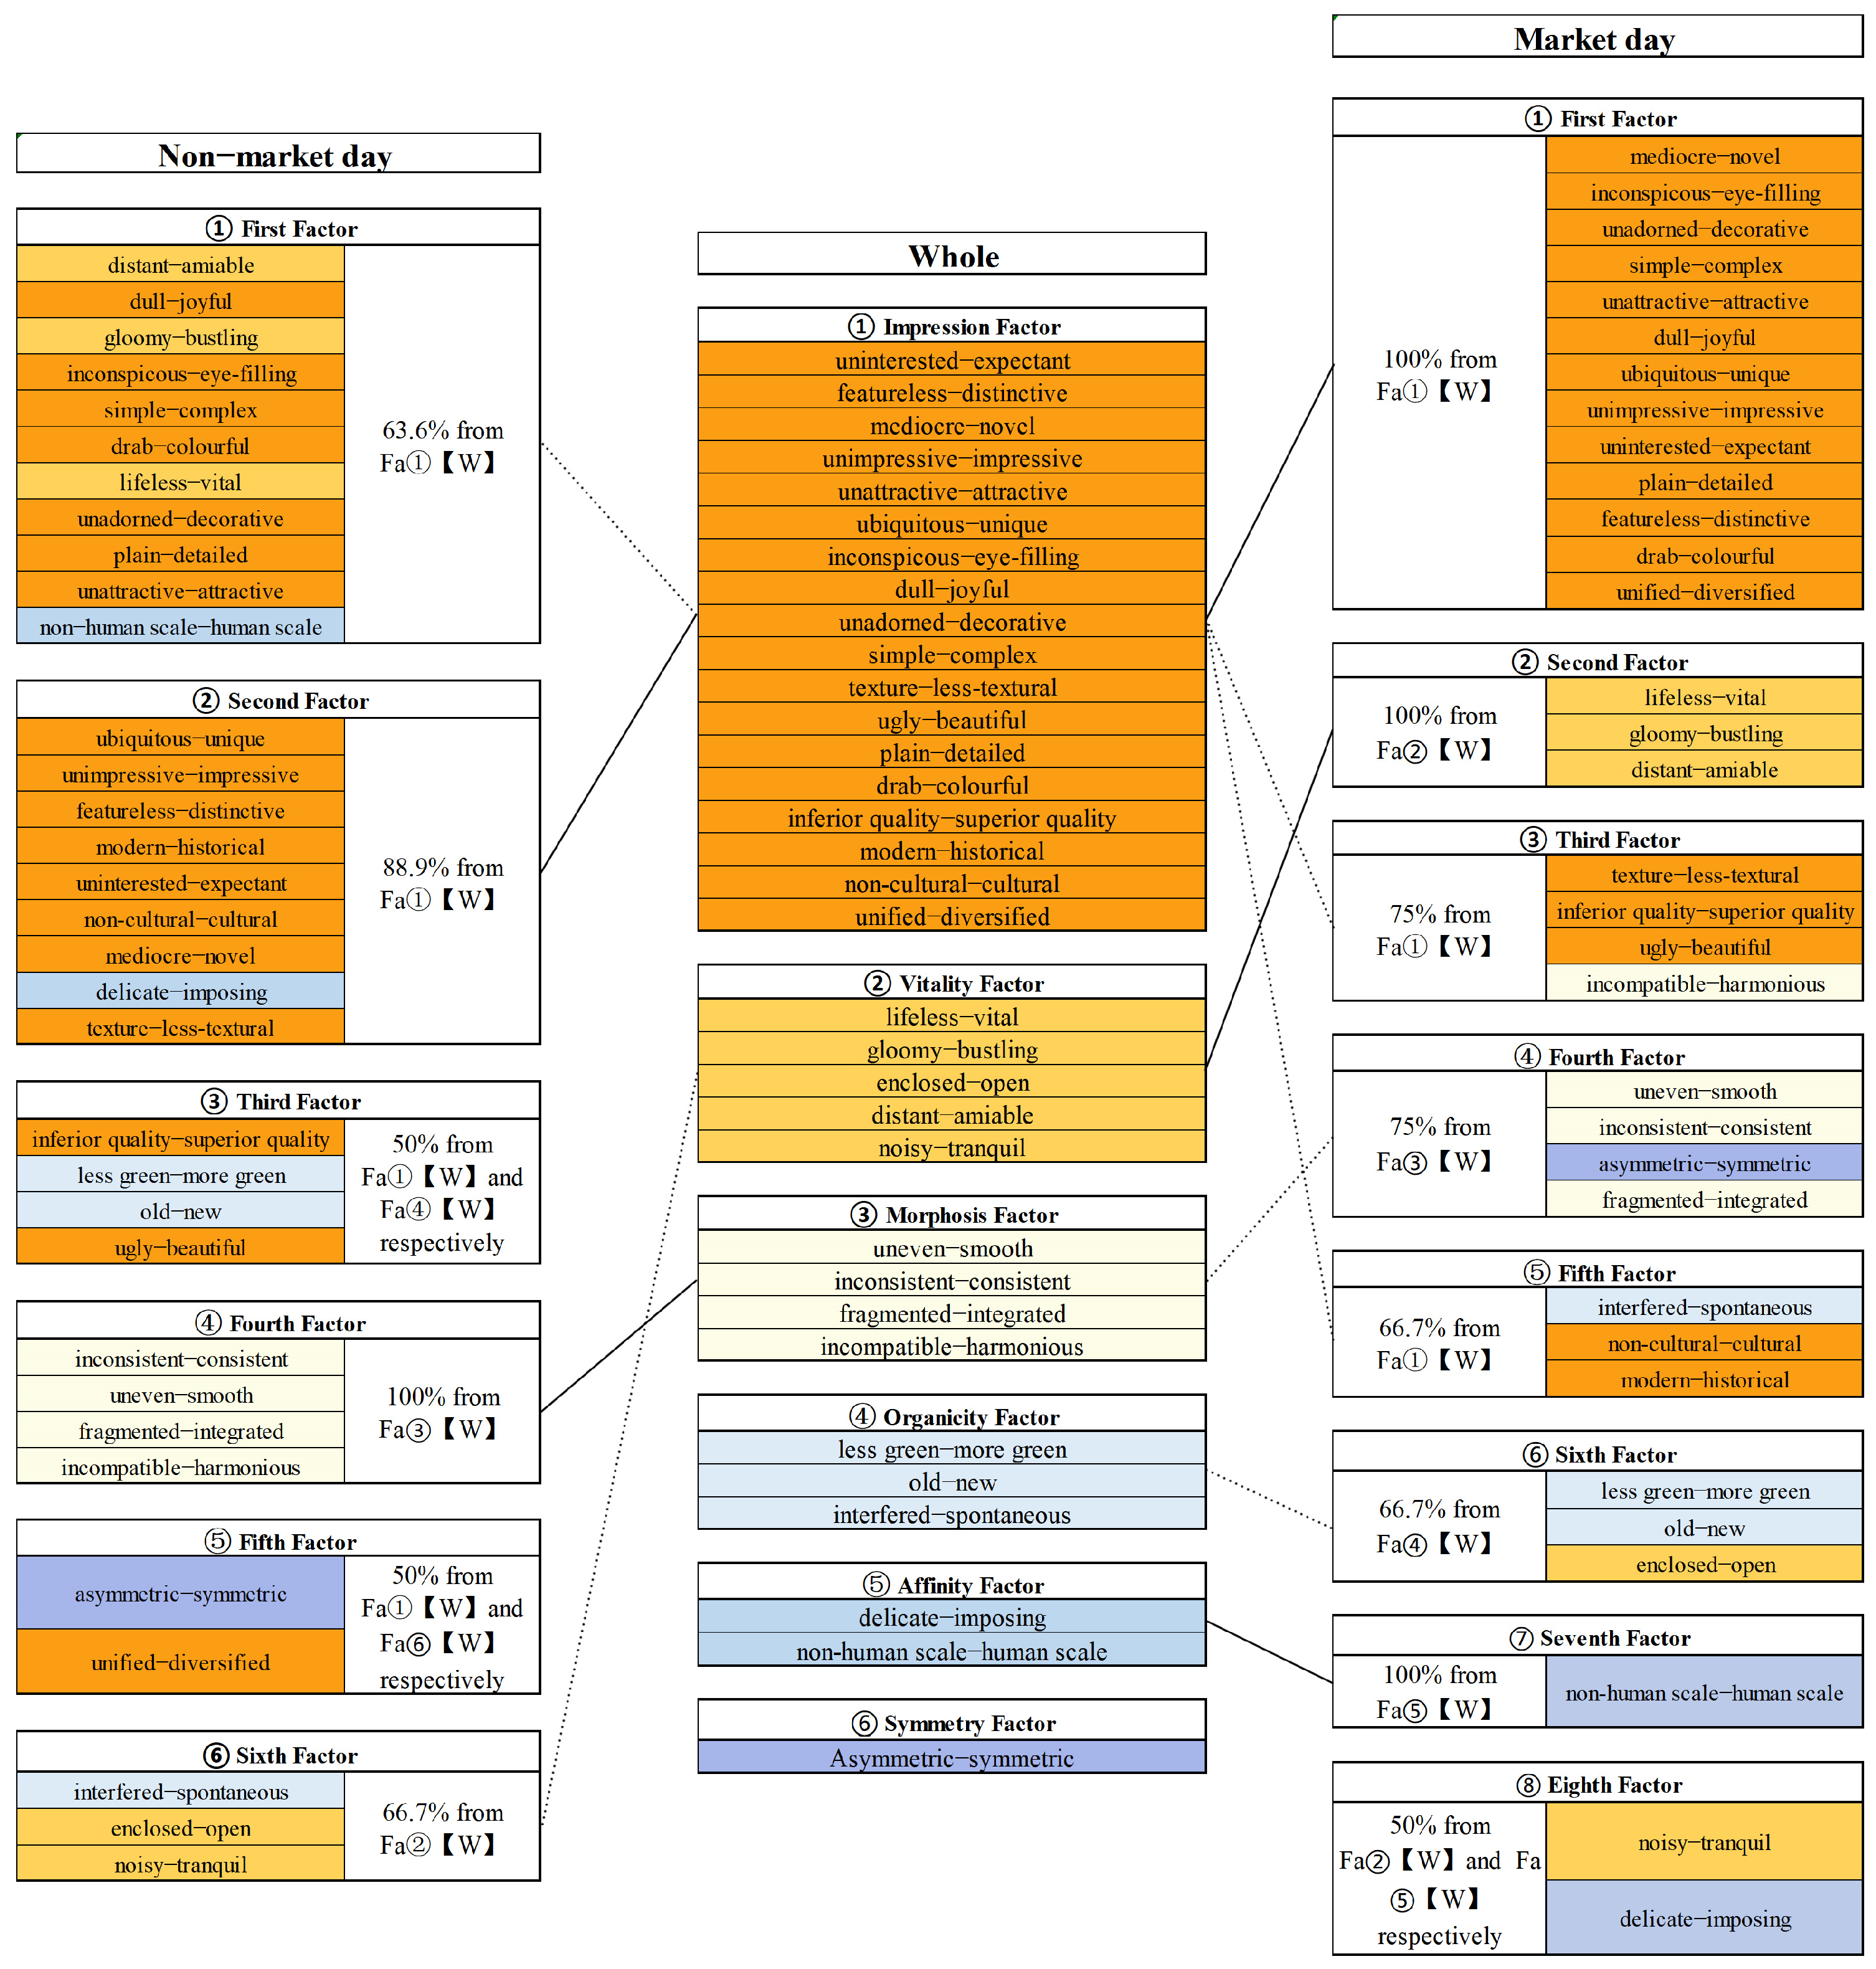
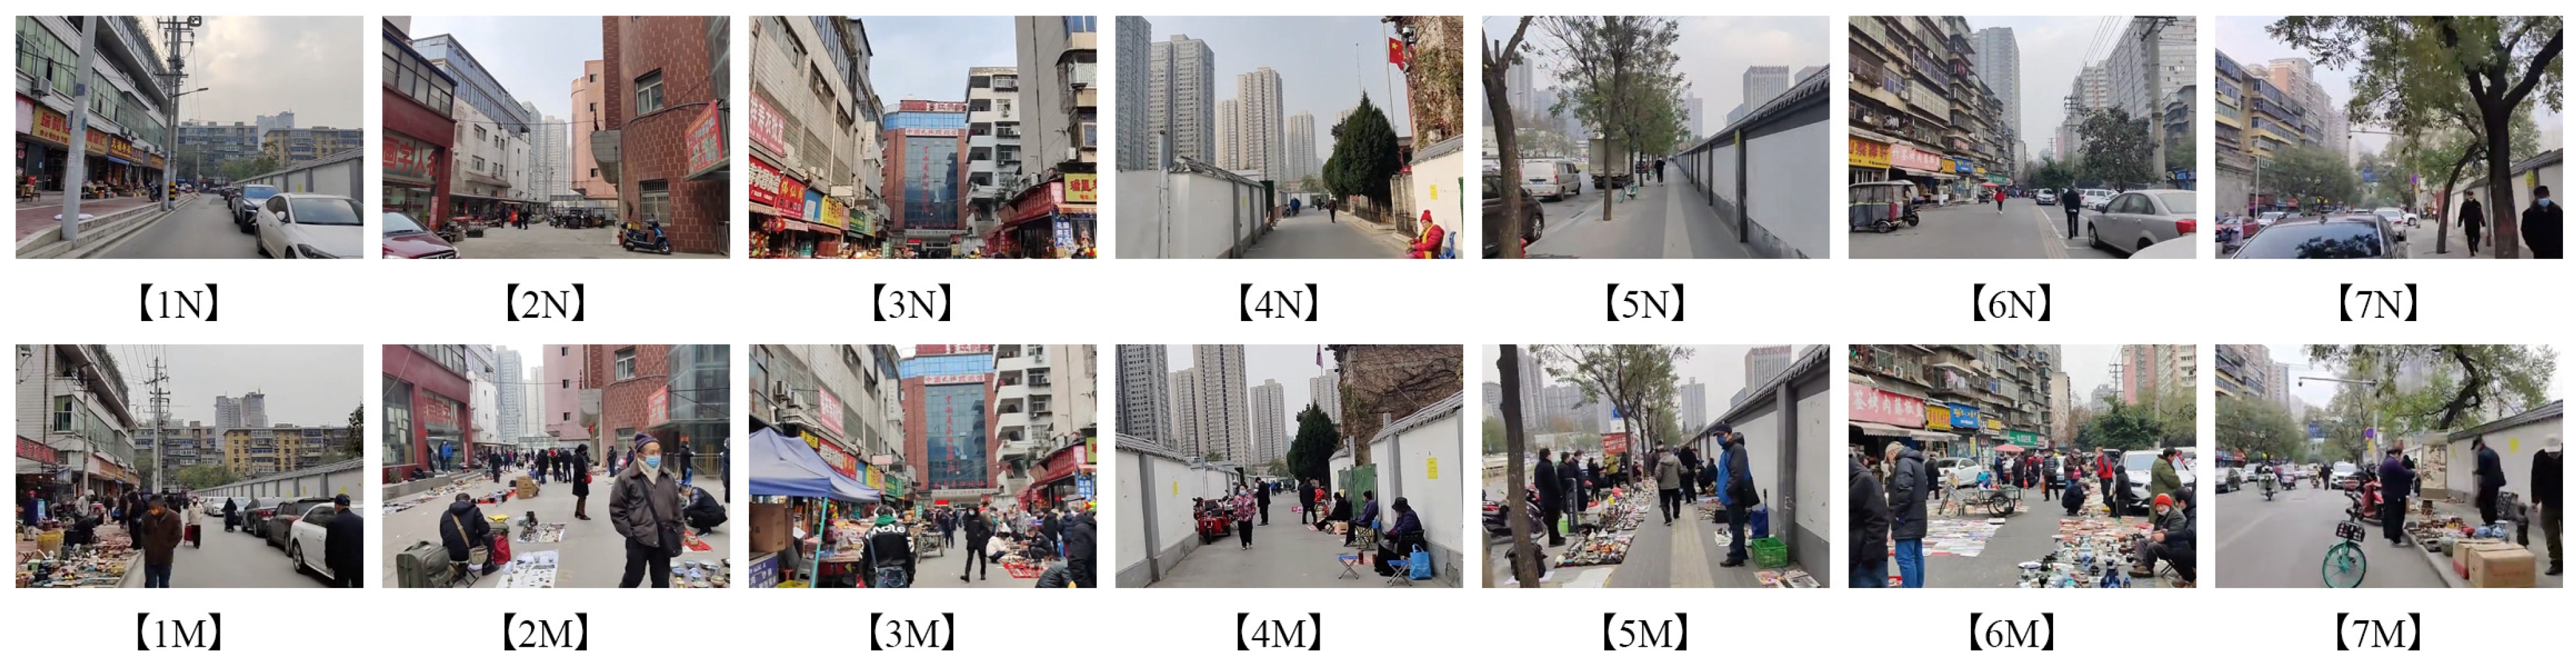
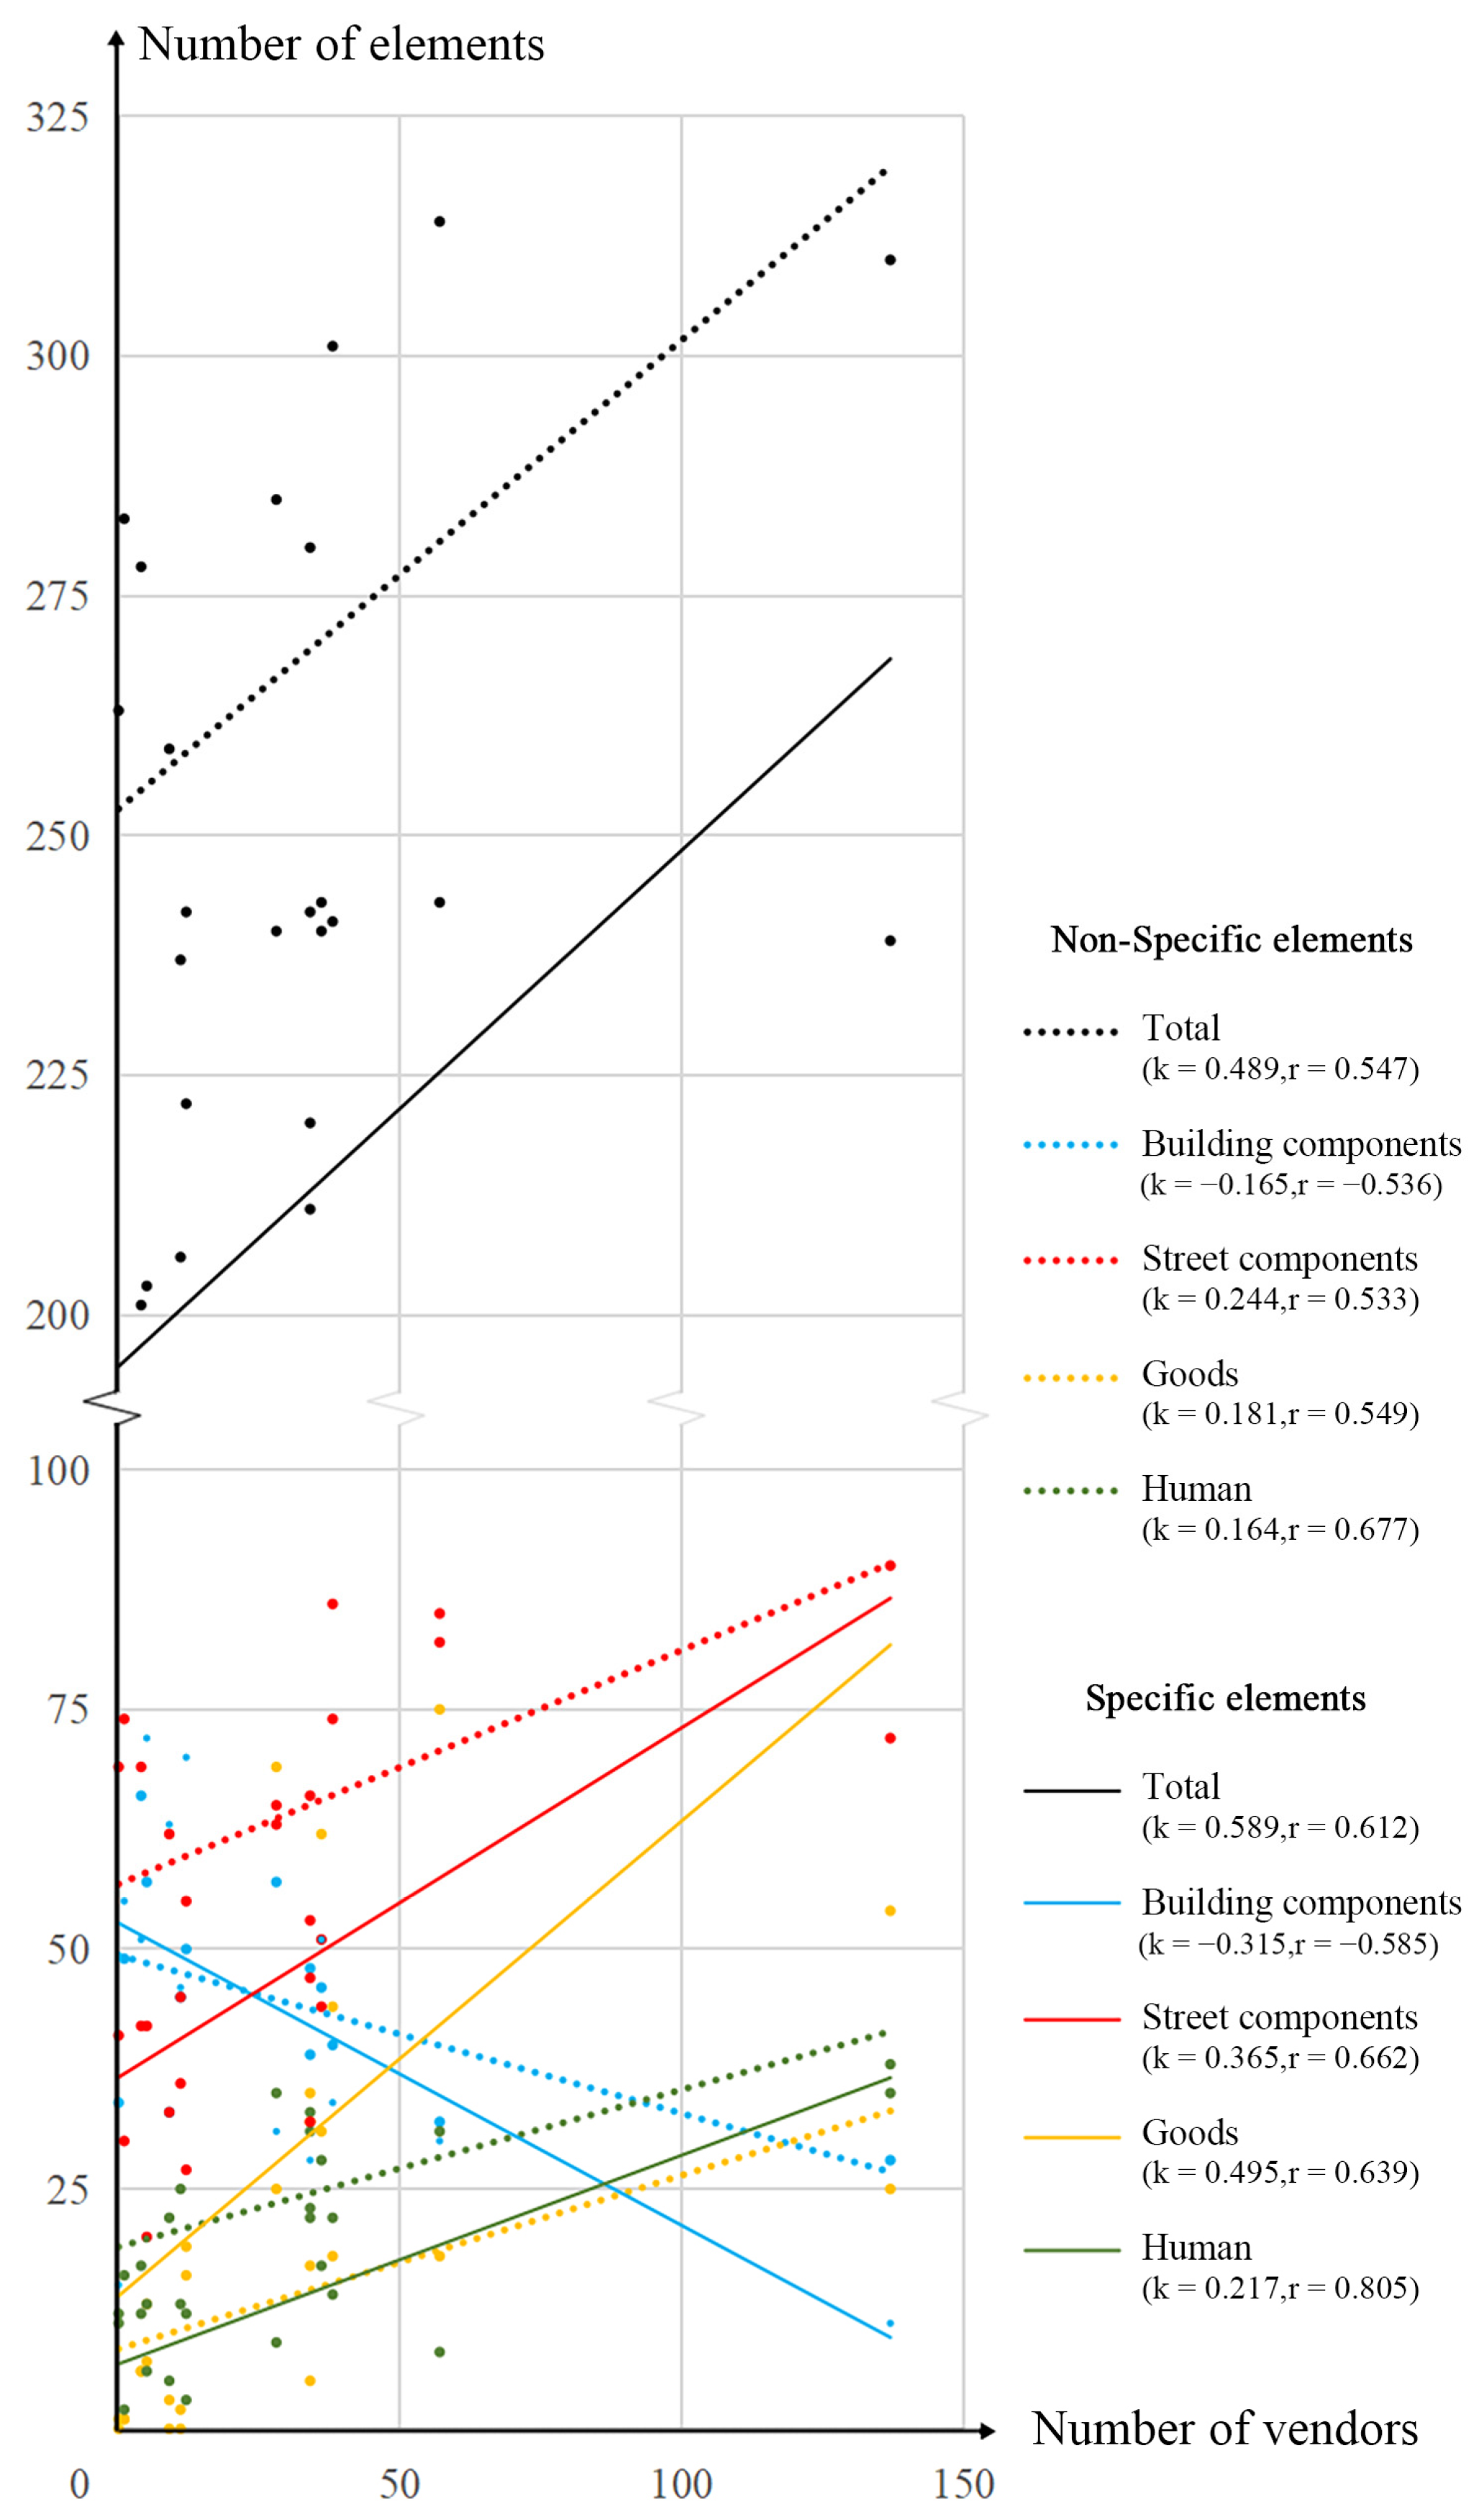
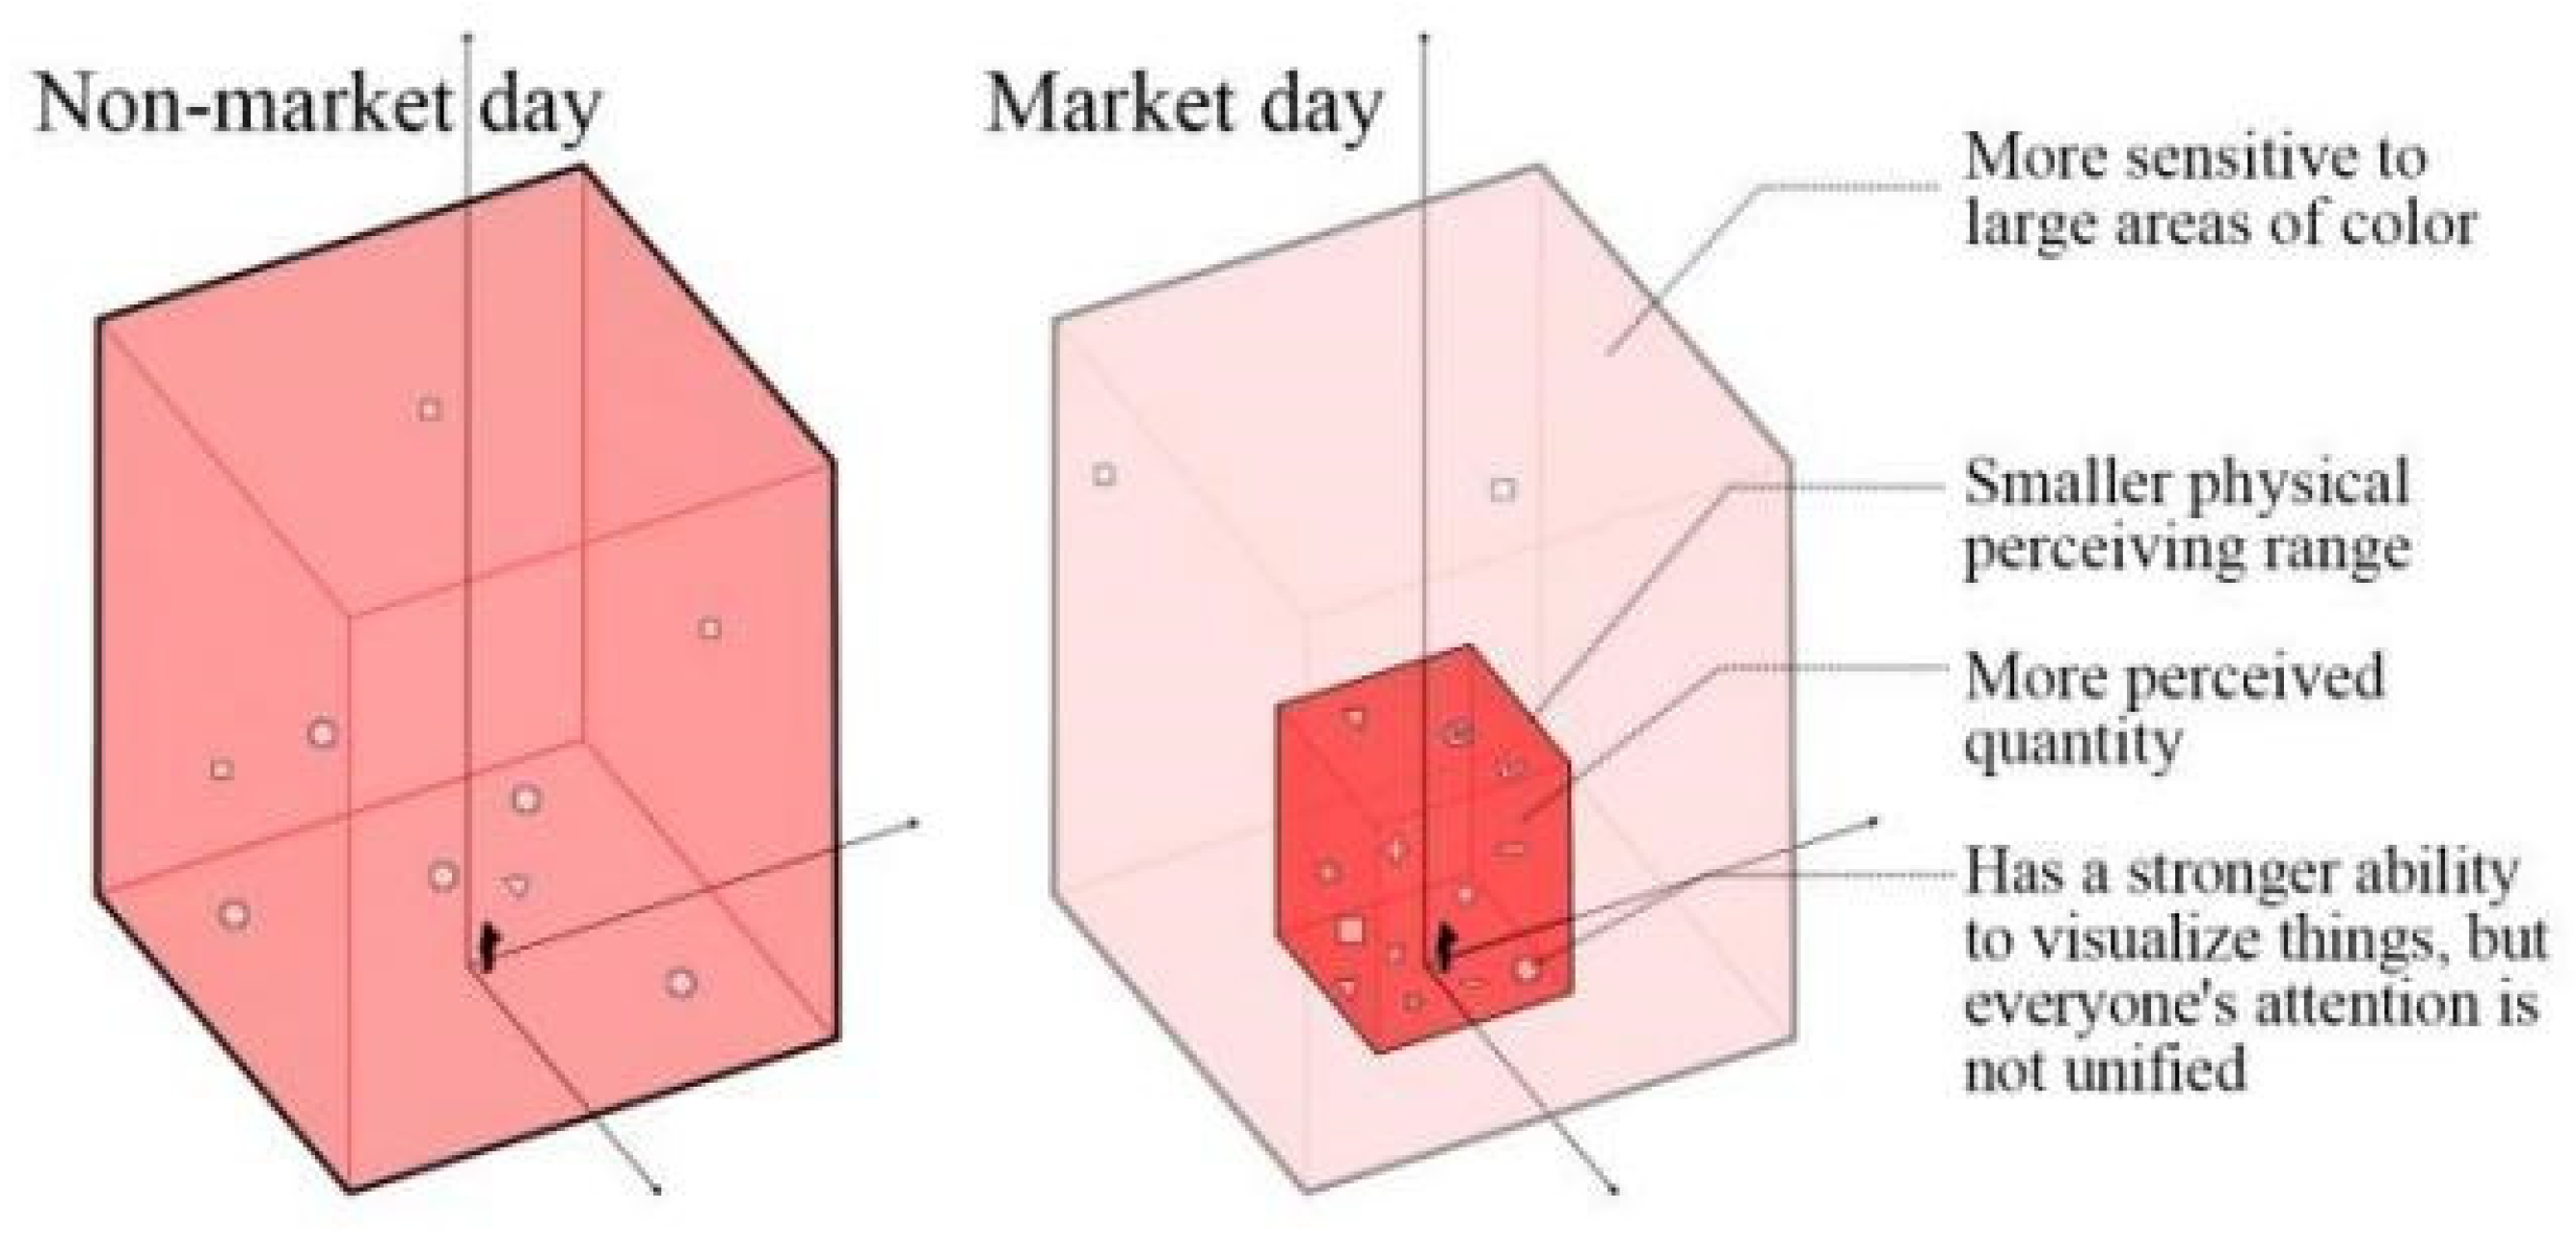
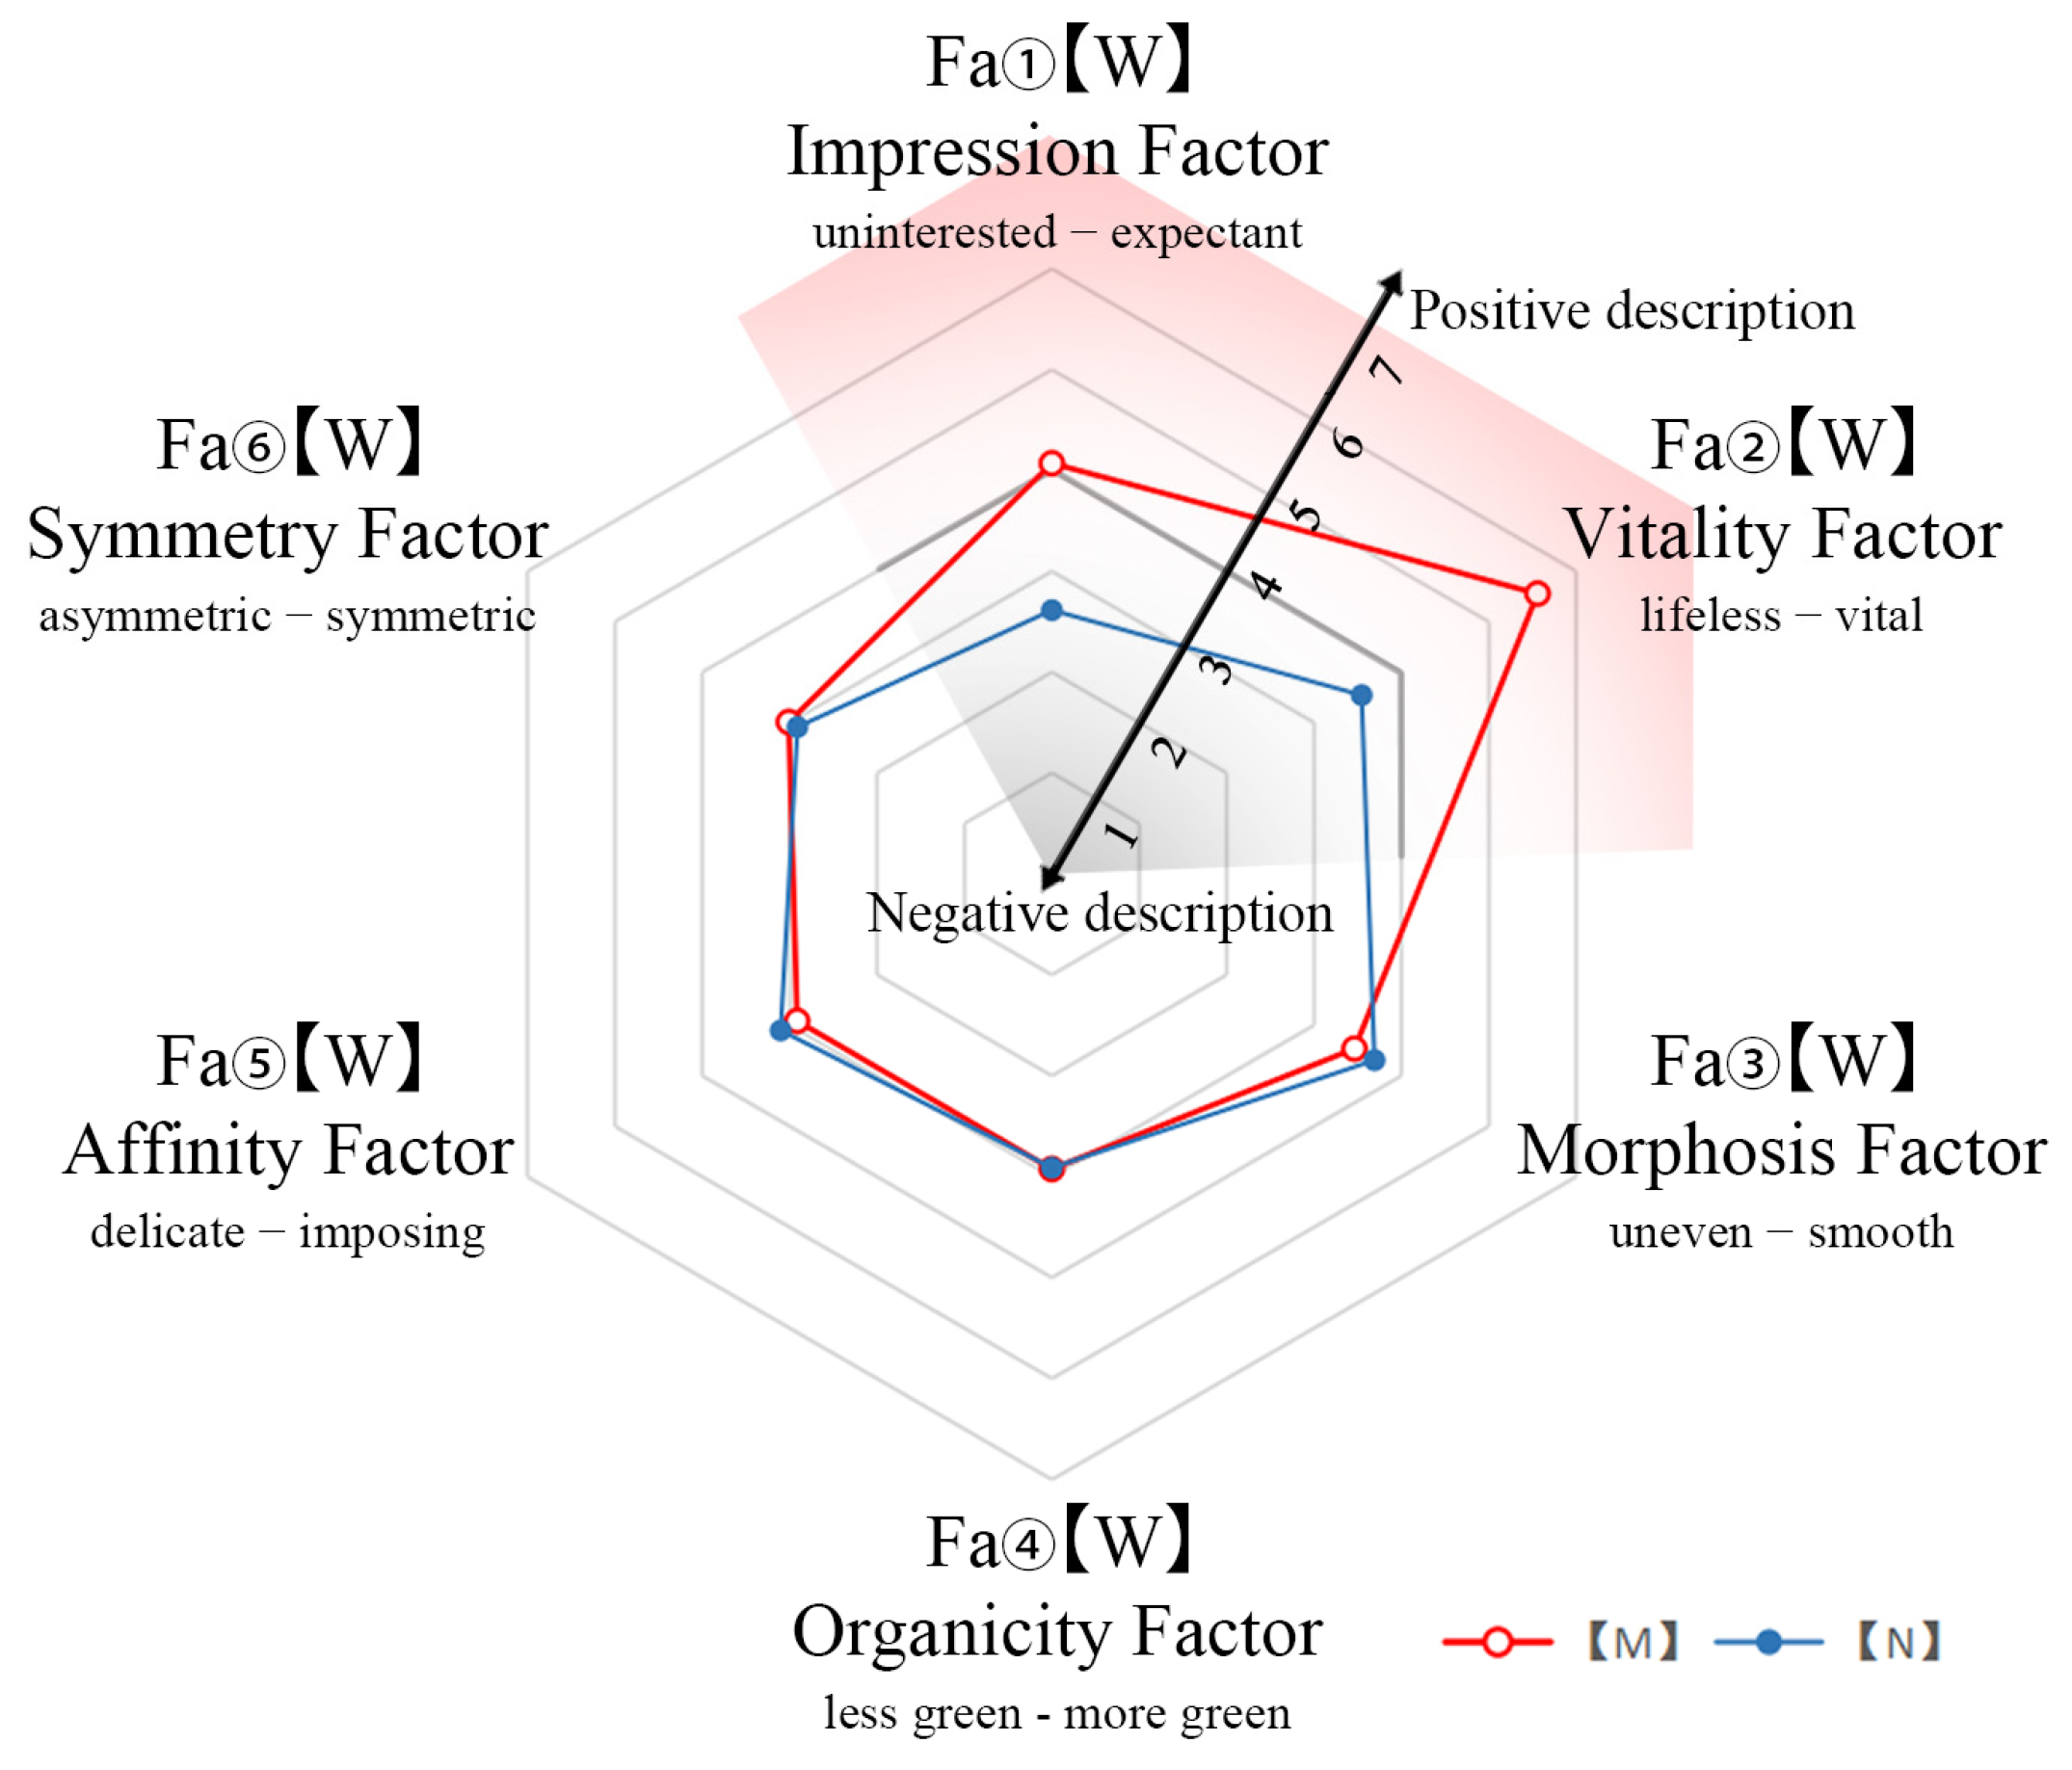
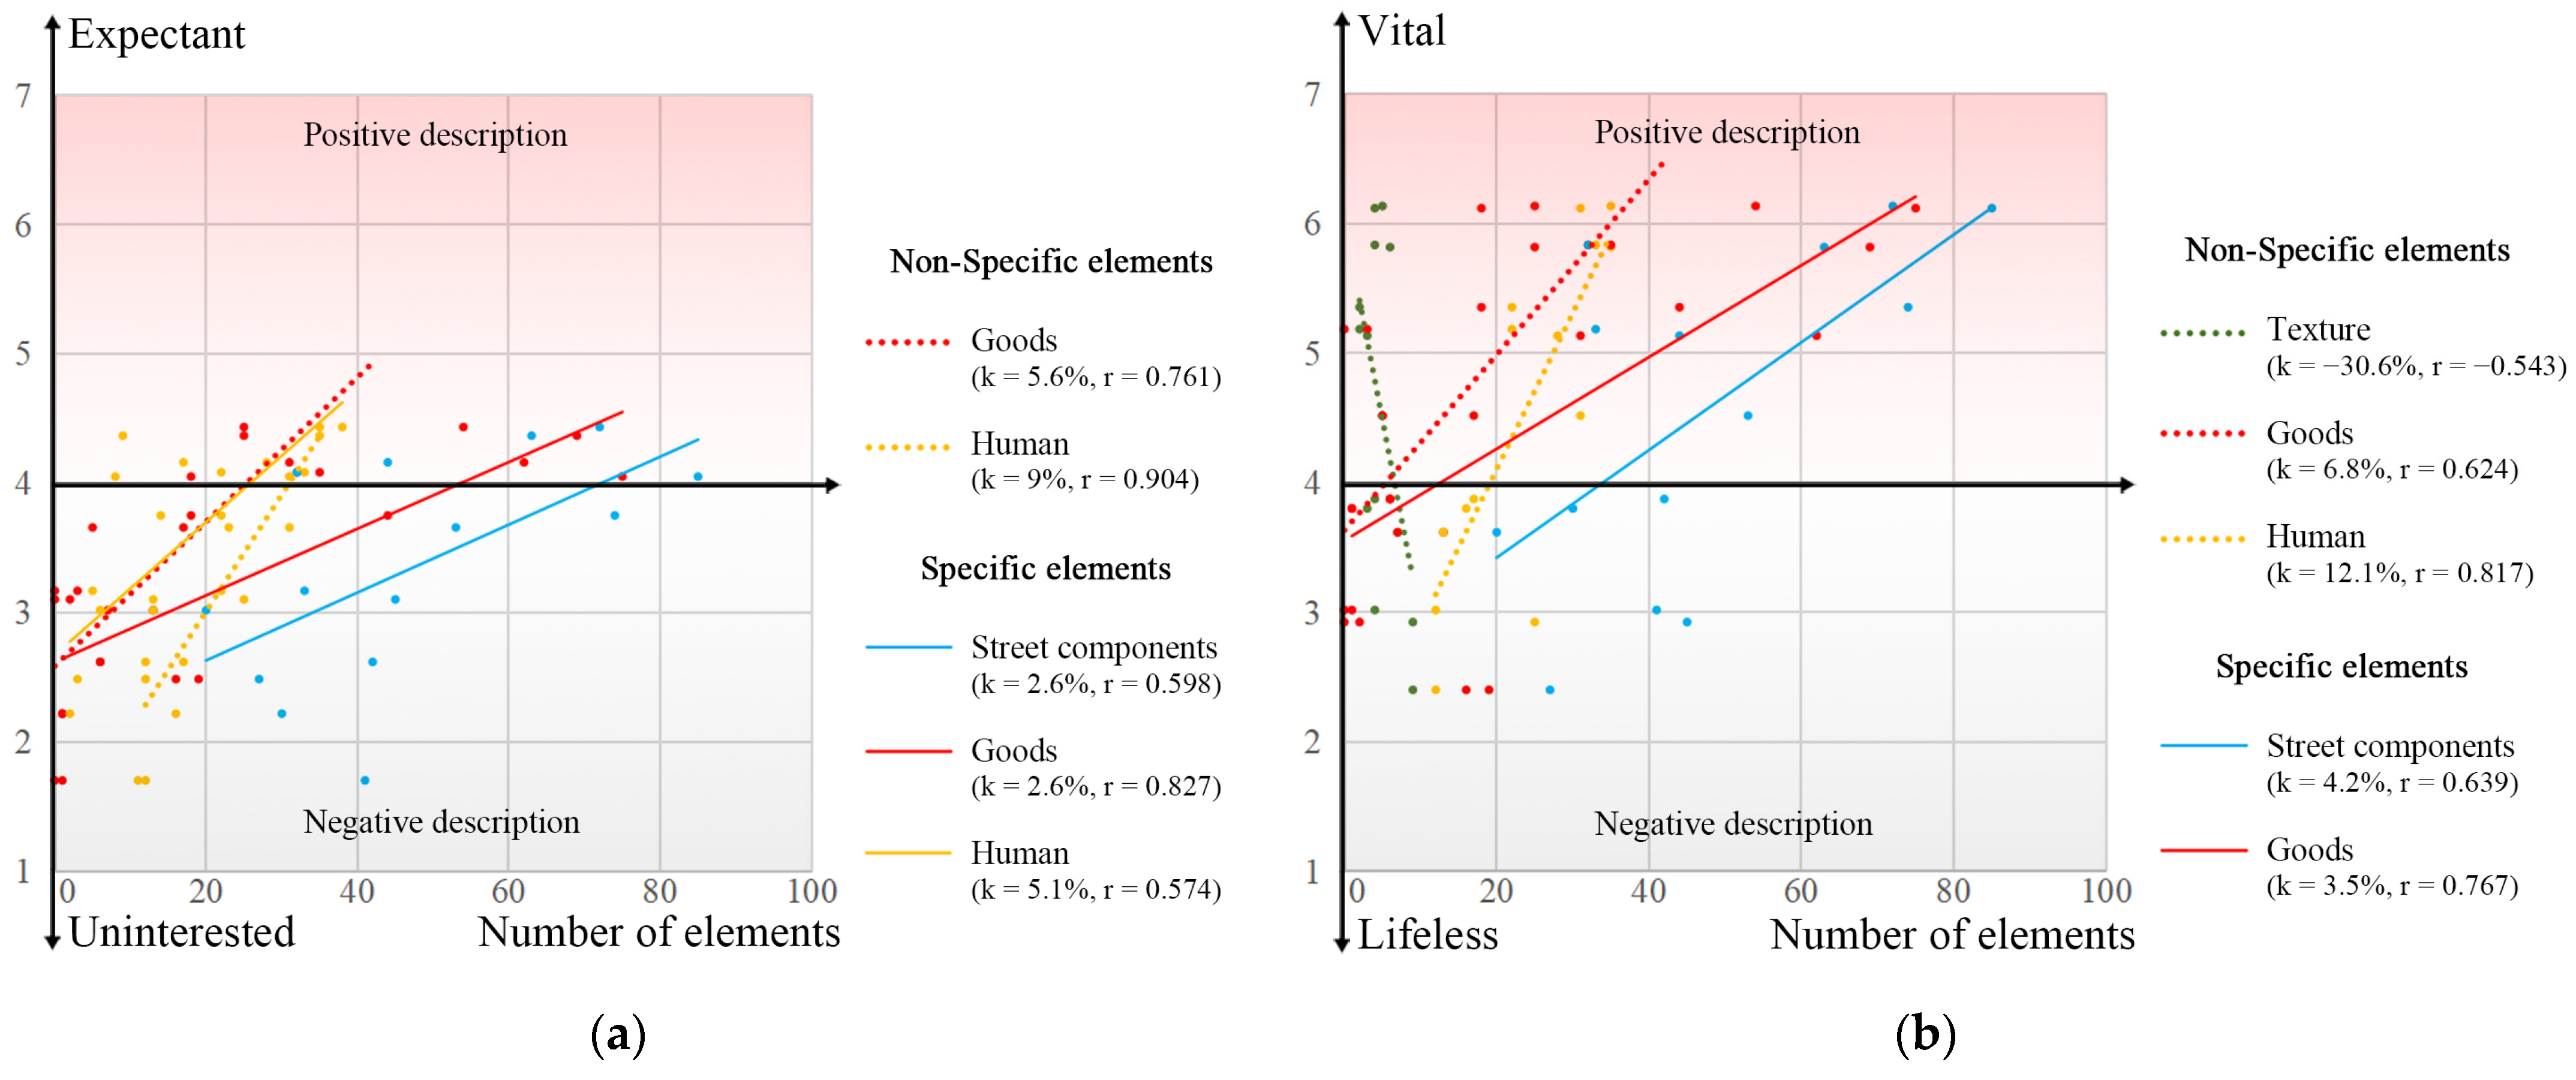
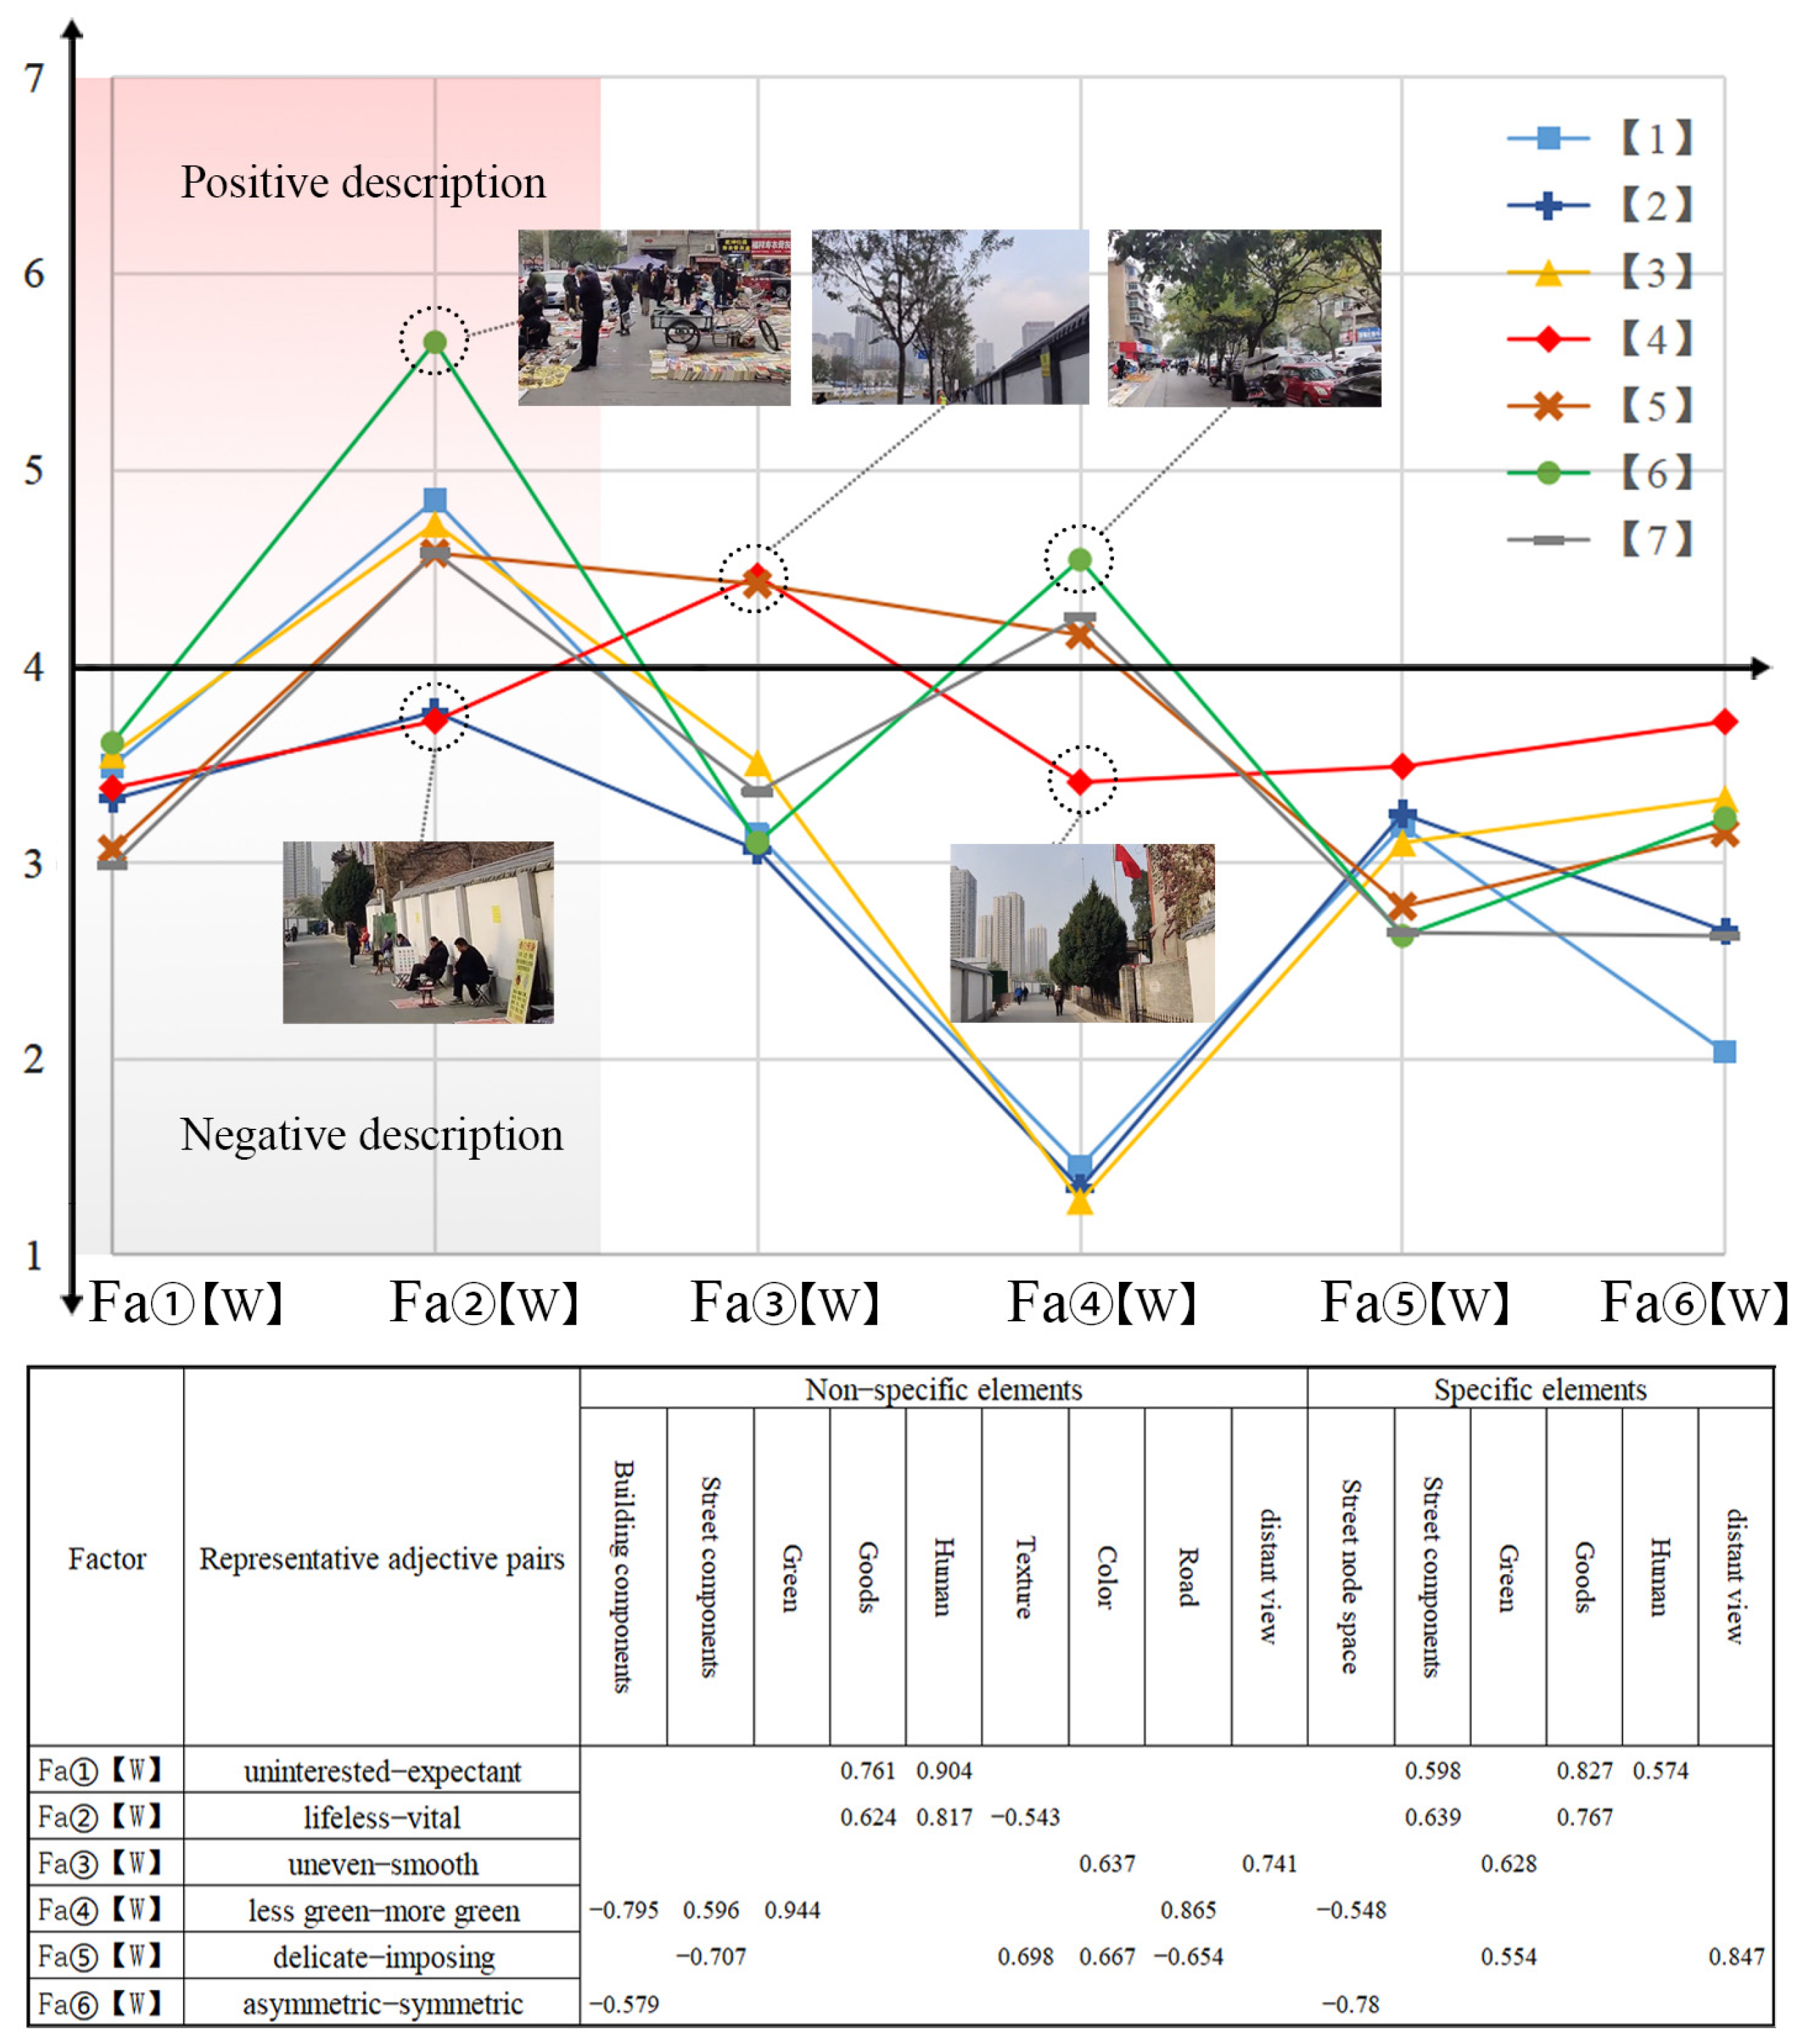
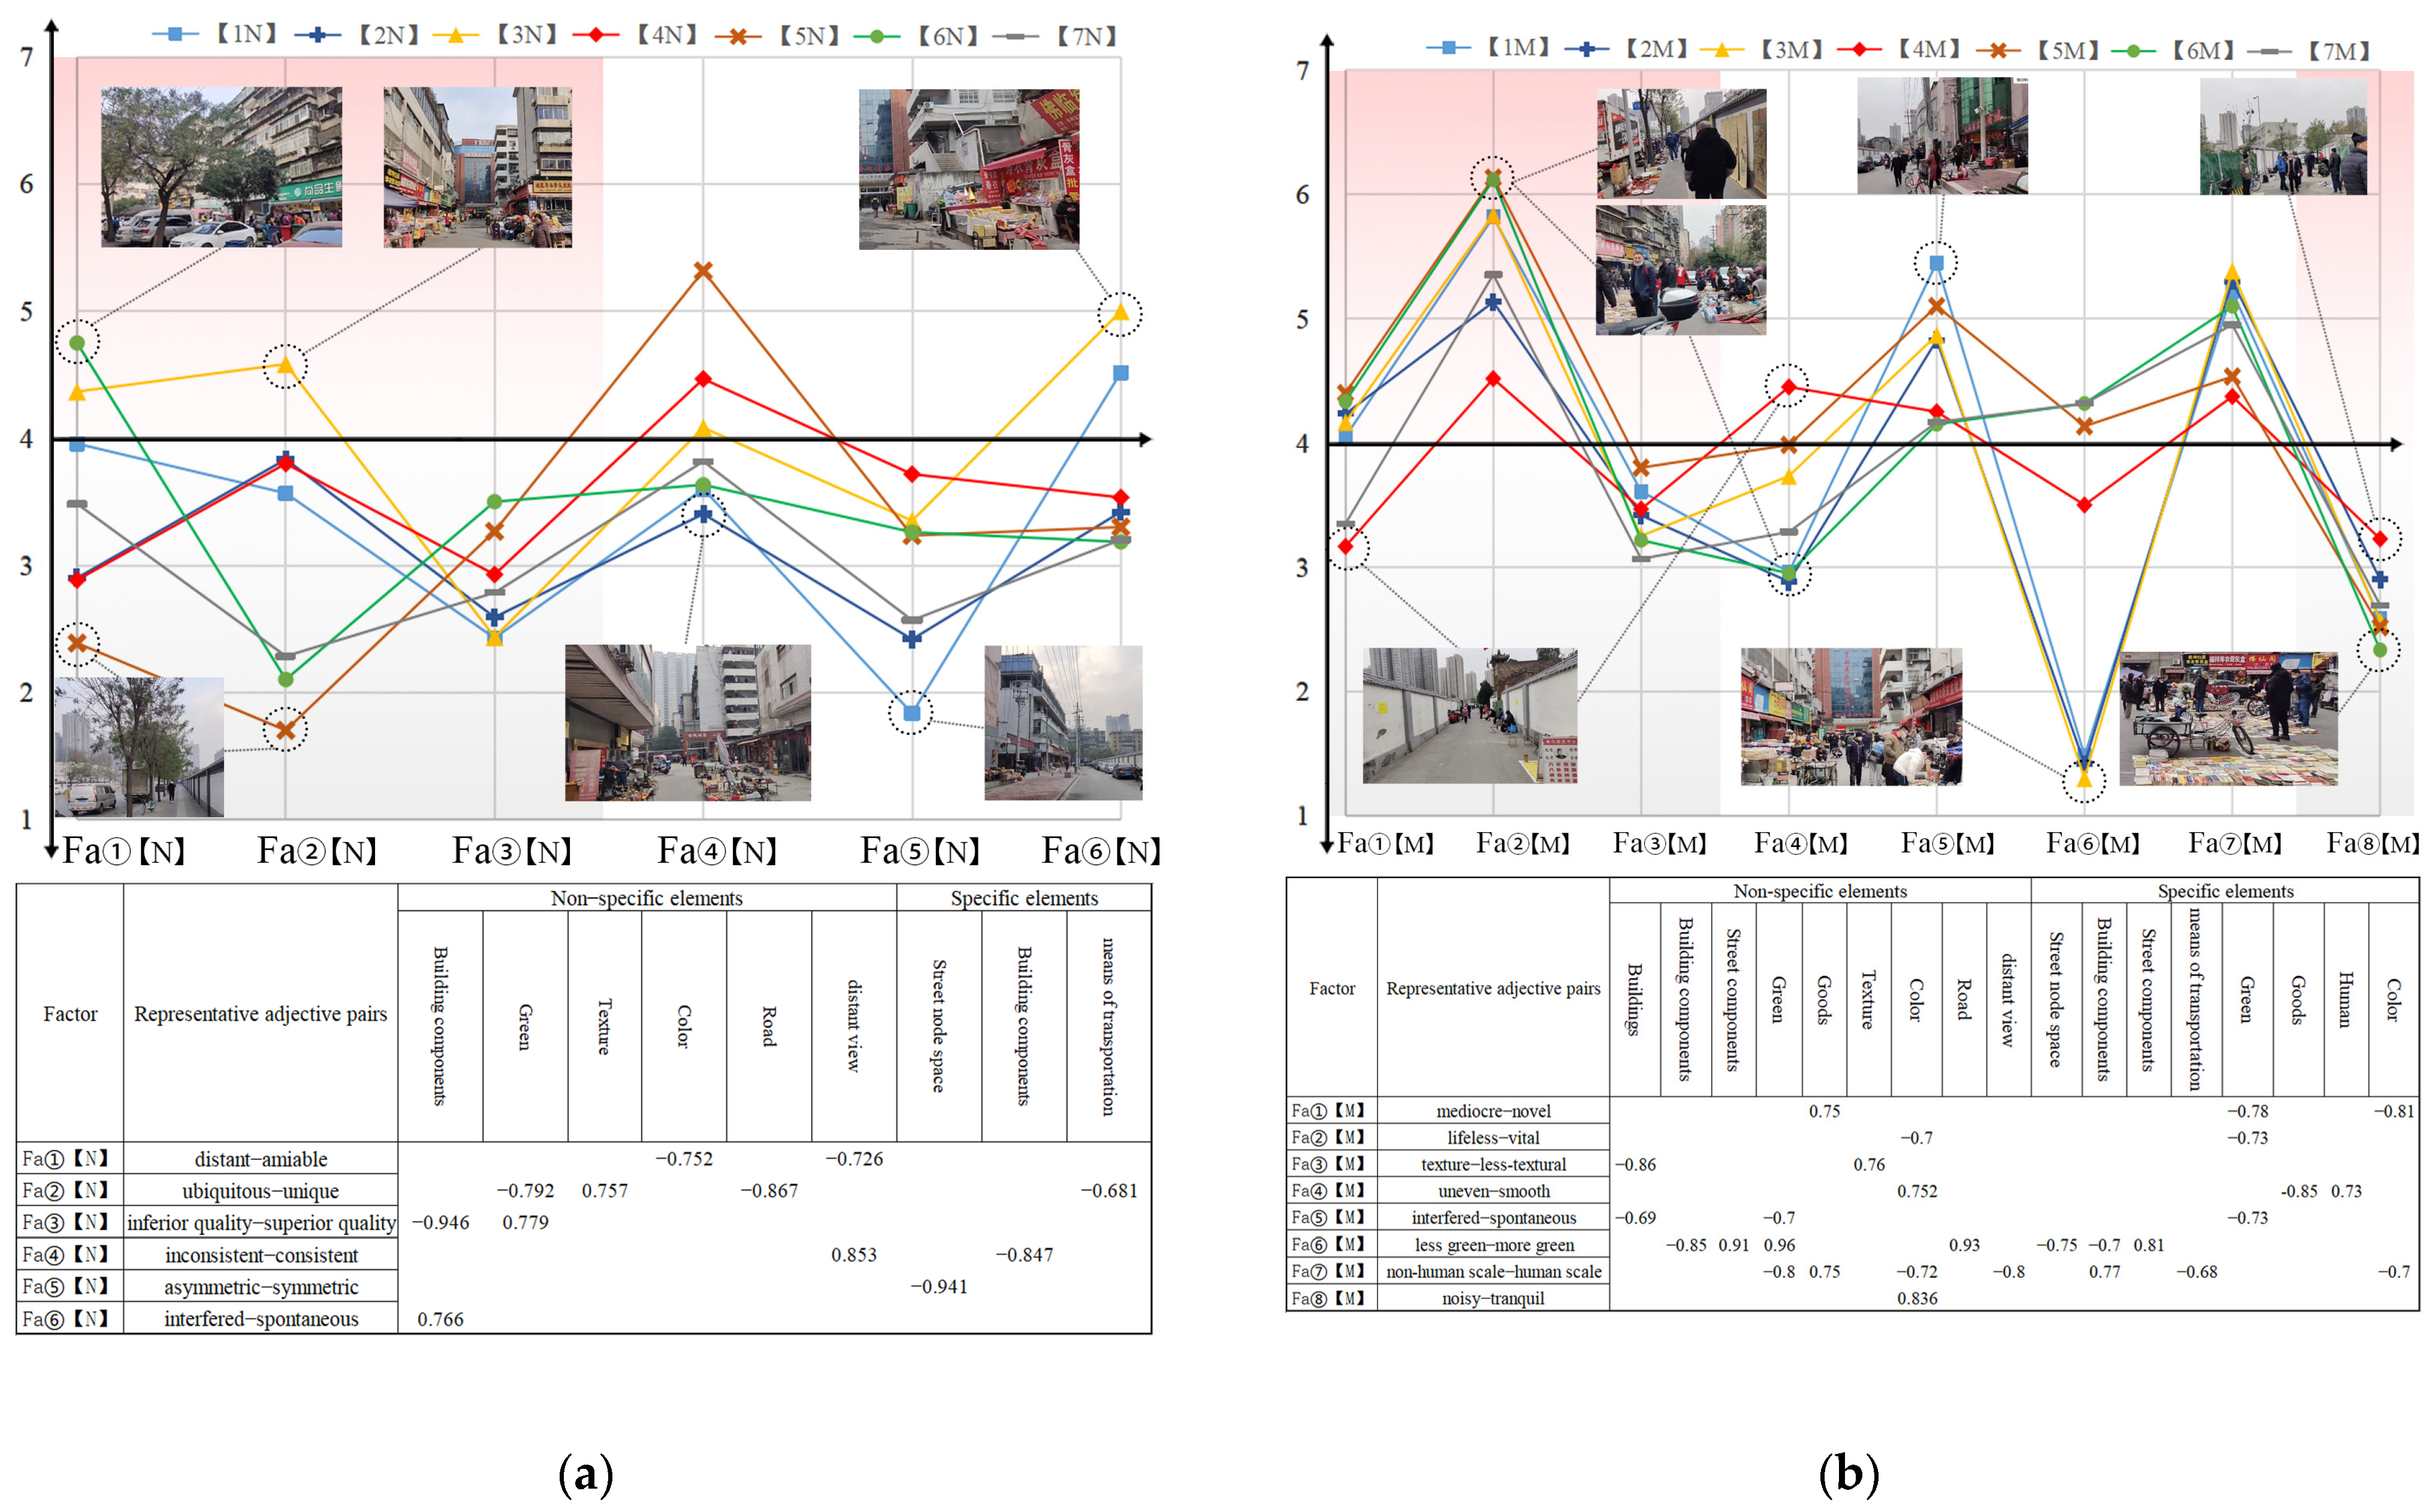
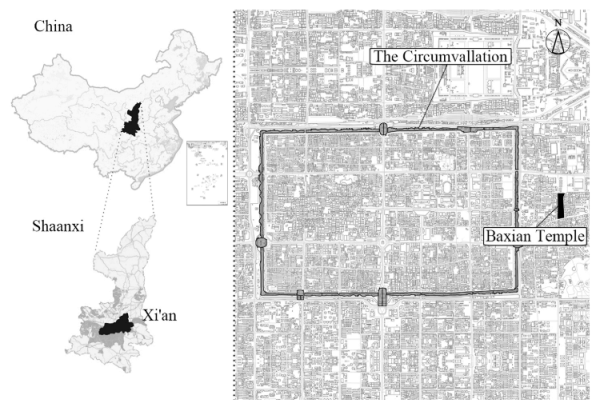
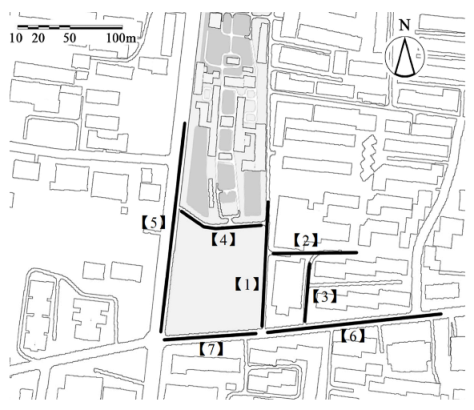
Disclaimer/Publisher’s Note: The statements, opinions and data contained in all publications are solely those of the individual author(s) and contributor(s) and not of MDPI and/or the editor(s). MDPI and/or the editor(s) disclaim responsibility for any injury to people or property resulting from any ideas, methods, instructions or products referred to in the content. |
© 2024 by the authors. Licensee MDPI, Basel, Switzerland. This article is an open access article distributed under the terms and conditions of the Creative Commons Attribution (CC BY) license (https://creativecommons.org/licenses/by/4.0/).