Abstract
The introduction of intelligent devices in buildings has brought about tremendous changes into the construction industry. The use of automation is also gradually gaining interest from the stakeholders involved in the built environment. This paper presents the perception of property stakeholders (property valuers/real estate developers and service users) regarding the acceptability of smart buildings as a future built environment in Nigeria, using Benin City a case study. A total of 159 structured questionnaires were administered with 108 retrieved and valid for analysis. The information sourced from the respondents includes smart building awareness, the support for, drivers to, and limitations of its implementation, the willingness to develop smart buildings, and the willingness to pay proportionate rent to occupy smart properties. The findings showed that the poll of respondents for the property valuers and the real estate developers, as well as the service users, claimed to be aware of the concept, and they also support its development in the country. The drivers and limitations were ranked based on their perceived level of significance. This study recommends the promotion of awareness to accelerate its acceptance and implementation. This will help propagate the process of creating a smart city in developing nations such as Nigeria and prepare property valuers professionally for its management.
1. Introduction
With the range of developments in the present times, new concepts and ideas are being introduced into the built environment to transform the construction sector. Among these include innovative methods, innovation adoptions, patent publications, research findings, green building technologies, innovative construction materials, and smart buildings technologies. This present research is based on the trend of acceptability and the application of the latter within the built environment in Nigeria.
The design and implementation strategies for smart buildings have been comprehensively reviewed by Kim et al. [1]. Recent studies have reported smart buildings as a rising niche in the development of buildings that portray global growth, but mostly in smart homes [1,2,3]. Developing nations are affected by various limitations in smart building technologies, unlike developed nations. Thus, infrastructures such as internet connection and a stable electricity supply in developed nations enhance these increasing trends. Furthermore, the governments of developed economies have made several policies to support the design, usage, and implementation of smart buildings within their territories.
In Nigeria, there is also a growing interest in the use of smart buildings [4,5,6]. Currently, a few buildings have been identified in Lagos State in Nigeria as smart buildings, as they are at the forefront of the implementation of its requirements in Nigeria. However, most buildings in the Nigerian built environment are conventional buildings. It is notable that the housing sector has its own dynamics, which are similar to the dynamics of society. As such, the housing sector globally has seen changes from makeshift cum shanty buildings to mud building to bricks and mortar, and it is currently evolving into the green building concept and, most recently, smart building technology. However, not much research has been conducted on smart buildings in Nigeria. Ejidike [7] assessed the different factors for having a concept of smart buildings in Nigeria, including its policy implications. In another study, a recent review on the importance of the adoption of smart building technologies in building construction for developing countries such as Nigeria showed that it is possible [8]. Considering the high energy demand in Nigeria due to the large population of over 200 million, as well as the goal to improve on sustainable development, there is a need for more awareness on smart buildings in Nigeria, just as green building technologies are increasing [9,10]. However, there are a vast number of smart buildings on an international scale. In the study by Mohammed et al. [11], a specific focus on developing models was presented that would solve conventional problems in real estate management, but there was little focus on smart buildings. Ye et al. [12] studied the use of ICT energy efficiency for smart buildings. The study revealed that energy efficiency in buildings can be achieved through the integration of ICT in smart buildings. Another study was carried out by Lashkari et al. [13] on the use of ICT for smart buildings. The study focused on identifying and reviewing smart home design/concepts of its operation and the various technologies that decrease the level of energy required in smart buildings without the users’ wellbeing being compromised. From their findings, it was opined that smart homes will be popular in the future, which will result in an increased demand for the efficient management of energy. They further asserted that the emerging smart buildings would require the involvement of several specialists because of their multidisciplinary nature. Wilson et al. [14] reviewed the literature on smart homes and their users. The study opined that there was a need to elaborate on the users of smart homes/buildings and how best this information might be used. In a recent study, the drivers and systems of smart buildings were reviewed by Froufe et al. [15], who found a consensus on the benefits of technology in society, such as for sustainability.
In smart buildings, the use and conservation of energy is key and requires careful planning and control. Cibira and Simon [16] examined the control of energy flow in smart buildings. Their study was aimed at providing a good understanding of the current metering technology in smart buildings. The paper described the control of energy flow and the use of a decentralized method of energy measurement to identify the energy consumption of devices in smart buildings. In the 21st century, modern power systems, such as the smart grid, which combines information technology with the traditional electricity supply infrastructure, is surfacing in many cities [17]. For the efficient use and management of electricity in smart buildings, Lee and Bahn [17] presented a new electricity usage scheduling algorithm that minimizes the total charge of electricity and guarantees the safe execution of all electricity demands. The study conducted a series of experiments with several conditions of electricity demand using the proposed algorithm. The results showed that electricity charges in smart buildings can be reduced by 27.0% on average and up to 36.4%. There are also studies on smart buildings in the field of health care provision. Moreno et al. [18] examined the role of smart buildings in the health care environment. They opined that in designing smart buildings for the purpose of healthcare, consideration should be given to the needs of the users and the healthcare staff who communicate with the users. The users should feel a sense of safety and security. However, a recent study portrayed the user’s concern as being the affordability of the housing [19]. Thus, there is the need to also understand the options for adopting smart buildings in developing nations.
The context of this present study Is the high regional heterogeneity in Benin city and the rest of Nigeria, which is a resonant issue and a task for governments all over the world. As such, it is important to deeply develop an understanding of this context in order to give the topic a wider and international context. Therefore, the authors’ hypothesis was drawn from issues that revolve around the acceptability and adoption of smart buildings in Nigeria. The questions that birth this present research are as follows: What is the current state of smart buildings in developing nations? What could be done to enhance smart buildings in developing countries? How do tenants and the built industry professionals perceive smart buildings? And what policies are necessary to enable the implementation of smart buildings in Nigeria? From the foregoing, it is implied that strong empirical and academic study on the perception of property stakeholders to the development and implementation of smart buildings in Nigeria is sparse, yet it is essential to its realization in terms of acceptance by developers and the users of buildings, and its marketability in the country, hence this study.
This study therefore investigates the acceptability of smart buildings by property stakeholders, from the lens of property valuers who are also into real estate developments and service users, as a future built environment. This study adopts empirical survey techniques using a self-administered questionnaire. The perception of these respondents was sought to ascertain the drivers and limitations of its implementation in Nigeria and their agreement analysis is put forward. The result of the analyzed questionnaire forms the basis for reaching the conclusions presented in this study.
2. An Overview of Smart Buildings as a Future Built Environment
Although the studies by Davies and Anireh [20] and Rohracher [21] reveal that the concept of building automation dates to the late 1970s, Fantana and Oae [22] were of the opinion that buildings have been equipped with automation systems since the 1960s. In 1973, a major energy crisis erupted that led to the reappraisal of energy generation and use. This led to the acceptance of smart features as the best alternative for energy conservation and crime prevention systems. In the 1980s, the integrated single function/dedicated systems (ISF) were developed. These systems enable the integration of lighting control, fire automation, lift control, security control, air-conditioning control, TV and image communication, electronic data processing, and data communication, etc., at the level of an individual function subsystem. A new system, known as the integrated multifunction and building level system, was later developed in the 1990s with the ability to integrate security, automation and/or service systems, and access control, as well as the ability to unify networks. This technology has communication systems that are assimilated as building automated systems (BAS) at the building level and integrated communication systems (ICS) that allow communication between the building and the user. The advancement of technology has led to the development of the now system, which was referred to as a computer integrated building in the year 2000. This system provided several types of networks that use Internet Protocol (IP) network technologies. This allows for distance control and monitoring through the internet. With the use of modern information technology, the integration and management of this system and voice and media communication through telephones has been made possible.
In Nigeria, conventional buildings continue to make up a significant majority of the building space as they are more rampant and are expected to maintain that position for several more decades. Conventional building design continues to receive the majority of attention within the construction sector. However, very few buildings make an effort to incorporate some aspects of sustainable construction, such as smart building design and green design, into their construction. For example, very few buildings use solar panels as a substitute for the use of the electricity power supply towards supplying energy. This energy supply could be useful for cooking, air conditioning, lighting, home gadgets, and powering users’ equipment. Additionally, very few buildings install other energy-efficient appliances that boost the insulating material within the building. Due to advances in technology, these buildings are now capable of receiving renovations that will improve their energy efficiency, their sustainability responsibility, and the occupants’ quality of life. The ever-increasing demands for improved building environments and functionality for occupants’ security, comfort, and well-being with sustainable designs, cost minimization, and the conservation of energy has promoted the development of the concept of smart buildings for residential, commercial, industrial, and other uses [22,23,24]. Some recent studies looked at smart buildings with the application of machine learning methods, such as the prediction of window-opening and occupancy sensing [25,26]. For the operation of smart buildings to be effective, there are various key elements that are necessary, as typified in Figure 1.
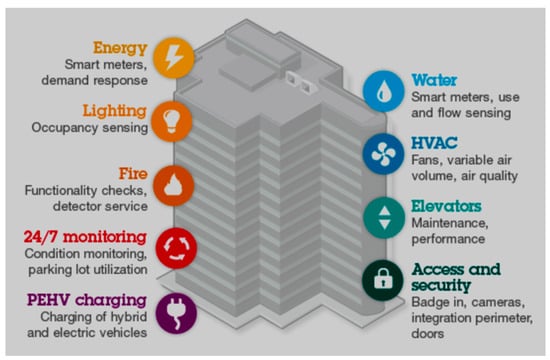
Figure 1.
Elements that could optimize the operation of smart building technology. (Image was used as seen online. Publisher: MappedIn. Copyright Year: 2020. Source: [27]).
The elements of smart buildings that could be deployed to optimize building operations include energy, lighting, water, HVAC (heating, ventilation, and air conditioning), fire, elevators, 24/7 monitoring, elevators, access, security, occupancy sensing, door access, window-opening prediction, plug-in hybrid electric vehicle (PHEV) charging, or all-electric vehicle (EV) charging [26,27]. Despite these elements, occupancy information is important for HVAC control to achieve energy saving [26].
In principle, the understanding of smart buildings is related to the definition given to the concept. Smart buildings can be said to be the technology whereby buildings are designed to have good internet access, data connectivity, good energy monitoring systems, stable electricity supply, good utility control, reliable security control, wireless connectivity based on the availability of gadgets, and their applicability. In summary, they are buildings that use technology to improve efficiency, sustainability, and security. They can use sensors, automation, and data analytics to control lighting, heating, ventilation, and air conditioning (HVAC), as well as security systems and access control. Smart buildings can also collect data on energy usage, occupant behavior, and other factors to improve performance over time. Other definitions that veer from the one adopted for this study have been succinctly described in various literature (see [20,28,29,30]). For instance, Pramanik et al. [29] defined a smart building as “one that behaves smartly with the coordination of different heterogeneous systems by incorporating smart technologies”. Accordingly, GhaffarianHoseini et al. [30] described smart homes as residential buildings that have been restructured by installing a network of sensors for communication, domestic devices, and appliances that enables the occupants to control the functions of the house by means of sophisticated monitoring and control systems. Davies and Anireh [20] also described smart buildings as “one where all appliances and systems communicate with themselves and are controlled remotely from anywhere by internet facility”. This suggests the importance of the use of internet connectivity to the appliances and systems in the building, enabling the user to control the gadgets from any location using a remote sensing device. According to Ye et al. [12], smart buildings were described as “a suite of technologies used to make the design, construction and operation of buildings more efficient, applicable to both existing and new-build properties”. In this description, consideration was given to the design, construction, and operation of building for more efficiency in new and existing buildings. Implying that existing buildings can be suitable for the installation of smart technologies is referred to as retrofitting. In the literature, retrofitting an existing building simply means the introduction or addition of new technology into a building to enable it to perform maximally and to comply with the new building trend [30]. In this case, retrofitting an existing building includes the installation, connection, and integration of all smart homes’ devices, such as using sensors, appliances, and devices in a manner that the building environment can be controlled, monitored, and accessed through a communications network. The timeline on the evolution of smart homes and smart devices is depicted in Figure 2.
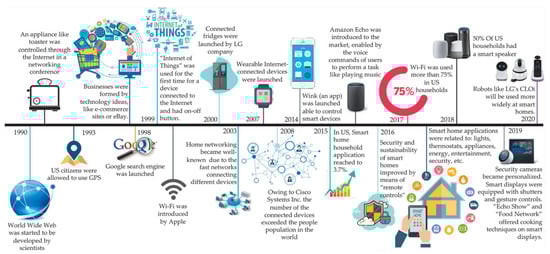
Figure 2.
Timeline of the evolution of smart homes and smart devices (Author gave permission to use this image. Publisher: IntechOpen. Copyright year: 2021. Source: [31]).
Karimi et al. [31] presented a good historical overview of smart homes and smart buildings that showed different areas that could be adaptable. Fabi et al. [32] opined that the networking of the devices in the building was most important for its ability in allowingthe flow of information exchange. Alohan and Oyetunji [33] stated that existing conventional buildings can be retrofitted to increase the performance of old buildings. Fabi et al. [32] asserted that users of buildings prefer retrofitting their existing buildings to smart environments rather than developing a new home. Retrofitting requires important decision-making and building standards that must be followed. Mejjaouli and Alzahrani [34] also presented a recent study on retrofitting strategies in residential buildings by decision-making energy modelling. In the same light, Sgrò [35] sees the retrofitting of existing buildings as more complex. This was attributed to the difficulty in carrying out the maintenance and improvement to provide the new desired qualities and performances that were not present in the building. Furthermore, Sgrò [35] asserted that retrofitting a building is not always viable economically. Moreover, the renovation of existing buildings is more complex, as it must face several constraints to remedy the obsolescence of such buildings and requires the maintenance and redevelopment of improvements, due to the occurrence of performance decay, in order to provide new qualities and performances that were not originally foreseen. Therefore, the questions for the present study include: What is the perception on the acceptability of smart buildings in Nigeria? How do stakeholders perceive the acceptability of smart buildings in the Nigerian built environment?
3. The Research Theoretical Underpinning
Smart buildings are considered to consist of three components, which are the internal network, the external network, and the residential gateway [28]. This study describes the internal network as the part that consists of both wired and wireless networks and that supports several systems that improves the quality of life of the users of the building through the installation of a combination of different communication systems, while the external consists of the internet network and the service providers that are responsible for the provision of services to users of the building. The building is linked to the internet through a device that is connected to the building. Fabi et al. [32] described the network system as the most essential technology in smart buildings because it permits the flow of information from the building and the building users. The ability of the building and the user to communicate is believed to make life easier for the user of such buildings. For instance, smart homes are designed to have the ability of providing energy saving efficiency, making life easier, providing convenience, and making life more comfortable for users (including the elderly and the disabled), as well as lowering the running cost, increasing satisfaction, increasing productivity, providing fault detection systems, and enhancing the ease of management [24,29]. It is pertinent to add that there is a dichotomy between the reality and perception of smart buildings [36]. Thus, the use of perception analysis can be applied in cases where the technology is still transitional, developing, or non-existent.
Studies have shown that less developed regions suffer from a deeper magnitude of real estate price cycles and slower overall economic recovery (see [37]). This portrays that the private investments in less developed regions are, therefore, riskier, signalling a vicious poverty cycle. However, fiscal decentralisation has been found to be favourable for meeting differing needs between regions. The implementation of smart buildings in less developed regions has often been reported to be challenging due to a number of reasons. These include the deeper magnitude of the real estate price cycle, the volatility of real estate prices, the lack of skilled labourers, difficulties in accessing capital, and slower economic recovery. Despite these challenges, there are benefits inherent to its implementation in less developed regions. These benefits could be improved energy efficiency, increased occupant comfort, enhanced security, and improved asset management. This can help to identify and address problems early on, preventing costly repairs or replacements. Nkoro and Otto [38] looked at the issues bearing on the current dispensation in Nigeria with some recommendations for policy implications.
Furthermore, the role of labour mobility is an important aspect that should be considered in smart buildings development. As people try to obtain better jobs to use smart technologies and utilise their skills better, some of them migrate from developing nations to developed nations. Smart buildings are complex systems that require a variety of skills to design, construct, and maintain. As the demand for smart buildings increases, there will be a need for skilled workers with expertise in a variety of areas. In that regard, it is vital to state that there are great benefits of investing in infrastructure in developing nations, as there is an increasing trend in labour mobility and net migration out of Nigeria, and Benin City in particular.
Recent studies have shown that the regions with insufficient infrastructure face traditionally low labour mobility and suffer from higher and longer unemployment [39,40]. However, other studies have reported that New Economic Geography (NEG) stresses the role of infrastructure investments in the attractiveness of a region for foreign direct investment (FDI) [41,42]. According to Nkoro and Uko [42], FDI alone does not necessarily improve the well-being of the populace, except when a certain minimum level of financial sector development is achieved. Their study demonstrates that the development of the domestic financial sector is a prerequisite for FDI to effectively promote inclusive growth in Nigeria. Hence, it extends the domestic absorptive capacity of the financial sector development by promoting reforms that convert FDI inflow into inclusive growth. Furthermore, countries with relevant improvement in infrastructure have witnessed a clear improvement in poverty status [43]. Therefore, in a wider discussion, investment in infrastructure may help to solve the housing poverty problem, a resonant issue across Europe [44]. Thus, the next sub-section is devoted to the methodology used in achieving the research goal, which is to investigate the stakeholder’s perception of the application and acceptability of smart buildings in Nigeria. For this smart building research, this model utilized an examination of the property stakeholders (i.e., property valuers and real estate developers) by using the theoretical concept illustrated in Figure 3.
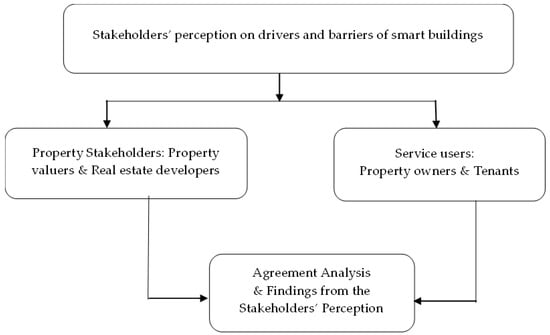
Figure 3.
Conceptual framework adopted for the study.
4. Evaluation of Its Application and Acceptability as a Future Built Environment
It is important to state that smart buildings are a relatively new concept in the current Nigerian construction industry. Its construction requires a high level of technical knowledge and skilled manpower. Due to the unsteady power supply in various parts of Nigeria currently, including Benin City, the implementation of smart buildings might be slow and demands more energy sources per building. Secondly, an increased level of automation, such as in the use of robotic systems and programmed systems such as lifts, electricity, and computer systems, is necessary. Thirdly, with the use of information technology (IT) in Nigeria, the architecture of smart buildings requires the constant availability of two main functional and dedicated infrastructures: electricity and information communication technology (ICT). Ejidike and Mewomo [8] identified different infrastructural challenges to the implementation of smart buildings in Nigeria and made some recommendations. However, we found that these recommendations have some challenges with implementation in the Nigerian built environment. Hence, different types of factors were considered in our survey. In that vein, the pilot study conducted here shows that there is the need for the right amenities and infrastructure in Nigeria to ensure that smart buildings can thrive, but the stakeholders and government need to work together to achieve it.
It has been shown that smart buildings have found usefulness in developing smart cities, as seen in the literature search. In the framework of the development of smart cities, Al Dakheel et al. [45] argued that intelligent, innovative infrastructure as well as digital technologies should be applied while simultaneously using these technologies to satisfy the requirements of people and communities. According to Al Dakheel et al. [45], the production of intellectual capital and the development of smart cities requires the capability to use digital technology for enhancing the effectiveness and capabilities of the built infrastructure in order to generate knowledge and to transform that knowledge into distinct networks, open communication systems, and unique ICT data acquisition. In Nigeria, the two infrastructures, recategorized based on their use and demand, are electricity and ICT. These components are necessary to have a functional smart city in which all the necessary stakeholders, service users, and infrastructures are available (See Figure 4).
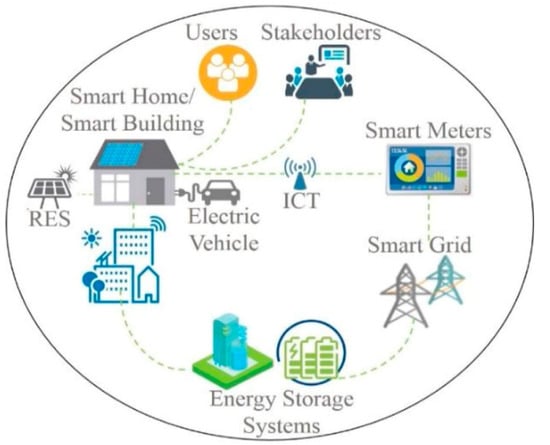
Figure 4.
Schematic of some components of a smart city (Permission was obtained to use this image. Publisher: Elsevier. Copyright year: 2020. Source: [45]).
4.1. Electricity
This infrastructure is one of the major requirements in smart buildings in order to power all the appliances and the automation devices. Etukudor et al. [46] described it as an essential need that promotes socio-economic development and the standard of living, and the general way of life of people. Due to its importance, GhaffarianHoseini et al. [30] opined that the use of electricity and electricity management in smart buildings had been considered in the literature. However, in Nigeria, the availability, quality, and reliability of the electricity supplied to the populace is a very big question that needs an answer. Frequently, the populace suffers from incessant and frequent power outages with neither apology nor explanation from the authorities to their customers [46], resulting in the poor development of economic activities. Iwuagwu and Iwuagwu [47] identified the erratic electricity power supply in the country as one of the challenges of adopting intelligent buildings. The study asserted that the total quantity of electricity supplied by all the generating stations in Nigeria is far less than the quantity demanded, thus causing a negative effect on the incorporation of intelligent technology in building. The challenges militating against the Nigerian Electricity Supply Industry (NESI) in the supply of electricity as identified by Etukudor et al. [46] include aging infrastructure, irregular gas supply, transmission grid outages and failures, inefficient metering system/high loss of revenue, high transmission losses, and under-utilization/insufficient generation. With these kinds of problems, it is most likely that they will grossly affect the efficient functioning of the automated systems installed in buildings. This will adversely affect the functioning, comfort, cost, and well-being of the occupants negatively as well as the market penetration of smart buildings in the country. However, Etukudor et al. [46] opined that the problems could be resolved if the government agencies and private investors in the sector are resilient and determined to step up and coordinate their current efforts in bridging the gap between the demand and supply of electricity. If this suggestion is adhered to, positive changes might be manifested in the future. Different researchers have investigated the power infrastructure and electricity in Nigeria and made assessments on the predicted load demands [48,49,50]. These studies considered the total prediction of electricity demand and supply in Nigeria. The studies by Nwokoye et al. [50] and Ezennaya et al. [51] revealed that there is the need for the adequate provision of infrastructure due to the continuously increasing demand for electricity in the country, as shown in Table 1.

Table 1.
Total Predicted Load Demand for power infrastructure and electricity in Nigeria, as summarized for residential, commercial, and industrial buildings (2011–2030).
The predicted load demand was obtained by adding the demand forecast for residential, commercial, and industrial properties. It is worth stating that most parts of Nigeria are billed based on estimated supply, and that the transformer control units are also lacking smart reading meters. As such, this table lacks the supply data, but it is recommended in future studies, especially considering the rising population in Nigeria, which implies that there will be more load demand and energy consumption. Moreover, comparisons can be made with related studies in which the economies have functional smart reading systems for their supplies, as good monitoring helps to increase the energy productivity in that economy. In addition, supply data would help in improving the objectivity of the interpretation of similar tables. Chidinma et al. [52] investigated the determinants for ascertaining Nigeria’s electricity demand by using data from 1970 to 2016; however, their study also showed the gap and the shortfall between the supply capacity and the demand for power by the populace as of 2011 up to 2030, as seen in Table 1. Furthermore, similar patterns have been found using other predicted studies on Nigeria’s power supply, but some variations may exist based on the method used in the prediction analysis. The electricity issue in Nigeria has not really improved over the years, as demonstrated by an energy report by Oando PLC [53], which showed that, over a decade ago, the predicted energy demand was mostly based on the supply from the hydro-electric dam in Kanji Dam at the time, before the sector was privatized. The supply has not improved much, despite Nigeria currently possessing more energy generating stations and power generating companies. Table 2 shows the power infrastructure and electricity in Nigeria before the 2013 privatization.
Table 2.
Power infrastructure and electricity in Nigeria before 2013′s privatization.
Table 2 reflects that another area of concern is capacity based on the electricity supply in Nigeria. Tinubu [53] showed that the available power generation in Nigeria as of the year 2011 was 3600 MW, while the nation’s demand was 10,000 MW and the difference was 6400 MW, as confirmed in Nwokoye et al. [50]. The transmission and distribution available were 5838 MVA and 8425 MVA, respectively, while the demand was 9340 MVA and 15,165 MVA respectively, with a difference of 3502 MVA and 6740 MVA [50,53]. The difference reflects that there is a huge gap in energy demand in Nigeria that needs to be met. However, there are different issues that the power generating companies present that affects their efficiency in Nigeria [54,55,56,57]. This should not be the case, as the nation’s population is also increasing, with a concurrent rising energy demand from the same energy sources. The trend of the data for Nigeria’s electricity supply is presented in Table 3.
Table 3.
The data on power trend of power infrastructure and electricity in Nigeria from 2013 to 2022 showing the available power generation capacity, the utilized generation, and total capacity loss.
Table 3 shows data from the time when Nigeria’s power sector was privatized in 2013. According to Ogaji [55], the document that was presented on behalf of the GenCos revealed that, from 2015 to 2022, the total capacity payment loss made through the power generating companies has risen from ₦214.93 billion in 2015 to ₦132.19 billion in 2022. The implication is that the cumulative amount of annual capacity payment loss is ₦1.8tn, based on the Power Generation Trend (2013–2022) information derived from the GenCos’ working paper [55]. Looking at the power trend data on electricity in Nigeria, it can be deduced that there are various issues that affect the unstable supply of energy, which can be linked to several factors too. An investigation on this unsteady power supply in Nigeria, which leads to high losses, is recommended for further study to understand the issues of electricity supply on smart buildings’ development in the Nigerian built environment.
Currently, the Nigerian power sector has been privatized into different energy companies, but the power supply is still unsteady, unfortunately [55,56,57]. Some of the issues that affect the Nigerian energy sector and cause some losses include the metering systems, poor data recording, poor payment systems, and the unsteady power supply to customers, which makes it challenging for them to remit payments for energy bills that are wrongly estimated or energy bills showing what they did not use, for example, in places where there were issues with the transformers, yet they are still asked to pay. Thus, these series of power issues in Nigeria would create a challenging environment for investment into smart buildings in the Nigerian built environment. In that context, the study by Awosope [58] asserted that the supply of power from the electricity industry, which is sometimes below 0.5 per unit, was pitiable and would have a serious impact on national development. This clearly indicates that the supply is grossly inadequate and is responsible for the incessant and frequent power outages. Thus, this may greatly affect the operation of smart buildings in Nigeria, unless there are changes in the power sector of Nigeria as well as other energy generating agencies operating in Nigeria.
4.2. Information Communication Technology (ICT)
The use of information technology in a building enables the building to interact with the environment and internal devices and equipment. It is another very important infrastructure that drives smart buildings. Without good, reliable, and high-speed internet connectivity, there will not be efficient performance for smart buildings as they require good interconnectivity to facilitate the information exchange between buildings and users. In Nigeria, the sorry situation of the information communication technology has been expressed in the literature [59,60,61]. Akinloye [61] exposed the effect of slow internet loading and its implications on the Nigerian economy. The study opined that poor internet connectivity has led to many Nigerians losing business opportunities. When compared with Madagascar’s broadband speed, Akinloye [61] asserted that the country relies on the subsea cables with optical fibre technology that supplies fiber broadband with an average speed of 24.87 Mbps, as reported in 2018, although it is currently faster; this caused the country to be ranked 22nd in Africa, but Akinloye lamented that Nigeria depended on WiMAX, 3G, and 4G connectivity to cover the country’s large population.
Similarly, the World Bank asserted that Nigeria needs to develop a broadband infrastructure as it accelerates socioeconomic development and digital economic transformation [59,60]. They ascertained that the development of broadband infrastructure is highly required to expand internet access and reduce the cost of data services and the prices of devices, which are currently not affordable by Nigerians living under the poverty line, in order to increase public access, thereby creating more awareness and encouraging demand. The formulation of these policies and interventions would benefit the poor, thus bridging the inequality that exists between the poor and the rich in terms of internet access. The study also revealed that the Nigerian market on ICT can be more effective in the area of access to household information communication technology, broad-band services, fixed telephone and computer penetration, and with better affordable services, customers’ protection, and e-applications [62]. Similar ICT markets exist in neighboring countries to Nigeria, such as Ghana [63], which shows the trend in technological growth in developing nations.
In Nigeria, the National Communication Commission (NCC) designed a 5 year plan (2013–2018), as communicated in the Presidential Committee on Broadband document [64], which was inaugurated back in September 2012. The NCC [64] defined broadband in the Nigerian context as “an internet experience where the user can access the most demanding content in real time at a minimum speed of 1.5 Mbit/s.” Nevertheless, this definition has the caveat that it is subject to periodic review about every 5 years in accordance with technological advancements, such as superfast broadband and fiber-optic broadband. The current plan of the NCC [65], which covers 2020–2025, states that the goal is to provide broadband access, which was defined as minimum download rates of at least 1.5 Mbps with at least 30% coverage, as well as providing 3G coverage to at least 80% of the population. Based on Nigeria’s current state of technology, development, and the applications of broadband technology, the country’s current achievement of 30% penetration falls short of what it aspires to achieve. Furthermore, while the developed world marches towards the widespread deployment of 5G technologies, the country has not yet achieved significant 4G coverage and adoption. The new Broadband Plan of 2020–2025 is intended to deliver data download speeds across Nigeria of at least 25 Mbps in urban areas, and 10 Mbps in rural areas, with effective coverage available to at least 90% of the population by 2025 at a price not more than ₦390 per 1 GB of data (which is equivalent to 2% of median income or 1% of minimum wage, based on the plan) [65]. In addition, it has been determined that Starlink has the fastest speed in Nigeria at the present time, with a significant leading speed of 230 Mbps compared with the speed of fiber internet, which is 14 Mbps. Starlink is a satellite internet service provider that is owned by Elon Musk’s SpaceX, and Starlink has been around since 2016, but it was not until 2018 that it was formally launched to begin operations. Although Nigeria as a country is falling behind its competitors, as Starlink gives access to the internet via satellite, there are other service providers already in operation in Nigeria that offer Nigerians with access to the internet via masts, such as Glo, 9-mobile, MTN, and Airtel. Undoubtedly, slower speeds cannot effectively support smart buildings, which require high speed broadband to function efficiently. For example, the minimum download speed for homes, schools, and small businesses are 25 Mbps and above, 100 Mbps–1 Gbps and above, and 50 Mbps and above, respectively [66]. Based on ICT use, most buildings in developed nations and some developing nations now use internet modems, WiFi transmission boxes, and internet connection cables (e.g., RJ-45), as well as television (TV) free-to-air connection points and smart TV wall stands that are connected during the construction as part of the design, or installed after the construction.
With the trend in innovations and technology, the adoption of smart technologies in buildings can also improve its adaptation towards achieving the benchmark of smart buildings. Thus, it is important to investigate the notion or perception of smart buildings from the populace that it is intended for, in Nigeria. As seen in Figure 4, these technologies include internet WiFi systems, telecommunication masts, helipad communication towers, internet control rooms, high-rise security control rooms, situation control rooms, security surveillance rooms, media houses, hospital control stations, emergency response control rooms, smart speakers, smart phones, online calling platforms, online streaming gadgets, video conferencing/virtual meetings systems, video calling application, p2p (peer-to-peer) chatting platforms, social media/online dating applications, Amazon’s Alexa, Google Home, smart TV, smart meters, smart bathrooms, smart lights, etc. Figure 5 gives a typical setting of smart building technologies.

Figure 5.
Typical vector image of built environment that incorporates smart building technologies and systems. The pink icons show different systems ranging from WiFi, email, online chat rooms, social media, taxi booking, car parking, helipad control room, CCTV monitoring, and cloud storages. (Image is used with permission for reuse. Publisher: Freepik, License Type: Free User License, Copyright: 2023. Source: https://www.freepik.com/vectors/smart-building accessed on 1 May 2023).
5. Research Methodology
This section covers the research methodology for this investigation.
5.1. Study Area
This research was carried out in the middle belt region of Nigeria, called Benin City in Edo State of Nigeria, in West Africa. This bustling metropolis, known as Benin City, serves as the capital of Edo state in Nigeria, with good road networks and a range of building designs (see Figure 6). It is a large city that is also an ancient city in the Benin Kingdom that is known for its traditions and art works. Benin City is the capital of Edo State and has 2 local government areas (LGA) out of the 18 LGAs in Edo State, namely Egor and Oredo. Edo State is also bordered by Kogi State, Ondo State, and Delta State. It also has rivers such as the Benin River, the Ikpoba River, the Ogba River, and the River Niger, which crosses it. There are various ethnic groups in Benin City, mainly Benins, Esan, and Afemai. Around Benin, there are others, for example, Urhobo, Itshekiri, Ijaw, Owan, Izon, Akoko Edo, Igbira, etc., but the most predominant tribe in the old Bendel region are the Benin people. Benin City is found between the coordinates of latitude 6°2′ N and 6°4′ N and the coordinates of longitude 5°3′ E and 5°4′ E. The total area of Benin City is approximately 1125 km² in size, out of Edo State’s total area of 19,819.277 km². According to Atedhor et al. [67], Benin has a topography that is rather flat because it is located at an elevation of around 8.5 km above sea level. It is located in the dense equatorial rainforest zone, which is known for its high levels of precipitation [68,69]. According to the National Population Commission (NPC) in the 2006 Census data, Benin City had a total population of 1,756,318 people [70], but the current 2023 data estimates there to be 1,904,631 people in Benin City, in Edo State, Nigeria [71].
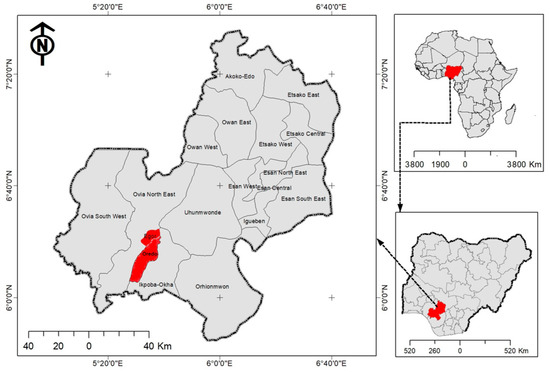
Figure 6.
Map of the study area in Benin City, Edo State, Nigeria.
5.2. Data Collection and Research Process
To achieve the goal of this research, this study portrays an interesting view in the empirical research conducted through a survey of a sample of property valuers cum developers and service users in Benin City. A quantitative research design was adopted in this study through an extensive systematic literature review to identify the perceived barriers and drivers associated with the promotion and implementation of smart buildings. Those benefits and drivers that are easy to understand, unambiguous, and appear more commonly in the literature were selected and adopted for investigation. For the purpose of this study, property valuers are professionals trained and certified on property valuation and advice in the built environment. Real estate developers are those who prepare and develop land for different purposes such as residential, commercial, and/or any other use, which could be for personal occupation and/or investment purposes. In the built environment, a property valuer could also be involved in real estate development services. In this study, only the property valuers that work in real estate developments within the study location were selected for investigation. In addition, a service user is defined as a person or group of persons who use the developments for their own purposes, such as occupying the premises. This study adopts a self-administered questionnaire to gather the information used for this research. The questionnaire was designed to obtain relevant information that is pertinent to the study. In selecting property valuers and developers, the entire population of registered firms in the study area was adopted because they are of a small number. The service users of buildings in the study area were selected using a convenience sampling technique. In total, 51 questionnaires were administered to property valuers and developers and a total of 139 to service users. From the total distribution, the response rate which was valid for the analysis of property valuers and developers was 40, representing 78.4%, while that of the service users was 78, representing 72.22%. The questionnaire used for this study contains question topics such as the awareness of smart building, a willingness to develop and/or pay rent for smart building occupation, and the support for the promotion and implementation of smart building development in Nigeria. In addition, the questionnaire was prepared by introducing key elements of smart building developments, with details on the knowledge of the subject area. However, the data excluded information about the size of the building firms consulted. Based on the case study, all the respondents are active stakeholders in the Nigerian built environment. However, to ensure that the respondents were given full information on the subject area, some definitions were made of key terms used in the study. For instance, the questionnaire made provision to explain the term smart building, which enabled the respondents to understand the subject matter and removed any bias of ignorance or lack of information.
In this study, the focus is based on the built environment, and the responses obtained were categorized using the Likert Scale. To easily understand the responses and unify the answers, which also enabled the analysis, we had to adopt a well validated research tool called the Likert Scale, as adopted in various studies [72,73,74,75]. For instance, Rokooei and Karji [75] applied this method as a significant tool in evaluating the perception of construction management students on smart buildings. In the present study, a five-point Likert was adopted for questions on the drivers and limitations of the development of smart buildings in Benin City. Responses from the categorized options were computed to determine their mean score for each factor in agreement with their level of importance. These were ranked based on their weighted level of significance. Using the Likert scale, we used numerical quantities 1, 2, 3, 4, and 5 to represent the different categories. To achieve the mean score using the Likert scale requires the averaging of the categorized options, based on the variables used to categorize the options. The mean score, MS for N number of samples, is defined in Equation (1) as:
MS = {Frequency of respondents per category}/N
The objective of the mean score is to produce a single score for our questionnaire. Then, the reliability analysis can be utilized in identifying the items that can generate the most reliable measures, which are then used as the variable items for creating an overall score or an average score for the questionnaire. In order to determine the measured construct, both the items and the scale of the questionnaire were evaluated [76,77]. This was utilized in the process of determining how to scale the questionnaire, as the Likert scale was then established. The decision point of the Likert scale is 3.00, meaning that an attribute is considered significant if the mean ranking (MR) ≥ 3.00, but is rated less significant if the MR < 3.00. The mean item score is a quantitative analysis technique used for prioritizing the level of significance of the variables investigated. This method has been widely used in various construction related research (see [78,79,80,81]). The mean item score analysis was adopted in this study to determine the relative priorities that the respondents attributed to the benefits and drivers of smart building development. This description shows precisely that the statistical interpretation of the mentioned results has a direct bearing on the results of the perceptions of smart buildings in Benin City, especially since this was the main analytical method that was used. In addition, each driver of smart building development was assigned a unique code from D1 to D11. In the same vein, each limitation of smart building development was assigned a unique code from L1 to L15, respectively. All the codes assigned for the drivers and limitations were utilized in the perception analysis, agreement analysis, and importance index, as detailed in Section 5.
However, the data were first tested for reliability. The value of the Cronbach’s Alpha ranges from 0 to 1, because alpha (α) is a coefficient of reliability. This procedure, which is also known as the reliability test, is typically carried out prior to carrying out a statistical analysis of the data that have been gathered. According to George and Mallery [82], a Cronbach’s Alpha value of 0.90 or higher indicates excellent internal consistency; a value of 0.80 or higher is considered good; a value of 0.70 or higher is regarded as acceptable; a value of 0.60 or higher is regarded as doubtful (or questionable); and a value of 0.50 or below is regarded as undesirable (or unacceptable). Based on the reliability test, the Cronbach alpha coefficients obtained for this study were 0.903 and 0.89 for the drivers and the barriers, respectively. Hence, it demonstrates a better degree of internal consistency among the advantages that were measured. Moreover, the greater the degree to which the value of Cronbach’s Alpha approaches the value of 1, the higher the level of internal consistency the item possesses within the scale [83,84,85,86]. Based on that consideration, this study’s data are consistent since they are above the 0.70 threshold.
An agreement analysis was carried out in this study to determine the extent of consensus (if any) between the views of two or more groups on the same constructs or variables of measurements. This agreement analysis, as adopted by other researchers [76,79], was conducted to determine the extent of agreement between the opinion of property valuers cum developers and service users. According to Zhang [87], rank agreement analysis is a quantitative approach that adopts the rank agreement factor (RAF). RAF reveals the absolute average disparity in the factors ranking between the two groups, i.e., property developers cum valuers (group1) and service users (group 2). The equations for computing the RAF can be computed using the equations put forward by various authors [78,79,87]. The referenced literature presents the details of the equations for the ranking analysis, the Rank Agreement Factor (RAF), the Maximal Rank Agreement Factor (RAFmax), the Disagreement Percentage (DP), and the Agreement Percentage (DP). Other terms include the Ri of a benefit, which is the summation of the ranks of the benefits or drivers from the two groups. Ri1 denotes the rank of benefits within a component in group 1. Rj2 represents the mean value of the total ranks. N denotes the number of variables in each component. K denotes the number of groups (k = 2). Rij represents the summation of the ranks of a given benefit by the two peculiar groups. Ri2 represents the rank of benefits within a component in group 2. (Ri1−Ri2) gives the ranking difference in benefits or drivers obtained from the two groups. For the importance index, II was used in this study, and it is computed using the expression:
II = {Mean Score of Property Stakeholders + Mean Score of Service Users}/2
5.3. Ethical Considerations
The ethical considerations in this study were key in developing the research and ensuring that the data are used as stated in the questionnaire. The data were obtained from respondents who were all informed about the purpose of the study. The respondents gave their consent to use the data for the research and they shared their responses willingly. The research questionnaire was also used to inform the respondent about the research and the responsibility of the researchers in the investigation. The data collection in this study protects the respondents’ data and ensures that the interests of the respondents are safeguarded. There was no coercion exerted on the people who participated in the survey to induce them to respond. The professionals working in the built environment (developers cum estate valuers) and people who use the services (service users) were surveyed for this study. They were all given a rundown of the objectives of the investigation as well as the rationale behind their selection. Due to their participation in this study, they were in no way misled or subjected to any kind of stress that may affect the information provided. Respondents were also assured that they would remain anonymous during the process.
6. Results and Discussion
The results of this study are presented in this section. It covers two aspects of the study. The first aspect is the background information, which includes an awareness of smart buildings in the Nigerian built environment, while the second part covers the drivers as well as the barriers to smart buildings in the Nigerian built environment. Figure 7 shows the results of the first section of this investigation.
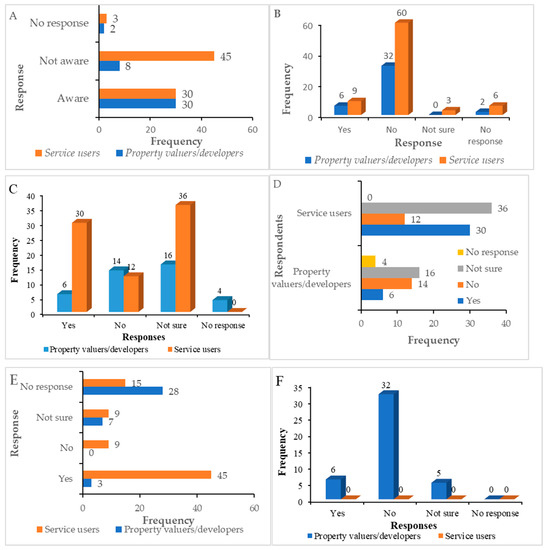
Figure 7.
Respondents’ opinions to questions about smart building awareness and acceptability, regarding (A) their awareness of smart building; (B) their awareness about smart building concepts; (C) advocacy for the development of smart building; (D) users’ willingness to pay for smart buildings when developed; (E) developers’ willingness to construct smart property; and (F) whether the transformation of conventional buildings into smart homes could have an impact on valuation methods.
The first section of the results is based on the background information sought from the respondents regarding (A) their awareness of smart building; (B) their awareness about smart building concepts; (C) advocacy for the development of smart building; (D) users’ willingness to pay for smart buildings when developed; (E) developers’ willingness to construct smart property; and (F) whether the transformation of conventional buildings into smart homes could have an impact on valuation methods. Figure 7 presents the findings of the background information.
Concerning the subject of awareness, the data in Figure 7A revealed that the frequency of the study’s respondents who have an awareness of smart buildings, in both the property stakeholder and service user groups, was 30, on each side. This means that there were a high number of property valuators and developers who confirmed that they were aware of the concept. On the other hand, forty-five service users and eight property stakeholders from the poll of respondents stated that they were not aware of the concept. Furthermore, there were three service users and two property stakeholders from the poll of respondents who indicated that they did not reply to the question. It may be deduced from this that most of the respondents are not familiar with the idea of smart buildings. This survey was also used to ascertain their level of awareness regarding any smart buildings that may exist in the country. According to the responses received from property valuers and developers, only six of them believed there are smart buildings in the country, while nine service users were of the opinion that there are not. Thirty-two property stakeholders and sixty respondents who are the service users stated that there are no smart buildings in Nigeria. Three of the service users were unsure if there are any smart buildings. This suggested that the majority of respondents believed there is no such thing as a smart building anywhere in the country.
In response to the question of whether or not they will support the development of smart buildings in Nigeria, six property stakeholders and thirty service users supported the notion, while fourteen property stakeholders and twelve service users did not support it. The findings indicate that only a tenth of the property valuers and developers support smart building construction. While 16 property stakeholders and 36 service users were unsure about supporting its development. While all the service users answered this question, four of the property stakeholders questioned did not react to the question on the survey. This gave the impression that the property valuers do not support the development of smart buildings. This can be attributed to the fact that they do not have adequate knowledge of smart buildings. On the other hand, real estate developers support the idea of smart buildings and are eager to design and construct them. In terms of the perspective of prospective renters’ willingness to pay rent for smart buildings, the results suggest that just three of the property stakeholders felt that prospective tenants will be prepared to pay rent for smart buildings, whereas thirty-two of those polled had a negative attitude towards this possibility. Five property stakeholders out of the respondents did not believe that renters would be willing to pay for such smart buildings. According to property valuers and developers, some of the respondents believed that potential renters will be prepared to pay higher rent for smart buildings, while other respondents said that prospective tenants will not be willing to pay the higher rent.
The response from service users showed that three property stakeholders and forty-five service users who were in support were unsure about whether or not the property valuers and developers would be prepared to establish smart buildings. While seven property stakeholders and nine service users were unsure about it, twenty-eight property stakeholders and fifteen service users made no response to this question. This indicated that many respondents on this survey did not believe that property valuers and developers were committed to the concept of smart building development. This demonstrates that real estate valuers and developers will be willing to design smart buildings and that they are interested in doing so. In conclusion, Figure 7 illustrates the findings on the influence that a slow transition from conventional buildings to smart buildings has on various valuation techniques. This indicates that the methods of valuation will not be impacted by the new technology that would be introduced into buildings, despite the fact that this technology would be introduced.
The second section of the results presents the research findings on the drivers of and barriers to smart building development. Table 4 and Table 5 shows the results obtained using agreement analysis as an analytical tool.
Table 4.
Perceived drivers of smart building development.
Table 5.
Perceived barriers to smart building development.
The results in Table 4 depict that, of all the factors tested in this study to be drivers of smart buildings that were perceived to be significant, factor D11 was perceived to be the most insignificant by property valuers and developers. This is represented with the mean values 2.89 and 2.74, respectively. The four most significant factors, as perceived by the respondents, were smart metering that reduces energy costs, surveillance cameras that provide high level security against burglary, the ability to detect faults, and the enhancement of occupant comfort and health, with mean values of 4.44, 4.40, 3.77, and 3.74, respectively. The statistical study conducted on the perceived drivers of smart building development showed that the agreement analysis in Table 4 confirmed that the factors are in good agreement with each other, which adds to the validity of the data, with the following values: RAFmax as 4.273, RAF as 2.182, DP as 51.064, and AP as 48.936, respectively. These values imply that the agreement factors for the perceived drivers investigated have a positive significance and a strong relationship with the smart building development under discussion. This study corroborates the assertion made by Robles and Kin [24] that smart homes could make life easier, convenient, and more comfortable for users including the elderly and the disabled. This study also confirms the claim of Pramanik et al. [29] that buildings with intelligent infrastructure ensure energy efficiency, reduced energy cost, increased satisfaction, comfort and productivity, and the automation of fault detection systems. However, this study shows that minimizing energy demand and energy costs is not a driver of smart buildings as it is believed that the installation of smart devices to buildings would induce additional demand for power and increased cost as more gadgets are powered with electricity. This justified the earlier findings of ETH’s Centre for Energy Policy and Economics (CEPE) and the Energie Schweiz in Switzerland [88,89]. These earlier reports stated that more equipment will be installed in the future life of buildings due to networking, thus increasing electricity demand. This also supports the studies that posit that regional migration will also lead to increased energy demand in some nations, especially in poorly planned economies [39,40].
The results in Table 5 show that all the factors tested in this study as limitations to smart building development were significant. However, property valuers and developers see “difficult to use due to its complexity and user interfaces, poor internet (ICT) infrastructure and lack of trust for technological services” as insignificant in the development of smart buildings. The four most significant factors, as shown in the overall mean, are viewing smart home technology as exclusive for the rich, the high initial construction cost of installation, poor power infrastructure, and there being no enabling environment to support the development of smart building, with mean values of 4.06, 4.03, 3.97, and 3.95, respectively. In the same vein, the statistical study conducted on the perceived barriers of smart building development showed that the agreement analysis in Table 5 confirmed that the factors are in good agreement with each other, which adds to the validity of the data, with the following values: RAFmax as 5.600, RAF as 4.400, DP as 78.571, and AP as 21.429, respectively. These values imply that the agreement factors on the limiting factors (or barriers) investigated have a positive significance and a strong relationship with the smart building development under discussion. The mean value of poor power infrastructure is a clear reflection of the state and condition of power supply in the country. Awosope [58] asserted that the supply of power was pitiable and has a serious impact on national development. Similarly, Etukudor et al. [46] asserted that the development of economic activities in Nigeria has been hindered by the poor electricity supply and opined that more effort is required to guarantee the availability, quality, and reliability of power supply. This clearly shows that the supply of power in Nigeria is grossly inadequate and unreliable. This will greatly affect the operation of smart buildings in Nigeria.
The use of statistical tools in quantitative research has also been considered as a profound method in data validation, as seen in earlier studies [79,80]. Another important statistical method applied is the importance index analysis. The importance index, II, was also computed for the data using Equation (2), to increase the understanding of the drivers and barriers of smart building development in Benin City, Nigeria. Despite the fact that smart buildings were seen as intelligent buildings as early as 1999 [90], they still have issues with acceptance and adaptability in developing nations such as Nigeria. Based on the data presented in Figure 8, it can be seen that the perceived drivers of smart building development have a maximal overall mean score of 4.03, as ranked based on their importance index. Similarly, based on the data presented in Figure 9, it can be seen that the perceived barriers of smart building development have a maximal overall mean score of 4.06, as ranked based on their importance index. Since the 5-point Likert scale was utilized, the average mean score from this study is 4, which shows an increased awareness of smart buildings in Benin City, Nigeria. This also means that the respondents all agreed with the factors for both the smart buildings’ drivers and the barriers. Based on the importance index of the drivers, the “smart metering which reduces energy cost”, “surveillance camera provides high level security against burglary”, “ability to detect fault”, “enhance occupant comfort and health”, and “alert user against fire via integrated fire alarm system” were perceived to be the five most important drivers by the property stakeholders and the service users, respectively (see Table 4). These findings are confirmed by various studies discussing the distinct features of smart buildings as well as other smart-sustainable practices that could be adopted in the Nigerian built environment [47,91,92,93,94]. Based on the importance index of the barriers, “viewing smart home technology as exclusive for the rich”, “high initial construction cost of installation”, “poor power infrastructure”, “no enabling environment”, “insecurity due to high cybercrime rate”, and “slow internet connectivity (uploading and downloading of information)” were perceived to be the six most important barriers by the property stakeholders and the service users, respectively (see Table 5).
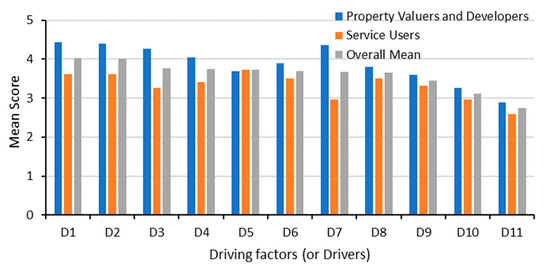
Figure 8.
Perceived drivers of smart building development ranked based on their importance index.
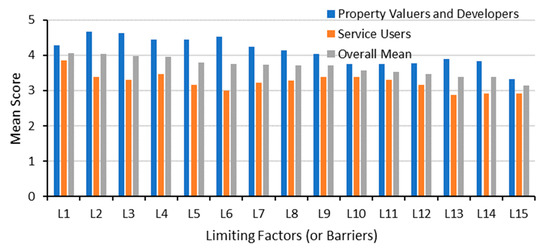
Figure 9.
Perceived barriers of smart building development ranked based on their importance index.
Figure 8 depicts that, generally, the property stakeholders expressed more agreement with the questionnaire on smart building development drivers than the service users. Similarly, Figure 9 depicts that, generally, the property stakeholders expressed more agreement with the questionnaire on smart building development barriers than the service users. However, future study can be conducted by utilising other types of ranking tests such as the Wilcoxon signed-rank test. The test can be used to improve the understanding of the significant difference between the opinions of both respondent groups for both the drivers of and barriers to smart buildings’ development in Benin City, Nigeria. The disparities between the perceptions for the drivers, as well as the barriers, are both crucial. The use of the Wilcoxon signed-rank test and the Spearman’s ranking test can help in finding out the significant differences behind the median values. Although the Wilcoxon signed-rank test is considered to be a non-parametric alternative to the t-test [75], the Spearman’s ranking test could also be used to improve the confidence level of the study. Thus, more research is also recommended to understand this trend the in development, awareness, and acceptability in developing nations.
It is important to add that the use of the importance index also helped to present some significance to the data, understand the variables, and increase the reliability of the data. The mean score used here is the average score from the two groups considered. The results in Figure 8 and Figure 9 present more understanding to Table 4 and Table 5 on the use of ‘mean’, as the research approach utilized ranking the responses based on perception. The researchers have used the mean as a basis for ranking those variables in a scientific order of numbering to understand the perceptions of smart buildings. Thus, the highest number is ranked first, while the lowest number is ranked as the least. Some of their responses were not very high based on the awareness of smart buildings in Benin City of Nigeria. By looking at the responses directly, it shows that some of the respondents had very little knowledge of smart buildings, while most had a knowledge of smart buildings. Furthermore, due to the power demand for running smart buildings, it was observed that power is a limiting factor to smart building development in Benin City. This area is also known to have an unsteady supply of electricity (or similar energy source from the power grids). In addition, there is the challenge of the high cost of internet, thus creating the issue of affordability. Another issue is the poor internet coverage to cater for the basic needs of citizens, such as internet communication, checking emails, online shopping, online dating, social networking, online job search, and browsing. As such, these are crucial conditions necessary to implement any of the mentioned kinds of smart building requirements.
Although Benin City is a fast-developing city in Nigeria, its high population could benefit from the development of smart buildings. It is also considered as a nerve centre within the middle belt region of Nigeria where a lot of ICT hubs are currently being introduced. However, the cost of innovation in this situation and the condition of the urban substances is impossible or at least difficult to calculate in this study area. Therefore, the questions around profits of the mentioned solutions can be difficult to assess for the respondents as well. As the researchers ranked their perceptions of smart buildings, this helped to statistically understand the awareness level of the respondents. As such, it does not literally mean that more people are not aware of what smart buildings mean based on the hypothetical answers or the responses given. Thus, ranking has been found to be useful in finding the significance of the results of the responses obtained.
7. Conclusions and Recommendations
This study assesses the acceptability of smart buildings by property valuers, estate developers, and service users as a future built environment in Nigeria. This study shows that the overall awareness of smart buildings is still very low in Benin City. This study also identified smart metering which reduces energy costs, surveillance cameras which provide high level security against burglary, and the ability to detect faults as the three most important factors that would drive the development of smart buildings in the country. This study further revealed that smart building technology being seen as exclusively for the rich and the high initial construction cost of installation in Nigerian society are considered as limiting factors to it development. The poor power infrastructure in the country was also considered as one of the key factors that would limit the acceptability of the development of smart buildings. In addition, there are economic and policy measures that have been envisaged to improve the situation described in this paper, as well as the interventions on energy production, steady electricity supply, renewable energy sources, and reliable internet connection, which are necessary for smart buildings in Nigeria.
Using a case study of Benin City, a 159-person structured questionnaire was administered with 108 responses retrieved and valid for analysis. The information sourced from the respondents includes smart building awareness, support for, drivers to, and limitations of its implementation, the willingness to develop smart buildings, and the willingness to pay proportionate rent to occupy smart properties. The findings showed that the poll of respondents for the property valuers and the real estate developers, as well as the service users, claimed to be aware of the concept, and they also support its development in the country. The drivers and limitations were ranked based on their perceived level of significance. This study does reflect the importance of the service users in understanding the infrastructural developments in the Nigerian built environment. Further study is suggested using feedback information about the service users of buildings and their social groups to understand their perceptions of smart buildings, as it would be useful to include some information on the higher conversion costs for existing buildings and the higher costs for new buildings, in the future. One limitation found for the implementation of smart buildings in Nigeria is the lack of a steady electricity supply in Nigeria. Moreover, using the predicted load demands, which is a summation of the energy demand from commercial, residential, and industrial buildings, it was found that there is a need for stable electricity supply or the adoption of other renewable energy sources, which will ensure the sustainable development of smart buildings in Nigeria. On a general note, there are economic and policy measures which could be envisaged to improve the situation described in this paper, as well as the interventions on energy production and internet connection. These measures include providing stable power supply, providing more investment opportunities for SMEs (small and medium scale enterprises), energy investors, ICT investors, collaborations with ICT multi-national companies, enhancing IT skill developments, and providing renewable energy sources in Nigeria and training platforms for energy production, as well as internet connections. Since reducing energy costs is the first perceived driver of smart building development, it is recommended that future studies should discuss further the advanced control technologies aiming to reduce energy costs, such as using mixed-mode ventilation or optimizing HVAC system control through AI technologies. This could be important since reducing cost is the first perceived driver in Table 3.
Based on these findings, it is recommended that a concerted effort should be made to raise the awareness level of property valuers, developers, and users of buildings through their various networks to accelerate acceptance of smart building development as the word is gradually moving to the technological environment and to prepare the property valuers professionally for its management beforehand. Secondly, there should be a concerted effort on the part of the Nigerian government to improve energy generation and supply, and the proper and adequate metering of buildings in the country, even though it is believed that smart building technology would be seen as exclusively for the rich. Thirdly, this study recommends the promotion of awareness to accelerate its acceptance and implementation. This will help propagate the process of creating a smart city in developing nations such as Nigeria and prepare property valuers professionally for its management. Since the scope of this paper was limited, the stakeholders consulted for this study were the property stakeholders alone, while the other group were the service users. However, the stakeholders in the Nigeria built environment are more inclusive, so there is room to consult other stakeholders. It is recommended to conduct a review of stakeholders’ propositions, e.g., cost, infrastructure requirements, regulation and coding requirements, implementation programs, maintenance, etc. Furthermore, there should be policies on energy measurement, energy distribution, and the use of renewable energy to reduce electric bills. There is the need to adapt new smart metering systems in Nigerian residential homes and office buildings to display the energy consumption and energy savings made.
Future research is required for the implementation of smart systems for the supply of energy in Nigeria, and for the adaptation of smart technologies in various buildings in Nigeria. While the Nigeria built environment is developing, there are issues of the enforcement of National Building Code (NBC) in Nigeria. We recommend that it is reviewed with provisions for Smart Buildings. Furthermore, future study should investigate the issues with the existing (or conventional) building control systems in Nigeria, as well as another study to identify the potential of the implementation of smart buildings to resolve these issues. To add recommendations made from this study to current policies, the role of factor mobility should be considered as one of the key points in the policy debate. Thus, a further assessment of these identified factors can be examined in future studies through a comparative assessment of developed and developing nations.
Author Contributions
E.O.A.: conceptualization, methodology, investigation, writing—original draft preparation, data collection, data curation, data analysis, supervision, and funding acquisition; A.K.O.: conceptualization, methodology, data collection, data curation, writing—original draft preparation, writing—reviewing and editing, formal analysis, visualization, software, resources, and funding acquisition; C.V.A.: methodology, data curation, writing—reviewing and editing, funding acquisition, visualization, software, validation; E.C.D.: data curation, writing—reviewing and editing, visualization, software, validation, and funding acquisition; P.C.: data curation, formal analysis, writing—reviewing and editing, visualization, software, and validation. All authors have read and agreed to the published version of the manuscript.
Funding
The School of Engineering, Lancaster University, UK and the EPSRC’s Doctoral Training Centre (DTC) are highly appreciated in conducting this study. Furthermore, the funding of Overseas Postgraduate Scholarships by Niger Delta Development Commission (NDDC) and the Tertiary Education Trust Fund (TETFUND), both in Nigeria, are also appreciated. The support of Universiti Tenaga Nasional (UNITEN), Malaysia, under the BOLD25 Initiative, is acknowledged.
Data Availability Statement
The data supporting the reported results cannot be shared at this time, as they have been used in producing more publications on this research.
Acknowledgments
The authors acknowledge the support of Lancaster University and the University of Benin in conducting this study. The authors also appreciate the expert feedback of the members of the built environment in Nigeria during the development of this manuscript. The reviewers are also much appreciated for their feedback, which has helped in shaping the quality of this manuscript.
Conflicts of Interest
The authors declare no conflict of interest.
References
- Kim, D.; Yoon, Y.; Lee, J.; Mago, P.J.; Lee, K.; Cho, H. Design and implementation of smart buildings: A review of current research trend. Energies 2022, 15, 4278. [Google Scholar] [CrossRef]
- De Silva, L.C.; Morikawa, C.; Petra, I.M. State of the art of smart homes. Eng. Appl. Artif. Intell. 2012, 25, 1313–1321. [Google Scholar] [CrossRef]
- Sovacool, B.K.; Del Rio, D.F. Smart home technologies in Europe: A critical review of concepts, benefits, risks and policies. Renew. Sustain. Energy Rev. 2019, 120, 109663. [Google Scholar] [CrossRef]
- Oyewole, M.O.; Araloyin, F.M.; Oyewole, P.T. Residents’ awareness and aspiration for smart building features: The case of okota, Lagos, Nigeria. Niger. J. Environ. Sci. Technol. 2019, 3, 30–40. [Google Scholar] [CrossRef]
- Ejidike, C.C.; Mewomo, M.C.; Anugwo, I.C. Assessment of construction professional awareness of the smart building concepts in the Nigerian construction industry. J. Eng. Des. Technol. 2022; ahead-of-print. [Google Scholar] [CrossRef]
- Ghansah, F.A.; Owusu-Manu, D.-G.; Ayarkwa, J.; Edwards, D.J.; Hosseini, M.R. Assessing the level of awareness of smart building technologies (SBTs) in the developing countries. J. Eng. Des. Technol. 2022, 20, 696–711. [Google Scholar] [CrossRef]
- Ejidike, C.C. An assessment of the Adoption of Smart Building Concept in the Nigerian Construction Industry. Master’s Thesis, Durban University Of Technology, Durban, South Africa, 2023. Available online: https://ir.dut.ac.za/bitstream/10321/4208/3/Ejidike_CC_2022.pdf (accessed on 21 April 2023).
- Ejidike, C.C.; Mewomo, M.C. Benefits of adopting smart building technologies in building construction of developing countries: Review of literature. SN Appl. Sci. 2023, 5, 52. [Google Scholar] [CrossRef]
- Oyedepo, S.O. Energy and sustainable development in Nigeria: The way forward. Energy Sustain. Soc. 2012, 2, 15. [Google Scholar] [CrossRef]
- Oguntuase, O.J.; Windapo, A. Green bonds and green buildings: New options for achieving sustainable development in Nigeria. In Housing and SDGs in Urban Africa, Advances in 21st Century Human Settlements; Nubi, T.G., Ed.; Springer Nature Singapore Private Limited: Singapore, 2021; pp. 193–218. [Google Scholar] [CrossRef]
- Mohammed, J.K.; Bello, M.Z.; Saidu, U.A.; Maikudi, M. A Model for Integrated Smart Real Estate. In Proceedings of the FES 2018 Conference on Africa Smart City Agenda, Held at the University of Lagos, Washington, DC, USA, 24–26 July 2018; Available online: https://www.researchgate.net/publication/328320040 (accessed on 21 April 2023).
- Ye, J.; Hassan, M.T.; Carter, D.C.; Zarli, A. ICT for Energy Efficiency: The Case for Smart Buildings. In Managing IT in Construction/Managing Construction for Tomorrow; Dikbas, A., Ergen, E., Giritli, H., Eds.; CRC Press: Boca Raton, FL, USA, 2010; Available online: https://itc.scix.net/pdfs/w78-2009-1-66.pdf (accessed on 21 April 2023). [CrossRef]
- Lashkari, B.; Chen, Y.; Musilek, P. Energy Management for Smart Homes—State of the Art. Appl. Sci. 2019, 9, 3459. [Google Scholar] [CrossRef]
- Wilson, C.; Hargreaves, T.; Hauxwell-Baldwin, R. Smart homes and their users: A systematic analysis and key challenges. Pers. Ubiquit. Comput. 2014, 19, 463–476. [Google Scholar] [CrossRef]
- Froufe, M.M.; Chinelli, C.K.; Guedes, A.L.A.; Haddad, A.N.; Hammad, A.W.; Soares, C.A.P. Smart buildings: Systems and drivers. Buildings 2020, 10, 153. [Google Scholar] [CrossRef]
- Cibira, G.; Simon, P. Energy Flow Control in Smart Buildings. Proceedings of ALER 2018 Conference, At: Liptovský Ján, Slovakia. 2018. Available online: https://www.researchgate.net/publication/330717079 (accessed on 21 April 2023).
- Lee, E.; Bahn, H. Electricity Usage Scheduling in Smart Building Environments Using Smart Devices. Sci. World J. 2013, 2013, 468097. [Google Scholar] [CrossRef]
- Moreno, L.V.; Ruiz, M.L.M.; Hernández, J.M.; Duboy, M.Á.V.; Lindén, M. The Role of Smart Homes in Intelligent Homecare and Healthcare Environments. In Ambient Assisted Living and Enhanced Living Environments; Butterworth-Heinemann: Oxford, UK, 2016; pp. 345–394. Available online: https://www.researchgate.net/publication/312183317 (accessed on 21 April 2023).
- Ezennia, I.; Hoskara, S. Applications of Housing Affordability Measurement Approaches Used in Planning Affordable Housing: A Systematic Review. J. Build. Constr. Plan. Res. 2022, 10, 1–36. [Google Scholar] [CrossRef]
- Davies, E.I.; Anireh, V.I.E. Design and Implementation of Smart Home System Using Internet of Things. J. Digit. Innov. Contemp. Res. Sci. Eng. Technol. 2019, 7, 33–42. [Google Scholar] [CrossRef]
- Rohracher, H. Smart Homes and Energy Efficiency Constructive Technology Assessment of ICT Use in Sustainable Buildings. In Proceedings of the 2002 ACEEE Summer Study on Energy Efficiency in Buildings: Teaming for Efficiency. American Council for an Energy-Efficient Economy. Panel Session-Human and Social Dimensions of Energy Use: Understanding Markets and Demand, Washington, DC, USA; 2002; pp. 8241–8252. Available online: https://www.aceee.org/files/proceedings/2002/data/papers/SS02_Panel8_Paper20.pdf (accessed on 21 April 2023).
- Fântână, G.I.; Oae, S.A. Evolution of Smart Buildings. Int. J. Energy 2021, 15, 41–43. [Google Scholar] [CrossRef]
- GhaffarianHoseini, A.; Berardi, U.; AlWaer, H.; Chang, S.; Halawa, E.; Ghaffarianhoseini, A.; Clements-Croome, D. What is an intelligent building? Analysis of recent interpretations from an international perspective. Archit. Sci. Rev. 2016, 59, 338–357. [Google Scholar] [CrossRef]
- Robles, J.R.; Kim, T. Applications, Systems and Methods in Smart Home Technology: A Review. Int. J. Adv. Sci. Technol. 2010, 15, 37–48. Available online: https://www.researchgate.net/publication/242630611 (accessed on 28 April 2023).
- Alanne, K.; Sierla, S. An overview of machine learning applications for smart buildings. Sustain. Cities Soc. 2022, 76, 103445. [Google Scholar] [CrossRef]
- Dai, X.; Liu, J.; Zhang, X. A review of studies applying machine learning models to predict occupancy and window-opening behaviours in smart buildings. Energy Build. 2020, 223, 110159. [Google Scholar] [CrossRef]
- Hueston, C. Your Guide to Smart Buildings; MappenIn: Waterloo, ON, Canada, 2020. Available online: https://www.mappedin.com/blog/use-cases/offices/your-guide-to-smart-buildings/ (accessed on 9 June 2023).
- Mantas, G.; Lymberopoulos, D.; Komninos, N. Security in Smart Home Environment. In Wireless Technologies for Ambient Assisted Living and Healthcare: Systems and Applications; Lazakidou, A., Siassiakos, K., Ioannou, K., Eds.; Medical Information Science Reference. Hershey: Hershey, PA, USA, 2011; Available online: https://www.researchgate.net/publication/232923869 (accessed on 21 April 2023).
- Pramanik, P.K.D.; Mukherjee, B.; Pal, S.; Pal, T.; Singh, S.P. Green Smart Building: Requisites, Architecture, Challenges and Use Cases; IGI Global: Hershey, PA, USA, 2020. Available online: https://www.researchgate.net/publication/333784260 (accessed on 21 April 2023).
- GhaffarianHoseini, A.; GhaffarianHoseini, A.; Tookey, J.; Omrani, H.; Fleury, A.; Naismith, N.; GhaffarianHoseini, M. The Essence of Smart Homes: Application of Intelligent Technologies towards Smarter Urban Future; IGI Global: Hershey, PA, USA, 2016. Available online: https://www.researchgate.net/publication/316996187 (accessed on 21 April 2023).
- Karimi, R.; Farahzadi, L.; Sepasgozar, S.M.E.; Sargolzaei, S.; Ebrahimzadeh Sepasgozar, S.M.; Zareian, M.; Nasrolahi, A. Chapter 8: Smart Built Environment Including Smart Home, Smart Building and Smart City: Definitions and Applied Technologies. In Advances and Technologies in Building Construction and Structural Analysis; Kaboli, A., Shirowzhan, S., Eds.; IntechOpen Limited: London, UK, 2021. [Google Scholar] [CrossRef]
- Fabi, V.; Spigliantinia, G.; Corgnatia, S.P. Insights on Smart Home concept and occupants’ interaction with building controls. In Proceedings of the 8th International Conference on Sustainability in Energy and Buildings, SEB-16, Turin, Italy, 11–13 September 2016. [Google Scholar] [CrossRef]
- Alohan, E.O.; Oyetunji, A.K. Hindrance and benefits to green building implementation: Evidence from Benin City, Nigeria. Real Estate Manag. Valuat. 2021, 29, 65–76. [Google Scholar] [CrossRef]
- Mejjaouli, S.; Alzahrani, M. Decision-making model for optimum energy retrofitting strategies in residential buildings. Sustain. Prod. Consum. 2020, 24, 211–218. [Google Scholar] [CrossRef]
- Sgrò, G. Smart Buildings: ICT as a Driving Energy-Efficient Solution for Retrofitting of Existing Buildings. Master’s Thesis, KTH School of Industrial Engineering and Management Energy Technology, Sweden, Stockholm, 2018. [Google Scholar]
- Honeywell. Perception Vs. Reality: The Truth About Smart Buildings; Forbes: Jersey City, NJ, USA, 2016. Available online: https://www.forbes.com/sites/honeywell/2016/11/23/perception-vs-reality-the-truth-about-smart-buildings/?sh=7b1e0bc76c17 (accessed on 22 April 2023).
- Hromada, E.; Heralová, R.S.; Čermáková, K.; Piecha, M.; Kadeřábková, B. Impacts of Crisis on the Real Estate Market Depending on the Development of the Region. Buildings 2023, 13, 896. [Google Scholar] [CrossRef]
- Nkoro, E.; Otto, G. Fiscal Federalism and Economic Development in Nigeria: An Econometric Analysis. Int. J. Econ. Sci. 2023, 12, 144–162. [Google Scholar] [CrossRef]
- Kurekova, L.; Hejdukova, P. Multilevel research of migration with a focus on internal migration. Int. J. Econ. Sci. 2021, 10, 87–103. [Google Scholar] [CrossRef]
- Kurekova, L. Regional migration and the dimension of distance in empirical analysis. Int. J. Econ. Sci. 2022, 11, 80–91. [Google Scholar] [CrossRef]
- Rosik, P.; Wójcik, J. Transport Infrastructure and Regional Development: A Survey of Literature on Wider Economic and Spatial Impacts. Sustainability 2023, 15, 548. [Google Scholar] [CrossRef]
- Nkoro, E.; Uko, A.K. Foreign Direct Investment and Inclusive Growth: The Role of the Financial Sector Development. Int. J. Econ. Sci. 2022, 11, 92–110. [Google Scholar]
- Luczak, A.; Kalinowski, S. A multidimensional comparative analysis of poverty statuses in European Union countries. Int. J. Econ. Sci. 2022, 11, 146–160. [Google Scholar]
- Hromada, E.; Cermakova, K. Financial unavailability of housing in the czech republic and recommendations for its solution. Int. J. Econ. Sci. 2021, 10, 47–58. [Google Scholar] [CrossRef]
- Al Dakheel, J.; Del Pero, C.; Aste, N.; Leonforte, F. Smart Buildings Features and Key Performance Indicators: A Review. Sustain. Cities Soc. 2020, 61, 102328. [Google Scholar] [CrossRef]
- Etukudor, C.; Abdulkareem, A.; Ayo, O. The Daunting Challenges of the Nigerian Electricity Supply Industry. J. Energy Technol. Policy 2015, 5, 2015. Available online: https://iiste.org/Journals/index.php/JETP/article/view/25848/26280 (accessed on 28 April 2023).
- Iwuagwu, U.B.; Ben Iwuagwu, C.M. Adopting Intelligent Buildings in Nigeria: The Hopes and Fears. In Proceedings of the 2nd International Conference on Emerging Trends in Engineering and Technology (ICETE 2014), London, UK, 30–31 May 2014; Volume 10, pp. 160–163. Available online: http://iieng.org/images/proceedings_pdf/2534E0514560.pdf (accessed on 15 June 2023).
- Thomas, O.E.; Okafor, E.N.C. Electrical Energy Demand Forecast in Nigeria Between 2020–2040 Using Probabilistic Extrapolation Method. Int. J. Eng. Sci. Appl. 2021, 5, 71–85. Available online: https://dergipark.org.tr/tr/download/article-file/1766809 (accessed on 21 April 2023).
- Idoniboyeobu, D.C.; Ogunsakin, A.J.; Wokoma, B.A. Forecasting of Electrical Energy Demand in Nigeria using Modified Form of Exponential Model. Am. J. Eng. Res. 2018, 7, 122–135. Available online: https://www.researchgate.net/publication/322529926 (accessed on 21 April 2023).
- Nwokoye, E.S.; Dimnwobi, S.K.; Ekesiobi, C.S.; Obegolu, C.C. Power Infrastructure and Electricity in Nigeria: Policy Considerations for Economic Welfare. KIU J. Humanit. 2017, 2, 5–17. Available online: https://www.ijhumas.com/ojs/index.php/kiuhums/article/view/100 (accessed on 21 April 2023).
- Ezennaya, O.S.; Isaac, O.E.; Okolie, U.O.; Ezeanyim, O.I.C. Analysis of Nigeria’s national electricity demand forecast (2013–2030). Int. J. Sci. Technol. Res. 2014, 3, 333–340. Available online: https://www.researchgate.net/publication/262689349 (accessed on 11 June 2023).
- Chidinma, E.; Akorede, R.A.; Mary, O.I.; John, A.O. The Determinants of Electricity Demands in Nigeria from 1970-2016 Error Correction Mechanism Approach. IOSR J. Econ. Financ. 2018, 46, 60. Available online: https://core.ac.uk/reader/234696630 (accessed on 21 April 2023).
- Tinubu, W. Transforming The Nigerian Economy through Energy Projects; Oando Plc: Lagos, Nigeria, 2011. Available online: https://www.oandoplc.com/wp-content/uploads/Transforming-theNigerian-Economy-through-Energy-Projects1.pdf (accessed on 11 June 2023).
- Nnodim, O. Power Generation Crashes by 990MW, Gencos Lose N1.8tn; Punch: Lagos, Nigeria, 2023. Available online: https://punchng.com/power-generation-crashes-by-990mw-gencos-lose-n1-8tn (accessed on 15 January 2023).
- Ogaji, J. Power Generation Trend (2013–2022); Power Generation Companies in Nigeria (GenCos)—Association of Power Generation Companies (APGC): Abuja, Nigeria, 2022. [Google Scholar]
- Amah, J. Electricity Crisis: GenCos Blame N1.64trn Debt for Low Power Supply; Daily Asset: Lugbe, Nigeria, 2022. Available online: https://dailyasset.ng/electricity-crisis-gencos-blame-n1-64trn-debt-for-low-power-supply/ (accessed on 11 June 2023).
- Esiedesa, O. How Poor Generation, Metering Gap, Financial Crisis Shackled Power Sector in 2021; Vanguard: Lagos, Nigeria, 2022. Available online: https://www.vanguardngr.com/2022/01/how-poor-generation-metering-gap-financial-crisis-shackled-power-sector-in-2021/ (accessed on 11 June 2023).
- Awosope, A.C. Nigeria Electricity Industry: Issues, Challenges and Solutions, Covenant University 38th Public Lecture; Covenant University Press: Ota, Nigeria, 2014; Volume 3. [Google Scholar]
- World Bank Group. Nigeria Digital Economy Diagnostic Report (DE4A); World Bank Group: Washington, DC, USA, 2019; Available online: https://elibrary.worldbank.org/doi/abs/10.1596/32743 (accessed on 21 April 2023).
- Yves, M.J.L.; Siegfried, Z.; Neto, M.I.A.S.; Boroffice, F.A.; Karpinski, K.; Lim, L.T.; Lawal, M.; Agapitova, N.; Adekola, O.A.; Bra, P. Nigeria Digital Economy Diagnostic Report (English); World Bank Group: Washington, DC, USA, 2019; Available online: http://documents.worldbank.org/curated/en/387871574812599817/Nigeria-Digital-Economy-Diagnostic-Report (accessed on 21 April 2023).
- Akinloye, B. Still Loading: How Slow Internet Speed Under-Develops Nigeria’s Economy, Stifle SMEs Growth; Thisday: Lagos, Nigeria, 2018; pp. 76–77. [Google Scholar]
- Odufuwa, F. Understanding What is Happening in ICT in Nigeria. A Supply-and Demand Side Analysis of the ICT Sector. Evidence for ICT Policy Action Policy; Research ICT Africa: Cape Town, South Africa, 2012; p. 6. Available online: https://researchictafrica.net/publications/Evidence_for_ICT_Policy_Action/Policy_Paper_6_-_Understanding_what_is_happening_in_ICT_in_Nigeria.pdf (accessed on 28 April 2023).
- Frempong, G. Understanding What is Happening in ICT in Ghana. A Supply-and Demand Side Analysis of the ICT Sector. Evidence for ICT Policy Action Policy; Research ICT Africa: Cape Town, South Africa, 2012; p. 4. Available online: https://researchictafrica.net/publications/Evidence_for_ICT_Policy_Action/Policy_Paper_4_-_Understanding_what_is_happening_in_ICT_in_Ghana.pdf (accessed on 28 April 2023).
- NCC. Nigeria’s National Broadband Plan 2013–2018. A submission by the Presidential Committee on Broadband; Research ICT Africa: Cape Town, South Africa, 2012. Available online: https://www.researchictafrica.net/countries/nigeria/Nigeria_National_Broadband_Plan_2013-2018.pdf (accessed on 21 April 2023).
- NCC. Nigeria’s National Broadband Plan 2020–2025. A Submission by the Presidential Committee on Broadband; NCC: Abuja, Nigeria, 2020. Available online: https://ncc.gov.ng/documents/880-nigerian-national-broadband-plan-2020-2025/file (accessed on 21 April 2023).
- Kruger, G.L. Defining Broadband: Minimum Threshold Speeds and Broadband Policy; Congressional Research Service: Washington, DC, USA, 2017. Available online: https://sgp.fas.org/crs/misc/R45039.pdf (accessed on 17 June 2023).
- Atedhor, G.O.; Odjugo, P.A.O.; Uriri, A.E. Changing Rainfall and Anthropogenic-Induced Flooding: Impacts and Adaptation Strategies in Benin City, Nigeria. J. Geogr. Reg. Plan. 2011, 4, 42–52. Available online: https://academicjournals.org/article/article1379662581_Atedhor%20et%20al.pdf (accessed on 5 May 2023).
- Efe, S.; Eyefia, A. Urban Effects on the Precipitation of Benin, Nigeria. Am. J. Clim. Change 2014, 3, 8–21. [Google Scholar] [CrossRef]
- Oyetunji, A.; Ogunkolu, A.; Hamza, A.; Njoku, M.; Ogbole, M. Application of geographical information system for flood vulnerability mapping along Ikpoba River Benin City, Nigeria. Ethiop. J. Environ. Stud. Manag. 2019, 12, 485–496. Available online: https://www.researchgate.net/profile/Ayodeji-Bolade-Ogunkolu/publication/337150973 (accessed on 22 April 2023).
- NPC. Nigeria National Census: Population Distribution by Sex, State, LGAs and Senatorial District: 2006 Census Priority Tables; National Population Commission (NPC): Abuja, Nigeria, 2006; Volume 3. Available online: http://www.population.gov.ng/index.php/publication/140-popn-distri-by-sex-state-jgas-and-senatorial-distr-2006 (accessed on 2 April 2015).
- WPR. Benin City Population 2023; World Population Review (WPR): Walnut, CA, USA, 2023. Available online: https://worldpopulationreview.com/world-cities/benin-city-population (accessed on 22 April 2023).
- Olowofeso, E.; Oyetunji, A.K. Assessing the Impact of Selected Macroeconomic Variables in the Determinants of Sustainable Residential Housing Prices in Lagos. Ethiop. J. Environ. Sci. Manag. 2016, 9, 405–411. [Google Scholar] [CrossRef]
- Onwuanyi, N.; Chima, P.E.; Oyetunji, A.K. Relationships and Potentials of Proximate Property Markets: The Case of Aba and Port Harcourt in Nigeria. Int. J. Soc. Sci. Manag. Res. 2022, 8, 38–57. Available online: https://iiardjournals.org/get/IJSSMR/VOL.%208%20NO.%202%202022/Relationships%20and%20Potentials%20of%20Proximate.pdf (accessed on 21 April 2023).
- Faremi, O.J.; Adenuga, O.; Ameh, O.J.; Zakariyyah, I.K.; Ajayi, O.O.; John, B.I.; Adegoriola, M. Sustainable Facilities Management For Smart Buildings: A Case Study Of The Heritage Place, Ikoyi Lagos. In Proceedings of the Africa Smart City Agenda, Lagos, Nigeria, 24–26 July 2018; Available online: https://api-ir.unilag.edu.ng/server/api/core/bitstreams/bbf99666-31c3-4e66-9b5b-03d9c907ad0e/content (accessed on 21 April 2023).
- Rokooei, S.; Karji, A. Exploring Construction Students’ Perceptions of Smart Buildings. Epic. Ser. Built Environ. 2021, 2, 284–292. Available online: https://login.easychair.org/publications/download/PDKX (accessed on 21 April 2023).
- Oyetunji, A.K.; Oluleye, I.B.; Olukolajo, M.A.; Chan, D.W.M. Is green good: Unveiling the latent benefits of sustainable housing delivery. Cities 2022, 129, 103809. [Google Scholar] [CrossRef]
- Olatunji, S.O.; Olawumi, T.O.; Aje, I.O. Rethinking partnering among quantity-surveying firms in Nigeria. J. Constr. Eng. Manag. 2017, 143, 05017018. [Google Scholar] [CrossRef]
- Adabre, M.A.; Chan, A.P.C. Critical success factors (CSFs) for sustainable affordable housing. Build. Environ. 2019, 156, 203–214. [Google Scholar] [CrossRef]
- Adabre, M.A.; Chan, A.P.C.; Darko, A.; Osei-Kyei, R.; Abidoye, R.; Adjei-Kumi, T. Critical barriers to sustainability attainment in affordable housing: International construction professionals’ perspective. J. Clean. Prod. 2020, 253, 119995. [Google Scholar] [CrossRef]
- Chan, A.P.C.; Darko, A.; Olanipekun, A.O.; Ameyaw, E. Critical barriers to green building technologies adoption in developing countries: The case of Ghana. J. Clean. Prod. 2018, 172, 1067–1079. [Google Scholar] [CrossRef]
- Olawumi, T.O.; Chan, D.W. An empirical survey of the perceived benefits of executing BIM and sustainability practices in the built environment. Constr. Innov. 2019, 19, 321–342. [Google Scholar] [CrossRef]
- George, D.; Mallery, P. SPSS for Windows Step by Step: A Simple Guide and Reference; Allyn & Bacon: Boston, MA, USA, 2003. [Google Scholar]
- Sijtsma, K. On the use, the misuse, and the very limited usefulness of Cronbach’s alpha. Psychometrika 2009, 74, 107–120. [Google Scholar] [CrossRef]
- Cronbach, L.J. Coefficient alpha and the internal structure of tests. Psychometrika 1951, 16, 297–334. [Google Scholar] [CrossRef]
- Robinson, J.P.; Shaver, P.R.; Wrightsman, L.S. Measures of Personality and Social Psychological Attitudes; Academic Press: Cambridge, MA, USA, 1991. [Google Scholar]
- Taber, K.S. The use of Cronbach’s alpha when developing and reporting research instruments in science education. Res. Sci. Educ. 2018, 48, 1273–1296. [Google Scholar] [CrossRef]
- Zhang, X. Critical success factors for public-private partnership in infrastructure development. J. Constr. Eng. Manag. 2005, 131, 3–14. [Google Scholar] [CrossRef]
- Aebischer, B.; Huser, A. Energy Analysis of the Future Life-House; First Report Presented on behalf of the Swiss Federal Office of Energy, Berne, December 2002. ETH’s Centre for Energy Policy and Economics (CEPE); the Energie Schweiz: Zurich, Switzerland, 2000; Available online: https://ethz.ch/content/dam/ethz/special-interest/mtec/cepe/cepe-dam/documents/people/baebischer/Aebischer_27_formated.pdf (accessed on 21 April 2023).
- Huser, A.; Aebischer, B. Energieanalyse FutureLife-Haus; Energie Schweiz, Swiss Federal Office of Energy, Berne, 2002 Final Report in German with English Abstract. 2002. Available online: https://ethz.ch/content/dam/ethz/special-interest/mtec/cepe/cepe-dam/documents/people/baebischer/Aebischer_Huser_sb_energieanalyse_futurelife.pdf (accessed on 21 April 2023).
- Lafontaine, J. Intelligent Building Concept; EMCS Engineering Inc.: Toronto, ON, Canada, 1999. [Google Scholar]
- Batov, I.E. The distinctive features of “smart” buildings. Procedia Eng. 2015, 111, 103–107. [Google Scholar] [CrossRef]
- To, W.M.; Lai, L.S.L.; Lam, K.H.; Chung, A.W.L. Perceived Importance of Smart and Sustainable Building Features from the Users’ Perspective. Smart Cities 2018, 1, 163–175. [Google Scholar] [CrossRef]
- El-Motasem, S.; Khodeir, L.M.; Eid, A.F. Comparative Analysis Between Smart Buildings Projects (SBP) in Egypt and Worldwide. Int. J. Eng. Res. Technol. 2018, 13, 5440–5450. Available online: https://www.ripublication.com/irph/ijert20/ijertv13n12_188.pdf (accessed on 16 June 2023).
- Olawumi, T.O.; Chan, D.W.; Saka, A.B.; Ekundayo, D.; Odeh, A. Are there any gains in green-tech adoption? Unearthing the beneficial outcomes of smart-sustainable practices in Nigeria and Hong Kong built environment. J. Clean. Prod. 2023, 410, 137280. [Google Scholar] [CrossRef]


Disclaimer/Publisher’s Note: The statements, opinions and data contained in all publications are solely those of the individual author(s) and contributor(s) and not of MDPI and/or the editor(s). MDPI and/or the editor(s) disclaim responsibility for any injury to people or property resulting from any ideas, methods, instructions or products referred to in the content. |
© 2023 by the authors. Licensee MDPI, Basel, Switzerland. This article is an open access article distributed under the terms and conditions of the Creative Commons Attribution (CC BY) license (https://creativecommons.org/licenses/by/4.0/).