Abstract
Leaked air from an aircraft cabin into its envelope walls through cracks can lead to a large amount of moisture condensation on inner shell skins and in insulation layers. The leaked-air rate is subject to the stack pressure difference and the geometry of the cracks. So far, the impacts of the crack sizes and positions, and the flight conditions on the resulting leaked-air rate have been unclear. This investigation adopts validated computational fluid dynamics (CFD) to model leaked flow, pressure, and temperature distribution in a single-aisle aircraft cabin. Impacts of the flight cruising altitude, crack size and position, and flow blocker on the leaked-air rate were examined. In addition, measurements were conducted in a reduced-scale cabin mockup in an environmental chamber to mimic flight conditions. Obtained test data were adopted to validate CFD modeling. Results reveal that a higher cruising altitude of a flight results in greater leaked-air rate from the cabin to the envelope walls due to the larger temperature difference. The smaller the crack size was, the lower the leaked-air rate. In addition, more cracks farther away from the neutral plane lead to a greater leaked-air rate. A flow blocker in the middle of the insulation layer reduced the leaked-air rate by 34.5%.
1. Introduction
Commercial aircraft are operated in an extreme external environment where the outside air temperature may be as low as −65 °C [1,2]. On flights, the internal cabin air temperature is commonly conditioned to range from 18.2 to 26.7 °C [3,4]. There is a huge temperature difference across aircraft envelope walls. The aircraft envelope wall consists of a shell, cavity, insulation layer, gap, and lining [5], as shown in Figure 1. The fiberglass insulation layer has low thermal conductivity and thus experiences large temperature differences in the cruising stage.
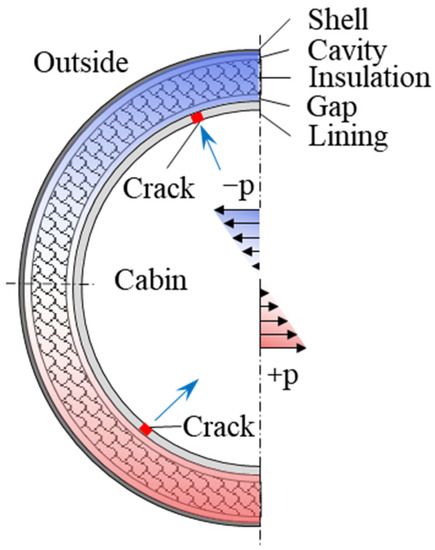
Figure 1.
Schematics of the envelope wall structure of aircraft.
Due to the temperature difference between the cold air trapped in the envelope wall and the warm cabin air, a buoyancy-induced pressure difference forms [6], as shown in Figure 1. Pressure difference drives the warm and humid air in the cabin to penetrate the wall through the cracks. There are many cracks at the joints of two lining sheets. Leaked air in the gap can permeate through porous insulation blanket layers to the outer cavity, and condense on the inner shell skins and in the insulation layer adjacent to the shell. Insulation blankets can acquire large amounts of moisture on a flight [7,8]. A Boeing 747 airplane could gain thousands of pounds of extra weight after a half year in service [9]. Twinjet aircraft can achieve a moisture weight of an average maximum of 680 kg, while the average maximum of trijet aircraft is 1089 kg [10]. The accumulated moisture in the insulation layer leads to many adverse consequences, such as corrosion, microbial growth, and thermal and sound insulation degradation [11].
There are limited studies on leaked air in the envelope wall of aircraft. A field investigation [12] on an in-service airplane found that the main source of moisture in envelope walls is human breath. The ice condensation rate varied with insulation materials [13]. Consequently, the quality of the insulation material is key to reducing moisture condensation [5]. Moisture condensation results from water vapor migration with airflow. The exchange airflow between the envelope wall and aircraft cabin is mainly due to stack pressure difference; during the ascending and descending stages of the flight the cabin, air pressurization, and depressurization could also induce flows into and out of the envelope walls [7]. Stack pressure on the aircraft is mainly subjected to temperature difference and leakage area [11]. The flow blocker in the envelope wall could effectively reduce the leaked-air rate [6].
The stack effect and air leakage have also been studied well in buildings. As early as 1973, air leakage due to stack pressure caused serious condensation in buildings in winter [14]. Stack pressure could also create airflows in building insulation envelopes, resulting in heat loss and condensation [15]. Experimental research on solar ventilation stacks revealed that airflow rate varied with thermal gradients [16]. In cold climate zones, the stack effect is typically stronger due to the larger temperature difference than that in other climate zones [17,18]. In addition to the temperature difference, leakage area is another key parameter affecting leakage air rate. The leaked-air rate through the external walls could be reduced by 67.9% if walls are taped by an external weather barrier [19]. Similarly, airtight doors could effectively reduce leakage air rate [17,20]. Furthermore, the location of a crack may impact the leaked-air rate. The airflow rate from the staircase into the lobby was reduced with story height from 600 kg/h at the bottom of the building to approximately 100 kg/h on the 20th floor [17].
The previous review reported that leaked air into the envelope walls of an aircraft is very harmful. Leaked-air rate is subjected to many parameters, such as temperature difference, crack size, and position. No study has systematically explored key parameters impacting leaked-air rate into aircraft envelope walls. We conducted a measurement test on stack pressure in a reduced-scale aircraft cabin mockup in a laboratory. Then, a validated CFD program was adopted to examine the impact of flight cruising altitude, crack size and position, and the flow blocker on stack pressure distribution, leaked-air rate, and temperature distribution in a single-aisle aircraft cabin.
2. Research Methods
This section addresses the CFD modeling method in terms of case design, boundary settings, numerical solution, and the experimental test to validate the CFD modeling.
2.1. CFD Modeling Cases and Boundary Conditions
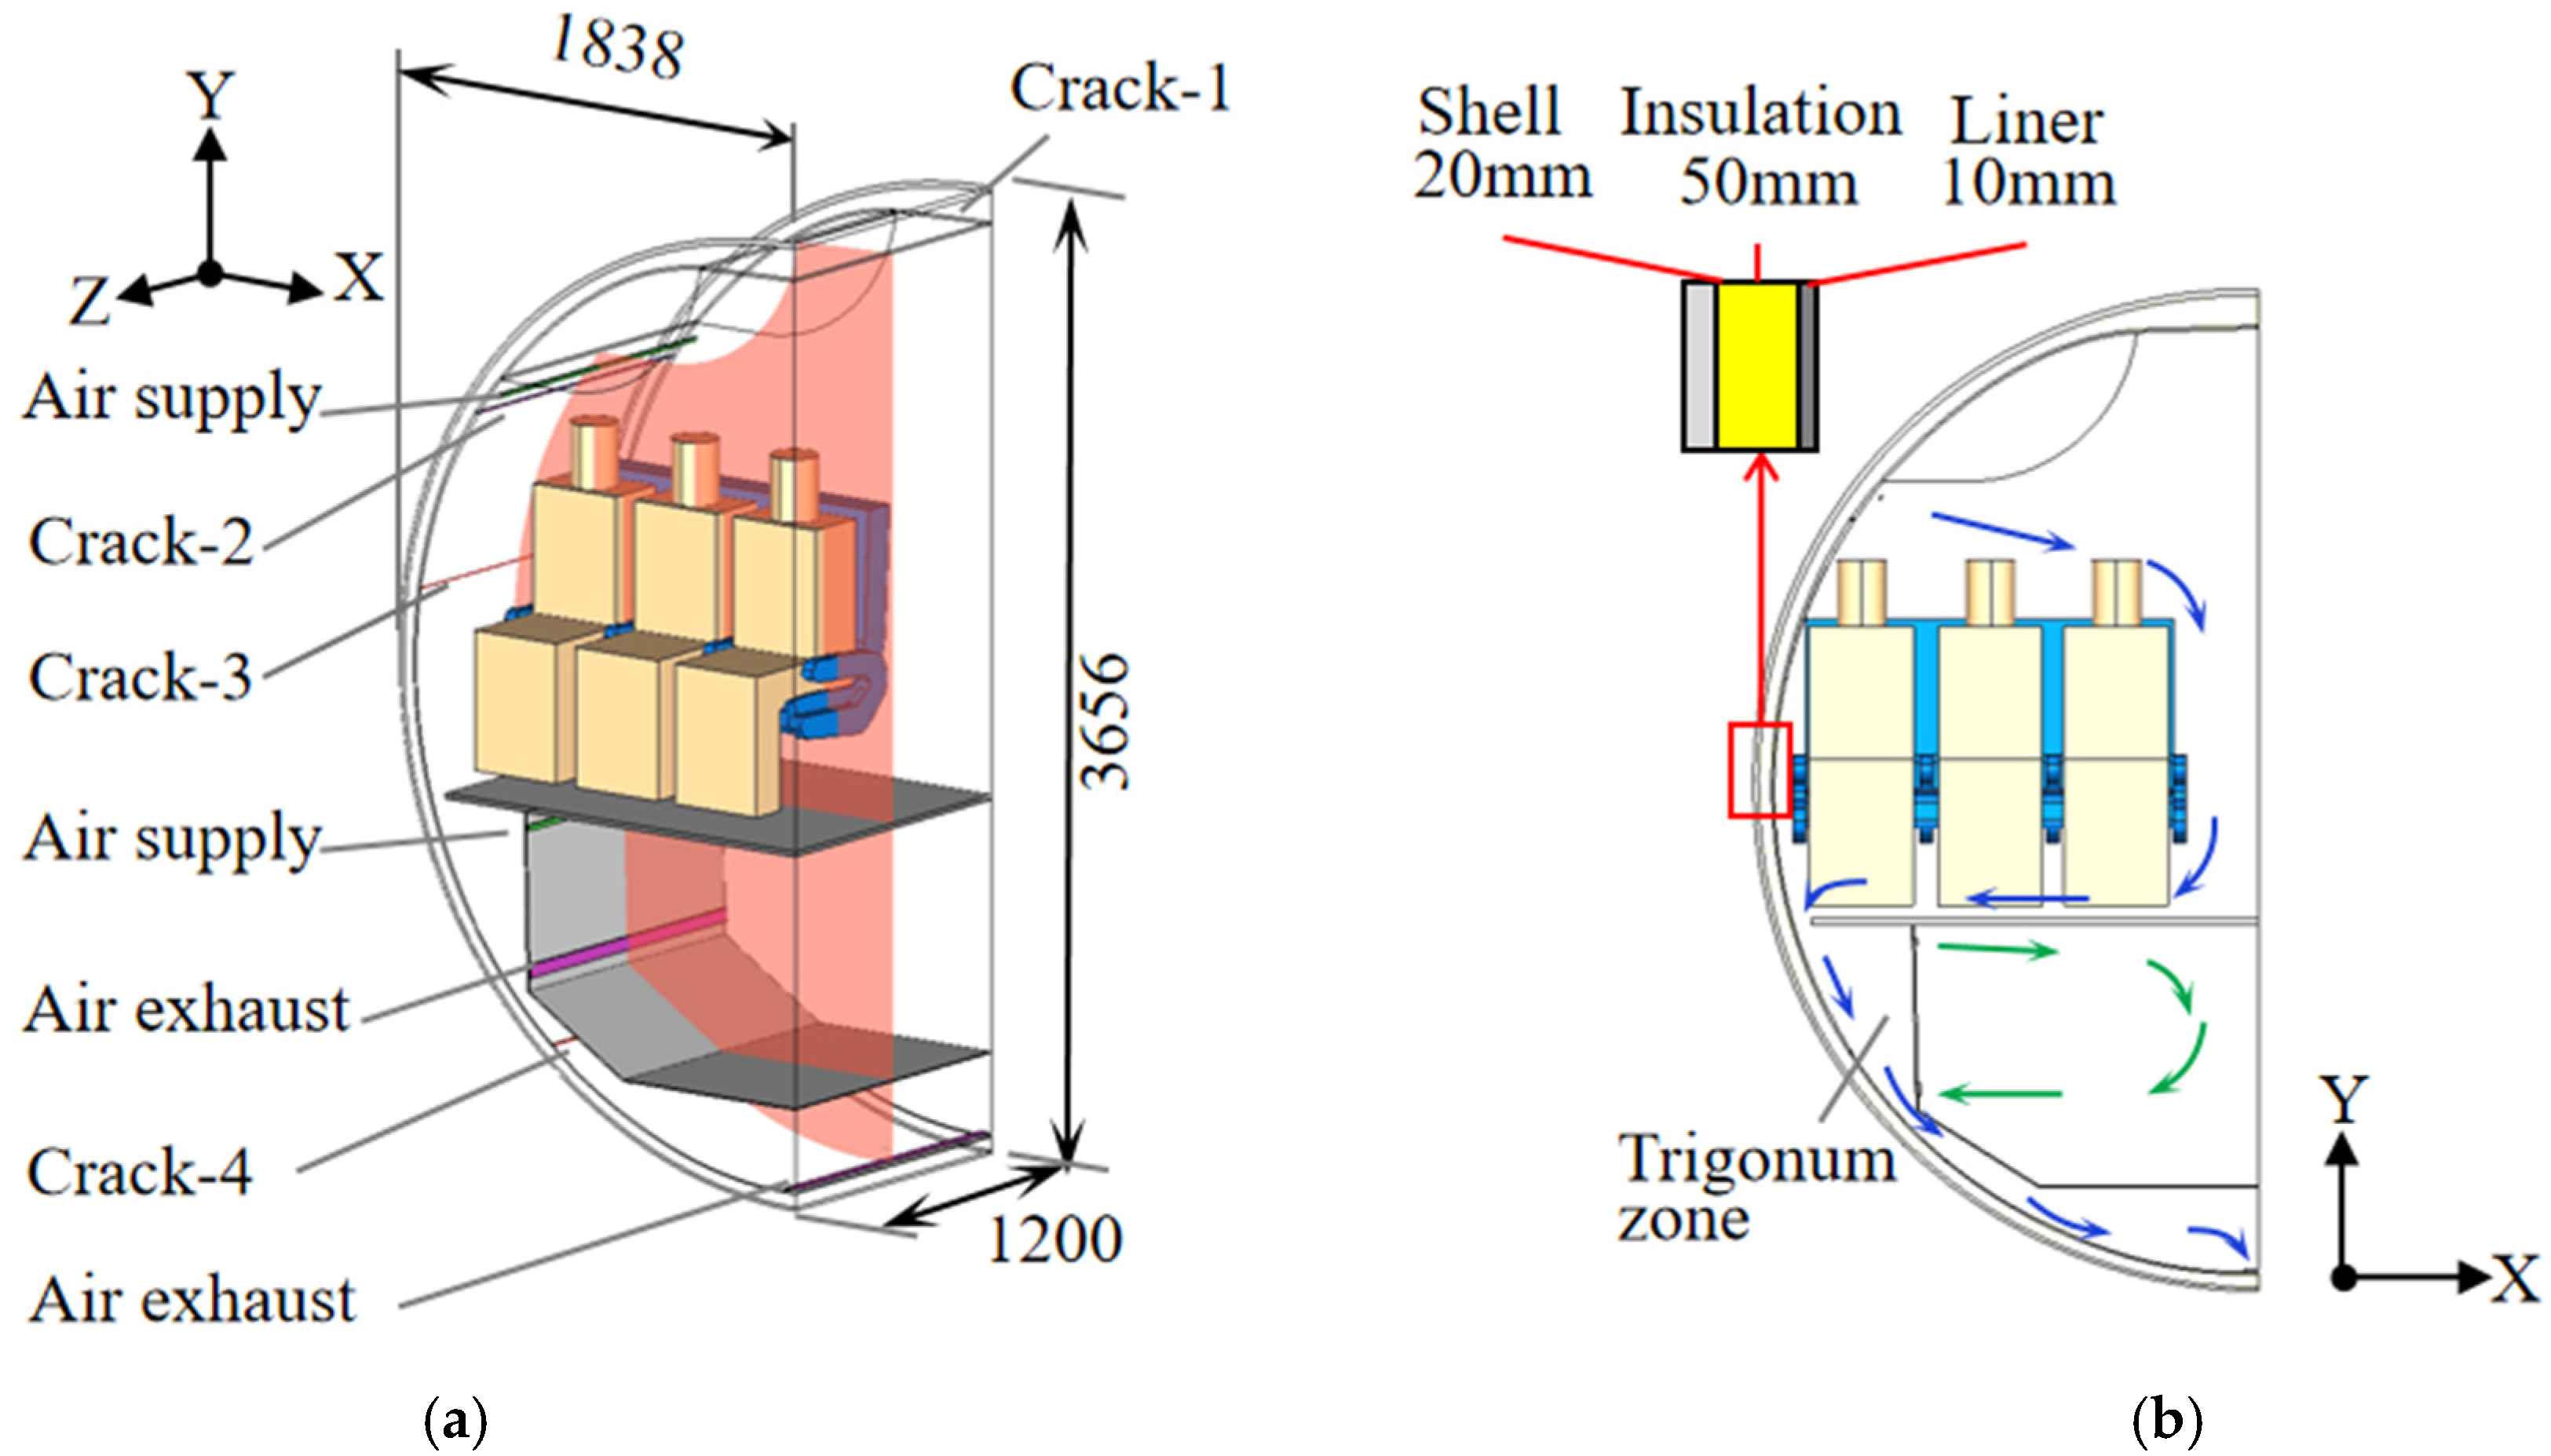
To investigate leaked air into aircraft envelope walls, the geometric model of half an aircraft cabin was established, as shown in Figure 2. The dimensions of the cabin were 1.834 (X) × 3.656 (Y) × 1.2 m (Z). The cabin contained only one three-passenger row of seats. The empty cargo cabin was also accounted for to investigate leaked air flow. The aircraft envelope wall consists of three layers: the outer shell layer with a thickness of 20 mm, the middle insulation layer with 50 mm thickness, and the inner lining sheet with 10 mm thickness. The cavity, insulation blankets, and gap were set into porous material as a whole for simplicity.
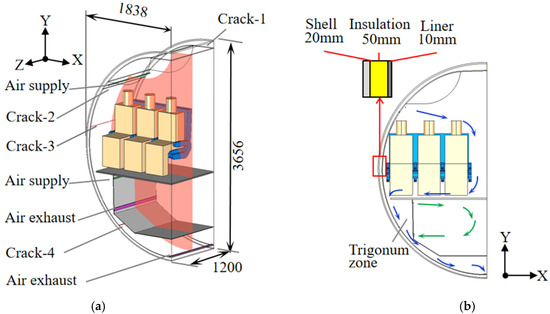
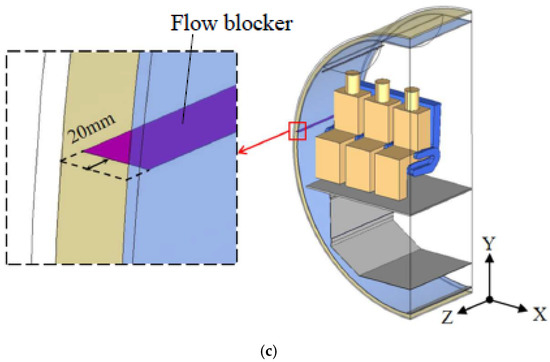
Figure 2.
Schematic diagram of half an aircraft cabin model for investigation: (a) 3D diagram, (b) 2D diagram and ventilation flow paths; (c) schematic diagram of flow blocker in Case 16.
Conditioned air was supplied into the passenger cabin from the air-supply inlets under the stowage bin, as shown in Figure 2b. The air-supply direction was downward with an angle of 30° from the horizontal. Air in the passenger cabin was extracted from the air exhaust near the floor. The exhausted air out of the passenger cabin first went into the trigonum zone and was then assumed to recirculate or dump to the outside at the bottom air exhaust. The width of the air-supply opening was 20 mm. The width of the bottom air exhaust opening was 100 mm. Total air supplied into the cabin was 108 m3/h, corresponding to an average ventilation rate of 10 L/s per person. A separate ventilation system was assumed to be used in the cargo compartment. Air was supplied horizontally in the upper part of the cargo and exhausted in the lower part.
Cracks on the lining are usually at the joints of two lining sheets, such as at the crown of the passenger cabin, the stowage bin, and near the window. We assumed that there were four cracks on the lining of the cabin at different heights, as shown in Figure 2a. Crack 1 was at the crown, Crack 2 was under the stowage bin, Crack 3 was at the lower edge of the window, and Crack 4 was below the cargo cabin. For simplicity, these cracks were assumed to span the whole fuselage. Air in the cabin could be exchanged with air in the envelope walls through these cracks, subject to pressure difference.
Table 1 summarizes the case design. A total of 12 cases were designed with varying flight cruising altitudes, crack sizes, crack numbers in use, and the presence of a flow blocker. Case 1 was the reference in which cruising altitude was set to 12 km from sea level. The equivalent crack size on the lining was approximately 1.65 square inches per person [6], which corresponded to 2.66 mm in crack width and 1.2 m in length. Therefore, crack size in the reference case was set to 2.66 mm. Cracks 1 and 4 were in use, while Cracks 2 and 3 were closed, and no flow blocker was adopted in Case 1. Cases 2 and 3 had different cruising altitudes, while the remaining parameters were unchanged as compared with Case 1. Cases 1, 4, and 5 were designed to study the influence of crack size on leaked-air rate. Cases 6 to 15 were designed to evaluate the effect of different cracks on leaked-air rate. In Cases 8 to 11, the width of each crack was 2.66 mm. In Cases 12 to 15, the total width of all cracks is 2.66 mm. The width of each crack was the total width divided by the number of cracks. In Case 16, a flow blocker was set at the middle height of insulation, i.e., the purple plate in Figure 2c, which increased flow resistance flowing through.

Table 1.
CFD modeling case design overview.
Table 2 summarizes the boundary conditions for Case 1. In the middle of the aircraft, the symmetric boundary condition was applied. The front and rear sections of the aircraft were set as adiabatic walls. Manikin skins were assigned with a constant surface temperature of 30 °C [21,22]. Air-supply speed into the passenger cabin at the air-supply opening was 1.25 m/s at 21 °C. Air-supply speed into the cargo cabin at the air-supply opening was much lower, at 0.236 m/s and 20 °C. The mixed boundary condition was set on the outer shell skins. Heat loss from the shell of an aircraft includes convective heat transfer with the outside air, and radiation heat transfer to the sky [21]. Corresponding set boundary conditions are convective heat transfer coefficient, free stream temperature, external radiation temperature, and external emissivity of the shell. Figure A1 shows the positions at which these boundary conditions’ parameters were set. Parameters used in CFD modeling for a flight at different cruising altitudes can be found in Table A1 in Appendix A. Free stream temperature in Table 2 was the recovery temperature of the external air after accounting for heat generation by friction.
Table 2.
Boundary conditions for Case 1 (reference).
2.2. Solution Settings and Numerical Procedure
The insulation layer was modeled as a porous medium [23] with Darcy’s law as follows:
where is the pressure drop, Pa; μ is the dynamic viscosity of air, Pa·m; is the velocity vector, m/s; and k is permeability, which can be calculated according to [24]:
where a is the fiber diameter, m; n is the porosity of the insulation material; and O is the infinitesimal term in higher order. According to the density of the insulation layer, the porosity of the insulation was set to 99.45%. Then, permeability k was calculated to be 2.465 × 10⁻⁷.
To save computing resources, only the geometry with a crack size of 5 mm was created. Porous media were further used with additional resistance to consider the remaining crack sizes. Additional resistance was based on the inertial loss model of the porous zone as follows:
where is the pressure drop, Pa; ρ is the density of air, kg/m3; v is velocity, m/s; and C is the inertial resistance factor that must be specified in CFD modeling. C was set according to the reverse regressed inference.
In numerical solutions, the steady-state RNG k–ε model [25] was adopted using commercial CFD software ANSYS Fluent (version 19.0) [26]. The geometric model, as shown in Figure 2, was created with commercial CFD preprocessing software ICEM CFD (version 19.0). Hexahedral meshes were created in the shell, insulation layer, and lining. Tetrahedral grid meshes were created in the cabin. The total grid cell number was 2.42 million. Governing equations for flow and heat transfer can be cast into the general scalar format as follows:
where is the air density, is a scalar variable, t is time, is the component of velocity in three directions in the Cartesian coordinate system, is position (, ), is the effective diffusion coefficient, and is the source term. By varying , the above equation can represent continuity, momentum, energy, and turbulence equations.
To accurately model heat transfer in the insulation layer, energy transport in both solid and fluid domains was coupled for simulation. The aircraft shell and lining layer were set to be a solid domain. The insulation layer, gap, and cavity were treated as the same porous medium. Both flow and heat transfer were solved in the fluid domain, while only heat conduction was solved through the solid domain. The physical properties of thermal insulation, lining, shell, and air are shown in Table 3.
Table 3.
Physical properties of aircraft walls.
The governing transport equations were solved by means of the finite volume method. Pressure–velocity coupling equations were solved by the semi-implicit method for the pressure-linked equations (SIMPLE) algorithm. The discretization scheme for momentum, turbulence, and energy was the second-order upwind type. To better capture buoyancy flow, the pressure staggering option (PRESTO) scheme was employed for pressure interpolation. The ideal gas model was used to consider the large temperature difference inside and outside the cabin. Continuity and momentum equations were thought to reach convergence when the ratio of the total mass gain and loss on all boundaries to the overall mass gain in the aircraft was less than 1.0 × 10⁻³. The convergence ratio threshold for energy was 1.0 × 10⁻⁶.
2.3. Experiment Test and CFD Modeling Validation
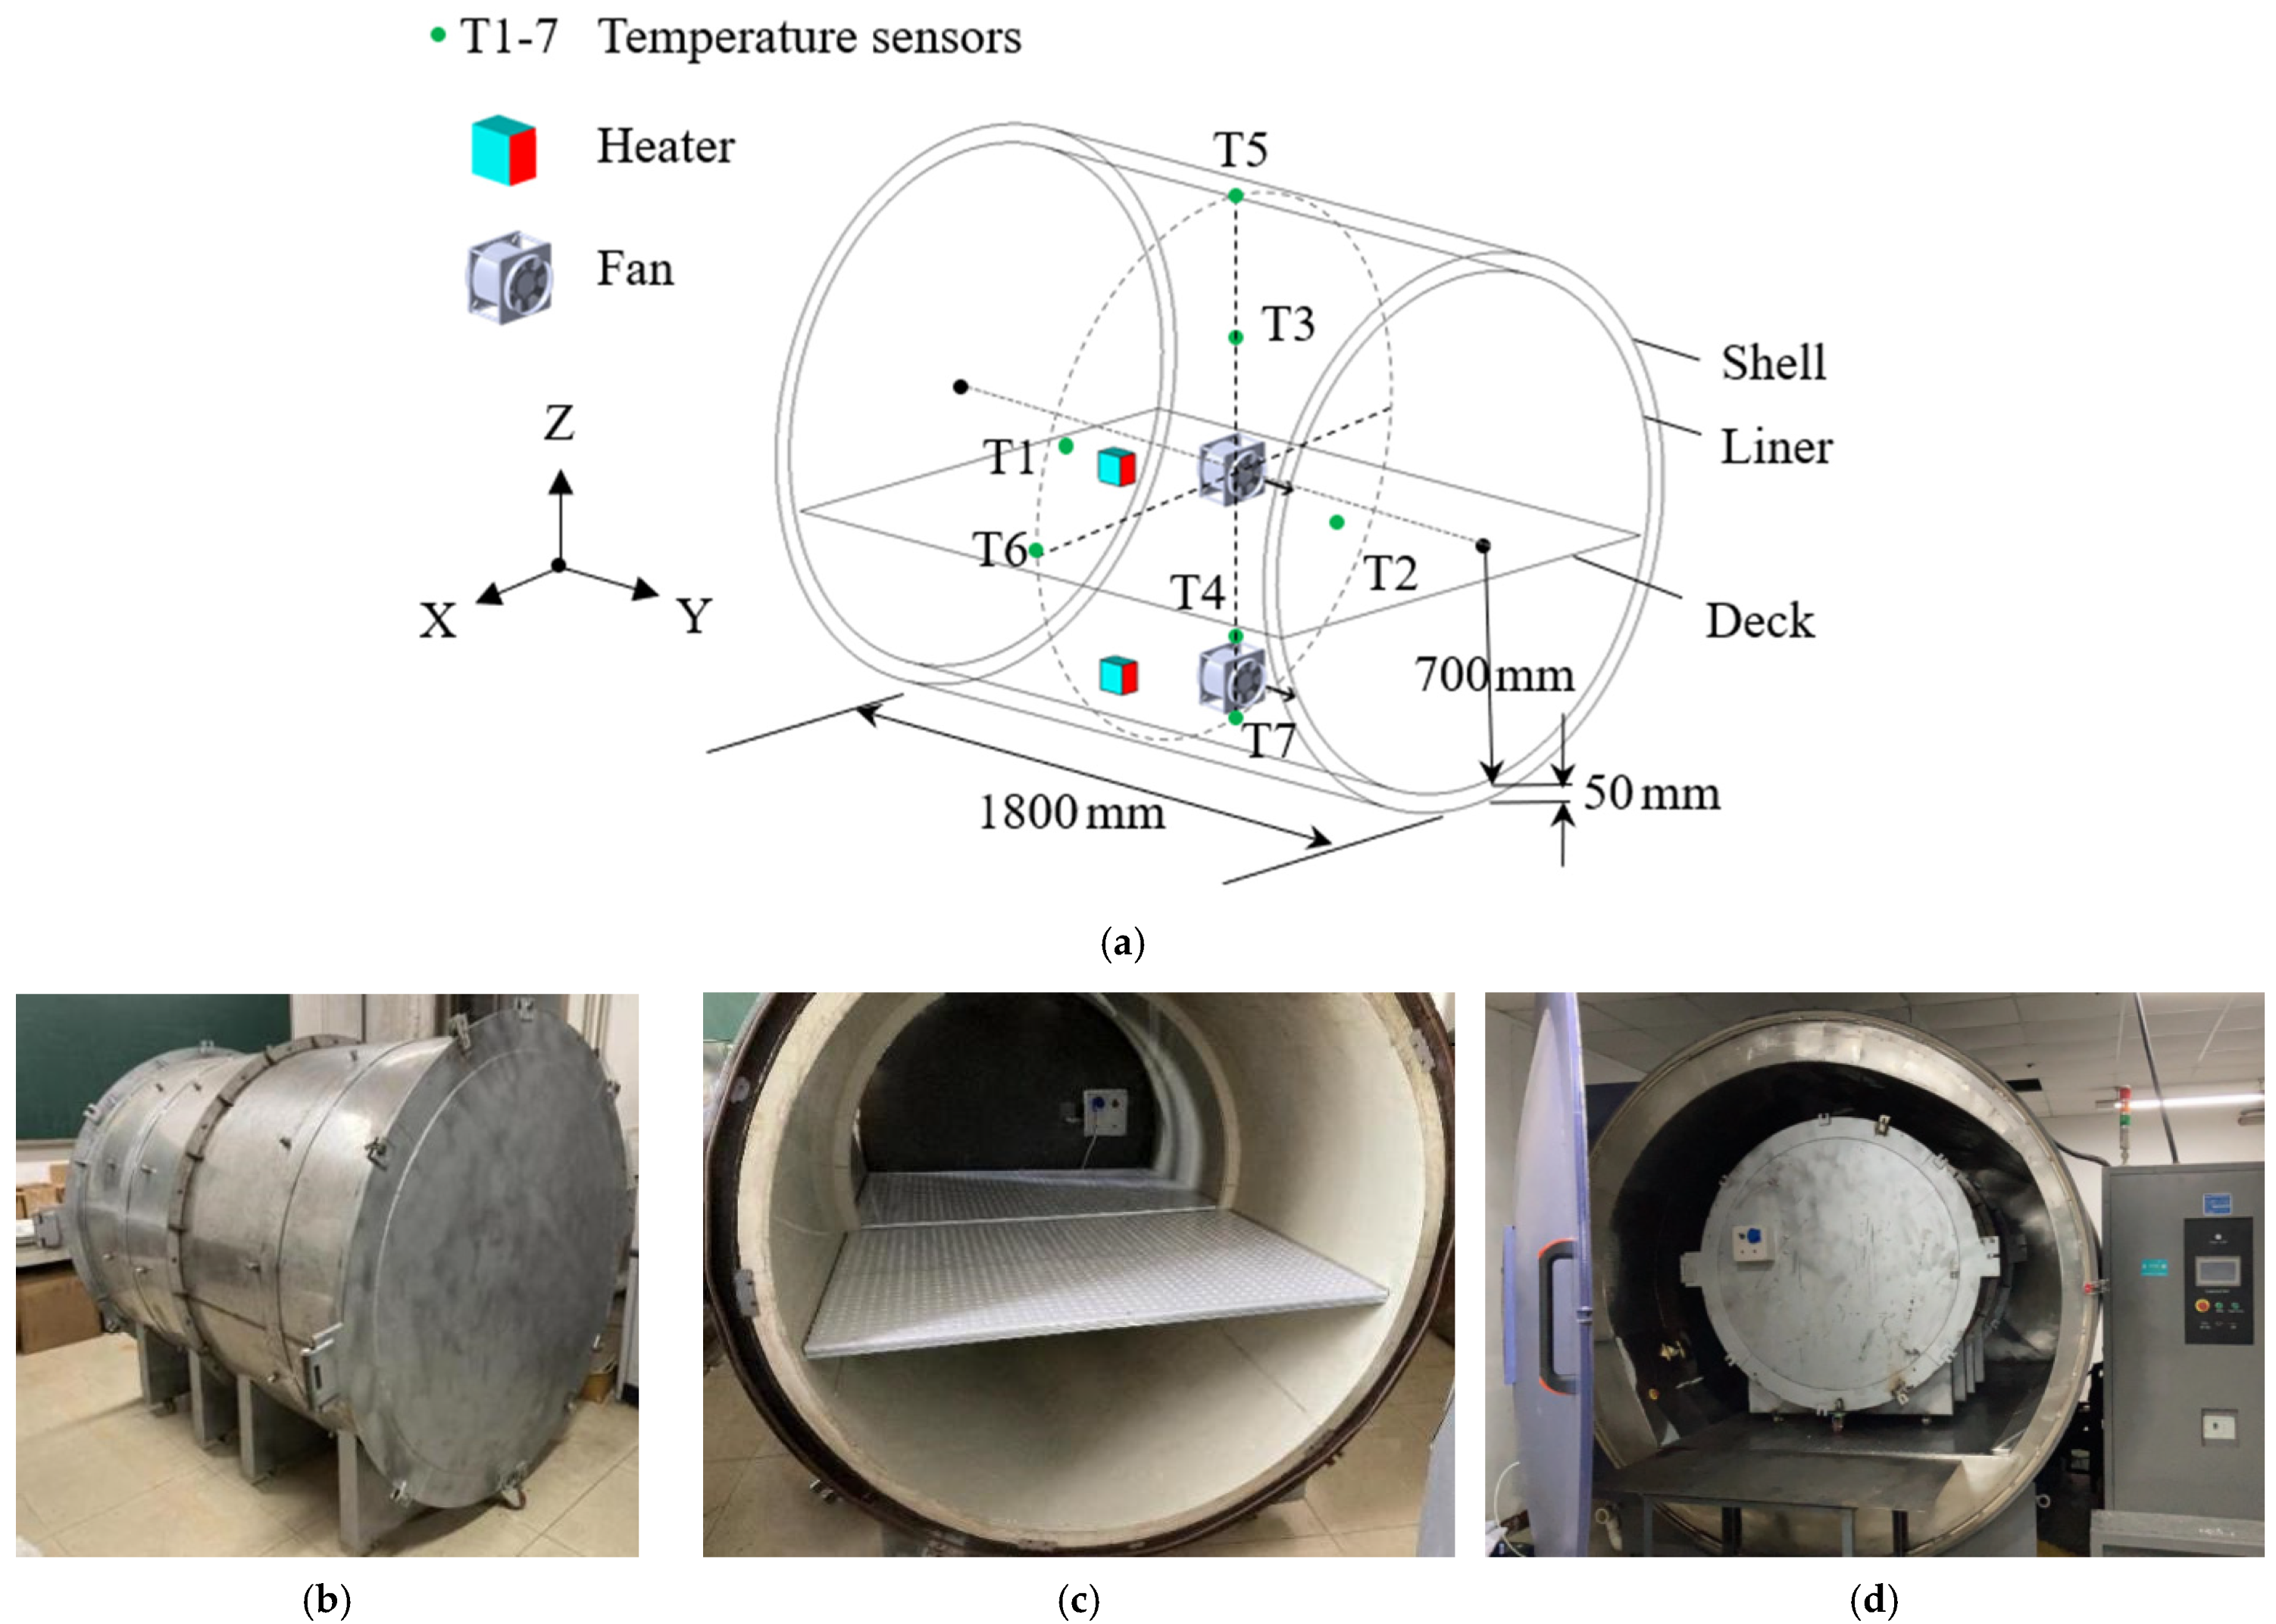
To validate CFD modeling, a measurement test was conducted in a laboratory using a 1:2.5 reduced-scale mockup of an aircraft cabin section, as shown in Figure 3. The cabin section consisted of two cylindrical shells. The outer shell was composed of stainless steel, and had a diameter of 1.5 m and thickness of 0.002 m. The inner shell was composed of polypropylene, and had a diameter of 1.4 m and thickness of 0.005 m. The inner shell surface was similar to the lining sheet on aircraft. There was an air channel with a thickness of 0.05 m between inner and outer shells to simulate the insulation layer of the aircraft. Cabin end faces were composed of stainless steel with a thickness of 0.005 m. The foamed polyurethane with a thickness of 0.05 m was attached to the inner end faces to provide insulation. Inside the cabin, a 7 cm thick perforated board by polypropylene divided the cabin space into an upper and a lower part to simulate the passenger cabin and cargo compartment, respectively, as shown in Figure 3c. Two heaters at 220 W were placed in the upper and the lower cabins, respectively. The heaters maintained the internal air at around 20 °C. Each heater was blown by a fan at a speed of 9 m/s to mix the inner air. The whole cabin mockup was placed in an environmental chamber conditioned to −20 °C, as shown in Figure 3d, to mimic similar temperature conditions to those during flight.
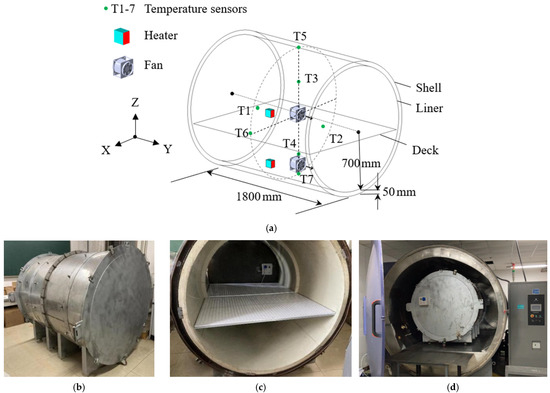
Figure 3.
Reduced-scale aircraft-cabin mockup for model validation: (a) schematics, (b) cabin mockup, (c) inside view of cabin mockup, (d) cabin mockup inside an environmental chamber.
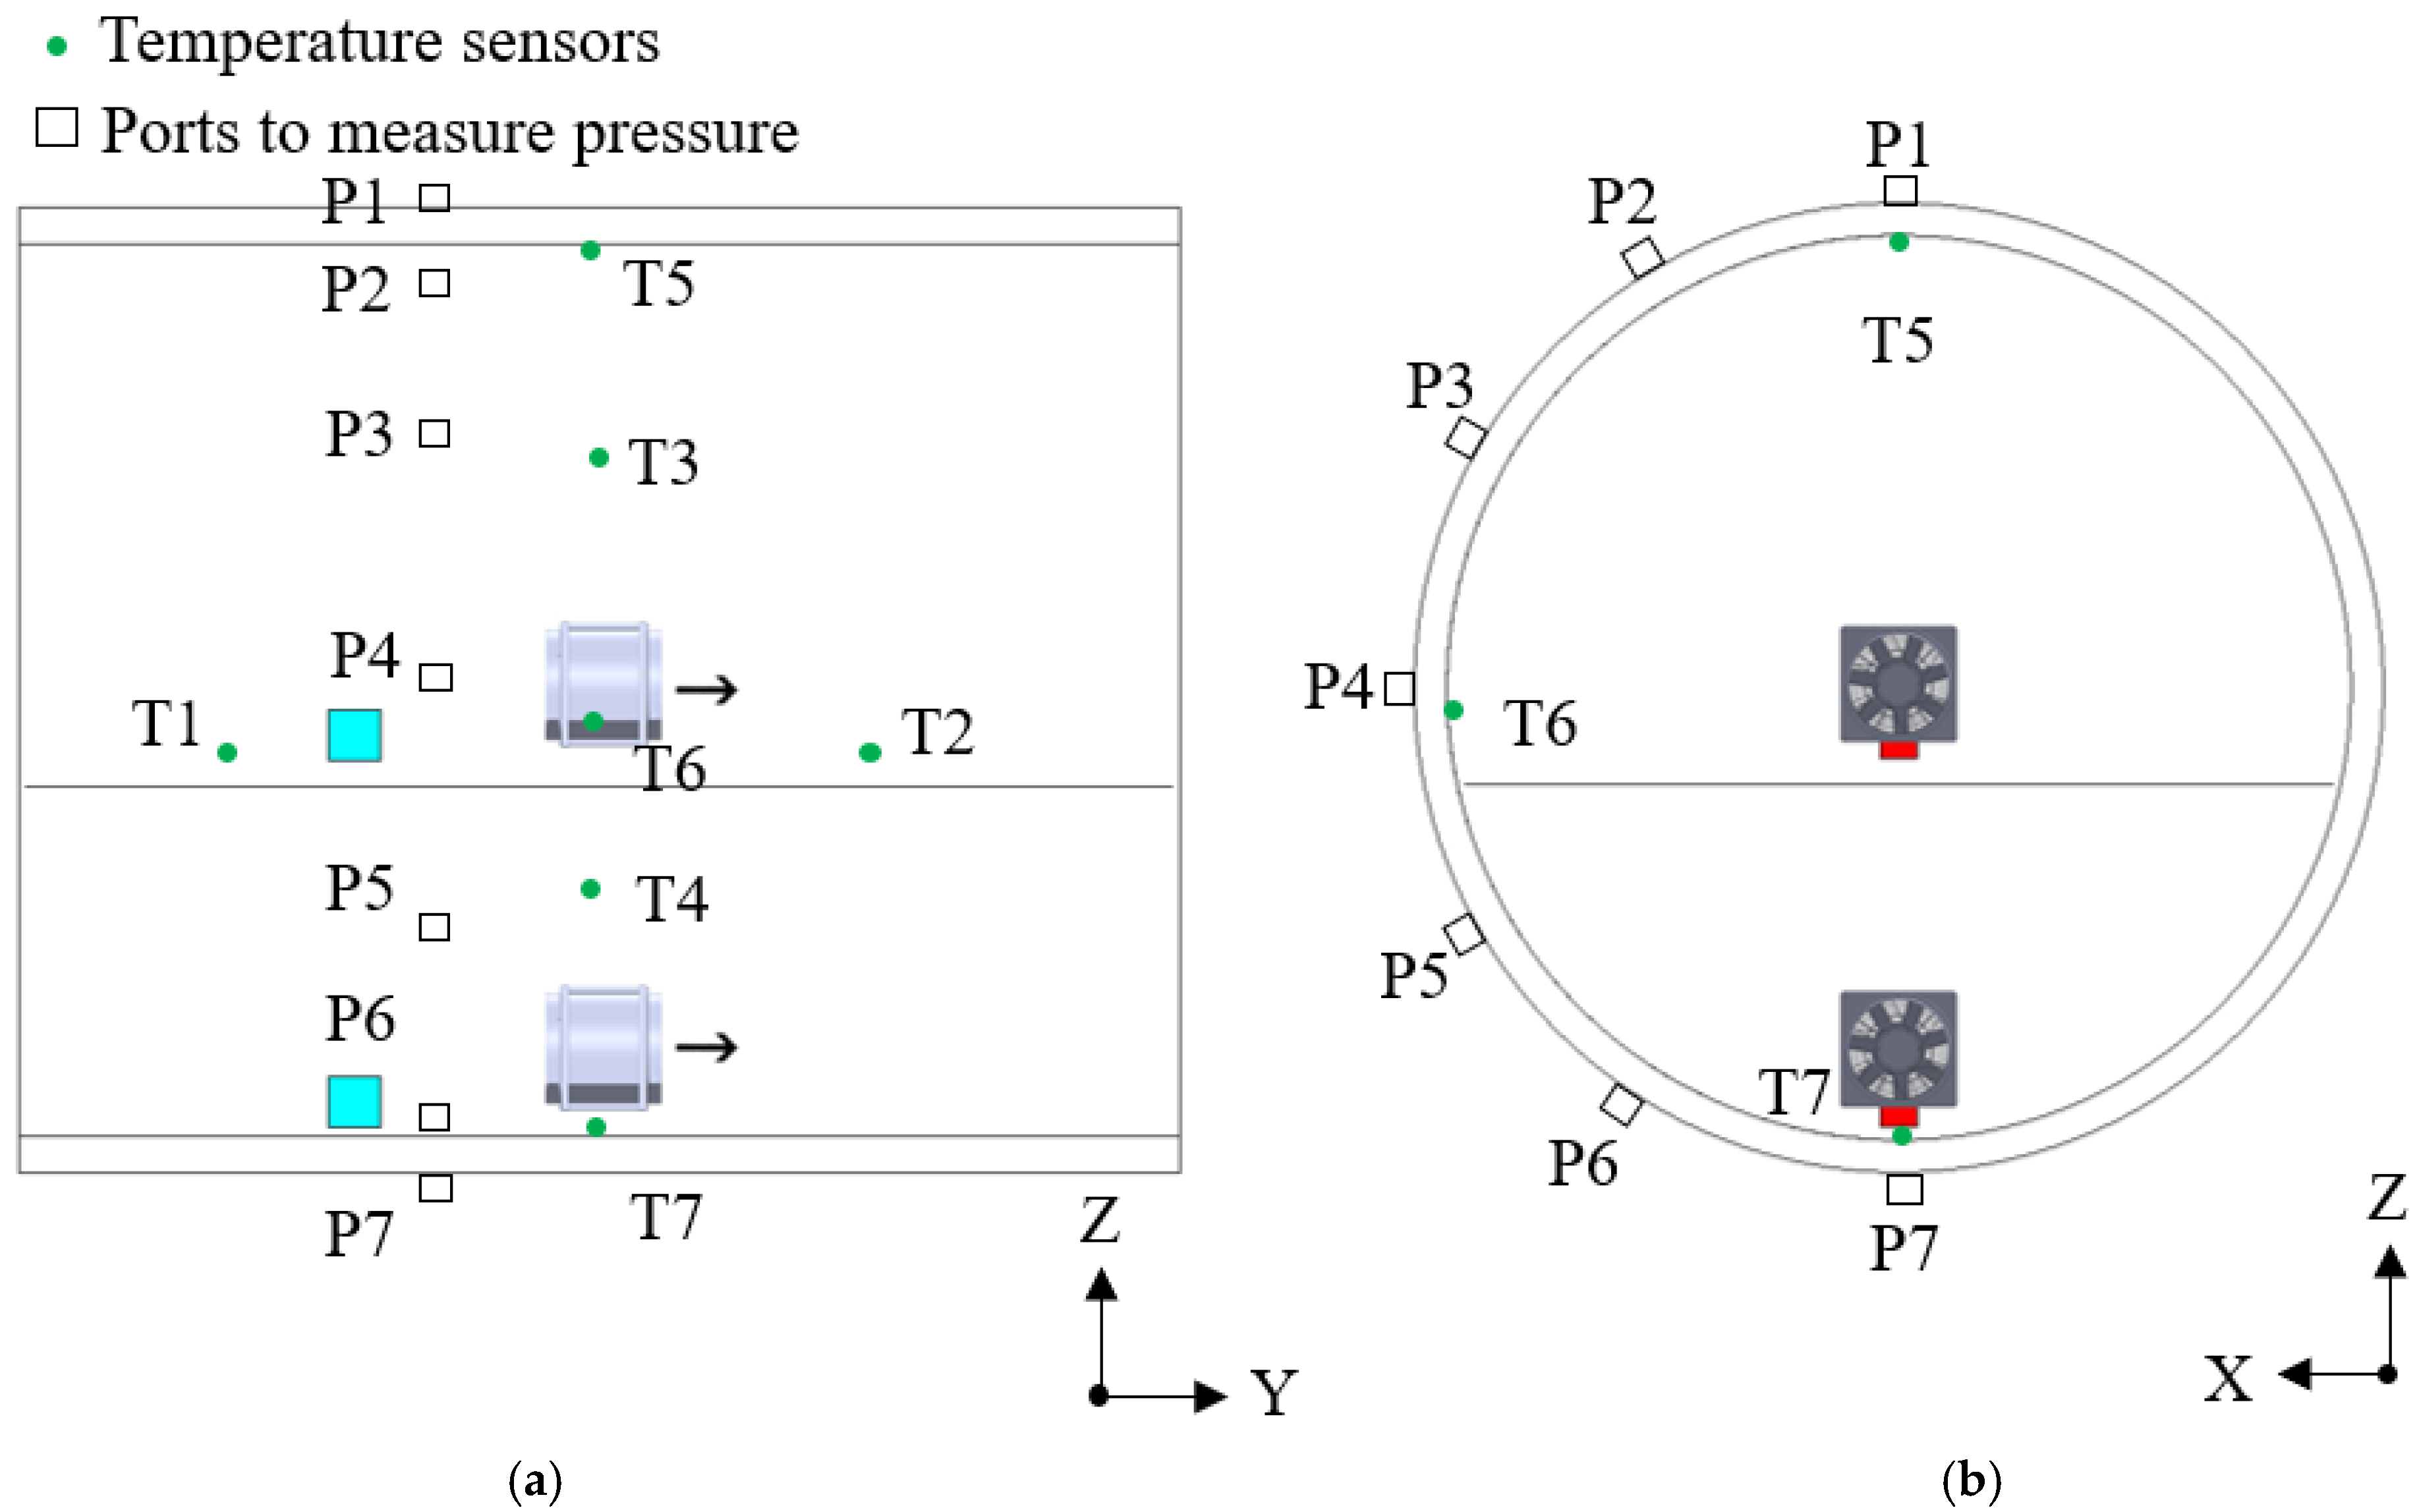
The pressure difference at Ports P1 to P6 against P7 along the circumference of the mockup, as shown in Figure 4, was measured for each port. A precision micromanometer (type: 8715; TSI Incorporated, Shoreview, Minnesota 55126 USA) was used to measure pressure. The resolution of pressure measurement was 0.001 Pa with an accuracy of ±2% reading ±0.025 Pa. Temperatures were measured at T1 to T7 as shown in Figure 3a and Figure 4 by precision sensors (type: PTU300; VAISALA OYJ, Vantaa Finland). T1 to T4 sensed air temperature, while T5 to T7 measured wall surface temperature. The range of temperature measurement was −40 to 80 °C with an accuracy of ±0.2 °C. The boundary conditions of experimental tests can be found in Figure A2 in Appendix A.
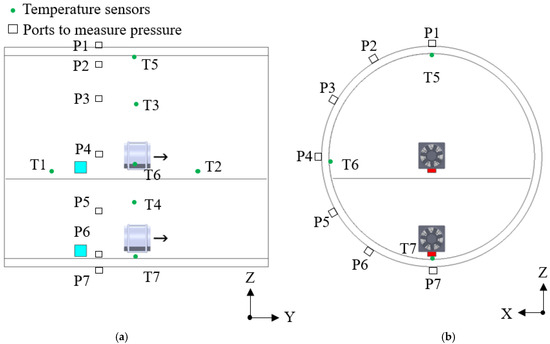
Figure 4.
Schematics of temperature and pressure measurement locations: (a) longitudinal sectional view; (b) front cross-sectional view.
The CFD model adopted similar coupled modeling for the fluid and solid domains. Outer shell skin temperatures are specified in Table A2 in Appendix A. Tetrahedral grid cells were generated in the solution domain. The total grid cell number was 2.48 million, with a minimal grid cell size of 1.5 cm at the heater surface, and a maximal grid cell size of 7 cm in the internal space. Numerical settings and criteria to judge numerical convergence were the same as those described in Section 2.2.
3. Results
3.1. CFD Validation
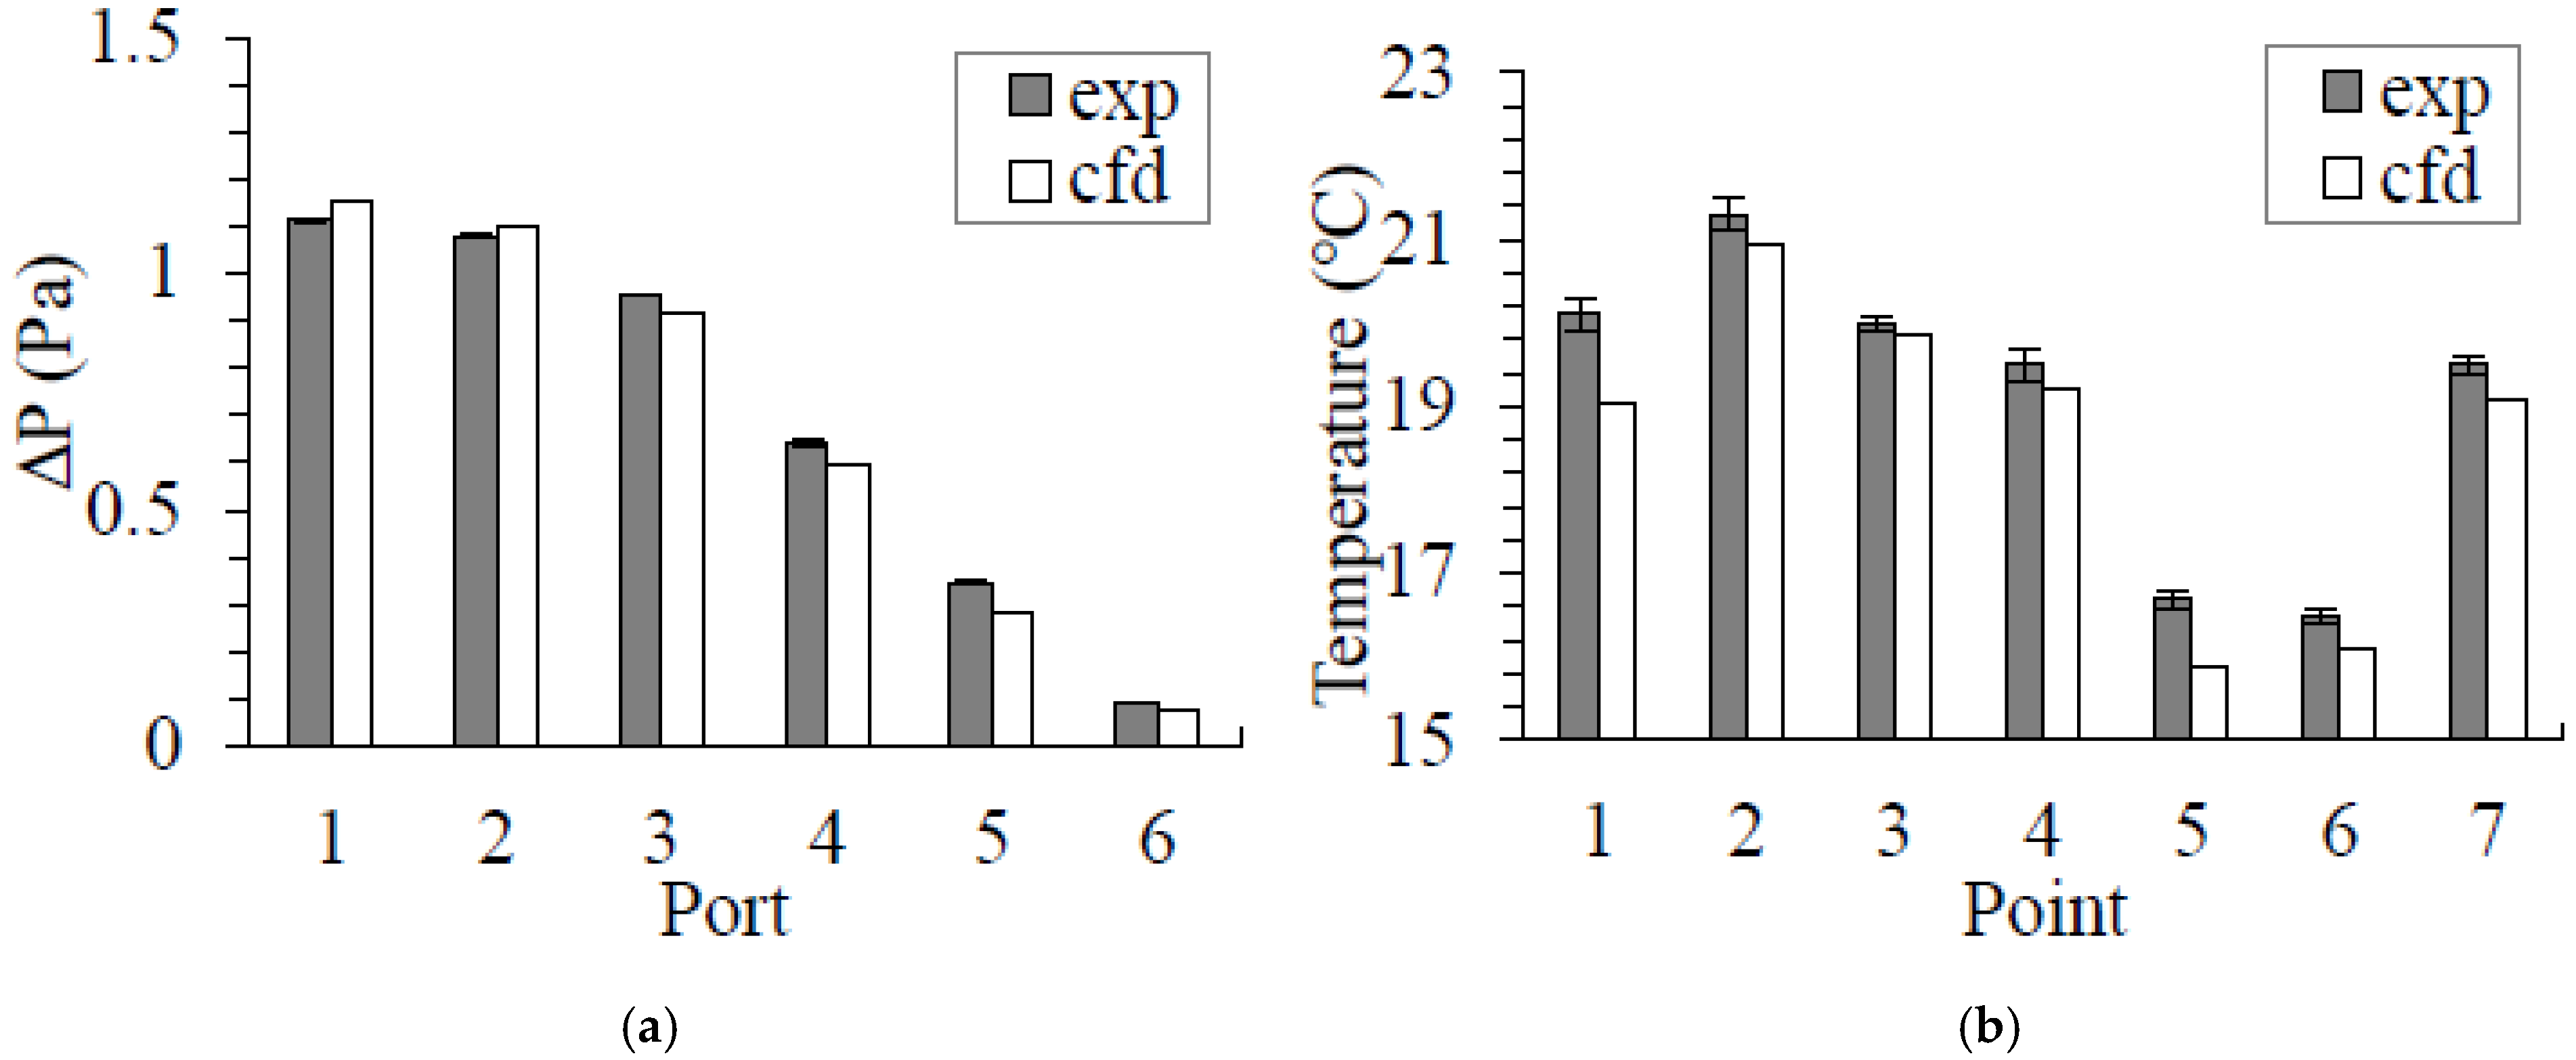
Figure 5 compares the simulated and measured pressure differences and temperatures at different measuring locations. Error bars are standard deviations in three repetitive measurements. The maximal pressure difference was between P1 and P7, and amounted to 1.15 Pa. Minimal pressure difference was between P6 and P7. CFD slightly overpredicted pressure differences at P1 and P2, but slightly underpredicted pressure differences at the remaining ports. The average relative discrepancy between CFD and measurement was 8.84%. Figure 5b presents the temperature comparison. CFD generally slightly underpredicted the temperatures. The maximal deviation in temperature was at Point 1 with a discrepancy of 1.04 °C. CFD thus provided results in excellent agreement with measurements, which validated the accuracy of the CFD modeling.
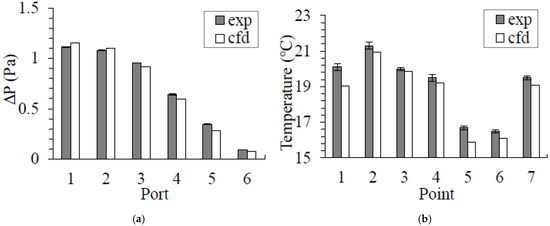
Figure 5.
Comparison of CFD modeling results with measurement data: (a) pressure differences between Ports 1 to 6 with Port 7; (b) temperatures.
3.2. Reference Case (Case 1)
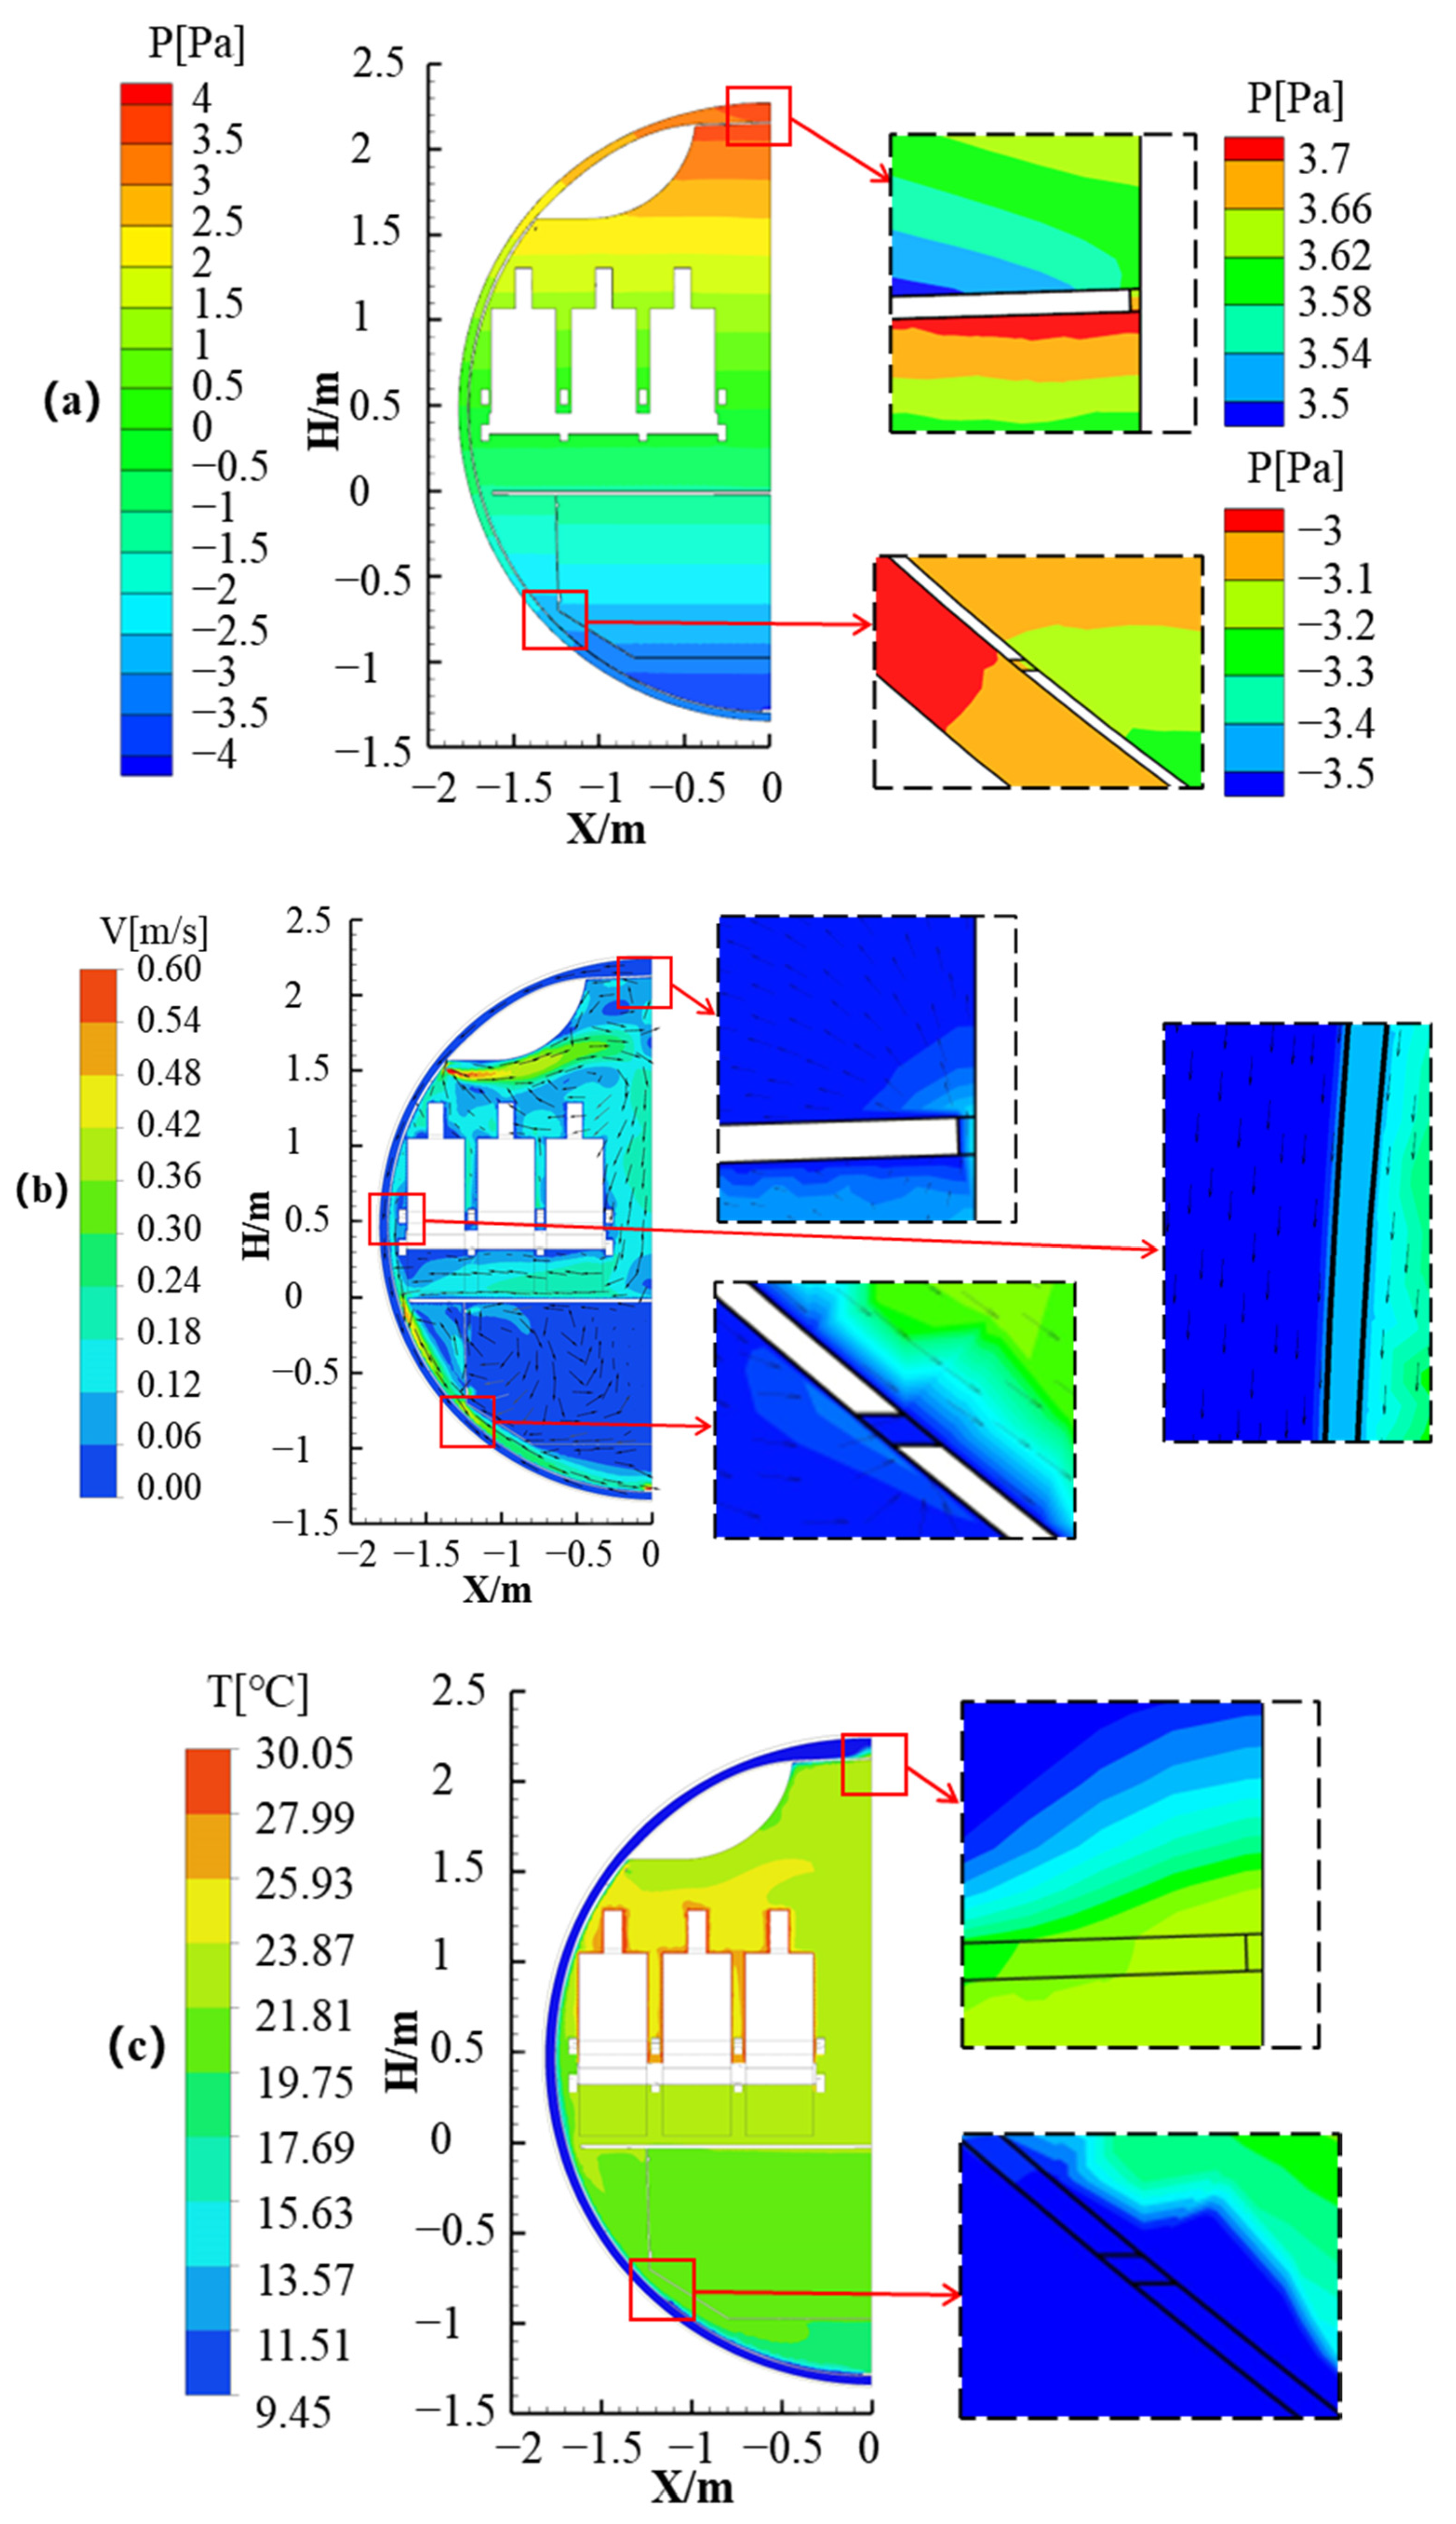
Figure 6a shows pressure distribution in the cross-section across manikins. Positive pressure was maintained in the passenger cabin, while negative pressure was in the cargo cabin. The pressure difference between the top and bottom of the insulation layers was approximately 8 Pa. There was a pressure drop of approximately 0.2 Pa through Crack 1 on the ceiling, which drove the cabin air to penetrate into the insulation layer, as shown in Figure 6b. Airflow from the air-supply inlet of the passenger cabin swept the ceiling and then went down in the aisle. A large vortex in the cabin was formed with relatively low speed in the respiratory zone of the passengers seated in the middle and aisle seats. Air in the insulation layer mainly went down due to the pressure difference, as shown in Figure 6b. Some part of the air went out of the insulation layer through Crack 4, and the other part of the air went down further and was recirculated. The face-averaged speed of the air through the cracks was approximately 0.15 m/s, corresponding to an infiltration rate per unit length of the crack at 0.757 L/(m·s). Figure 6c shows the temperature distribution in the same cross-section. The temperature in the passenger cabin was about 24 °C, and around 20 °C in the cargo cabin. The whole insulation layer had a lower temperature than 10 °C.
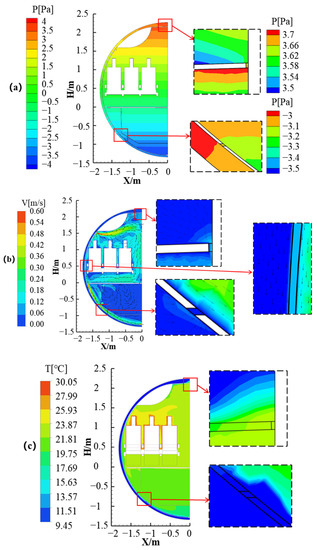
Figure 6.
Distribution of air pressure, velocity, and temperature in cross-section of Case 1: (a) pressure, (b) velocity, (c) temperature.
3.3. Impact of Cruising Altitudes
Figure 7 shows the comparison of the leaked-air rate through Crack 1 at different cruising altitudes of a flight, i.e., results of Cases 1 to 3. The leaked-air rate at cruising altitudes of 12, 10, and 8 km was 0.757, 0.529, and 0.340 L/(m·s), respectively. The leaked-air rate increased with cruising altitude. The leaked-air rate at a cruising altitude of 12 km was more than twice that at 8 km. As shown in Table A1 in the Appendix A, the recovery temperature at 12 km was −37.3 °C, while it was −5.6 °C at 8 km. Outside air temperature decreased with altitude. Due to a larger temperature difference at a higher flight altitude, the resulting stack pressure difference was also larger, as shown in Figure 8.
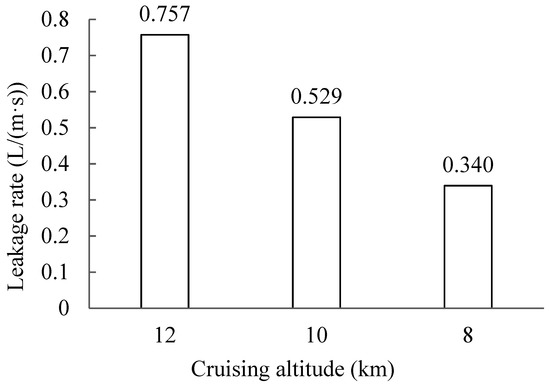
Figure 7.
Comparison of leakage rate at different cruising altitudes.

Figure 8.
Temperature and pressure distribution under different cruising altitudes of a flight: (a) temperature distribution for a section of the envelope wall, (b) pressure distribution surrounding Crack 1 on the ceiling.
The relationship between leaked-air rate and pressure difference could be expressed as:
where Q was the leaked-air rate, m3/s; Cd is the discharge coefficient; ELA is the equivalent leakage area, m2; ρ is air density, kg/m3; and dP is pressure difference, Pa. Stack pressure could be calculated by:
where P1 is cabin air pressure, Pa; T1 is cabin air temperature, K; T2 is insulation layer air temperature, K; g is gravity acceleration, m/s2; is the crack’s height from the neutral level, m; and R is the gas constant, 287 m2/(s2·K).
By combining and reorganizing Equations (5) and (6), the leaked-air rate could be expressed as [6]:
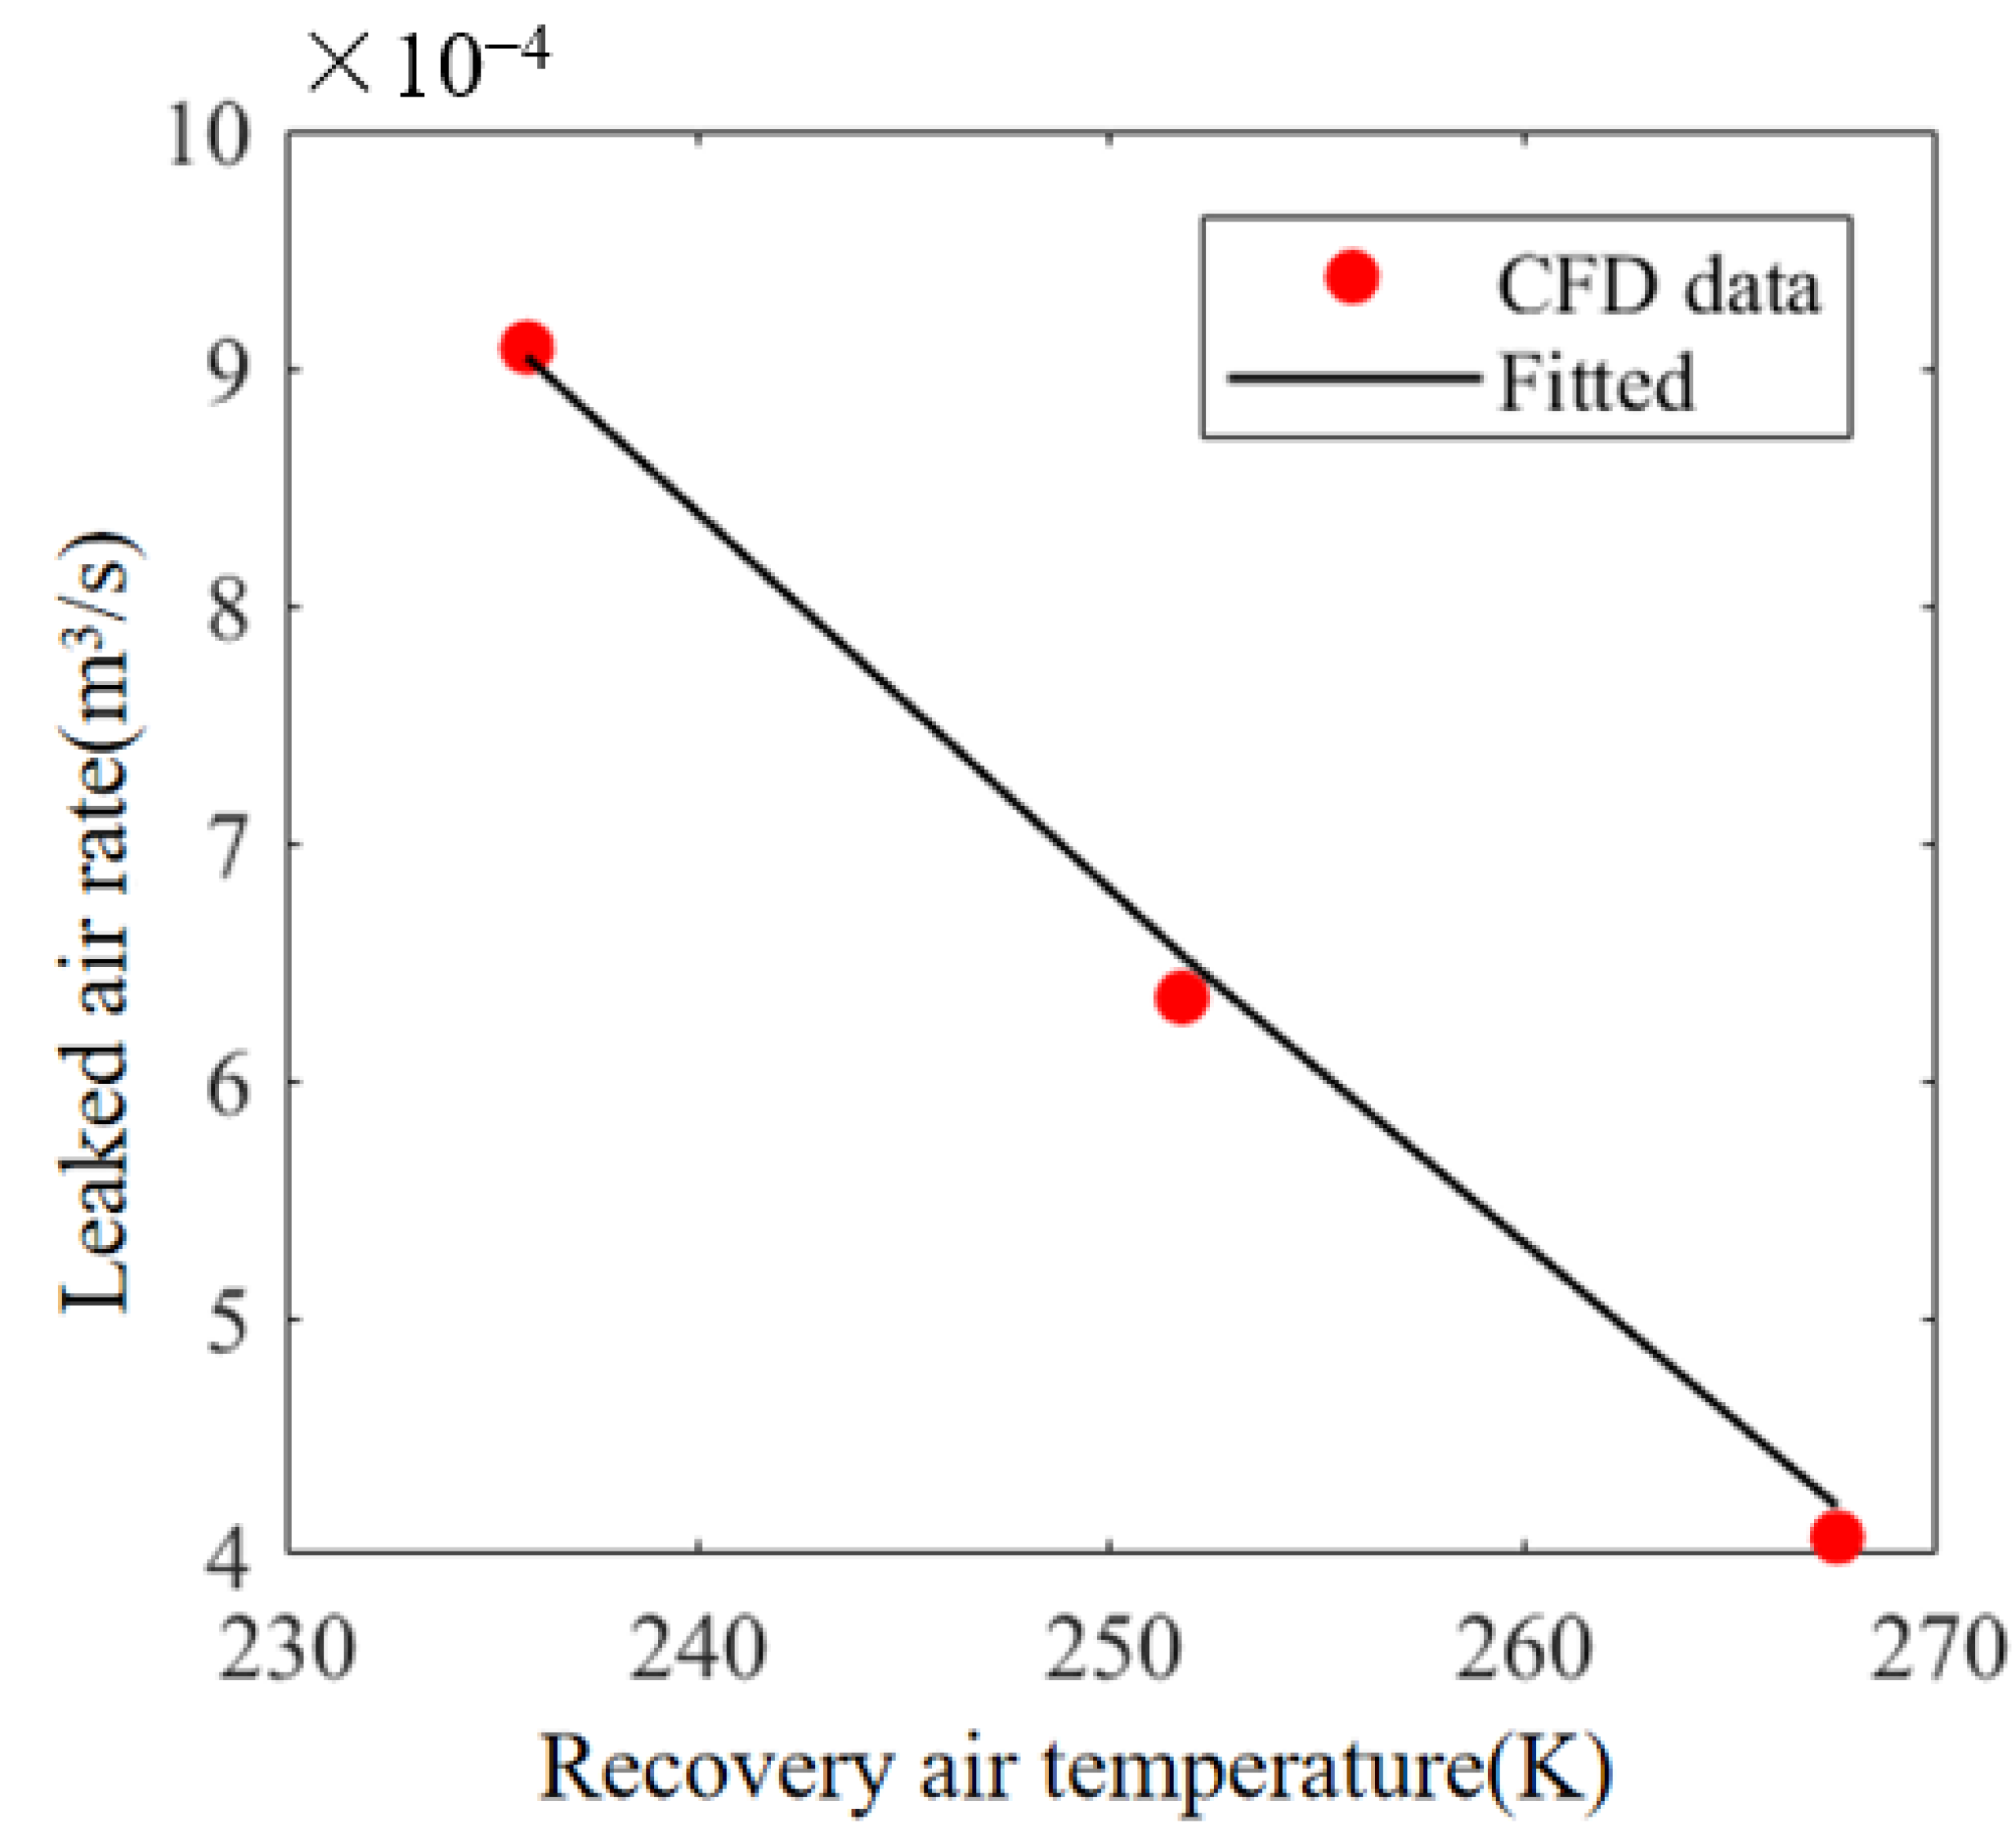
By using the least-squares fitting, Cd and n could be obtained from the measurement data. Supposing that the cabin air temperature was 24 °C and the equivalent leakage area was 0.006 m2, Cd was 0.0168, and n was 0.896. The fitted curve is shown in Figure A3 in the Appendix A.
3.4. Impact of Crack Size
Figure 9 shows the leaked-air rate varying with crack size when comparing Cases 1, 4, and 5. The smaller the crack size was, the lower the leaked-air rate was. However, there was only minimal difference in leaked-air rate between crack sizes 5 and 2.66 mm. The leaked-air rate for 1 mm was less than half of those for 2.66 and 5 mm. The resistance of leakage flow increased with the decrease in crack size. Figure 10 presents pressure distribution with different crack sizes. Pressure distribution in the cabin and around cracks was similar for crack sizes of 5 and 2.66 mm. The pressure inside the insulation layer, on the other hand, was greatly reduced with a crack size of 1 mm. Pressure distribution was consistent with the presented leaked-air rate.

Figure 9.
Comparison of leakage rate with different crack sizes.
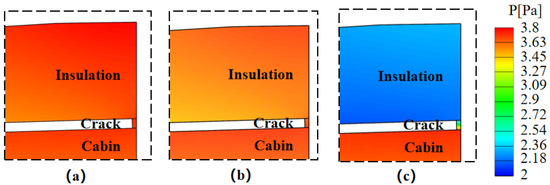
Figure 10.
Pressure distribution near Crack 1 with different crack sizes: (a) 5 mm, (b) 2.66 mm, (c) 1 mm.
3.5. Impact of Crack Location
Figure 11 presents leaked-air rates when different cracks were used when comparing Cases 1 and 6 to 15. The horizontal coordinate represents crack indices. For example, ‘1 + 2 + 3’ means that Cracks 1–3 were used with Crack 4, and ‘3’ means that Cracks 3 and 4 were used. Figure 11a shows that the total leaked-air rates for Cases 1, 8, 9, 10, 11, 6, and 7 were 0.810, 0.800, 0.781, 0.771, 0.761, 0.711, and 0.681 L/(m·s), respectively. The more the cracks in use were, the greater the total leaked-air rate into the insulation layer was. This was due to a greater effective leakage area in Equation (6). If Cracks 1 to 3 were in use in Case 8, reverse flow would result at Crack 3 because Crack 3 was below neutral height in this case. Three cracks in use in Cases 1, 6, and 7, and two cracks in use in Cases 9–11 revealed that a higher crack position resulted in a slightly greater leaked-air rate because the farther away from the neutral height they were, the greater the resulting stack pressure difference and thus the greater the leaked-air rate was.
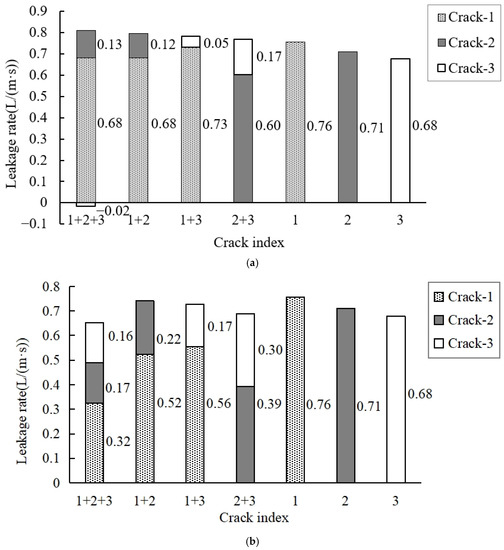
Figure 11.
Leaked-air rate when different cracks were in use: (a) each crack with a width of 2.66 mm; (b) the total width of all cracks equaled 2.66 mm.
Figure 11b shows that the total leaked-air rates for Cases 1, 12, 13, 14, 15, 6, and 7 were 0.652, 0.740, 0.726, 0.689, 0.757, 0.711, 0.681 L/(m·s), respectively. If the same total width for all cracks in use was maintained, the leaked-air rate decreased with the number of cracks. In the cases of two cracks in use, the higher a crack was located, the greater the leaked-air rate was because a higher crack corresponded to greater stack pressure with a greater distance from the neutral plane. The above results were consistent with the prediction based on Equation (7).
3.6. Impact of Flow Blocker
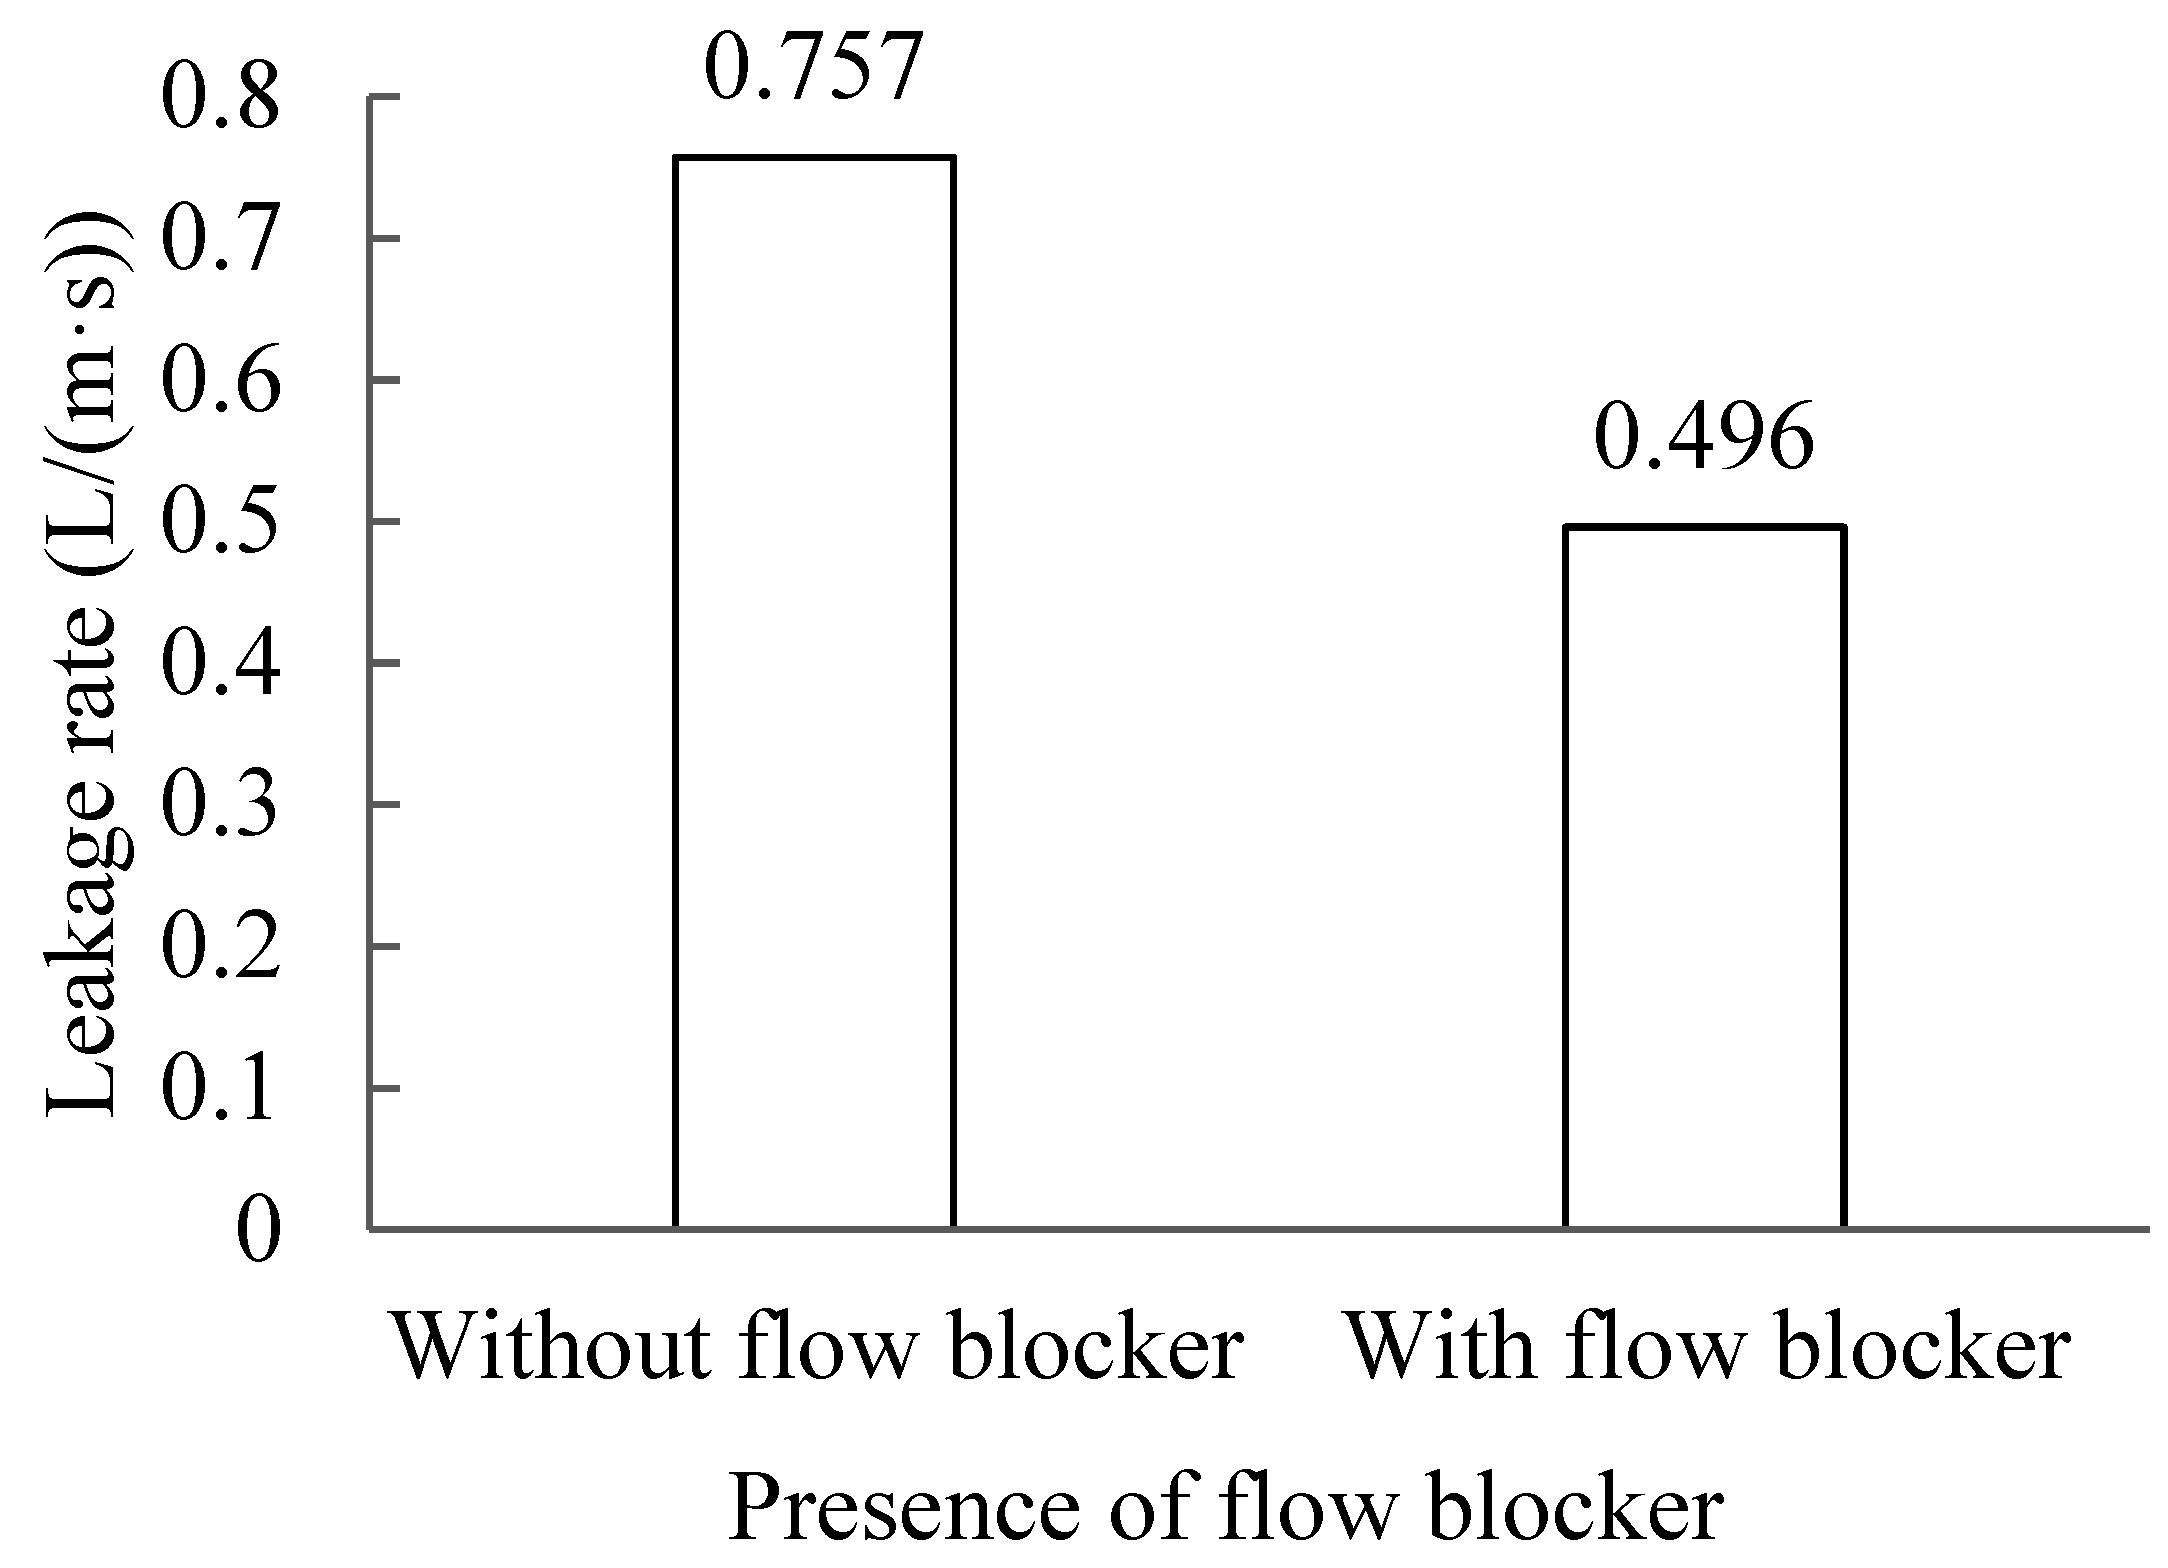
Figure 12 presents the leaked-air rate with and without the flow blocker, i.e., a comparison between Cases 1 and 16. The leaked-air rate without the flow blocker was 0.757 L/(m·s), while it was 0.496 L/(m·s) with the flow blocker. Placing a flow blocker in the middle of the insulation layer reduced the leaked-air rate by 34.5% because the flow blocker increased flow resistance in the insulation layer, as shown in Figure 13. There was a significant pressure drop across the flow blocker, which effectively minimized the leaked-air rate.

Figure 12.
Impact of flow blocker on the leaked-air rate.
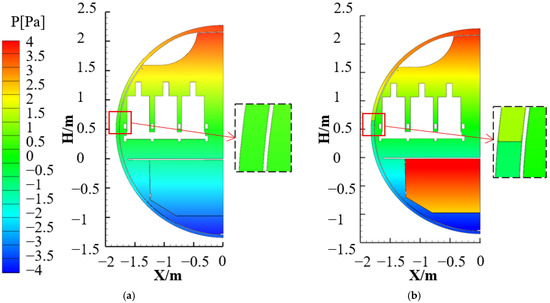
Figure 13.
Pressure distribution (a) without and (b) with a flow blocker.
4. Discussion
This investigation has some limitations. The cabin mockup for the measurements contained multiple electric wires to power heaters, fans, and signal wires to connect with temperature sensors. The wires somewhat interrupted measurements and were not accounted for in the modeling for simplicity. Temperature probes had a certain volume that might have hindered accurately sensing skin surface temperatures. To reduce computing resources, the geometric model of the aircraft cabin was simplified. Further investigation could adopt a more realistic geometry for more details if provided with more advanced computing facilities.
In this study, the flow blocker in the middle height of the passenger cabin was investigated, which was quite effective in reducing the leaked-air rate. There were several optional locations to place the flow blockers, such as at a higher or a lower position. To further reduce the leaked-air rate, one may also adopt multiple flow blockers. However, the flow blocker has weight, which is also a concern for utilization. The impact of flow-blocker positions and numbers, and the trade-off with the initial investment and the imposed weight are also worth studying in the future. Condensation could also be minimized by pressurizing dry air into the insulation envelope relative to the cabin, according to some studies [6,11].
This paper did not model detailed flow via cracks, but instead assigned flow resistance to represent cracks. The most accurate method to consider cracks was the reproduction of geometric details and modeling of the exact flows. However, it would require tremendous effort to create geometry and need many computing resources. Further study could evaluate the accuracy of the simplified modeling method used in this research.
5. Conclusions
This investigation adopted CFD to model leaked flow, pressure, and temperature distribution for an aircraft cabin and envelope walls. The impacts of flight cruising altitude, crack size and position, and flow blocker on the leaked-air rate were examined. Based on the obtained results, the following conclusions were drawn:
- A higher flight cruising altitude resulted in a greater leaked-air rate from the cabin to the envelope walls due to the larger temperature difference; thus, there was greater stack pressure at a higher altitude. The leaked-air rate at a cruising altitude of 12 km from the sea level was more than twice that at 8 km.
- The smaller the crack width was, the lower the leaked-air rate was. The dependence of the leaked-air rate on crack width was very strong if crack width was smaller than 2.66 mm. The leaked-air rate for a width of 1 mm was less than half of those for crack widths of 2.66 and 5 mm.
- More cracks farther away from the neutral height resulted in a greater leaked-air rate. More cracks would comprise a larger effective leakage area. A crack farther away from the neutral height corresponded to a larger stack pressure difference.
- Placing a flow blocker in the envelope wall could effectively reduce the leaked-air rate. A flow blocker in the middle of the insulation layer reduced the leaked-air rate by 34.5%.
Author Contributions
Conceptualization, T.Z.; methodology, T.Z. and S.L.; software, J.D.; validation, J.D.; investigation, J.D.; writing—original draft preparation, J.D.; writing—review and editing, T.Z. and S.L.; visualization, J.D.; project administration, T.Z. All authors have read and agreed to the published version of the manuscript.
Funding
This research received no external funding.
Institutional Review Board Statement
Not applicable.
Informed Consent Statement
Not applicable.
Data Availability Statement
Not applicable.
Conflicts of Interest
The authors declare that they have no known competing financial interests or personal relationships that could have appeared to influence the work reported in this paper.
Appendix A
Table A1.
Major parameters used in CFD modeling for flight at different cruising altitudes.
Table A1.
Major parameters used in CFD modeling for flight at different cruising altitudes.
| Cruising altitude from sea level (km) | 12 | 10 | 8 |
| Recovery temperature TAW (°C) | −37.30 | −21.44 | −5.58 |
| Convective heat transfer coefficient h (W/(m2·K)) | 113.19 | 149.95 | 183.99 |
| Sky radiant temperature Tsky (°C) | −121 | −107 | −93 |
| External emissivity (ε) | 0.92 | 0.92 | 0.92 |

Figure A1.
Modeling strategies.
Figure A1.
Modeling strategies.
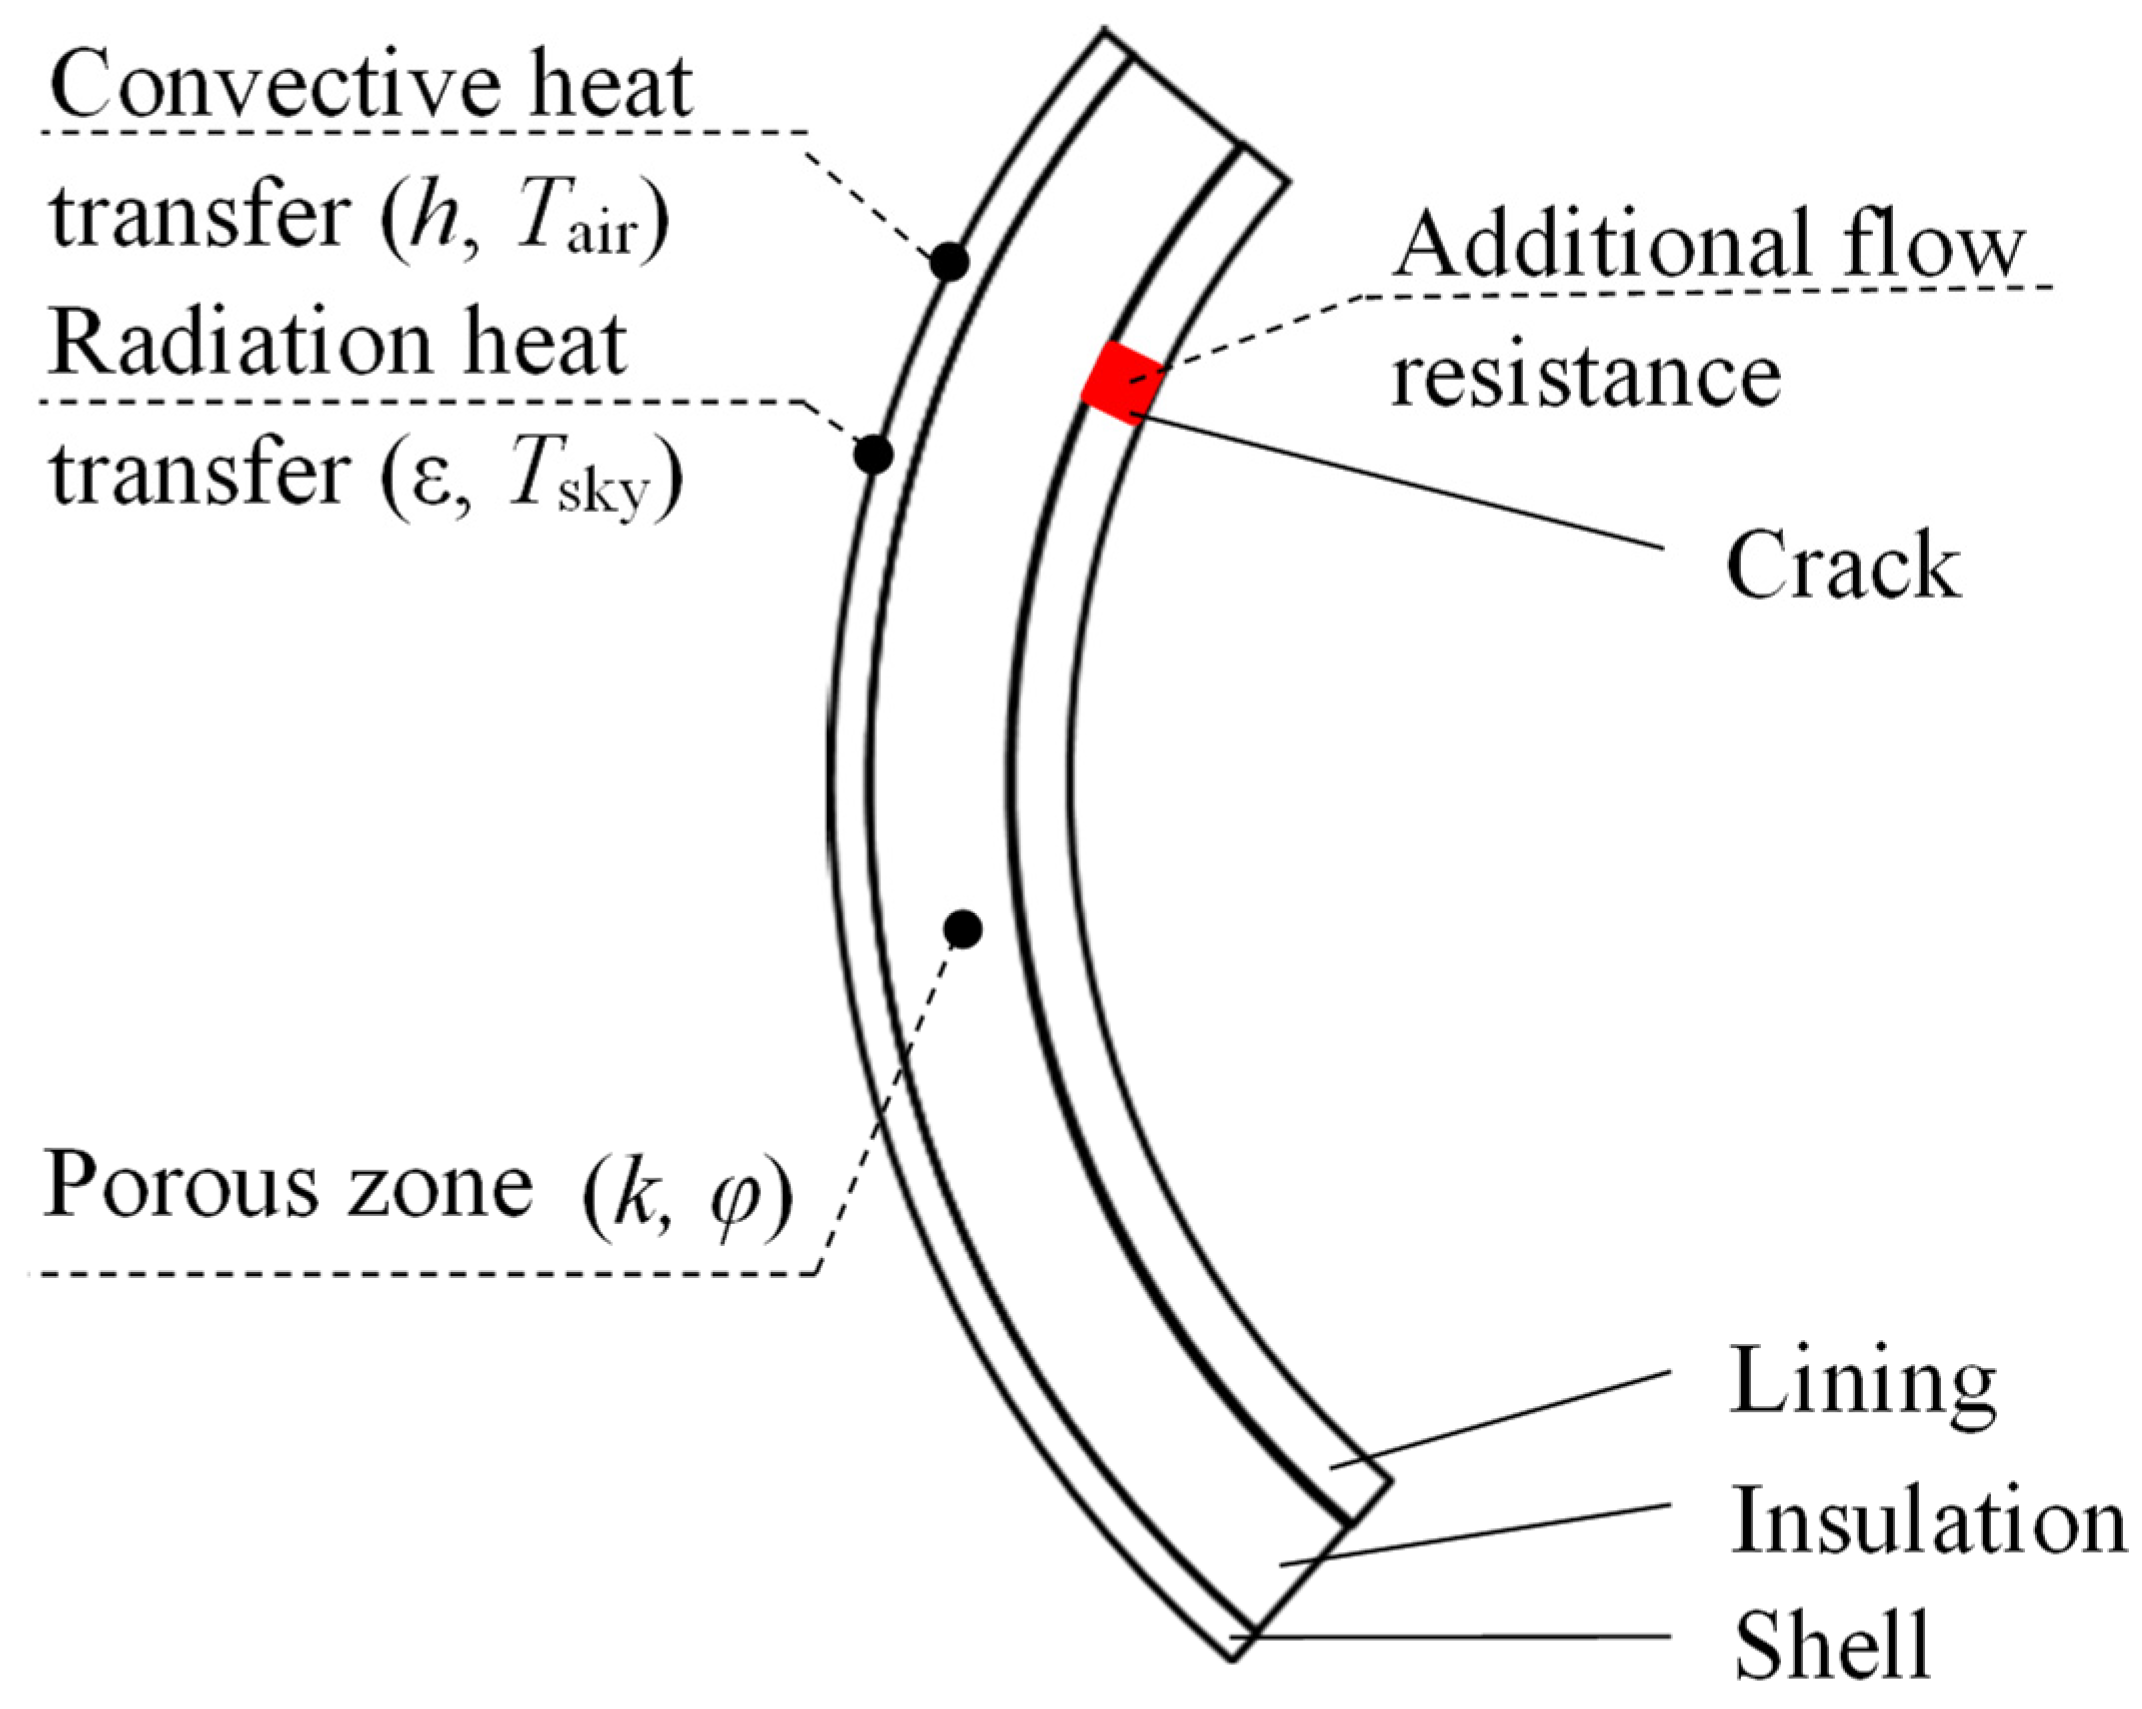

Figure A2.
Division of sections to measure boundary surface temperatures: (a) 3D view, (b) cross-sectional view.
Figure A2.
Division of sections to measure boundary surface temperatures: (a) 3D view, (b) cross-sectional view.
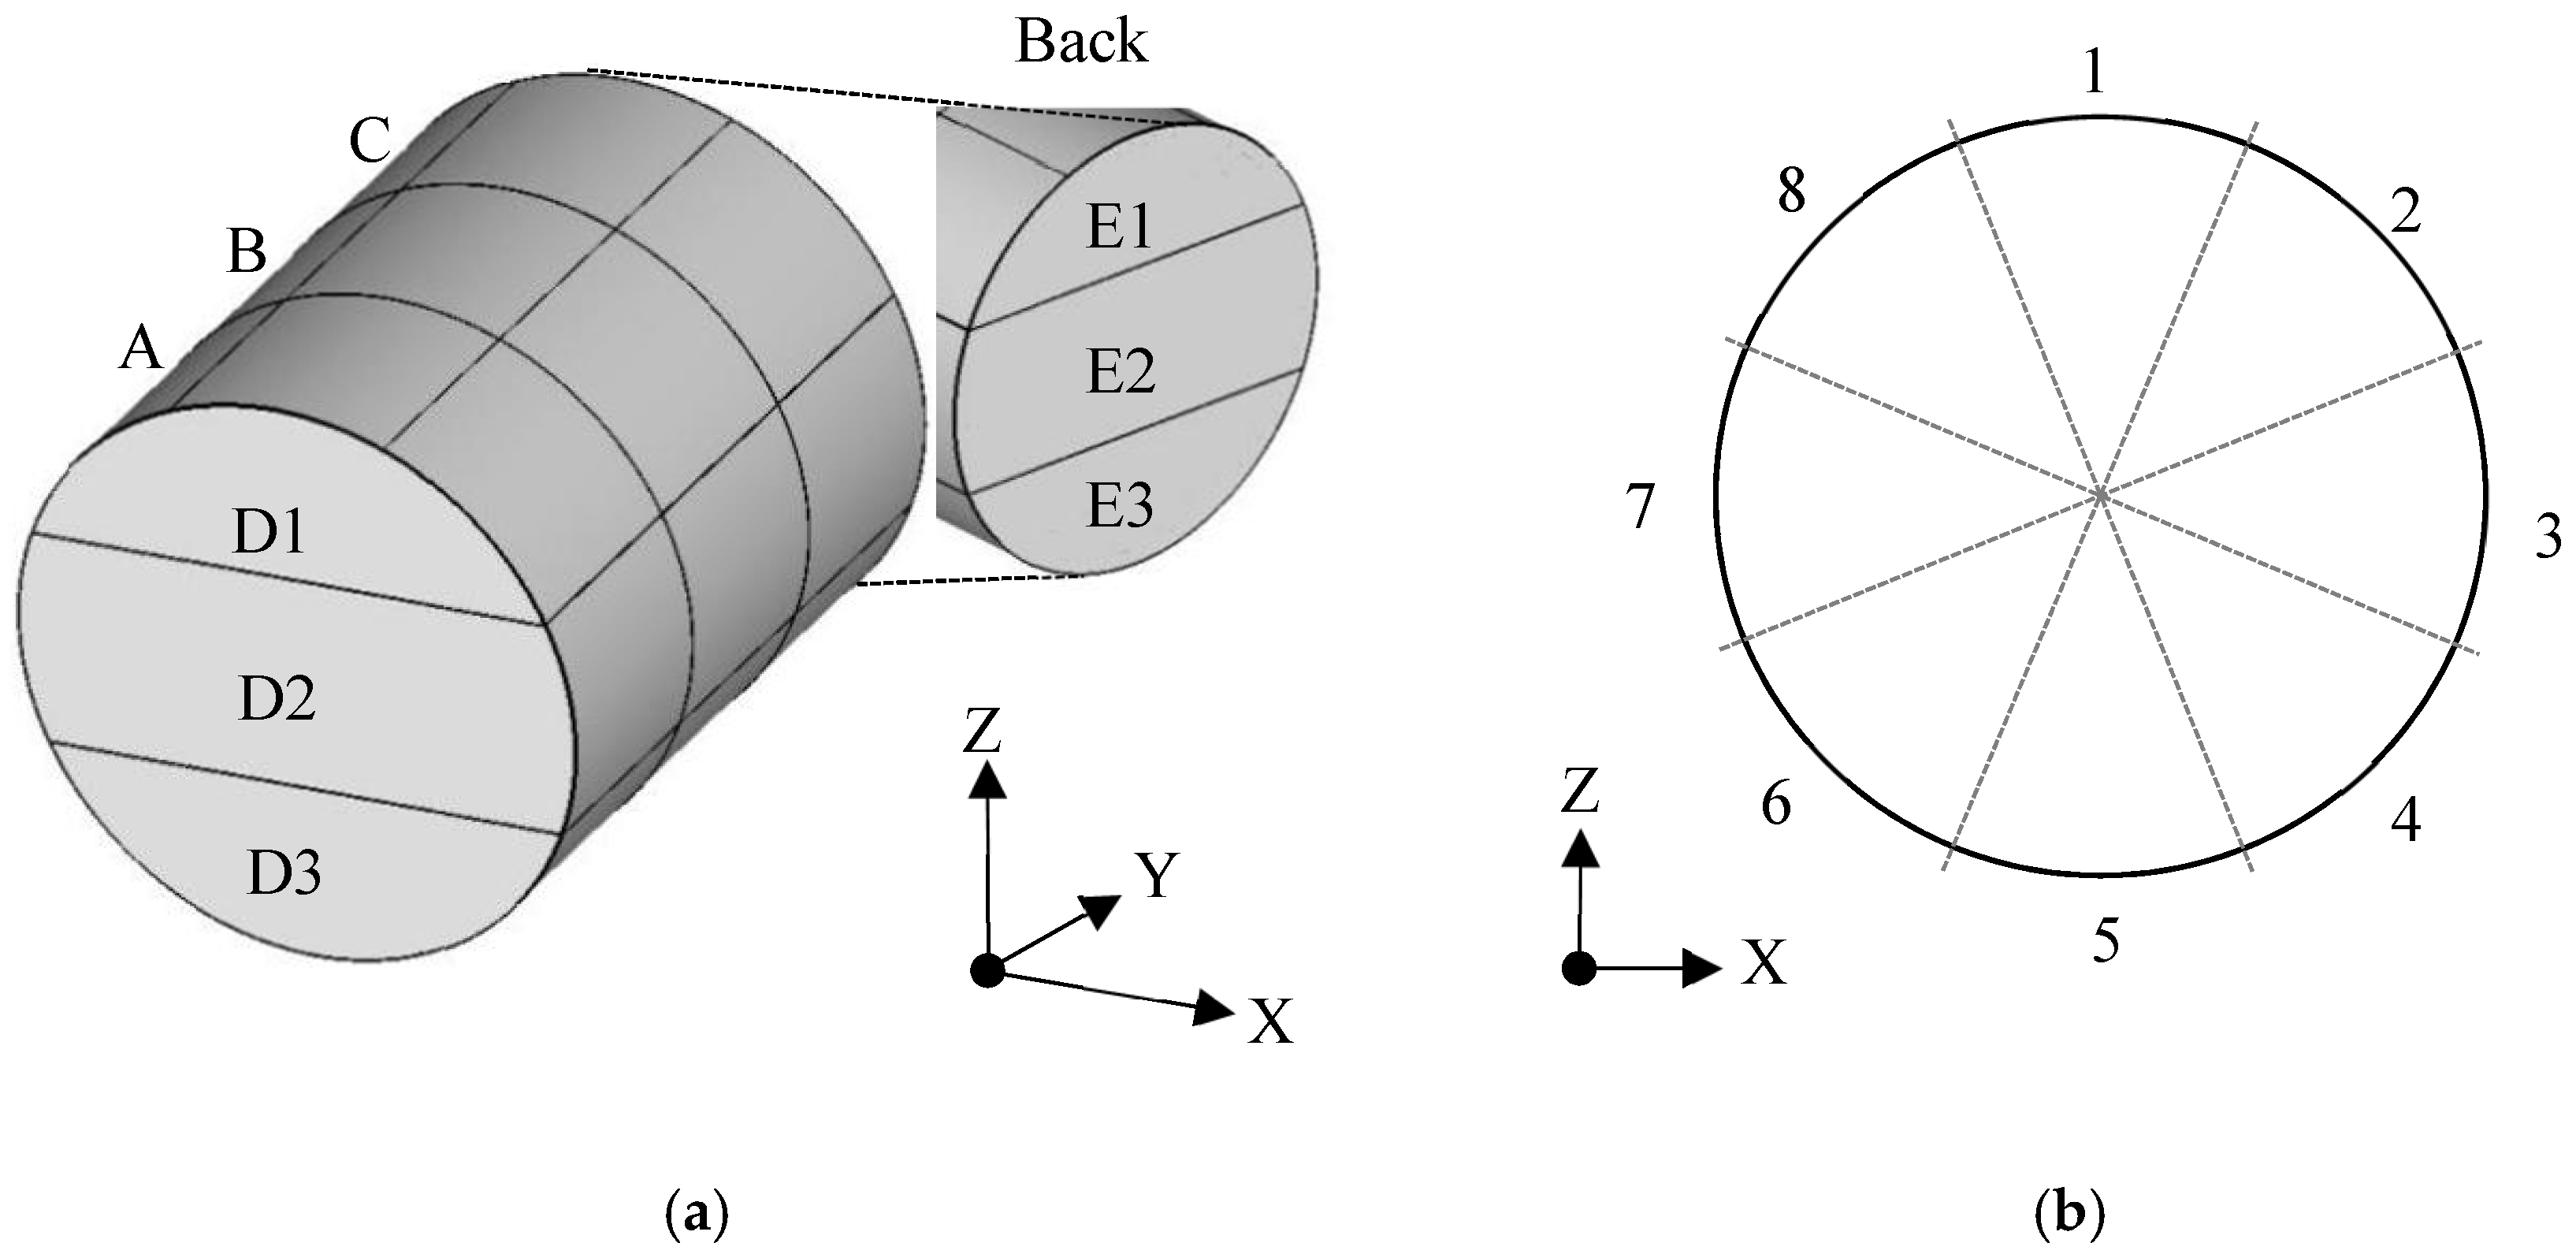
Table A2.
Measured skin surface temperatures in different sections on outer shell skin surfaces of reduced-scale cabin mockup.
Table A2.
Measured skin surface temperatures in different sections on outer shell skin surfaces of reduced-scale cabin mockup.
| Item | Temperature (°C) | Item | Temperature (°C) | Item | Temperature (°C) | Item | Temperature (°C) |
|---|---|---|---|---|---|---|---|
| A-1 | −12.11 | B-1 | −8.26 | C-1 | −6.72 | D-1 | −11.75 |
| A-2 | −9.54 | B-2 | −8.00 | C-2 | −7.49 | D-2 | −12.26 |
| A-3 | −8.00 | B-3 | −8.26 | C-3 | −8.77 | D-3 | −13.80 |
| A-4 | −10.05 | B-4 | −13.13 | C-4 | −9.80 | E-1 | −16.35 |
| A-5 | −15.70 | B-5 | −15.19 | C-5 | −15.19 | E-2 | −11.74 |
| A-6 | −12.37 | B-6 | −12.37 | C-6 | −13.90 | E-3 | −13.53 |
| A-7 | −10.31 | B-7 | −11.59 | C-7 | −12.62 | ||
| A-8 | −13.02 | B-8 | −11.99 | C-8 | −10.20 |
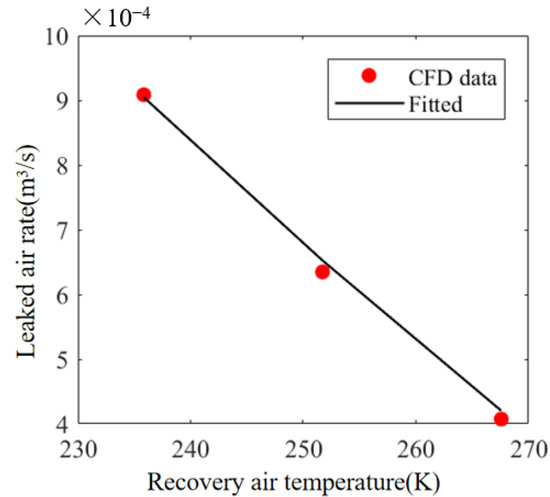
Figure A3.
Fitted leaked-air rate with recovery air temperature and comparison with CFD data.
Figure A3.
Fitted leaked-air rate with recovery air temperature and comparison with CFD data.
References
- ICAO. Manual of the ICAO Standard Athmosphere Extended to 80 km, 3rd ed.; Internation Civil Aviation Organization: Montréal, QC, Canada, 1993. [Google Scholar]
- Boeing Commercial Airplanes. The Airplane Cabin Environment-The Air That You Breathe; Boeing: Seattle, WA, USA, 2005. [Google Scholar]
- ANSI/AHSHRAE. ASHRAE Standarad 161–2007: Air Quality Within Commercial Aircraft; American Society of Heating, Refrigerating and Air-Conditioning Engineers, Inc.: Atlanta, GA, USA, 2007. [Google Scholar]
- Li, P.; Zhao, Y.; Wang, S. Various air distribution modes on commercial airplanes. Part 1: Experimental measurement. HVAC&R Res. 2013, 19, 268–282. [Google Scholar]
- Norrefeldt, V.; Riedl, G. Investigation of the Impact of a Particle Foam Insulation on Airflow, Temperature Distribution, Pressure Profile and Frost Buildup on the Aircraft Structure. Aerospace 2021, 8, 359. [Google Scholar] [CrossRef]
- Walkinshaw, D.S. Stack Pressure-Created Airflows in Insulation Envelopes, Part 2: Passenger Aircraft. Ashrae J. 2020, 5, 32–46. [Google Scholar]
- Zhang, T.; Li, G.; Lin, C.-H.; Wei, Z.; Wang, S. Experimental identification of key parameters contributing to moisture accumulation in an aircraft section. Build. Environ. 2017, 126, 339–347. [Google Scholar] [CrossRef]
- Zhang, T.; Li, G.; Lin, C.-H.; Wei, Z.; Wang, S. Measured moisture accumulation in aircraft walls during simulated commercial flights. Sci. Technol. Built Environ. 2018, 24, 820–829. [Google Scholar] [CrossRef]
- Brunt, C. Speech Interference Levels in Aircraft Interior Noise Measurement: Their Use and Interpretation. 2020. Available online: http://www.armchair.com/sci/brunt1.html (accessed on 3 February 2020).
- Specht, P.; Asfia, J.; Buzza, T.; von Flotow, A. Air Curtain Insulating System for Aircraft Cabin. U.S. Patent 5,897,079, 27 April 1999. [Google Scholar]
- Walkinshaw, D.S.; Preston, K.F. Controlling Cabin and Envelope Air Flows and Pressure Differentials to Prevent Envelope Condensation, Enable Cabin Humidification, Improve Fire Safety, and Decrease Fuel Use. SAE Int. J. Aerosp. 2011, 4, 1243–1253. [Google Scholar] [CrossRef]
- Huber, P.; Schuster, K.; Townsend, R. Controlling Nuisance Moisture in Commercial Airplanes, Aero. No. 5. 1999. Available online: http://www.boeing.com (accessed on 3 February 2020).
- Westhoff, A. Experimental study of moist air flow in the gap between the aircraft’s fuselage and its cabin wall. CEAS Aeronaut. J. 2020, 17, 591–607. [Google Scholar] [CrossRef] [Green Version]
- Tamura, G.T. Pressure Differences for a Nine-Story Building as a Result of Chimney Effect and Ventilation System Operation; ASHRAE: Atlanta, GA, USA, 1973; Volume 10. [Google Scholar]
- Walkinshaw Douglas, S.; Horstman, R.H. Stack Pressure-Created Airflows in Insulation Envelopes, Part 1: Buildings: Another HVAC Design Parameter to Consider. ASHRAE J. 2020, 62, 12–25. [Google Scholar]
- Arce, J.; Jiménez, M.J.; Guzmán, J.D.; Heras, M.R.; Alvarez, G.; Xamán, J. Experimental study for natural ventilation on a solar chimney. Renew. Energy 2009, 34, 2928–2934. [Google Scholar] [CrossRef]
- Man, X.; Lu, Y.; Li, G.; Wang, Y.; Liu, J. A study on the stack effect of a super high-rise residential building in a severe cold region in China. Indoor Built Environ. 2020, 29, 255–269. [Google Scholar] [CrossRef]
- Yoon, S.; Song, D.; Kim, J.; Lim, H. Stack-driven infiltration and heating load differences by floor in high-rise residential building. Build. Environ. 2019, 157, 366–379. [Google Scholar] [CrossRef]
- Kalamees, T.; Alev, Ü.; Pärnalaas, M. Air leakage levels in timber frame building envelope joints. Build. Environ. 2017, 116, 121–129. [Google Scholar] [CrossRef]
- Jo, J.-H.; Lim, J.-H.; Song, S.-Y.; Yeo, M.-S.; Kim, K.-W. Characteristics of pressure distribution and solution to the problems caused by stack effect in high-rise residential buildings. Build. Environ. 2007, 42, 263–277. [Google Scholar] [CrossRef]
- Zhang, T.; Tian, L.; Lin, C.-H.; Wang, S. Insulation of commercial aircraft with an air stream barrier along fuselage. Build. Environ. 2012, 57, 97–109. [Google Scholar] [CrossRef]
- Liu, S.; Xu, L.; Chao, J.; Shen, C.; Liu, J.; Sun, H.; Xiao, X.; Nan, G. Thermal environment around passengers in an aircraft cabin. HVAC&R Res. 2013, 19, 627–634. [Google Scholar]
- Chen, L.; Wang, S.; Li, G.; Lin, C.-H.; Zhang, T. CFD modeling of moisture accumulation in the insulation layers of an aircraft. Appl. Therm. Eng. 2016, 102, 1141–1156. [Google Scholar] [CrossRef]
- Graham, W.J.; David, F.J. The permeability of fibrous porous media. Can. J. Chem. Eng. 1986, 64, 364–374. [Google Scholar]
- Shih, T.H.; Liou, W.W.; Shabbir, A.; Yang, Z.; Zhu, J. A new k-ε eddy viscosity model for high Reynolds number turbulent flows. Comput. Fluids 1995, 24, 227–238. [Google Scholar] [CrossRef]
- ANSYS FLUENT, 19.0. In User’s and Theory Guide; ANSYS, Inc.: Canonsburg, PA, USA, 2018.


Publisher’s Note: MDPI stays neutral with regard to jurisdictional claims in published maps and institutional affiliations. |
© 2022 by the authors. Licensee MDPI, Basel, Switzerland. This article is an open access article distributed under the terms and conditions of the Creative Commons Attribution (CC BY) license (https://creativecommons.org/licenses/by/4.0/).