Abstract
Nursing hospitals have a high probability of casualties during a fire disaster because they have many patients with impaired mobility. In this study, fire and egress simulations were conducted to evaluate the egress safety of a typical nursing hospital. The available safe egress time (ASET) of the prototype nursing hospital was calculated using Fire Dynamics Simulator, and the required safe egress time (RSET) was estimated by Pathfinder, reflecting characteristics of the occupants. The egress safety of the nursing hospital was then evaluated by comparing the ASET and RSET, considering the number of egress guides and delay time. According to the simulation results, the RSET increased as the egress delay time increased and the number of egress guides decreased. In addition, it is estimated that at least 20 workers (egress guides) should be on duty in the prototype nursing hospital, even during shiftwork and night duty. Based on the simulation results, egress safety criteria have been proposed in terms of normalized numbers of egress guides and egress delay time. The proposed criteria can be very easily applied to evaluate the egress safety of a typical nursing hospital in operation.
1. Introduction
The elderly population worldwide is increasing rapidly [1] (Figure 1). Every country provides specialized medical services to the elderly and patients suffering from age-related diseases to protect the right of older people to health. The most common example of such services is the care and treatments provided by nursing hospitals. Generally, because it takes a long time for patients with impaired mobility to egress during a fire disaster in a nursing hospital, a relatively high number of casualties may occur compared to those in other facilities [2].
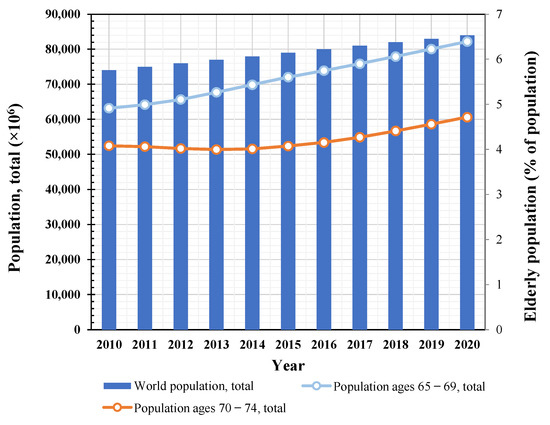
Figure 1.
Growing global population and elderly population ratio.
Many studies considering the egress characteristics of occupants have been conducted. Annuniata et al. [3] conducted fire drills, assuming that a fire breaks out in a university hospital, and they performed egress simulations based on the fire drill results. Maohua et al. [4] conducted egress simulations and evaluated egress safety, assuming a fire occurs in a metro station with a large floating population. Jiawen et al. [5] used Pathfinder to simulate fire emergency egress in subway stations. Hung et al. [6] investigated potential hazards in fire safety and provided the enhancement of fire safety in small-scale senior citizen welfare institutions. Li et al. [7] conducted a study on the egress behavior of urban underground complexes in a fire emergency. On the other hand, Fu et al. [8], Ronchi et al. [9], and Wal et al. [10] have been conducted studies on how evacuees are aware of and respond to fire emergencies. Abdelghany et al. [11], Cho et al. [12], and Xie et al. [13] performed research on the improvement of egress models considering way-finding guidance. In addition, there have been many other studies on fire or egress simulation to estimate fire safety [14,15,16,17,18,19,20,21,22,23,24,25,26].
Despite many studies on fire or egress simulation conducted so far, there is a lack of literature on the egress safety evaluation of nursing hospitals where egress guides are essential because of unfavorable conditions of patients. In addition, no research has been conducted to improve the egress safety of nursing hospitals in operation. In this study, fire and egress simulations were conducted to evaluate the egress safety of a typical nursing hospital. Based on the simulation results, egress safety criteria for a typical nursing hospital were determined in four steps. (1) The available safe egress time (ASET) of the prototype nursing hospital was calculated using Fire Dynamics Simulator (FDS), where ASET is defined as the time at which the values of the main factors (temperature, visibility, CO, O2, CO2) reach tenability criteria. (2) Based on the occupant characteristics, egress simulations were performed using Pathfinder, and the time required for all occupants to egress the building (required safe egress time, RSET) was calculated. (3) Egress safety was evaluated based on egress guides and delay time by comparing the ASET and RSET. (4) The egress safety criteria were then determined in terms of normalized egress guides and delay time.
2. Research Significance
Because there are many patients with reduced mobility in a nursing hospital, the number of guides is very important to egress them during a fire disaster. In this study, therefore, fire and egress simulations were performed considering the number of egress guides and egress delay time as primary variables. Based on the simulation results, egress safety criteria have been proposed in terms of normalized numbers of egress guides and egress delay time. The proposed criteria can be very easily applied to evaluate the egress safety of a typical nursing hospital in operation.
3. Egress Safety Evaluation Process
Figure 2 shows the floor plans of a typical nursing hospital used as a prototype in this study. The target building had two floors and ten rooms for patients on each floor. The floor area was 3493.8 m2, and the room height was 2750 mm. In this study, egress safety was evaluated by comparing the RSET and ASET. Egress simulations were performed using Pathfinder [27], a program that predicts egress behaviors based on the occupant characteristics using an agent-based model. The time required for all occupants to egress the building (RSET) was determined. In addition, fire simulations were performed using FDS [28], a model developed by the National Institute of Standards and Technology. The time when the main factors (temperature, visibility, CO, O2, CO2) exceeded the value specified in the life safety code (ASET) was determined. Table 1 lists the tenability criteria presented by the National Fire Protection Association [29] for the main factors affecting the safety of occupants during a fire event. In this study, the time required for visibility, CO, CO2, O2, and temperature to reach each tenability criterion was computed using the FDS analysis results, among which the lowest value (ASET) for the prototype nursing hospital was determined.
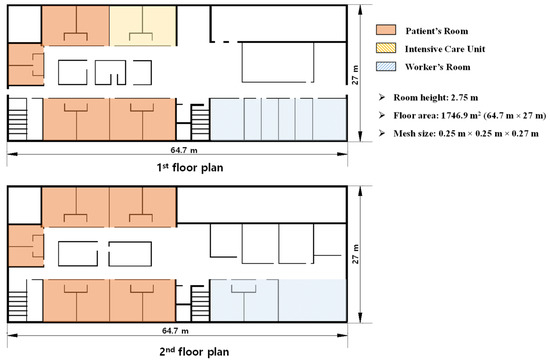
Figure 2.
Floor plan of prototype nursing hospital.

Table 1.
Tenability criteria in NFPA [29].
4. Simulation Model for Fire
4.1. Simulation Model
Figure 3 shows the fire combustion location assumed for the fire simulation and egress routes, and Figure 4 shows the FDS model used for the fire simulation. It was assumed that a fire occurred on the second floor of the prototype nursing hospital, and two stairs and an elevator were set as the egress routes. An egress using elevators is generally prohibited in case of a fire emergency. For nursing hospitals, however, a significant number of occupants use wheelchairs or beds to egress (i.e., aided-egress), so some countries allow the use of emergency elevators with strict conditions, for instance, a completely separate operation in any conditions.
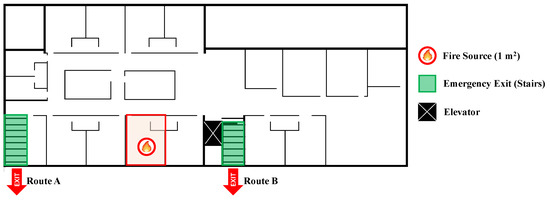
Figure 3.
Location of fire combustion and egress routes.
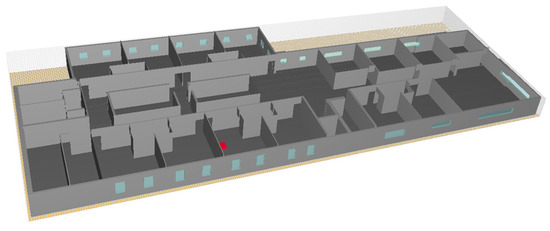
Figure 4.
Analysis model for fire simulation.
Fire simulation was performed for 500 s, and the assumed initial temperature was 20 °C. Table 2 lists the input characteristics of the FDS model. The FDS User’s Guide presents the size () of the mesh used for the fire simulation as follows:
Table 2.
Input characteristics of fire scenario.
Based on Equation (1), 0.25 m × 0.25 m × 0.27 m was applied as the mesh size. In Equation (1), is the total heat release rate of fire (kW), is the density of air (1.204 kg/m3), is the specific heat (1.005 kJ/kg-K), is the ambient temperature (293 K), and is the acceleration due to gravity (9.8 m/s2). The values specified in the Society of Fire Protection Engineers handbook [30] were adopted as the physical properties of the fuel. The combustibles were assumed to be beds, tables, and chairs, and the heat release rate of each combustible was calculated according to the database [31] of the National Center for Forensic Science. To assume the concentration of smoke and toxic gases generated during combustion as the worst case, polyurethane foams [32,33] with the highest soot yield and CO yield values have been set as the fuel type. The heat release rate () in terms of time was calculated using Equation (2) to simulate the t-squared fire curves shown in Figure 5:
where is the fire growth coefficient, and is the time. Fire growth rates are typically divided into “slow,” “medium,” “fast,” and “ultrafast.” In this study, the medium level () was adopted based on the “Structural Design for Fire Safety” [34]. For the fire simulations, the burning area was set as 1 m × 1 m, and the fire extinguishing and smoke exhaust systems were assumed not to be in operation.
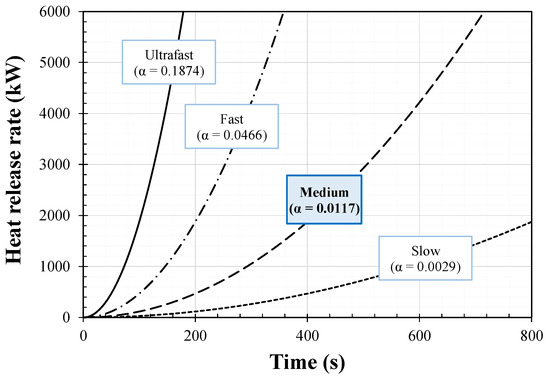
Figure 5.
T-square fire curves.
4.2. Simuation Results
Figure 6 depicts the smoke behavior for the fire duration () of each fire compartment on the second floor where the fire broke out. As shown in Figure 6a, smoke spread from the fire area to the hallway approximately 100 s after the fire started. The hallway on the second floor was filled with smoke approximately 300 s after the fire, and the smoke spread to the entire second floor at approximately 500 s.
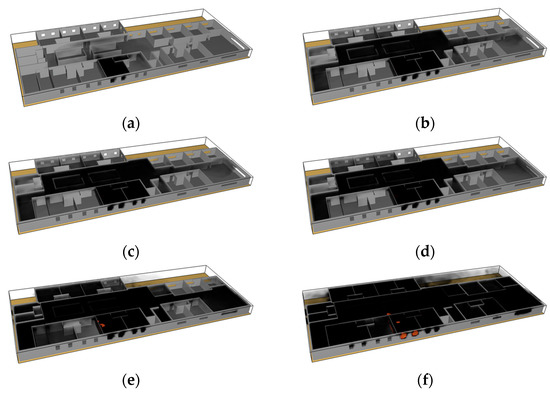
Figure 6.
(a) t = 100 s; (b) t = 204 s (Route B fail); (c) t = 211 s (Elevator fail); (d) t = 227 s (Route A fail); (e) t = 300 s; (f) t = 500 s.
Figure 7 shows the simulation results (visibility, CO, CO2, O2, and temperature) for the fire duration () for each egress route (Route A, Route B, and the elevator) shown in Figure 3. In the graphs, the red dotted lines indicate the tenability criteria listed in Table 1; that is, the time at which each piece of data intersects the red dotted line in the graph becomes the ASET for each factor. Figure 7a shows the visibility simulation results for the fire duration () in which the tenability limits were reached in the following order: Route B (204 s), the elevator (211 s), and Route A (227 s). Therefore, the ASET for visibility was 204 s (Route B). Figure 7b shows the simulation results for CO. The tenability limits were reached in the following order: Route A (450 s), the elevator (462 s), and Route B (468 s). Therefore, the ASET for CO was 450 s (Route A). Figure 7c,d show the simulation results for CO2 and O2, respectively. For these parameters, the tenability criteria for all egress routes were not satisfied. Figure 7e shows the temperature analysis results. The maximum temperatures of the egress routes were 50 °C (elevator), 55 °C (Rout A), and 46 °C (Route B). The simulation results for the visibility, CO, CO2, O2, and temperature based on the fire duration () showed that the ASET was predominantly determined by a decrease in visibility, owing to the spread of smoke. The ASET of the prototype nursing hospital was 204 s.
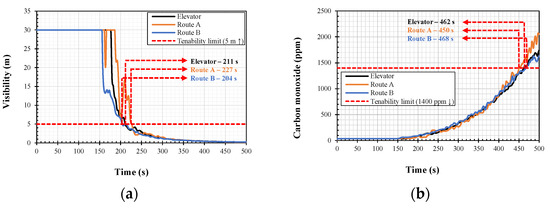
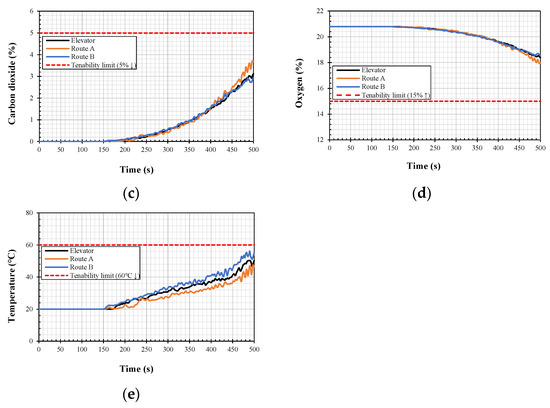
Figure 7.
(a) visibility; (b) carbon monoxide; (c) carbon dioxide; (d) oxygen; (e) temperature.
5. Simulation Model for Egress
5.1. Simuation Model
Figure 8 shows the Pathfinder model for the egress simulations. For the egress simulations, the number of total evacuees, velocity of evacuees, width of evacuees, and preparing time for evacuees in the prototype buildings were input in the model. The Enforcement Rule of Welfare of Senior Citizens Act [35] in South Korea prescribes that an area of at least 23.6 m2 per patient must be secured. Therefore, the number of patients was assumed to be 150, considering the area of the prototype building. Based on the health status of a patient, the patient’s severity can be classified into levels, such as “medical highest,” “medical high,” “medical middle,” “medical low,” and “etc.” In this study, the number of patients according to the severity was assumed as shown in Table 3, based on the severity ratio according to inpatient classification of nursing hospitals by the Ministry of Health and Welfare, South Korea [36]. Table 4 lists the number of patients according to egress type. It was assumed that, during a fire event, 41 patients whose severity was categorized as “etc.” could egress on their own by walking, and 34 patients with “medical low” severity could egress themselves in wheelchairs. The number of patients that could egress in wheelchairs with the assistance of an egress guide was assumed to be 59, considering all the patients with “medical middle” status and some patients with “medical high” status. However, 16 patients were assumed to be evacuated in their beds with the help of an egress guide because the patients could not move.
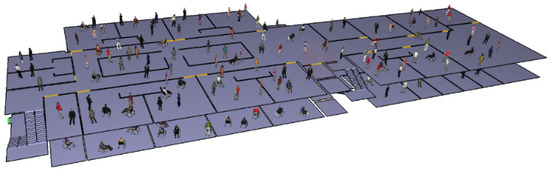
Figure 8.
Analysis model for egress simulation.
Table 3.
Number of patients according to severity.
Table 4.
Number of patients according to egress type.
Table 5 lists the egress characteristics of patients and egress guides in nursing hospitals. The velocity and width of patients and egress guides were determined based on the egress type according to Lee et al. [2]. In addition, 15 and 25 s required to attach or set up assistive devices were considered for patients evacuated in wheelchairs and beds, respectively. The Enforcement Rule of Welfare of Senior Citizens Act in South Korea [35] stipulates that, for 150 patients, at least one doctor, six nurses, two physical therapists or social workers, and more than 60 care workers must be employed. During the simulations, these categories of workers were assumed to be egress guides to help patients egress. In nursing hospitals, staff typically work in shifts, and workers in night shifts are fewer than those in day shifts. Therefore, egress simulations in this study were performed using the number of workers as a variable. The number of workers for the egress simulation model ranged from 10 to 75 in intervals of five. Table 6 lists the types of workers in each case, and it was assumed that half of them would be in the room on the first and second floors, respectively.
Table 5.
Characteristics of occupants.
Table 6.
Number of workers.
During a fire, it takes some time for a patient and an egress guide to commence egressing; this is called the delay time. The delay time includes the time taken to detect a fire (detection time), raise a fire alarm (notification time), and move after knowing about the fire (premovement time). Therefore, the delay time can be reduced significantly by egressing immediately after fire detection and notification through broadcasting facilities in the control room equipped with closed-circuit televisions (CCTVs). However, if there is a shortage of staff trained to handle fire situations, CCTVs, and broadcasting facilities, the egress delay time increases, increasing the RSET. In this study, simulations were performed by setting the delay time to 0–300 s in intervals of 60 s, and the egress safety was evaluated in terms of delay time.
5.2. Simuation Results
Figure 9 shows the number of survivors when the number of total evacuees was 185, with the delay time as a variable. At this time, the number of patients was 150, number of egress guides was 35, and number of evacuees on the second floor was 100. Because the number of total evacuees was constant, and the egress patterns were similar, all the graphs showed similar trends, and each result was an offset form based on the delay time. The time at which everybody completed the egress was selected as the RSET for each case.
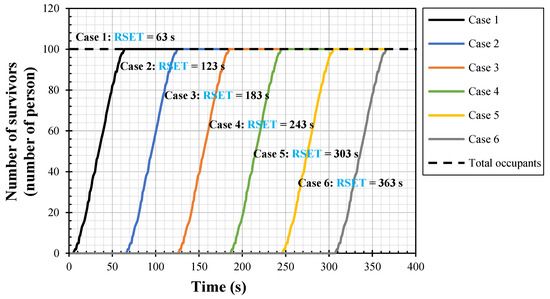
Figure 9.
Analysis results (number of survivors).
Table 7 shows the RSET determination results for each case. Generally, RSET decreased when the number of egress guides increased, but RSET increased with increasing delay time. However, when the number of egress guides was increased with the number of patients kept constant, the total number of evacuees increased. Therefore, RSET increased in some cases because of the increased number of total evacuees, despite the additional egress guides.
Table 7.
Simulation results on required safe egress time (RSET).
6. Egress Safety Evaluation
Table 8 lists the number of people who failed to egress when the ASET was 204 s in each case. When the number of egress guides was 10, four people failed to egress even after egression commenced immediately after the fire broke out (that is, when the delay time was 0 s). When the number of egress guides increased to 20, everybody egressed only when the delay time was 0 s, whereas four people failed to egress when the delay time was 60 s. When the delay time was maintained, the number of people who failed to egress decreased as the number of egress guides increased. Because the ASET was 204 s, everybody failed to egress when the delay time exceeded 240 s. When the delay times were 240 and 300 s, the number of people who failed to egress increased with an increasing number of egress guides; the number of total evacuees tended to increase when the number of egress guides increased.
Table 8.
Number of people who failed to egress.
Figure 10 shows the egress safety evaluation results for each case. The x- and y-axes represent the delay time and the number of egress guides, respectively. When all the occupants egressed successfully, the situation was considered safe; it was considered unsafe even if one person failed to egress. The egression failed regardless of the delay time when the number of egress guides was 15. Therefore, it can be inferred that at least 20 workers should be on duty in the prototype nursing hospital, even during shiftwork and night duty. Furthermore, the number of egress guides required for successful egression rapidly increased with increasing delay time.
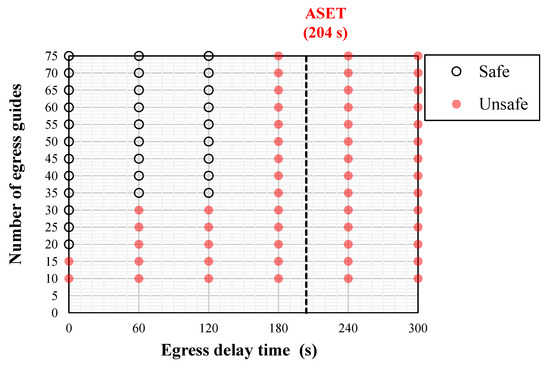
Figure 10.
Egress safety evaluation of prototype nursing hospital.
7. Egress Safety Criteria
Table 9 lists the egress delay times for nursing hospitals specified by the British Standards Institution [37] and Ministry of Public Safety and Security [38]. The delay times are classified as W1 (<180 s), W2 (300 s), and W3 (>480 s) based on the levels of staff proficiency in fire situations and the availability of CCTVs and broadcasting facilities. Generally, RSET is determined when a performance-based egress safety design is performed, considering the egress safety time according to occupancy type. Based on previous simulation results, the delay time and the number of egress guides should be considered during the egress safety evaluation of the nursing hospital. In Figure 11, the y-axis represents the normalized egress guides calculated by dividing the number of egress guides presented in Figure 10 by the total number of patients. Generally, the number of patients in a nursing hospital can be determined based on the building area. Furthermore, the total number of employees and resident staff can be determined based on the number of patients. Therefore, the normalized number of egress guides is an objective value calculated by reflecting the size of the building and the number of patients, and it can be used to assess the egress safety criteria. The line in Figure 11 is the egress safety criteria, which indicates egress success or failure based on the delay time and the normalized number of egress guides in a typical nursing hospital. The right side of the line represents egress failure, whereas the left side represents egress success. These proposed criteria can be applied in typical nursing hospitals in operation to evaluate egress safety and establish complementary measures. In other words, egress safety in an operational nursing hospital can be assessed to be safe or unsafe using the proposed criteria based on the number of egress guides and the delay time calculated by considering the broadcasting facilities, CCTVs, and staff proficiency in handling fire situations. When the egress safety was evaluated as unsafe, it can be improved using two methods. The first is to increase the number of egress guides, and the second is to decrease the delay time by increasing the proficiency level of staff in fire situations or installing a broadcasting system or CCTVs. Thus, the proposed criteria can be used to determine the minimum number of egress guides required to ensure egress safety or reduce the delay time. This approach will allow nursing hospitals to improve egress safety in terms of costs and efficiency.
Table 9.
Egress delay time [37,38].
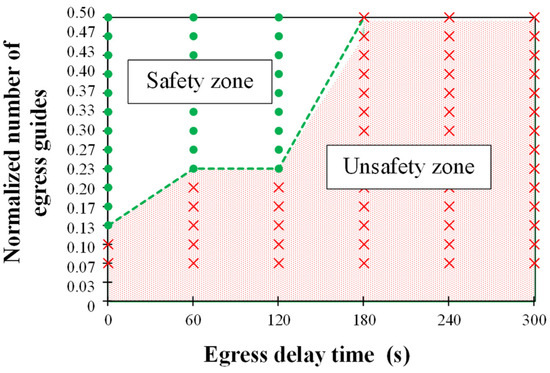
Figure 11.
Egress safety criteria for a typical nursing hospital.
8. Conclusions
In this study, fire and egress simulations of a prototype nursing hospital were conducted, and the following conclusions were drawn:
- The visibility, CO, CO2, O2, and temperature based on the fire duration of a typical nursing hospital were analyzed using FDS. The time required for each factor to reach the tenability criteria was calculated, and the lowest value was regarded as the ASET of the prototype nursing hospital. The ASET was predominantly determined based on the decrease in visibility caused by smoke spreading.
- Pathfinder was used for performing egress simulations of a nursing hospital with the delay time and the number of egress guides as variables, considering the occupant characteristics. The simulation results showed that the RSET increased as the delay time increased and the number of egress guides decreased. It is estimated that at least 20 workers (egress guides) should be on duty in the prototype nursing hospital, even during shiftwork or night duty.
- The egress safety of the prototype nursing hospital was evaluated by comparing the ASET and RSET. Based on the simulation results, the egress safety criteria of a typical nursing hospital were proposed in terms of normalized numbers of egress guides and delay time. The proposed criteria can be very easily applied to evaluate the egress safety of a typical nursing hospital in operation.
- This study presented egress safety criteria for typical nursing hospitals without smoke exhaust systems only, and the egress safety criteria for the cases with smoke exhaust systems would be significantly different from those without smoke exhaust systems, which needs to be studied further in the near future.
Author Contributions
Original draft manuscript, S.-H.C.; Investigation, K.D.; Investigation, I.H.; Validation, H.J.; Supervision and Review Writing, K.S.K. All authors have read and agreed to the published version of the manuscript.
Funding
This work is supported by the Korea Agency for Infrastructure Technology Advancement (KAIA) grant funded by the Ministry of Land, Infrastructure, and Transport (Grant 22CTAP-C163892-02).
Institutional Review Board Statement
Not applicable.
Informed Consent Statement
Not applicable.
Data Availability Statement
The data presented in this study are available on request to the corresponding author.
Conflicts of Interest
The authors declare no conflict of interest.
References
- World Bank. World Bank Staff Estimates based on Age/Sex Distributions of United Nations Population Division’s World Population Prospects. Available online: https://databank.worldbank.org/home.aspx (accessed on 26 January 2022).
- Lee, D.H.; Heo, I.W.; Khaliunaa, D.; Han, S.J.; Kim, K.S. Performance-Based Evaluation on Egress Safety of Nursing Hospital Considering Egress Guides and Delay time. J. Korean Soc. Hazard Mitig. 2020, 20, 149–157. (In Korean) [Google Scholar] [CrossRef]
- Annunzitata, D.O.; Luca, G.; Davide, U.; Grazia, C.; Leo, P. Egress from a Hospital Ward During Fire Emergency. Int. J. Saf. Secur. Eng. 2020, 10, 1–10. [Google Scholar] [CrossRef]
- Maohua, Z.; Congling, S.; Xuwei, T.; Tairan, F.; Li, H. Study of the Human Evacuation Simulation of Metro Fire Safety Analysis in China. J. Loss. Prev. Process Ind. 2008, 21, 287–298. [Google Scholar] [CrossRef]
- Qin, J.; Liu, C.; Huang, Q. Simulation on Fire Emergency Evacuation in Special Subway Station Based on Pathfinder. Case Stud. Therm. Eng. 2020, 21, 100677. [Google Scholar] [CrossRef]
- Hung, S.M.; Wang, S.C.; Chien, S.W.; Su, C.H.; Chen, L.P. The Enhancement of Fire Safety in Small-Scale Senior Citizen Welfare Institutions Based on Fire Protection Defense-in-Depth Strategy. Sustainability 2022, 14, 3196. [Google Scholar] [CrossRef]
- Le, X.; Chen, W.; Wang, C.; Lassem, M.A. Study on Evacuation Behavior of Urban Underground Complex in Fire Emergency Based on System Dynamics. Sustainability 2022, 14, 1343. [Google Scholar] [CrossRef]
- Fu, L.; Cao, S.; Song, W.; Fang, J. The Influence of Emergency Signage on Building Evacuation Behavior: An Experimental Study. Fire Mater. 2019, 43, 22–33. [Google Scholar] [CrossRef]
- Ronchi, E.; Nilsson, D. Fire Evacuation in High-rise Buildings: A Review of Human Behaviour and Modelling Research. Fire Sci. Rev. 2013, 2, 7. [Google Scholar] [CrossRef]
- Wal, C.N.; Formolo, D.; Robinson, M.A.; Gwynne, S. Examining Evacuee Response to Emergency Communications with Agent-Based Simulations. Sustainability 2021, 13, 4623. [Google Scholar] [CrossRef]
- Abdelghany, A.; Abdelghany, K.; Mahmassani, H.; Alhalabi, W. Modeling Framework for Optimal Evacuation of Large-Scale Crowded Pedestrian Facilities. Eur. J. Oper. Res. 2014, 237, 1105–1118. [Google Scholar] [CrossRef]
- Cho, J.; Lee, G.; Lee, S. An Automated Direction Setting Algorithm for a Smart Exit Sign. Autom. Constr. 2015, 59, 139–148. [Google Scholar] [CrossRef]
- Xie, H.; Filippidis, L.; Gwynne, S.; Galea, E.R.; Blackshields, D.; Lawrence, P.J. Signage Legibility Distances as a Function of Observation Angle. J. Fire Prot. Eng. 2007, 17, 41–64. [Google Scholar] [CrossRef]
- Heo, I.W.; Han, S.J.; Kang, H.; Hwang, S.J.; Ju, Y.H.; Kim, K.S. Performance-Based Evaluation on Evacuation Safety Studio Residential Buildings according to Installation of Smoke Exhaust System. J. Korean Soc. Hazard Mitig. 2018, 18, 1–8. [Google Scholar] [CrossRef]
- Li, Q.; Li, S.C.; Wang, Z.H. Research on Smoke Exhaust Effect at Different Installation Height of Mechanical Exhaust Port in Ring Corridor of High-rise Building. Procedia Eng. 2016, 135, 324–335. [Google Scholar] [CrossRef][Green Version]
- Khaliunaa, D.; Heo, I.W.; Han, S.J.; Cho, H.C.; Kim, K.S. Real-Time Egress Model for Multiplex Buildings under Fire Based on Artificial Neural Network. Appl. Sci. 2021, 11, 6337. [Google Scholar] [CrossRef]
- Abadi, S.T.S.; Tokmehdash, N.M.; Hosny, A.; Nik-Bakht, M. BIM-Based Co-Simulation of Fire and Occupants’ Behavior for Safe Construction Rehabilitation Planning. Fire 2021, 4, 67. [Google Scholar] [CrossRef]
- Deng, H.; Ou, Z.; Zhang, G.; Deng, Y.; Tian, M. BIM and Computer Vision-Based Framework for Fire Emergency Evacuation Considering Local Safety Performance. Sensors 2021, 21, 3851. [Google Scholar] [CrossRef]
- Gerges, M.; Demian, P.; Adamu, Z. Customising Evacuation Instructions for High-Rise Residential Occupants to Expedite Fire Egress: Results from Agent-Based Simulation. Fire 2021, 4, 21. [Google Scholar] [CrossRef]
- Gai, G.; Cancelliere, P. Design of a Pressurized Smokeproof Enclosure: CFD Analysis and Experimental Tests. Safety 2017, 3, 13. [Google Scholar] [CrossRef]
- Gravit, M.; Klementev, B.; Shabunina, D. Fire Protection of Steel Structures with Epoxy Coatings under Cryogenic Exposure. Buildings 2021, 11, 537. [Google Scholar] [CrossRef]
- Gravit, M.; Shabunina, D. Structural Fire Protection of Steel Structures in Arctic Conditions. Buildings 2021, 11, 499. [Google Scholar] [CrossRef]
- Arewa, A.O.; Ahmed, A.; Edwards, D.J.; Nwankwo, C. Fire Safety in High-Rise Buildings: Is the Stay-Put Tactic a Misjudgement or Magnificent Strategy? Buildings 2021, 11, 339. [Google Scholar] [CrossRef]
- Gravit, M.; Golub, E.; Klementev, B.; Dmitriev, I. Fire Protective Glass Fiber Reinforced Concrete Plates for Steel Structures under Different Types of Fire Exposure. Buildings 2021, 11, 187. [Google Scholar] [CrossRef]
- Kim, W.K.; Seo, D.H. A Study on Egress Algorithm for High-Rise Buildings using Egress Simulation. Korean J. Fire Sci. Eng. 2018, 32, 33–39. [Google Scholar] [CrossRef]
- Han, H.S.; Hwang, C.H. Study on the Available Safe Egress Time (ASET) Considering the Input Parameters and Model Uncertainties in Fire Simulation. Korean J. Fire Sci. Eng. 2019, 33, 112–120. [Google Scholar] [CrossRef]
- Thunderhead Engineering Consultants, Inc. Pathfinder. Available online: https://www.thunderheadeng.com/pathfinder/ (accessed on 26 January 2022).
- McGrattan, K.; Simo, H.; Randall, M.; Jason, F.; Craig, W.; Kristopher, O. Fire Dynamics Simulator—User’s Guide; Special Publication 1019; National Institute of Standards and Technology (NIST): Gaithersburg, MD, USA, 2013. [Google Scholar]
- National Fire Protection Association. NFPA 101 Life Safety Code; National Fire Protection Association: Quincy, MA, USA, 2018. [Google Scholar]
- Hurley, M.J. SFPE Handbook of Fire Protection Engineering; Springer: New York, NY, USA, 2016. [Google Scholar]
- Kim, H.J.; David, G.L. Heat Release Rates of Burning Items in Fires. In Proceedings of the 38th Aerospace Sciences Meeting & Exhibit, Reno, NV, USA, 10–13 January 2000. [Google Scholar]
- Polka, M.; Kukfisz, B.; Auguscik, M.; Leszczynska, M.; Ryszkowska, J. Impact of Flame Retardants on the Smoke Generating Properties of Flexible and Semi-Rigid Polyurethane Foams. Przem. Chem. 2017, 96, 1472–1476. [Google Scholar] [CrossRef]
- Kukfisz, B.; Polka, M. Analysis of Oxygen Index to Support Candle-Like Combustion of Polyurethane. Procedia Eng. 2017, 172, 604–611. [Google Scholar] [CrossRef]
- Buchanan, A.H. Structural Design for Fire Safety; John Wiley & Sons: Hoboken, NJ, USA, 2001. [Google Scholar]
- Ministry of Health and Welfare. Enforcement Rule of Welfare of Senior Citizens Act. Article 22. 2022. Available online: https://elaw.klri.re.kr/kor_mobile/viewer.do?hseq=53997&type=sogan&key=10 (accessed on 26 January 2022).
- Ministry of Health and Welfare. 7th Meeting of the Health Insurance Policy Review Committee. 2019. Available online: http://www.mohw.go.kr/react/al/sal0301vw.jsp?PAR_MENU_ID=04&MENU_ID=0403&page=1&CONT_SEQ=349273 (accessed on 26 January 2022). (In Korean).
- BS DD 240-1:1997; Fire Safety Engineering in Buildings Part 1: Guide to the Application of Fire Safety Engineering Principles. British Standard Institute: London, UK, 1997; pp. 1–108.
- Ministry of Public Safety and Security (MPSS). Methods and Standard of the Performance-Oriented Design for Fire Facilities. Notification No. 2016-30, Fire Prevention Division. 2016. Available online: https://www.law.go.kr/ (accessed on 26 January 2022). (In Korean).
Publisher’s Note: MDPI stays neutral with regard to jurisdictional claims in published maps and institutional affiliations. |
© 2022 by the authors. Licensee MDPI, Basel, Switzerland. This article is an open access article distributed under the terms and conditions of the Creative Commons Attribution (CC BY) license (https://creativecommons.org/licenses/by/4.0/).