
Effects of Temperature on Corrosion Behavior of Reinforcements in Simulated Sea-Sand Concrete Pore Solution


Abstract
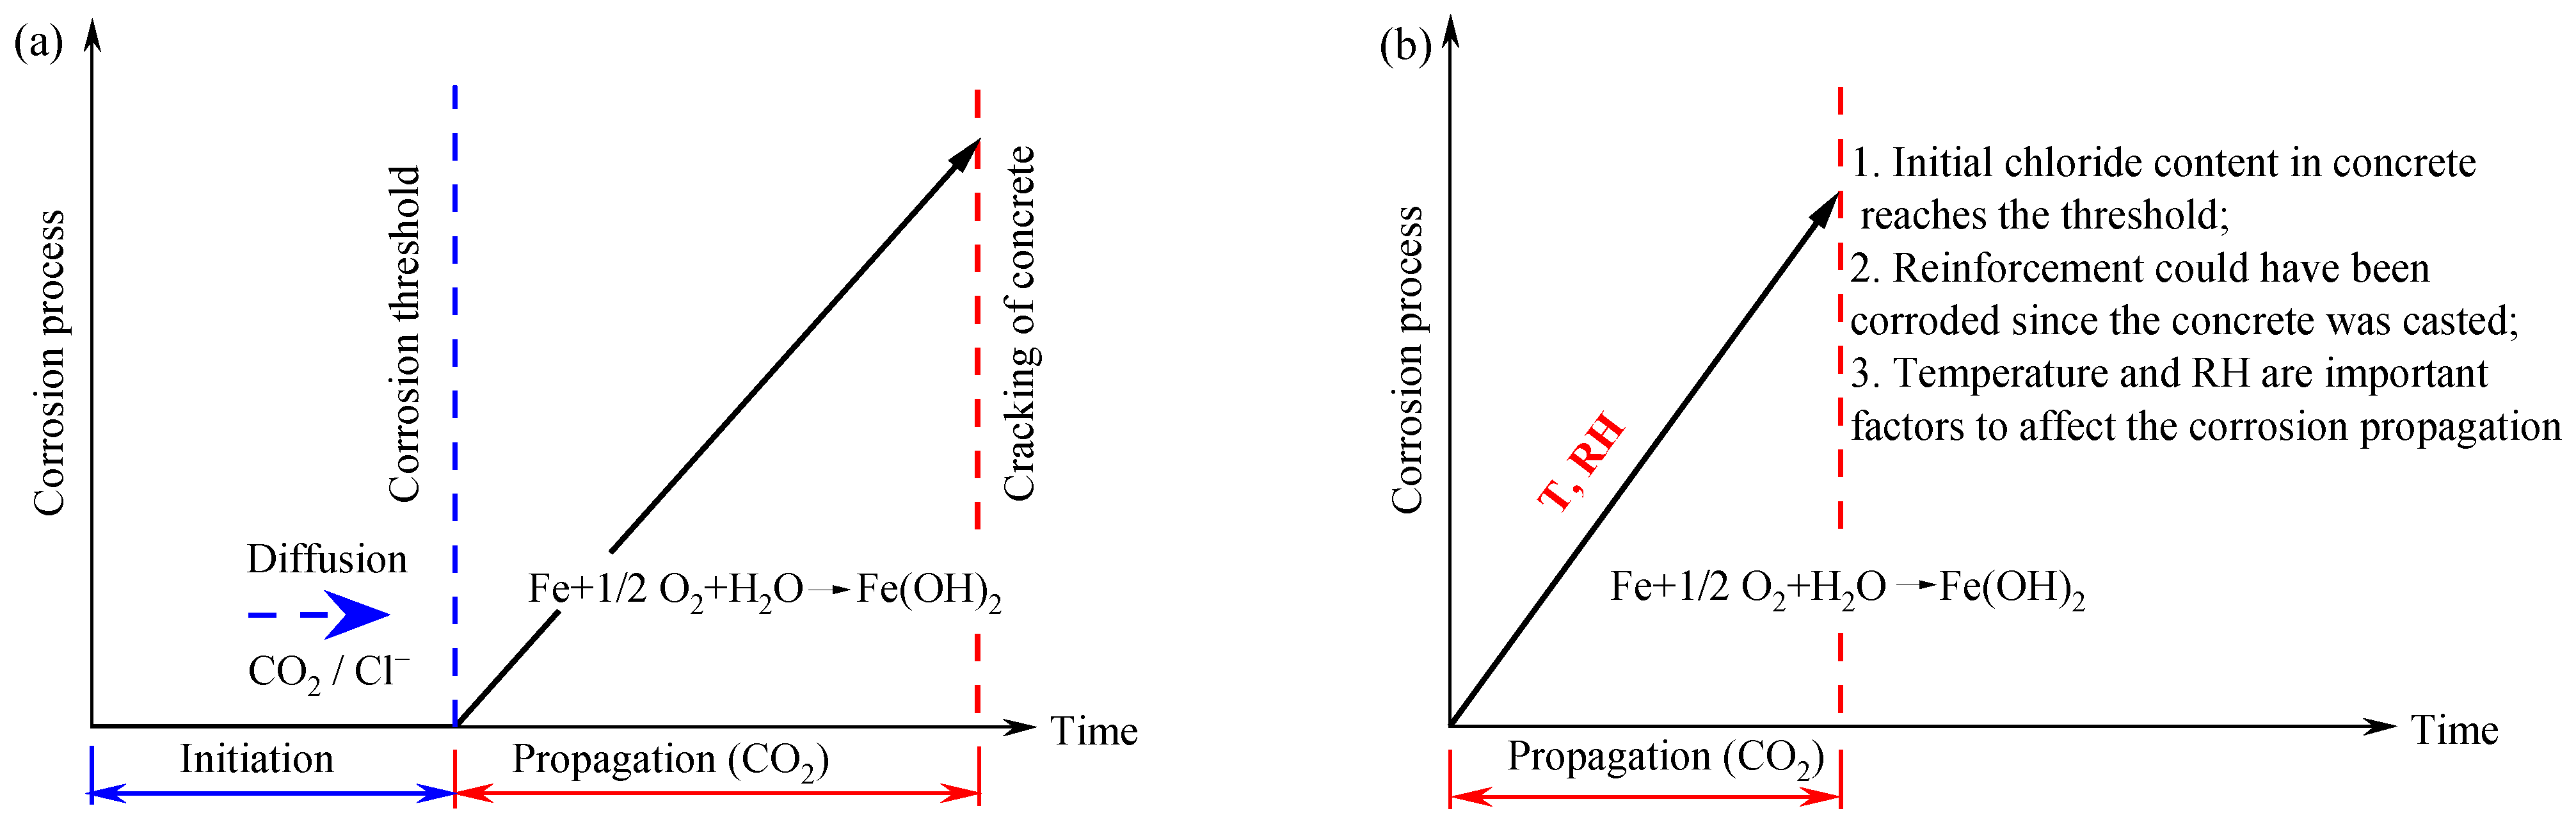
:1. Introduction
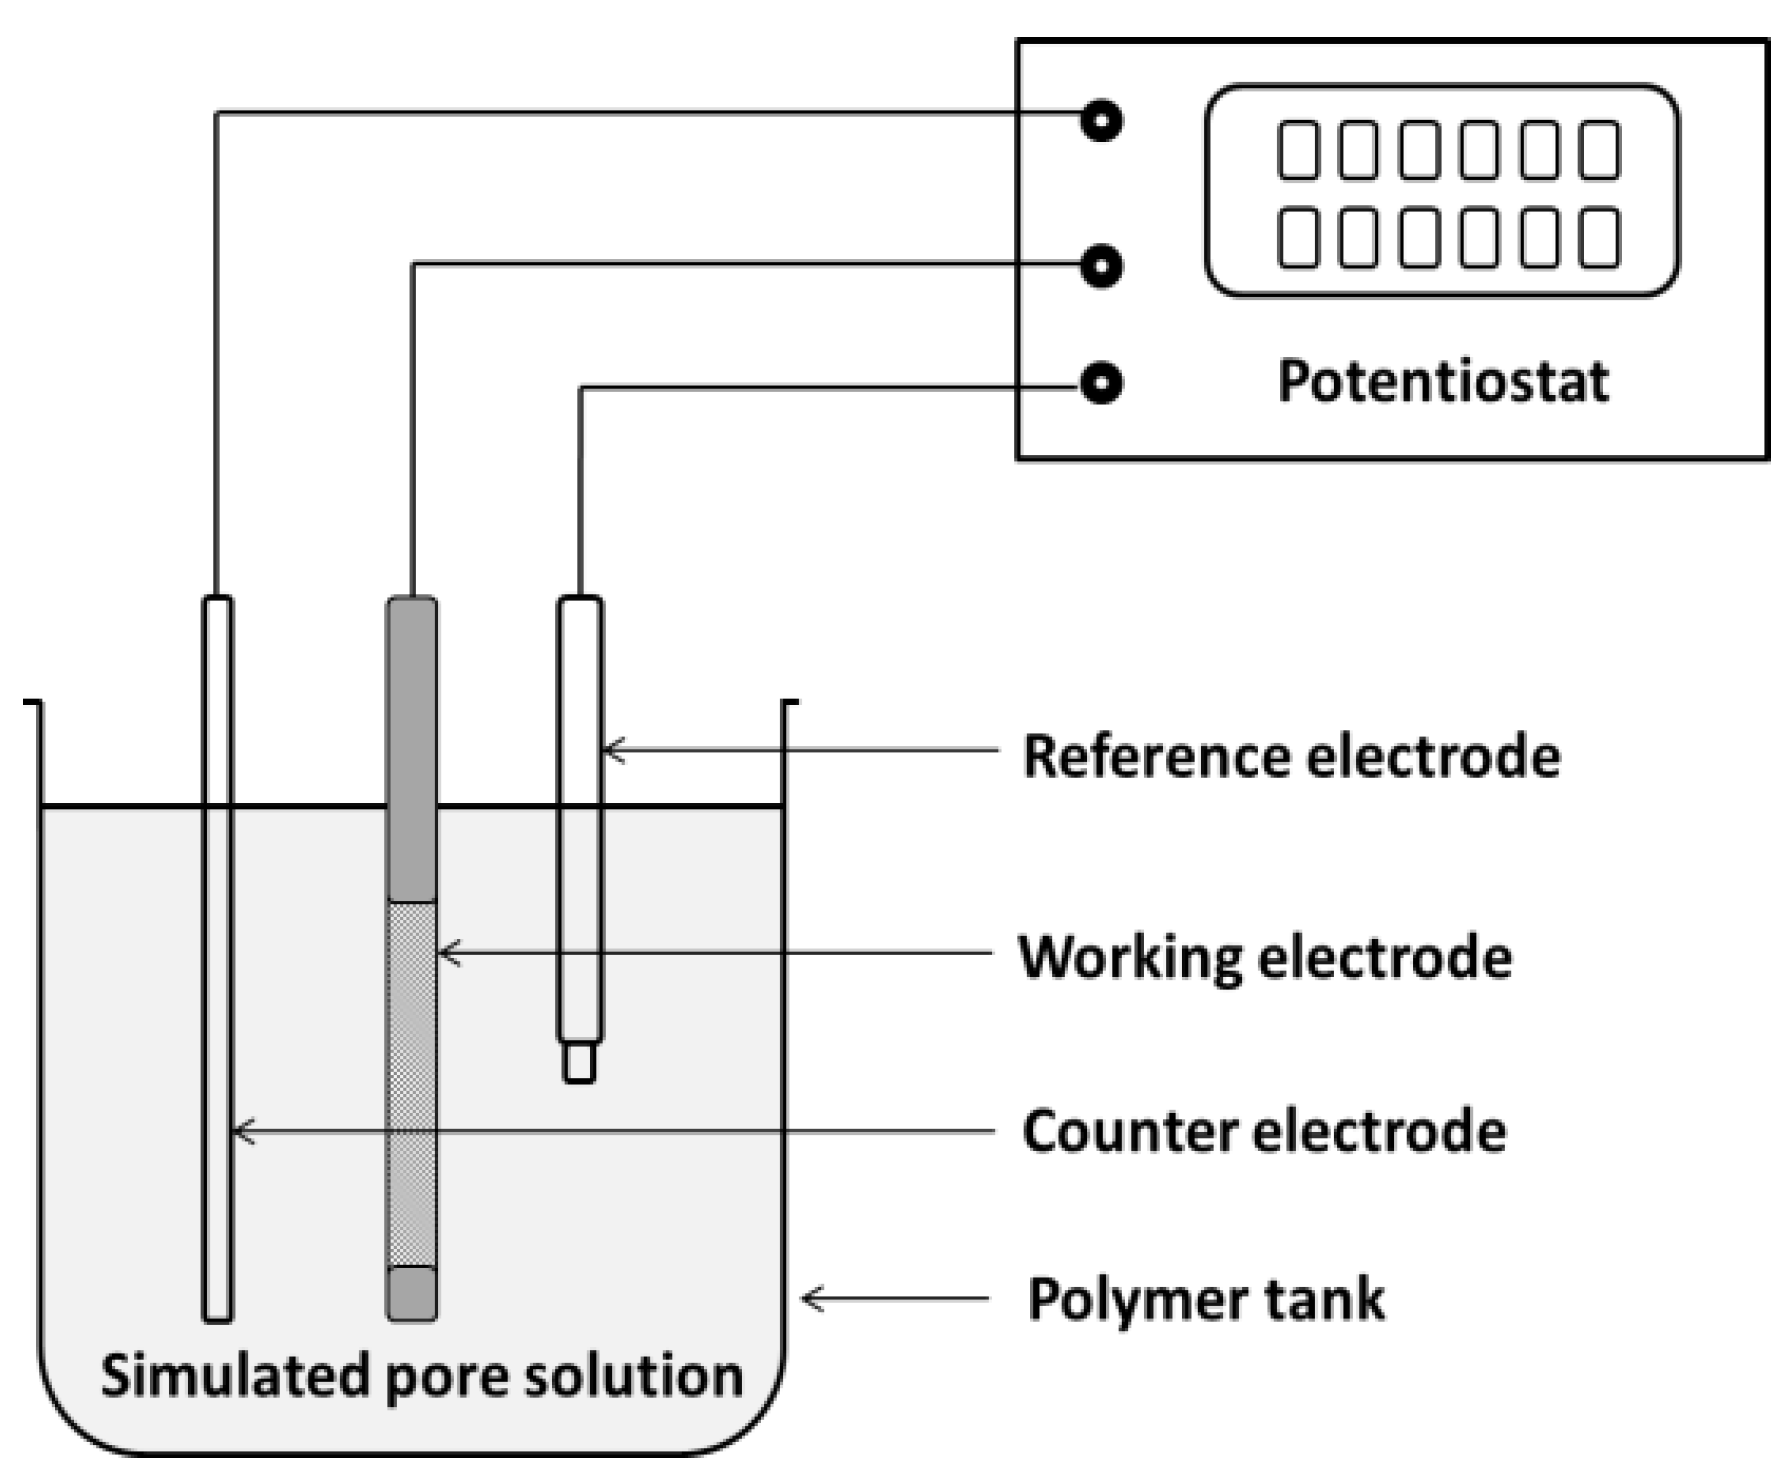
2. Experimental Program
- (a)
- The samples are immersed in acid solution, containing HCl (HCl: H2O = 1:1 by volume) and urotropine (3 g/L).
- (b)
- After a 2~3 min ultrasonic shower, oxide skins and surface corrosion are cleaned with a brush.
- (c)
- The samples are rinsed with deionized water and are soaked in acetone solution for 2~3 s.
- (d)
- Copper wire is welded at one end of each steel sample after drying.
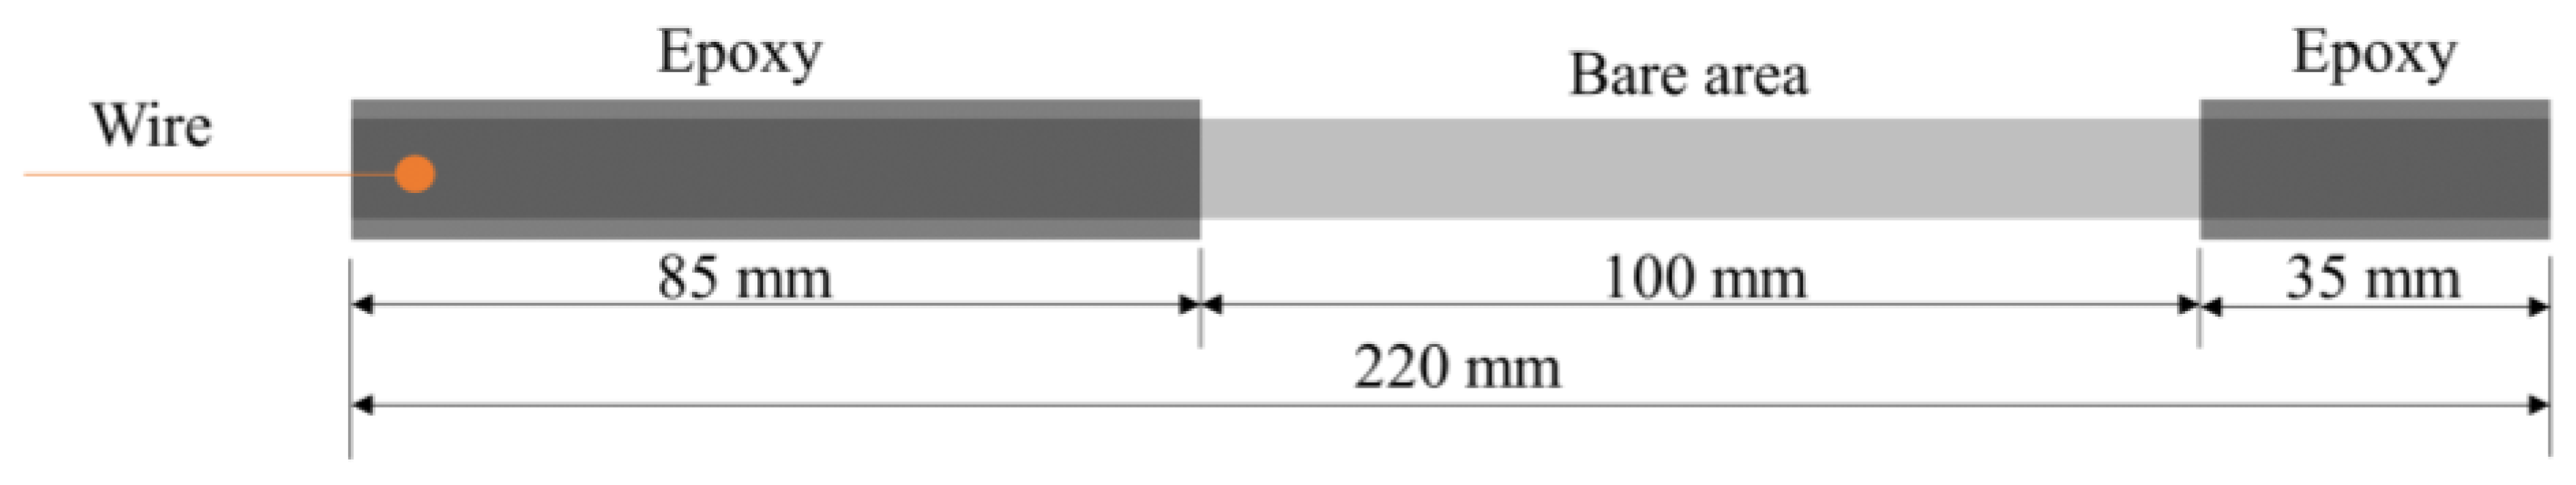
- (e)
- Both ends of each sample are coated with epoxy resin, leaving a 10 cm length uncoated (a sketch of the coating geometry is shown in Figure 2).
3. Results and Analysis
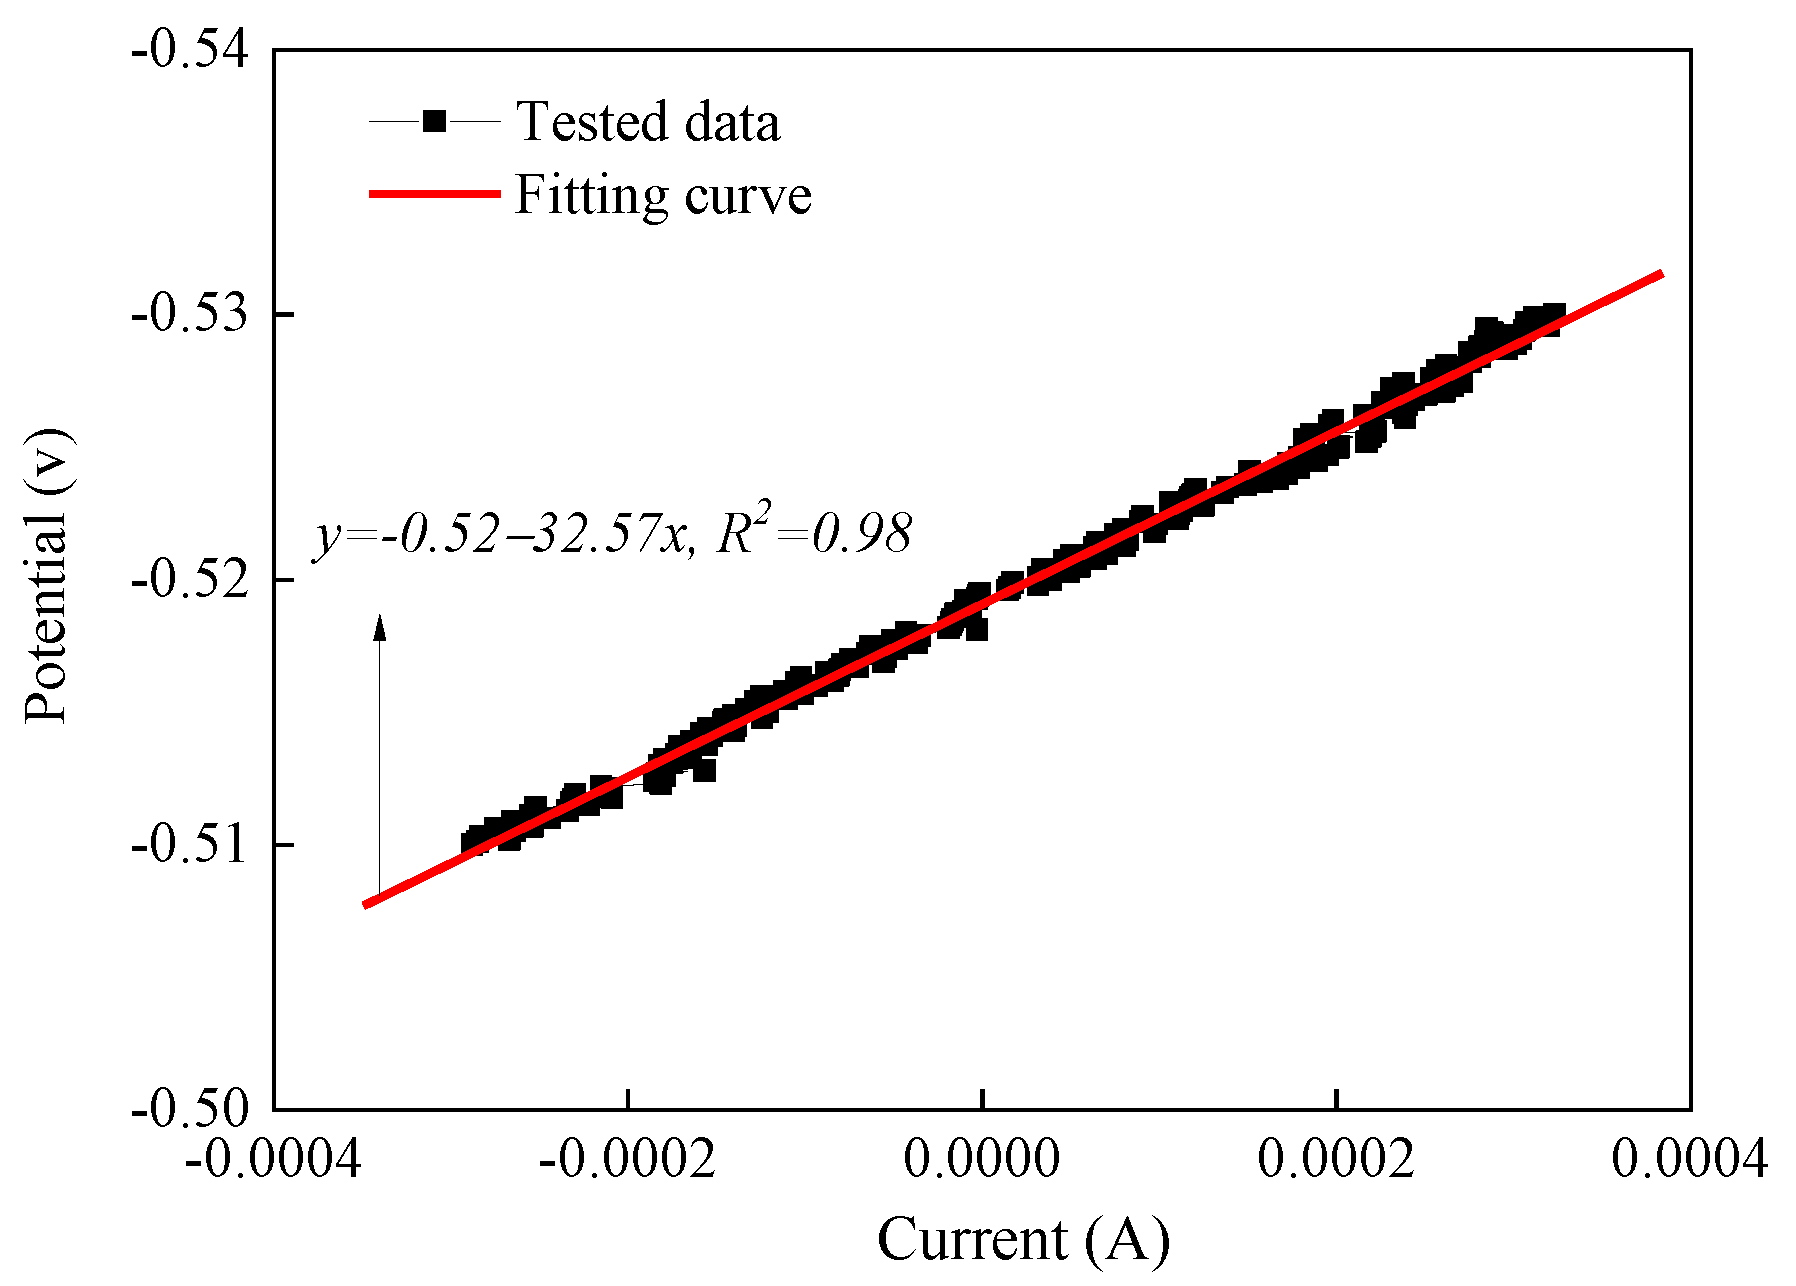
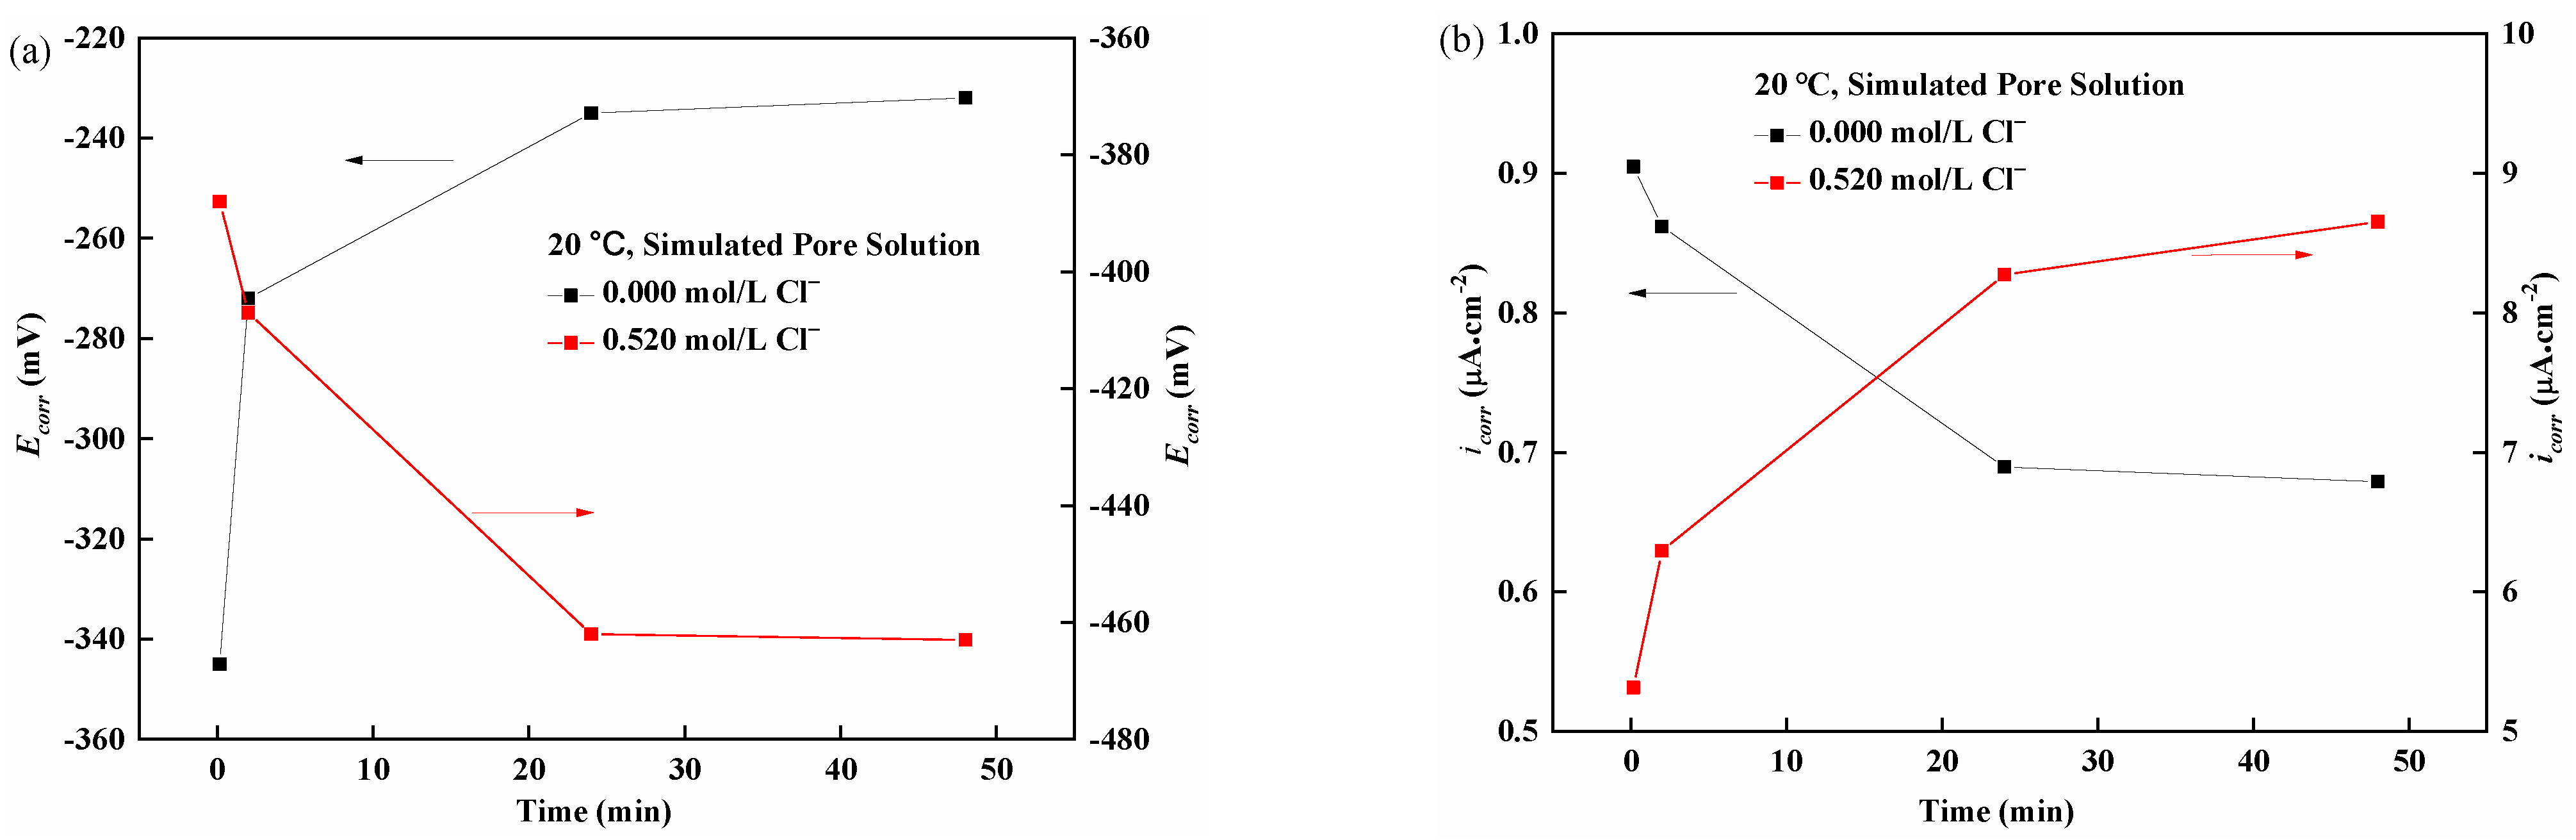
3.1. Classical Testing Curve for Corrosion Potential and Corrosion Current Density
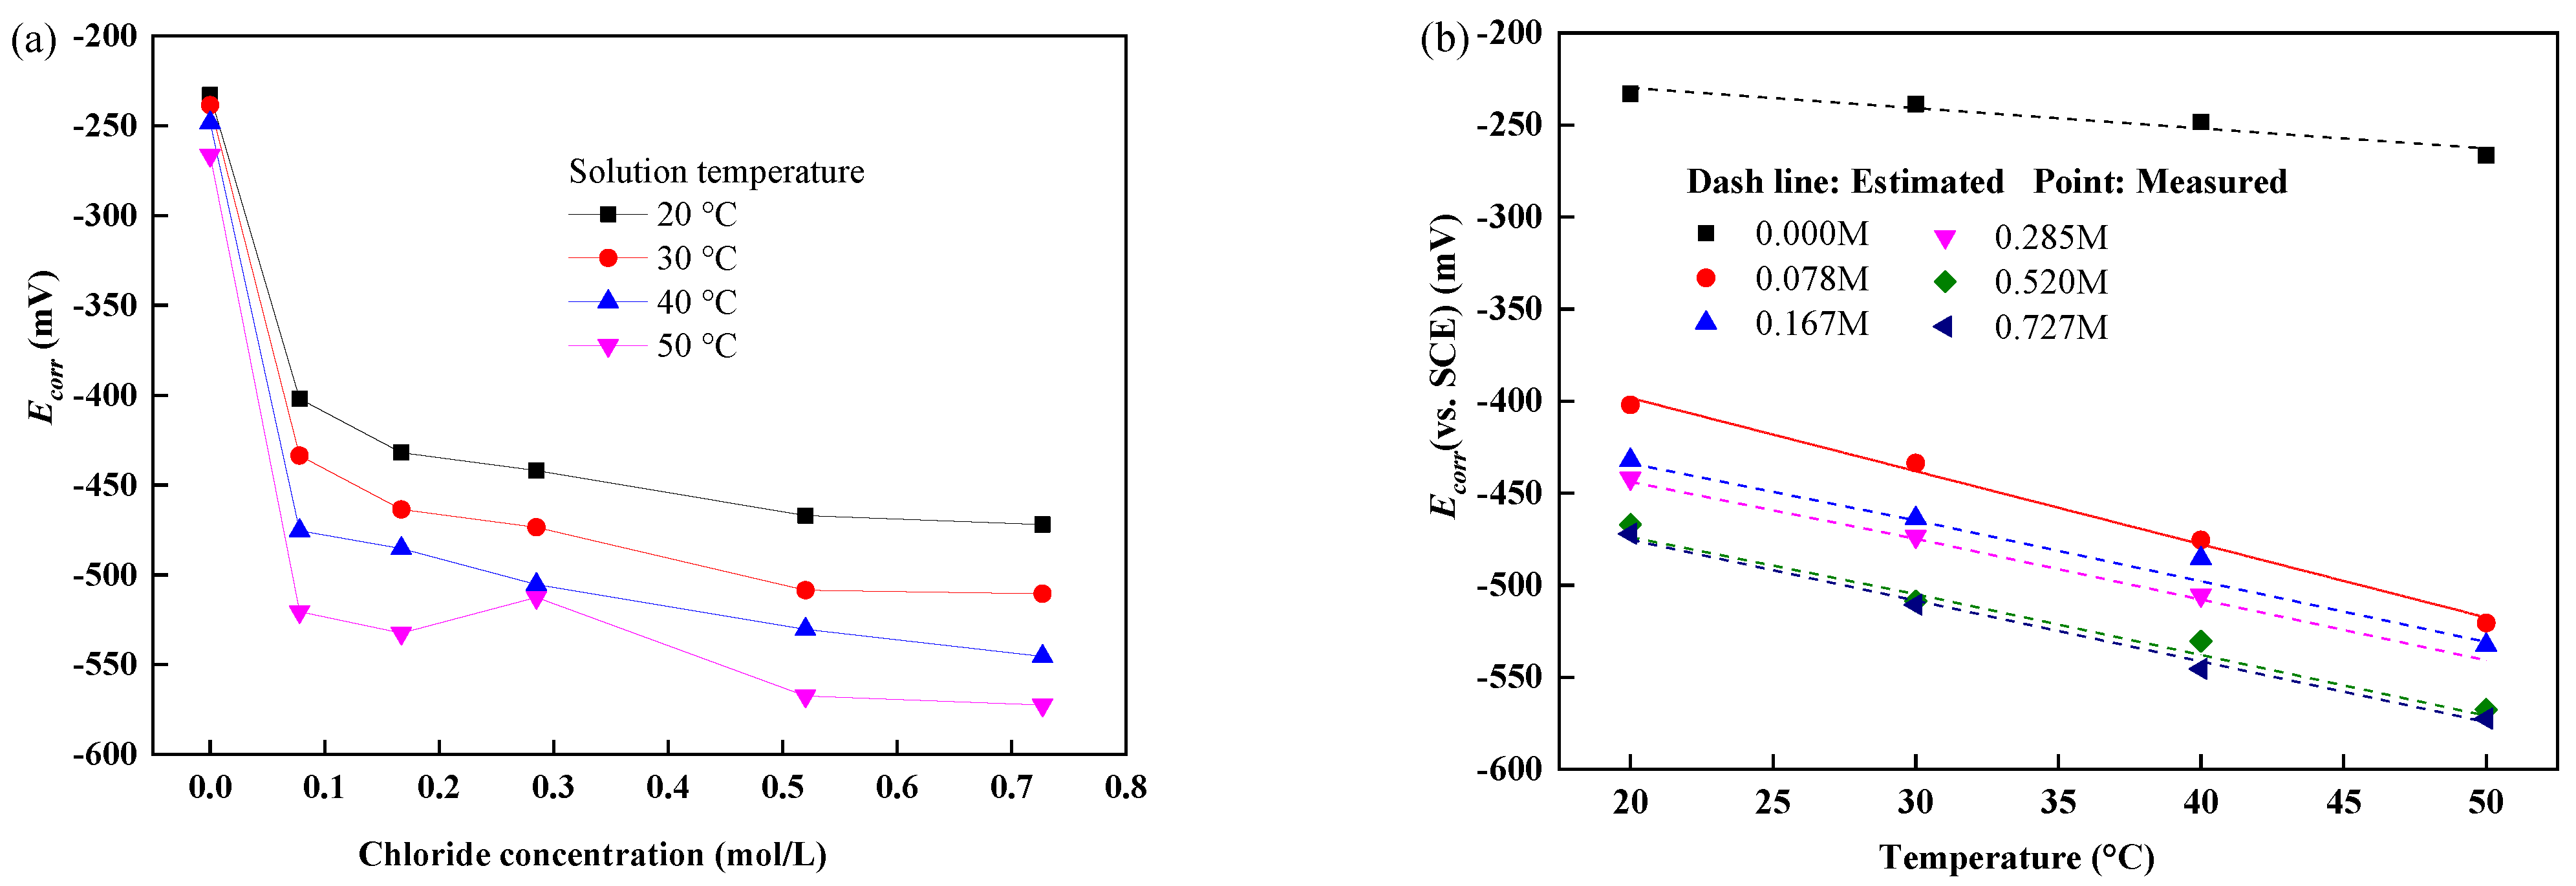
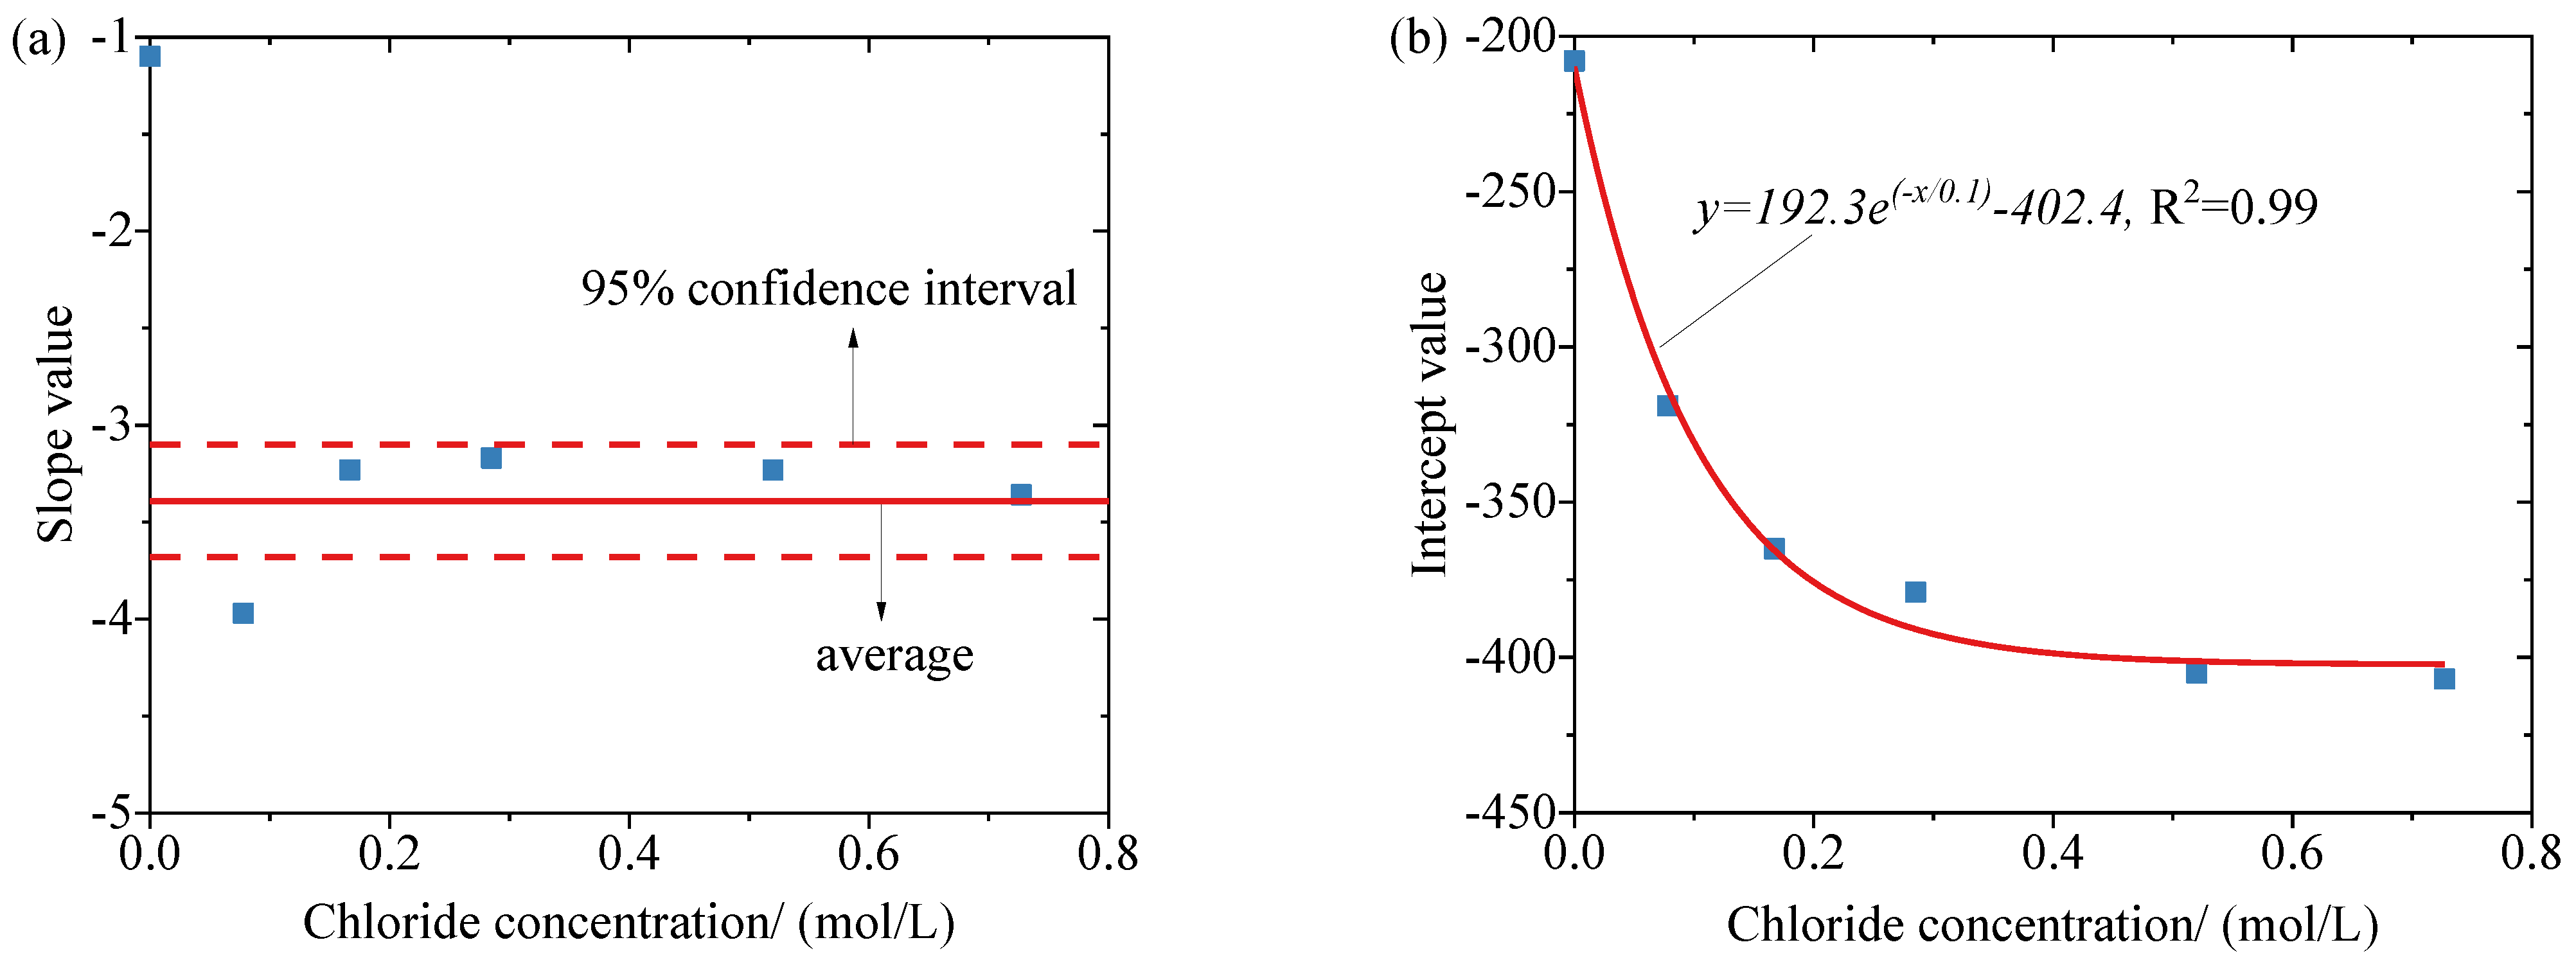
3.2. Corrosion Potential of Reinforcement at Different Temperatures and Chloride Concentrations
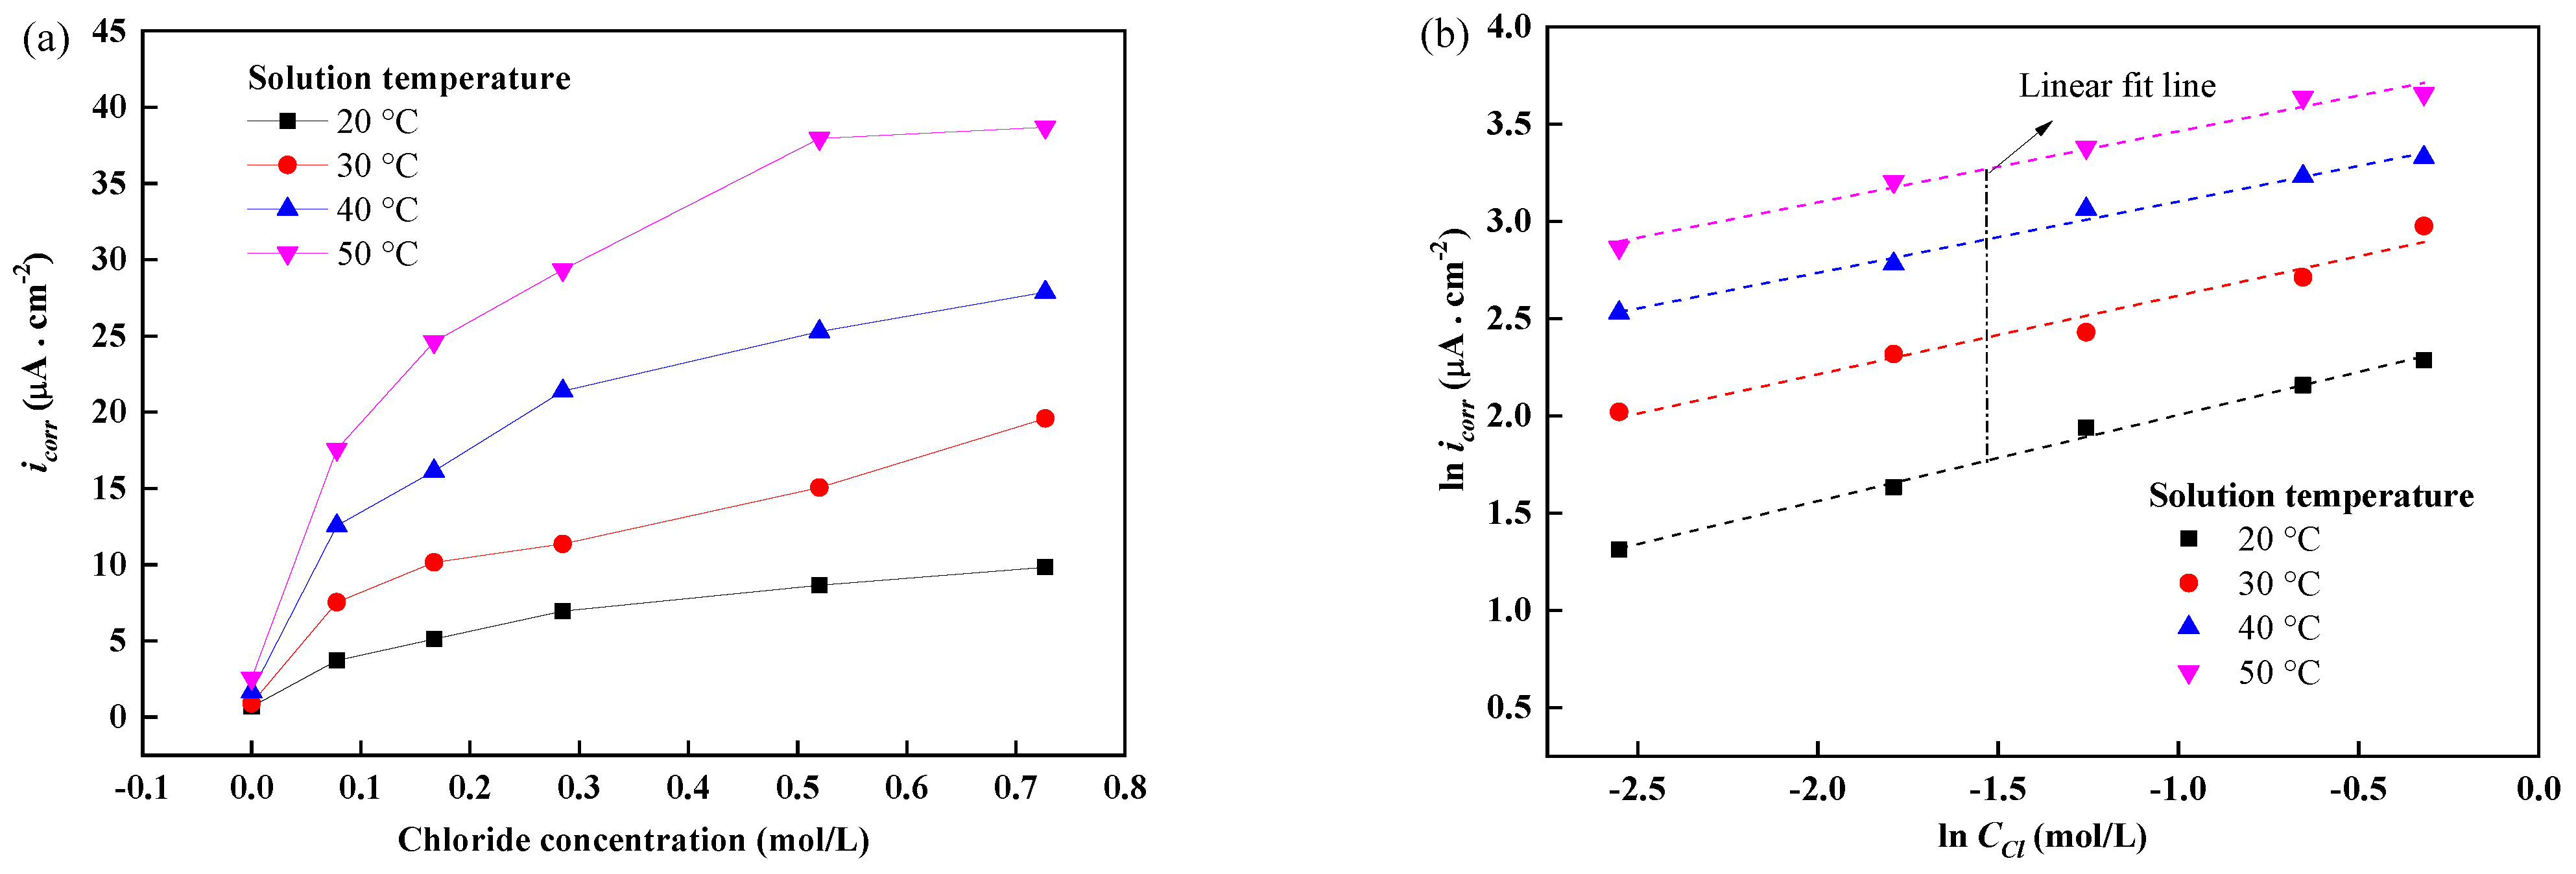
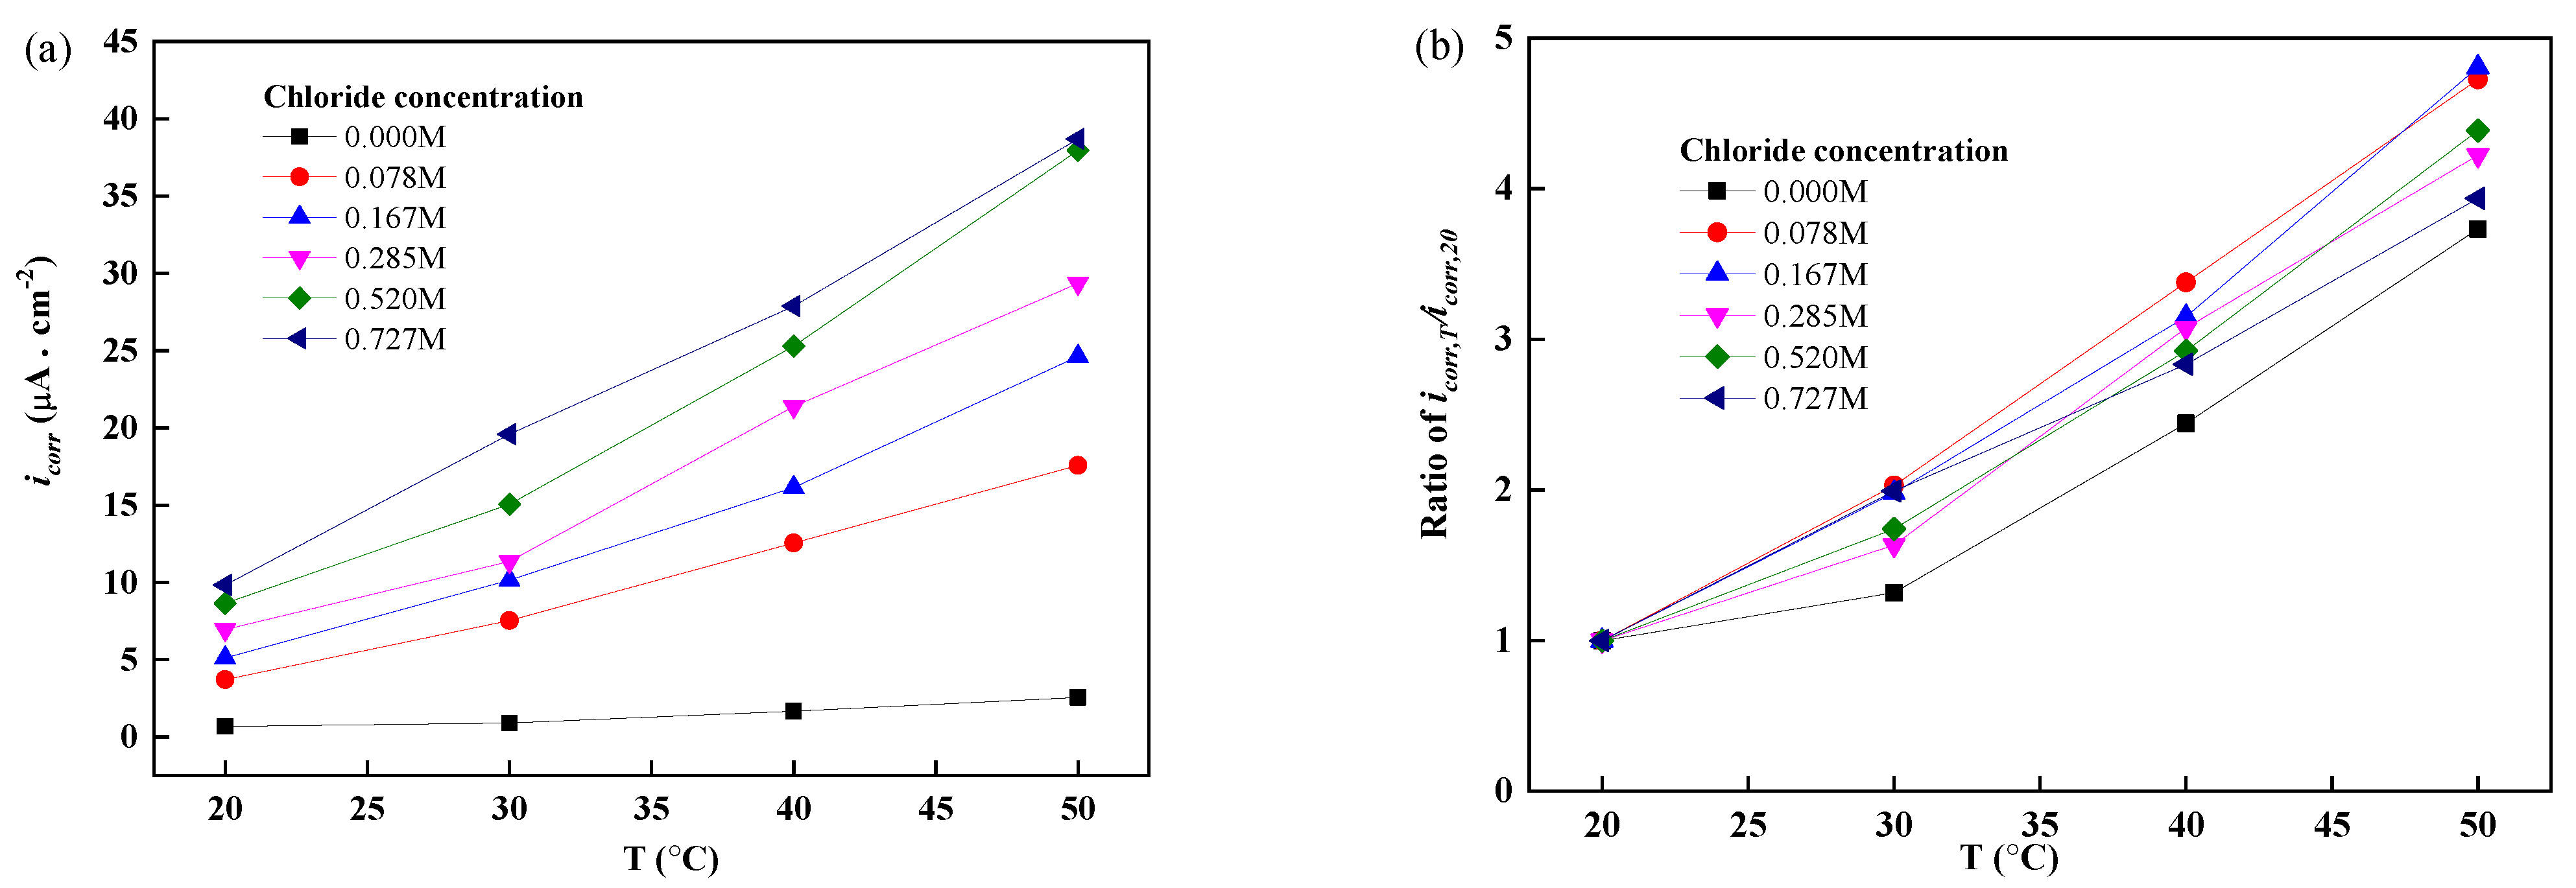
3.3. Corrosion Current Density of Reinforcements at Different Temperatures and Chloride Concentrations
4. Conclusions
Author Contributions
Funding
Data Availability Statement
Acknowledgments
Conflicts of Interest
References
- Hope, B.; Page, J.; Ip, A. Corrosion rates of steel in concrete. Cem. Concr. Res. 1986, 16, 771–781. [Google Scholar] [CrossRef]
- GB/T 14684-2011; Sand for Construction. The General Administration of Quality Supervision Inspection and Quarantine and the Standardization Administration of the People’s Republic of China: Beijing, China, 2011.
- JIS A 5308; Ready-Mixed Concrete. 2009. Available online: https://www.wdfxw.net/doc34805001.htm (accessed on 13 February 2022).
- Juenger, M.C.; Jennings, H.M. Effects of high alkalinity on cement pastes. ACI Mater. J. 2001, 98, 251–255. [Google Scholar]
- Tang, S.; Yao, Y.; Andrade, C.; Li, Z. Recent durability studies on concrete structure. Cem. Concr. Res. 2015, 78, 143–154. [Google Scholar] [CrossRef]
- Guo, M.; Hu, B.; Xing, F.; Zhou, X.; Sun, M.; Sui, L.; Zhou, Y. Characterization of the mechanical properties of eco-friendly concrete made with untreated sea sand and seawater based on statistical analysis. Constr. Build. Mater. 2020, 234, 117339. [Google Scholar] [CrossRef]
- Page, C.; Treadaway, K. Aspects of the electrochemistry of steel in concrete. Nature 1982, 297, 109–115. [Google Scholar] [CrossRef]
- Hou, D.; Zhang, K.; Hong, F.; Wu, S.; Wang, Z.; Li, M.; Wang, M. The corrosion deterioration of reinforced passivation film: The impact of defects. Appl. Surf. Sci. 2022, 319, 126142. [Google Scholar] [CrossRef]
- Jin, Z.; Zhao, X.; Du, Y.; Yang, S.; Wang, D.; Zhao, T.; Bai, Y. Comprehensive properties of passive film formed in simulated pore solution of alkali-activated concrete. Constr. Build. Mater. 2022, 319, 126142. [Google Scholar] [CrossRef]
- Tuutti, K. Corrosion of Steel in Concrete; Cement and Concrete Research Institute: Stockholm, Sweden, 1982; pp. 115–129. [Google Scholar] [CrossRef]
- Jiang, J.H.; Yuan, Y.S. Development and prediction strategy of steel corrosion rate in concrete under natural climate. Constr. Build. Mater. 2013, 44, 287–292. [Google Scholar] [CrossRef]
- Liu, T.; Weyers, R.W. Modeling the dynamic corrosion process in chloride contaminated concrete structures. Cem. Concr. Res. 1998, 28, 365–379. [Google Scholar] [CrossRef]
- Pan, C.; Cui, Y.; Liu, L.; Guo, M.; Wang, Z. Effect of temperature on corrosion behavior of low-alloy steel exposed to a simulated marine atmospheric environment. J. Mater. Eng. Perform. 2020, 29, 1400–1409. [Google Scholar] [CrossRef]
- Zivica, V.; Krajči, L.; Bagel, L.; Vargová, M. Significance of the ambient temperature and the steel material in the process of concrete reinforcement corrosion. Constr. Build. Mater. 1997, 11, 99–103. [Google Scholar] [CrossRef]
- Alhozaimy, A.; Hussain, R.; Al-Zaid, R.; Al-Negheimish, A. Coupled effect of ambient high relative humidity and varying temperature marine environment on corrosion of reinforced concrete. Constr. Build. Mater. 2012, 28, 55–64. [Google Scholar] [CrossRef]
- Andrade, C.; Alonso, C.; Sarría, J. Corrosion rate evolution in concrete structures exposed to the atmosphere. Cem. Concr. Compos. 2002, 24, 55–64. [Google Scholar] [CrossRef]
- Michel, A.; Nygaard, P.V.; Geiker, M. Experimental investigation on the short-term impact of temperature and moisture on reinforcement corrosion. Corros. Sci. 2013, 72, 26–34. [Google Scholar] [CrossRef]
- López, W.; González, J.A.; Andrade, C. Influence of temperature on the service life of rebars. Cem. Concr. Res. 1993, 23, 1130–1140. [Google Scholar] [CrossRef]
- Shi, J.; Sun, W.; Jiang, J.; Zhang, Y. Influence of chloride concentration and pre-passivation on the pitting corrosion resistance of low-alloy reinforcing steel in simulated concrete pore solution. Constr. Build. Mater. 2016, 111, 805–813. [Google Scholar] [CrossRef]
- Zhang, S.; Hou, L.; Du, H.; Wei, H.; Liu, B.; Wei, Y. A study on the interaction between chloride ions and CO2 towards carbon steel corrosion. Corros. Sci. 2020, 167, 108531. [Google Scholar] [CrossRef]
- Jin, S.H.; Yang, H.J.; Hwang, J.P.; Ann, K.Y. Corrosion behaviour of steel in CAC-mixed concrete containing different concentrations of chloride. Constr. Build. Mater. 2016, 110, 227–234. [Google Scholar] [CrossRef]
- Feng, W.; Tarakbay, A.; Ali Memon, S.; Tang, W.; Cui, H. Methods of accelerating chloride-induced corrosion in steel-reinforced concrete: A comparative review. Constr. Build. Mater. 2021, 289, 123165. [Google Scholar] [CrossRef]
- Noushini, A.; Castel, A.; Aldred, J.; Rawal, A. Chloride diffusion resistance and chloride binding capacity of fly ash-based geopolymer concrete. Cem. Concr. Compos. 2020, 105, 103290. [Google Scholar] [CrossRef]
- Yu, Y.; Chen, X.; Gao, W.; Wu, D.; Castel, A. Modelling non-isothermal chloride ingress in unsaturated cement-based materials. Constr. Build. Mater. 2019, 217, 441–455. [Google Scholar] [CrossRef]
- Yu, Y.; Gao, W.; Castel, A.; Chen, X.; Liu, A. An integrated framework for modelling time-dependent corrosion propagation in offshore concrete structures. Eng. Struct. 2021, 228, 111482. [Google Scholar] [CrossRef]
- Alhozaimy, A.; Hussain, R.R.; Al-Negheimish, A.; Al-Zaid, R.; Singh, D.D.N. Effect of simulated concrete pore solution chemistry, chloride ions, and temperature on passive layer formed on steel reinforcement. ACI Mater. J. 2014, 111, 411–421. [Google Scholar] [CrossRef]
- Hussain, R.R.; Ishida, T. Enhanced electro-chemical corrosion model for reinforced concrete under severe coupled action of chloride and temperature. Constr. Build. Mater. 2011, 25, 1305–1315. [Google Scholar] [CrossRef]
- Tang, L.P.; Frederiksen, J.M.; Angst, U.; Polder, R.; Alonso, M.; Elsener, B.; Hooton, D.; Pacheco, J. Experiences from RILEM TC 235-CTC in recommending a test method for chloride threshold values in concrete. RILEM Tech. Lett. 2018, 3, 25–31. [Google Scholar] [CrossRef]
- Bensabra, H.; Azzouz, N. Study of rust effect on the corrosion behavior of reinforcement steel using impedance spectroscopy. Metall. Mater. Trans. 2013, 44, 5703–5710. [Google Scholar] [CrossRef]
- Saremi, M.; Mahallati, E. A study on chloride-induced depassivation of mild steel in simulated concrete pore solution. Cem. Concr. Res. 2002, 32, 1915–1921. [Google Scholar] [CrossRef]
- Bautista, A.; Blanco, G.; Velasco, F. Corrosion behaviour of low-nickel austenitic stainless steels reinforcements: A comparative study in simulated pore solutions. Cem. Concr. Res. 2006, 36, 1922–1930. [Google Scholar] [CrossRef]
- Alvarez, S.; Bautista, A.; Velasco, F. Corrosion behaviour of corrugated lean duplex stainless steels in simulated concrete pore solutions. Corros. Sci. 2011, 53, 1748–1755. [Google Scholar] [CrossRef]
- Zheng, H.; Li, W.; Ma, F.; Kong, Q. The performance of a surface-applied corrosion inhibitor for the carbon steel in saturated Ca(OH)2 solutions. Cem. Concr. Res. 2014, 55, 102–108. [Google Scholar] [CrossRef]
- Williamson, J.; Isgor, O.B. The effect of simulated concrete pore solution composition and chlorides on the electronic properties of passive films on carbon steel rebar. Corros. Sci. 2016, 106, 82–95. [Google Scholar] [CrossRef]
- ASTM G59-97(2014); Standard Test Method for Conducting Potentiodynamic Polarization Resistance Measurements. West Conshohocken: Montgomery, PA, USA, 1967.
- Zhao, Y.; Pan, T.; Yu, X.; Chen, D. Corrosion inhibition efficiency of triethanolammonium dodecylbenzene sulfonate on Q235 carbon steel in simulated concrete pore solution. Corros. Sci. 2019, 158, 108097. [Google Scholar] [CrossRef]
- Zhi, F.; Jiang, L.; Jin, M.; Xu, P.; Xiao, B.; Jiang, Q.; Chen, L.; Gu, Y. Inhibition effect and mechanism of polyacrylamide for steel corrosion in simulated concrete pore solution. Constr. Build. Mater. 2020, 259, 120425. [Google Scholar] [CrossRef]
- Qiu, J.; Li, Y.; Xu, Y.; Wu, A.; Macdonald, D.D. Effect of temperature on corrosion of carbon steel in simulated concrete pore solution under anoxic conditions. Corros. Sci. 2020, 175, 108886. [Google Scholar] [CrossRef]
- Yang, H.; Li, W.; Liu, X.; Liu, A.; Hang, P.; Ding, R.; Li, T.; Zhang, Y.; Wang, W.; Xiong, C. Preparation of corrosion inhibitor loaded zeolites and corrosion resistance of carbon steel in simulated concrete pore solution. Constr. Build. Mater. 2019, 225, 90–98. [Google Scholar] [CrossRef]
- Zhang, H.; Yan, Z.C.; Shen, K.C.; Chen, Q.; Zhang, L.C.; Li, X.Y.; Wang, W.M. Potentiodynamic and potentiostatic investigation on the passivation of Fe based glassy alloys in alkaline solution. J. Alloys Compd. 2021, 857, 157573. [Google Scholar] [CrossRef]
- Lu, P.; Kursten, B.; Macdonald, D.D. Deconvolution of the Partial Anodic and Cathodic Processes during the Corrosion of Carbon Steel in Concrete Pore Solution under Simulated Anoxic Conditions. Electrochim. Acta 2014, 143, 312–323. [Google Scholar] [CrossRef]
- Hausmann, D.A. Steel corrosion in concrete. Mater. Prot. 1967, 6, 19–23. [Google Scholar]
- Jiang, L.; Huang, G.; Xu, J.; Zhu, Y.; Mo, L. Influence of chloride salt type on threshold level of reinforcement corrosion in simulated concrete pore solutions. Constr. Build. Mater. 2012, 30, 516–521. [Google Scholar] [CrossRef]
- Yu, H.; Chiang, K.-T.; Yang, L. Threshold chloride level and characteristics of reinforcement corrosion initiation in simulated concrete pore solutions. Constr. Build. Mater. 2012, 26, 723–729. [Google Scholar] [CrossRef]
- Abd El Aal, E.E.D.; Wanees, S.; Diab, A.; Abd El Haleem, S. Environmental factors affecting the corrosion behavior of reinforcing steel III. Measurement of pitting corrosion currents of steel in Ca(OH)2 solutions under natural corrosion conditions. Corros. Sci. 2009, 51, 1611–1618. [Google Scholar] [CrossRef]
- Jovic, V.; Jović, B. EIS and differential capacitance measurements onto single crystal faces in different solutions: Part I—Ag(111) in 0.01 M NaCl. J. Electroanal. Chem. 2003, 541, 1–11. [Google Scholar] [CrossRef]
- Silva, N. Chloride induced Corrosion of Reinforcement Steel in Concrete-Threshold Values and Ion Distributions at the Concrete-Steel Interface. Ph.D. Thesis, Chalmers University of Technology, Gothenburg, Sweden, 2013; pp. 23–42. [Google Scholar]
- Cohen Stuart, C.P. A Study of Temperature-Coefficients and Van’t Hoff’s Rule. Koninklijke Nederlandse Akademie van Wetenschappen Proceedings Series B Physical Sciences, 14, pp. 1159–1173. Available online: https://ui.adsabs.harvard.edu/abs/1912KNAB...14.1159C/abstract (accessed on 13 February 2022).
- Popova, A.; Sokolova, E.; Raicheva, S.; Christov, M. AC and DC study of the temperature effect on mild steel corrosion in acid media in the presence of benzimidazole derivatives. Corros. Sci. 2003, 45, 33–58. [Google Scholar] [CrossRef]
- Blasco-Tamarit, E.; Igual-Muñoz, A.; Antón, J.; García-García, D. Effect of temperature on the corrosion resistance and pitting behaviour of Alloy 31 in LiBr solutions. Corros. Sci. 2008, 50, 1848–1857. [Google Scholar] [CrossRef]
- Stern, M.; Geary, A.L. Electrochemical polarization I. A theoretical analysis of the shape of polarization curves. J. Electrochem. Soc 1957, 104, 56–63. [Google Scholar] [CrossRef]
- Stern, M. A method for determining corrosion rates from linear polarization pata. Corrosion 1958, 14, 60–64. [Google Scholar] [CrossRef]
- Andrade, C. Quantitative measurements of corrosion rate of reinforcing steels embedded in concrete using polarization resistance measurement. Mater. Corros. 1978, 29, 515–519. [Google Scholar] [CrossRef]
- Andrade, C.; Castelo, V.; Alonso, C.; Gonzalez, J.A. Corrosion effect of stray currents and the techniques for evaluating corrosion of rebars in concret. In The Determination of the Corrosion Rate of Steel Embedded in Concrete by the Polarization Resistance and AC Impedance Methods; ASTM Spec. Tech. Publ.: West Conshohocken, PA, USA, 1986; pp. 43–63. [Google Scholar] [CrossRef]
- Gastaldi, M.; Bertolini, L. Effect of temperature on the corrosion behaviour of low-nickel duplex stainless steel bars in concrete. Cem. Concr. Res. 2014, 56, 52–60. [Google Scholar] [CrossRef]


| Fe | C | Mn | Si | P | S |
|---|---|---|---|---|---|
| 98.96 | 0.21 | 0.63 | 0.17 | 0.005 | 0.026 |
Publisher’s Note: MDPI stays neutral with regard to jurisdictional claims in published maps and institutional affiliations. |
© 2022 by the authors. Licensee MDPI, Basel, Switzerland. This article is an open access article distributed under the terms and conditions of the Creative Commons Attribution (CC BY) license (https://creativecommons.org/licenses/by/4.0/).
Share and Cite
Xia, S.; Luo, Y.; Li, Y.; Liu, W.; Ding, X.; Tang, L. Effects of Temperature on Corrosion Behavior of Reinforcements in Simulated Sea-Sand Concrete Pore Solution. Buildings 2022, 12, 407. https://doi.org/10.3390/buildings12040407
Xia S, Luo Y, Li Y, Liu W, Ding X, Tang L. Effects of Temperature on Corrosion Behavior of Reinforcements in Simulated Sea-Sand Concrete Pore Solution. Buildings. 2022; 12(4):407. https://doi.org/10.3390/buildings12040407
Chicago/Turabian StyleXia, Song, Yaoming Luo, Yongqiang Li, Wei Liu, Xiaobo Ding, and Luping Tang. 2022. "Effects of Temperature on Corrosion Behavior of Reinforcements in Simulated Sea-Sand Concrete Pore Solution" Buildings 12, no. 4: 407. https://doi.org/10.3390/buildings12040407
APA StyleXia, S., Luo, Y., Li, Y., Liu, W., Ding, X., & Tang, L. (2022). Effects of Temperature on Corrosion Behavior of Reinforcements in Simulated Sea-Sand Concrete Pore Solution. Buildings, 12(4), 407. https://doi.org/10.3390/buildings12040407