Article

Experimental and Numerical Study on the Insulation Performance of a Photo-Thermal Roof in Hot Summer and Cold Winter Areas

1
College of Civil Engineering and Mechanics, Xiangtan University, Xiangtan 411105, China
2
Wenzhou Industrial Design Institute Co., Ltd., Wenzhou 325000, China
3
College of Civil Engineering, Hunan University, Changsha 410082, China
*
Author to whom correspondence should be addressed.
Buildings 2022, 12(4), 410; https://doi.org/10.3390/buildings12040410
Submission received: 22 February 2022 / Revised: 24 March 2022 / Accepted: 26 March 2022 / Published: 28 March 2022
(This article belongs to the Topic Building Energy and Environment)

Abstract

:
The use of a solar architecture system is a feasible way to reduce the energy consumption of a building. The system also has important significance to the “Dual-carbon” plan. In this study, the heat transfer characteristics of a photo-thermal roof were analyzed in hot summer and cold winter zones; a model to calculate insulation performance was established. In the summer climate, the thermal performances of the photo-thermal roof and an ordinary roof were explored through experiments and simulations. The results showed that the heat transfer and temperature of the photo-thermal roof were lower than those of the ordinary roof. Heat transfer through a photo-thermal roof can be changed by adjusting the water flow of collectors. The water saturation of insulation materials is an important factor that affects the insulation performance of a roof. Compared with the ordinary roof, the change in water saturation was shown to have less impact on the insulation performance of the photo-thermal roof. The water saturation increased from 0 to 30%, while the heat transfer per unit area of the photo-thermal roof only increased by 0.9 W/m2; 97.3% lower than that of the ordinary roof. The effect of reducing the insulation material thickness was less for the photo-thermal roof than for the ordinary roof. When the insulation material thickness was reduced from 100 mm to 0 mm, the average temperature in the indoor non-working area reached 38.5 °C and 27.1 °C in the ordinary roof and the photo-thermal roof, respectively. The insulation thickness of the photo-thermal roof had little effect on the indoor air temperature. The research results provide a reference for the roof energy-saving design of new buildings and the roof energy-saving transformation of existing buildings.

1. Introduction

In order to ensure the sustainable development of human society, the “Dual-carbon” plan was proposed. The “Dual-carbon” plan is a “carbon emission peak and carbon neutrality” plan. The main way to achieve the goals of the “Dual-carbon” plan is to reduce the consumption of fossil energy to reduce greenhouse gas emissions [1]. Energy consumption by buildings accounts for more than one-third of global energy consumption, and the carbon dioxide emissions of buildings account for 40% of the total emissions worldwide [2,3]. Moreover, with the continuous improvement of people’s living standards, building energy consumption will continue to grow [4,5]. Therefore, it is important to achieve the goals of the “Dual-carbon” plan in the construction field as soon as possible, reduce the energy consumption of buildings and develop renewable energy utilization technology through building energy conservation technology research [6].
In energy-saving building technology, the photovoltaic/thermal system has attracted extensive attention because of its excellent characteristics, such as its renewable and pollution-free nature [7]. Photovoltaic panels, solar collectors, and hybrid systems are the most suitable technologies for energy-saving building applications [8,9]. Most previous research in this field has focused on how to improve the energy efficiency of photovoltaic/thermal systems or has evaluated the economy of these systems [10,11,12,13]. Since the 1990s, many scholars have studied the design of solar heat collectors, photovoltaic panels, and hybrid systems integrated with buildings [14,15,16,17]. Solar collectors and photovoltaic panels combined with roofs have been shown to reach to about 120 °C in summer [18,19]. High temperature collectors and photovoltaic panels can enhance heat transfer to a building through convection, radiation, and other means, thereby affecting building energy consumption and indoor thermal comfort [20,21,22]. Unlike the overheating of photovoltaic panels, the temperature of the collector used to prepare domestic hot water is generally stable at 50–80 °C, and most of the solar radiation energy is used to heat the working medium and is then transferred with the working medium. If the fluid temperature of the solar collector changes, the temperature of the enclosure may change, affecting the indoor thermal environment [23]. Sourek [24] studied the interaction between the collector coupled with the building façade and the building and found that the indoor temperature increased by no more than 1 K in all investigated configurations. Buonomano [25] observed the summer superheating effects by detecting the passive thermal behavior effect of a light building with solar collectors coupled with the building façade in Milan. However, there are many diverse photo-thermal system and architecture combinations. Most previous studies only considered the passive effect of the collector in close contact with the building façade, and ignored the impact of the air gap between the photo-thermal system and the building’s roof [26]. A study conducted in China pointed out that solar radiation absorption by the roof surface can account for more than 40% of the power consumption of the top-floor rooms during hot summer periods [27]. Inhibiting the heat absorption of the roof surface is very important to reduce the energy consumption of the top floor rooms of a building during the summer [28]. Solar collectors assembled on the roof also screen most of the solar rays, but the passive impact is often ignored [29].
China’s dual carbon goals were proposed in 2020, which put forward higher requirements for the utilization of solar energy. Photo-thermal technology is an important technical mean to reduce building energy consumption and carbon emission. It is necessary to understand the influence of photo-thermal system on a building’s thermal environment. Based on the existing literature, it can be found that the current utilization of solar energy in buildings is mainly photothermal utilization. However, the use of solar thermal insulation in buildings is not yet uncommon. Thus, this paper compared the thermal performance of a roof equipped with a field of thermal solar collectors with an air gap and a traditional bare roof in hot summer and cold winter zones. Combined with the influence of water saturation of roof insulation materials on roof heat transfer, the insulation performance of the photo-thermal roof was explored under different insulation layer thicknesses and different collector water temperatures. This research provides a theoretical basis for the application of photo-thermal roofs in the field of building energy conservation.

2. Methods

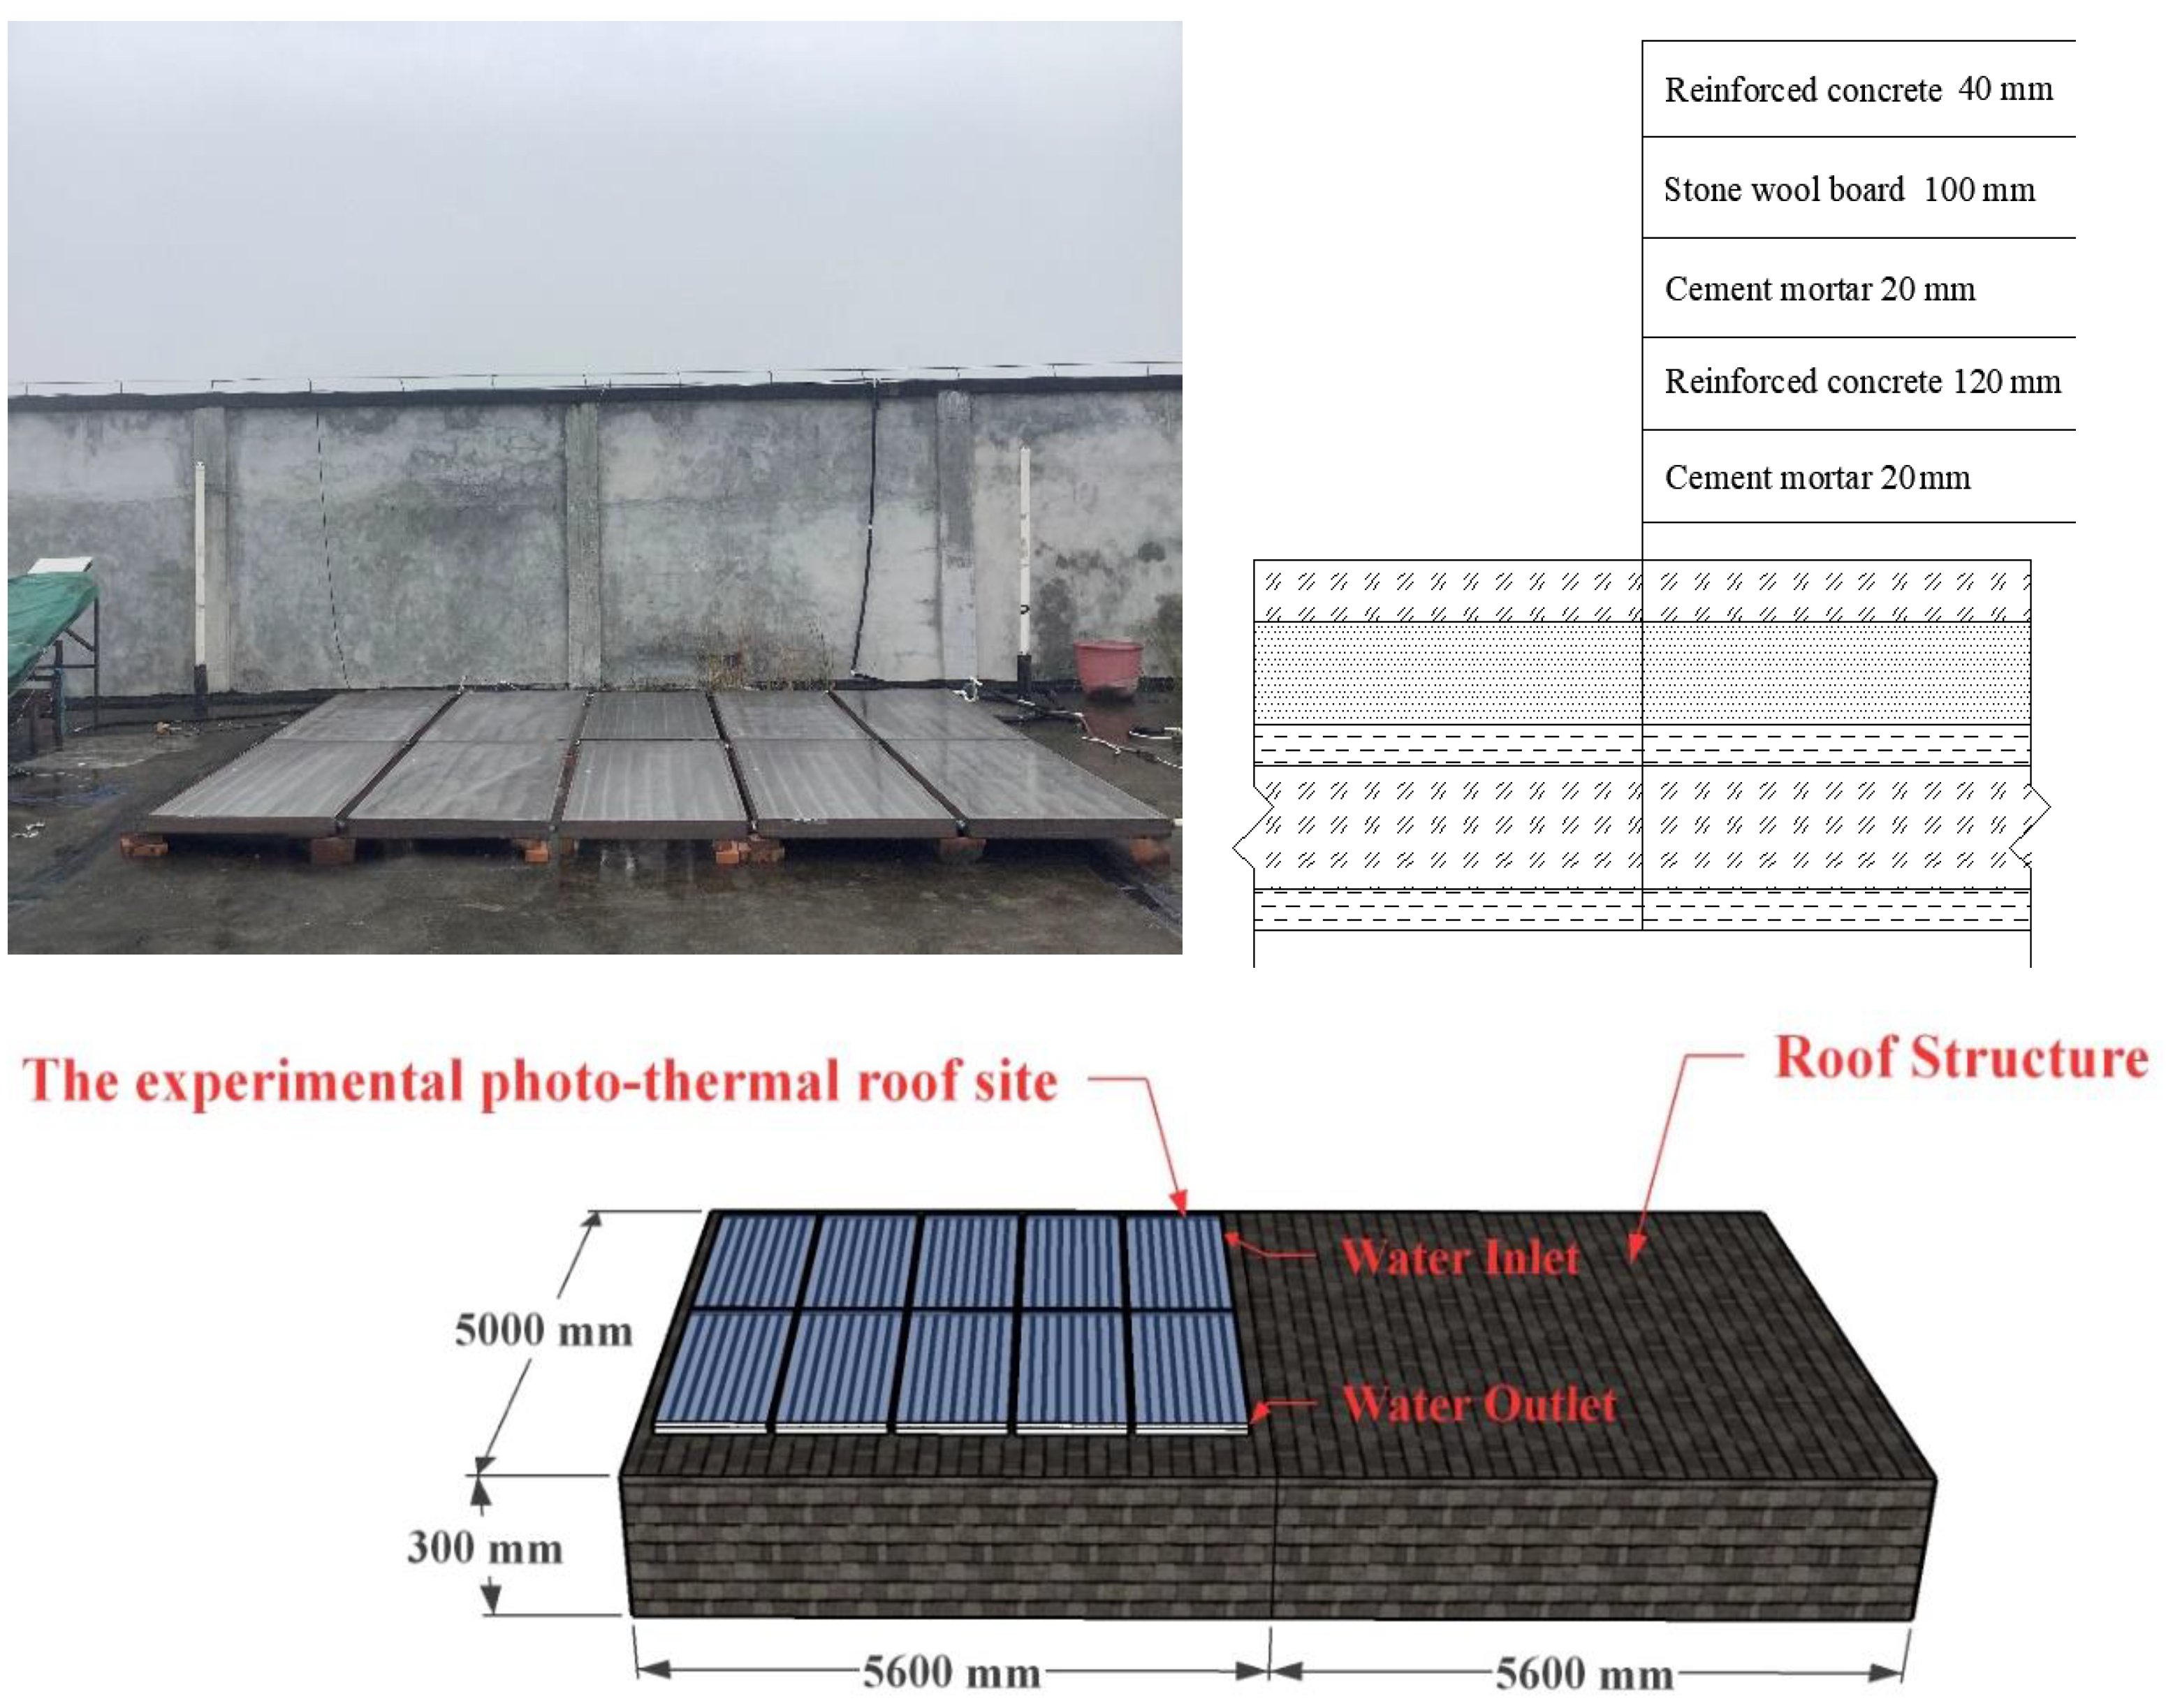
2.1. Experimental Model

The two experimental rooms were on the top floor of the civil engineering experimental building of Xiangtan University located at 112.86° longitude and 27.88° north latitude. The schematic structure of the experimental roof is shown in Figure 1. The structure of the roof from top to bottom was as follows: 40 mm reinforced concrete, 100 mm rock wool board, 20 mm cement mortar, 120 mm reinforced concrete, 20 mm cement mortar. The area used for the photo-thermal roof experiment was 5.6 m × 5 m, and 10 solar collectors 2000 mm × 1000 mm × 106 mm in size were used. The water temperature was adjusted by controlling the flow. There were no solar collectors on the ordinary roof, but its area, orientation, and roof structure were the same as for the photo-thermal roof. Both experimental test rooms were air-conditioned and cooled from 9:00 to 21:00 every day.

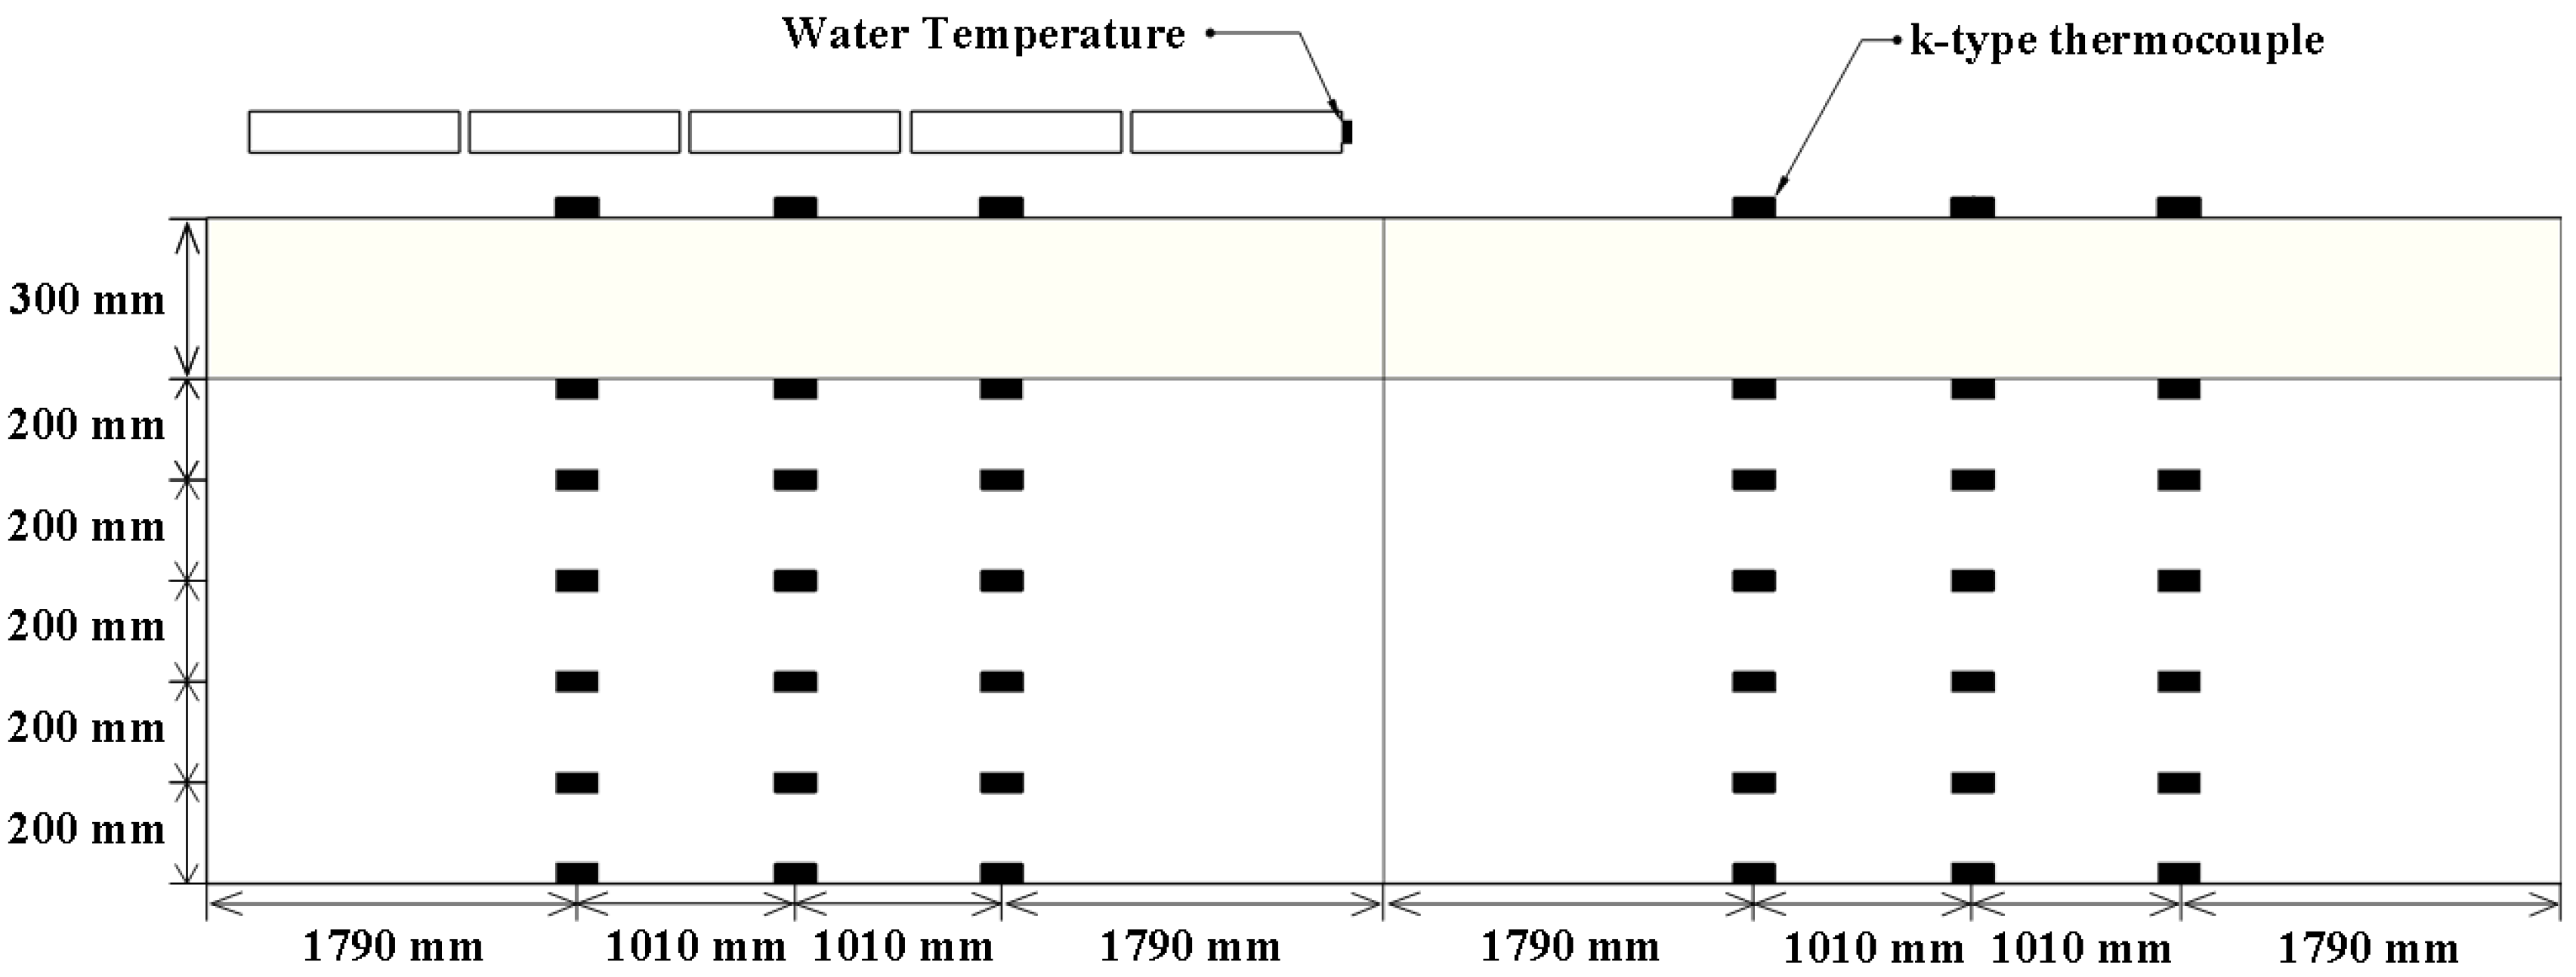
2.2. Experimental Measurements

In the experiment, temperature signals were collected by a k-type thermocouple with an accuracy level of 1 and a measurement error of less than 0.1%. The room studied under summer conditions was is an air-conditioned room, with the area 1 m from the inner surface of the roof being a non-working area. As shown in Figure 2, temperature detectors were placed on the roof surfaces, in the non-working area, and in the water inlet and outlet. The main temperature signals collected were: the internal and external roof surface temperature and the inlet and outlet water temperatures. Additionally, detectors were used to record the outdoor air temperature. The data acquisition unit (XSR-70A) is used to record the temperature data in real time. The radiation recorder (TBQ-2) was used to measure the solar irradiance of the test site. Test equipment and parameters are shown in Table 1.

2.3. Mathematical Model

2.3.1. Heat Transfer Analysis

As shown in Figure 3a, solar rays reached the photo-thermal roof, and a small portion were reflected by the glass cover of the collector, while the rest were absorbed by the collector. The collector converted solar radiation into heat. Most of the heat was used to heat the heat-carrying fluid and was carried away by the heat-carrying fluid. Some heat caused the temperature of the collector to increase. The collector then dissipated heat to the surrounding environment through convection and radiation. During heat dissipation by the collector, some of the heat was transferred to the room through the roof. The heat transfer conducted by the ordinary roof is shown in Figure 3b. The solar radiation directly reached the outer surface of the roof and increased the temperature of the roof, and the heat directly entered the room through the roof.
The energy balance equation of the heat transfer model can be expressed using Equation (1) [30].
τ ( ρ E ) + [ u ( ρ E + P ) ] = [ λ e T j h j J J + ( τ e f f ¯ u ) ] + S h
Since the thicknesses of each solid material layer of the solar collectors and roofs were much smaller than their length and widths, their heat conduction can be regarded as one-dimensional along the z-axis direction (height direction). Ignoring the diffusion component and viscosity dissipation, the above formula can be transformed into Equation (2).
τ ( ρ E ) + u ρ E = ( λ e T ) + S h
The equation of energy balance was established with the collector as the research object as shown in Equation (3).
ρ C T τ = ( 1 ρ g ) I λ p 2 T z 2 S
In Equation (3), the left-hand side of the equation represents the internal energy of the collector, whereas the right-hand side of the equation represents the heat gain term, the heat conduction term, and the heat loss term. The heat loss of the collector includes two main parts. One part is the heat emitted by the collector and the external environment through radiation and convection, and the other part is the heat loss that results from heating the fluid in the collector. As the distance between the collector and the outer surface of the roof was very small, only 100 mm, and the coverage area of the collector was large, there was little natural wind between the collector and the roof. In the hot summer condition, the temperature of the rear cover plate of the normal working collector was higher than that of the outer surface of the roof, making it difficult for natural convection between them. Therefore, it was assumed that the air between the collector and the roof was almost stagnant. The convective heat transfer between the collector’s rear cover and the roof was not considered. Sh can be expressed using Equation (4).
S h = h g ( T g T o , a ) + σ ε g ( T g 4 T s k y 4 ) + σ ε g ( T b 4 T o , w 4 ) 1 ε b + 1 ε o , w 1 + q w
Taking the outside surface of the photo-thermal roof as the research object, the heat balance equation can be expressed as shown in Equation (5).
λ a 2 T z 2 + σ ε g ( T b 4 T o , w 4 ) 1 ε b + 1 ε o , w 1 = q c o n d
Equation (6) is the energy balance equation for the photo-thermal roof.
ρ C t τ = S h λ e 2 T z 2 h i ( T i , w T i , a ) σ ε i , w ( T i , w 4 T n 4 )
where Sh represents the heat gain of the photo-thermal roof, determined using (5). Sh can be expressed using Equation (7).
S h = λ a 2 T z 2 + σ ε g ( T b 4 T o , w 4 ) 1 ε b + 1 ε o , w 1
Different from the photo-thermal roof, heat gain by the ordinary roof mainly came from direct solar irradiation. Taking the outer surface of the ordinary roof as the research object, the heat balance equation was established, as shown in Equation (8).
α w I σ ε o , w ( T o , w 4 T s k y 4 ) h o , w ( T o , w T o , a ) = q c o n d
Equation (9) is the heat transfer energy balance equation for the ordinary roof.
ρ C T τ = S h λ e 2 T z 2 h i , w ( T i , w T i , a ) σ ε i , w ( T i , w 4 T n 4 )
where Sh represents heat gain by the ordinary roof, determined using Equation (8). Sh can be expressed using Equation (10).
S h = α w I h o ( T o , w T o , a ) σ ε o , w ( T o , w 4 T n 4 )
Although the collectors performed strongly in terms of heat accumulation, most of this heat energy was used to produce domestic hot water. The heat gained by the photo-thermal roof mainly came from radiant heat transfer between the collectors and the roof. However, the ordinary roof directly absorbed solar irradiation, converted it into heat energy, and transferred it to the rooms.
According to Equations (6) and (9), when the heat received on the roof outer surface and the roof structure is constant, the heat entering the room through the roof is only related to the effective thermal conductivity of the roof’s insulation materials, and the more effective the thermal conductivity is, the more heat that is transferred into the room through the roof.

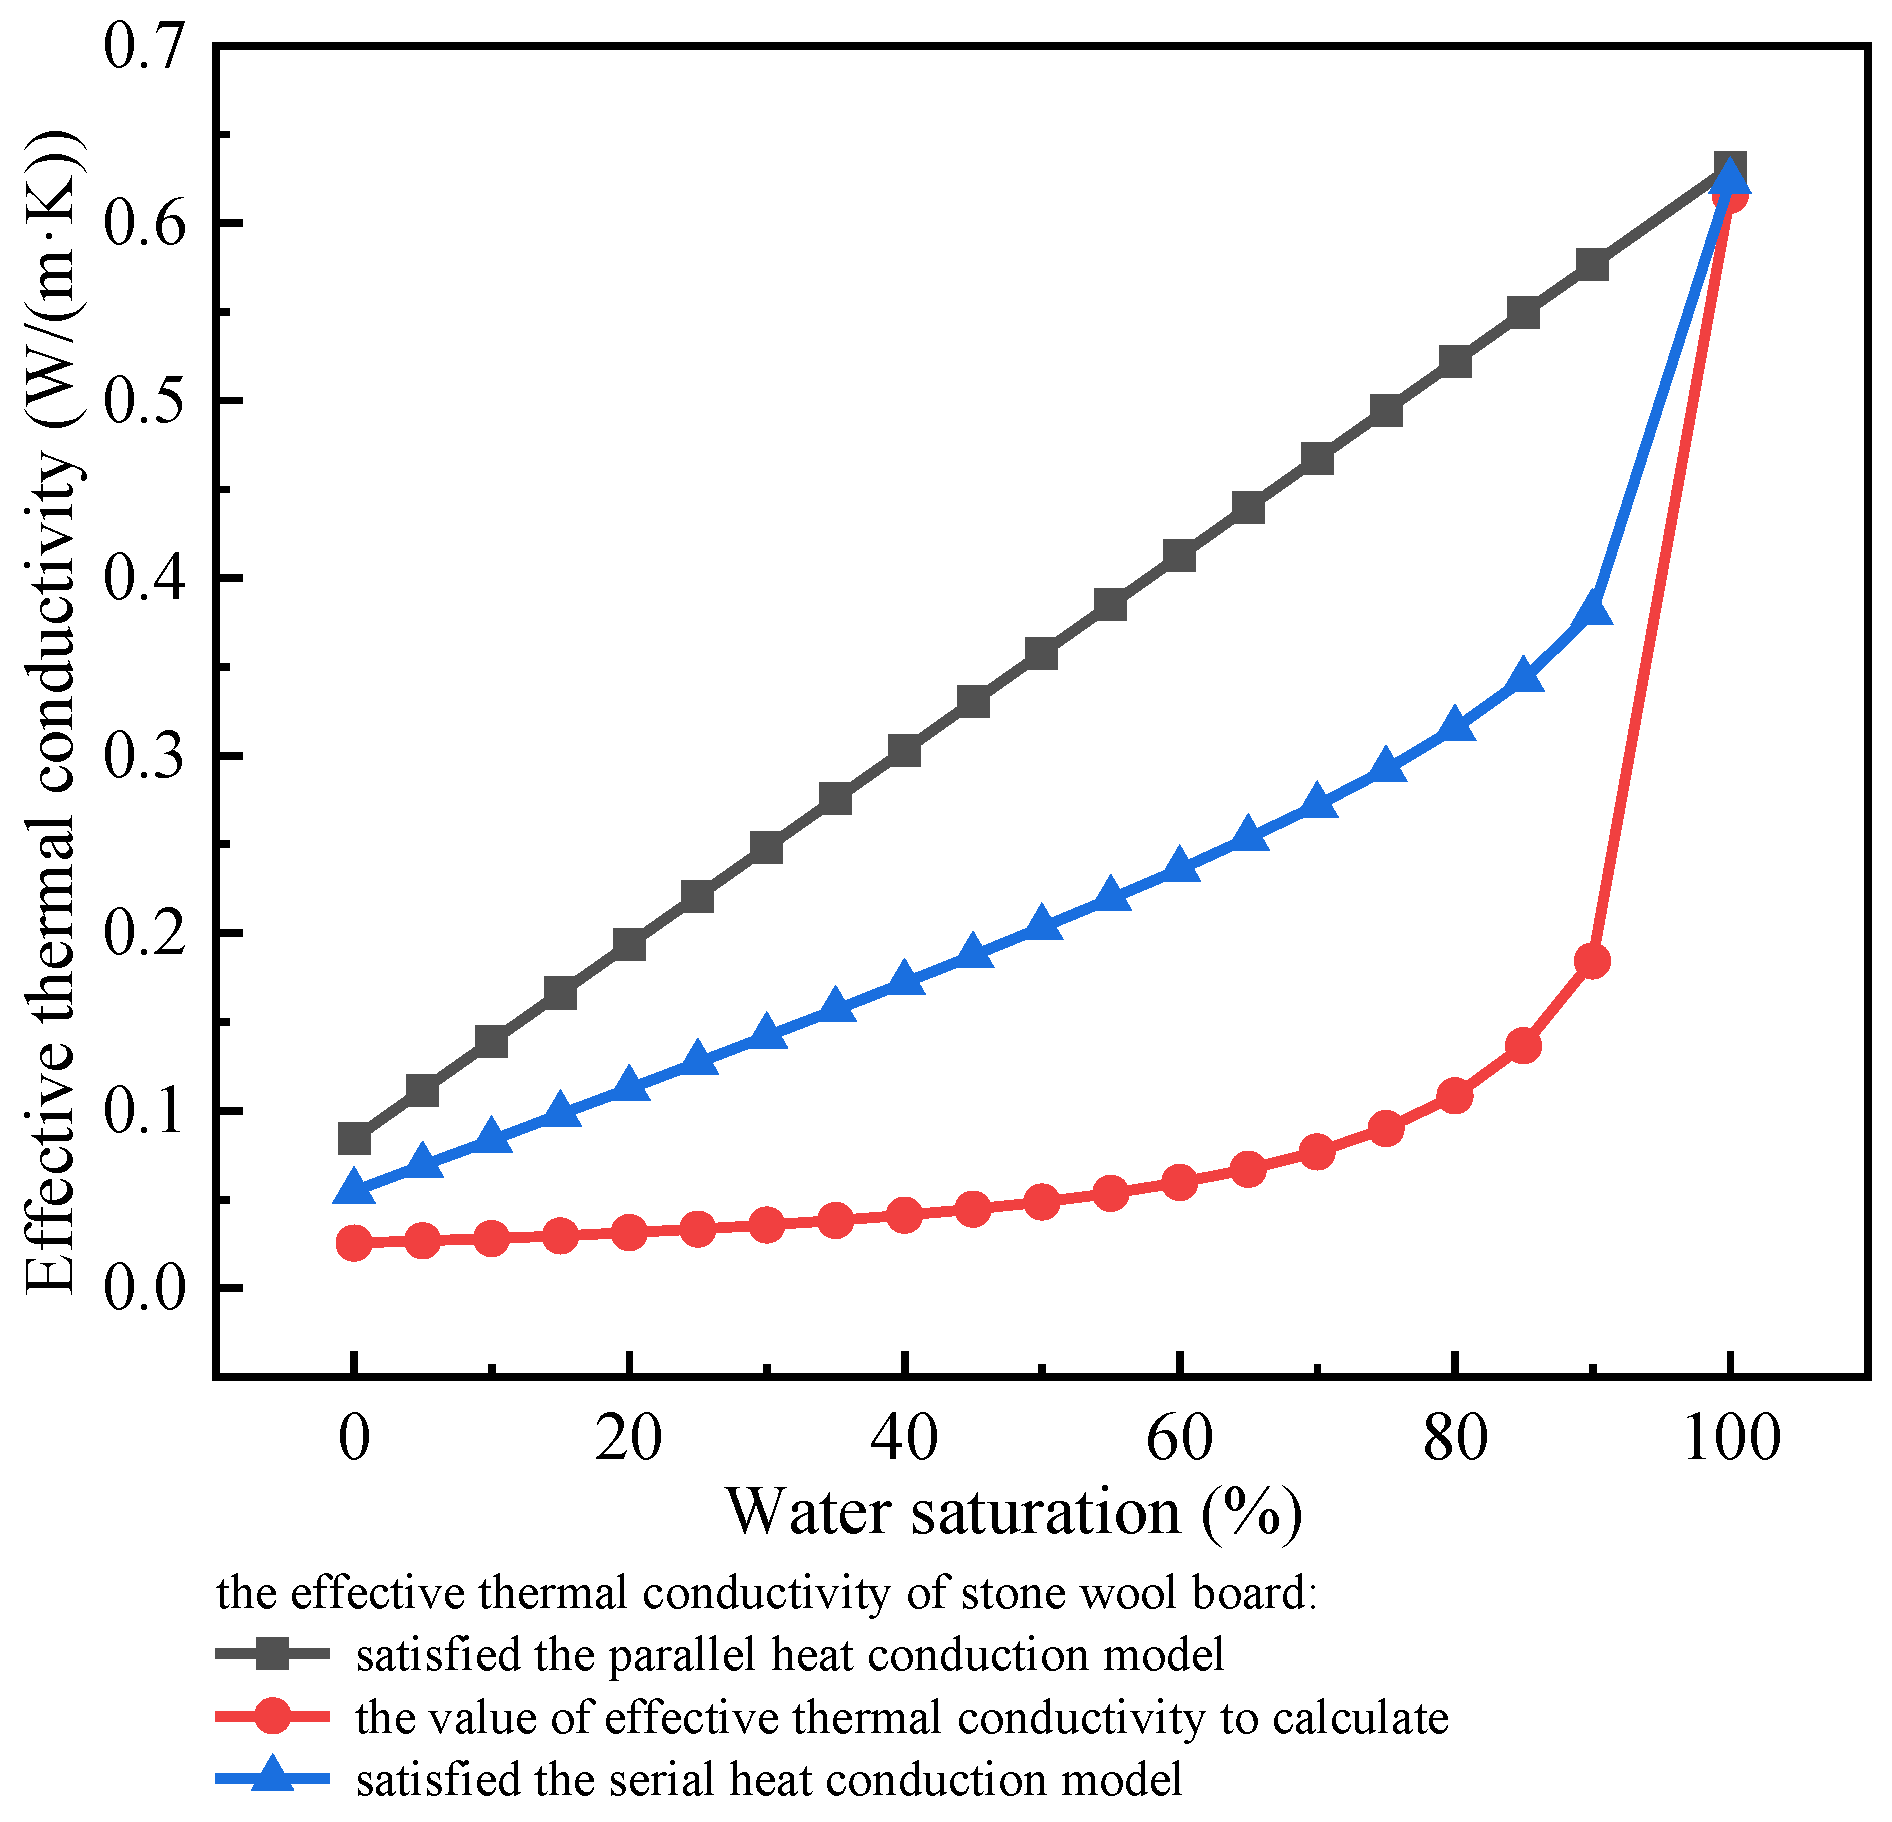
2.3.2. The Effective Thermal Conductivity of the Roof’s Insulation Material

Building thermal insulation materials are mostly porous media filled with air and moisture. The volume ratio of air and water changes depending on the environmental temperature and humidity. Therefore, building insulation materials are actually a mixture of solid-phase insulation materials, liquid-phase water, and air, which can be expressed using Equation (11).
ε s + ε l + ε a = 1
Among these three substances, the volume of the solid-phase insulation material does not change, while the volume of air decreases as the liquid water content increases. The volume of liquid water can be expressed as water saturation using Equation (12).
φ = ε l ε l + ε a
The thermal conductivity of water is greater than that of air. When the liquid water content in the pores increases, the volume of air will reduce, and the effective thermal conductivity of the material will increase. When the pores are filled with air and water, due to the hydrophilicity of the solid surfaces of the pores, the volume of liquid water, and other factors, the distribution of liquid water varies widely. It is difficult to accurately calculate the effective thermal conductivity of the insulation material. If the heat conduction of the porous medium satisfies the requirements of the parallel heat conduction model, its effective thermal conductivity can be expressed using Equation (13) [31].
λ ep = λ s ε s + λ l ε l + λ a ε a
If the heat conduction of the porous medium satisfies the requirements of the serial heat conduction model, its effective thermal conductivity can be calculated using Equation (14) [31].
λ ec = 1 ε s λ s + ε l λ l + ε a λ a
The above two methods of calculating the effective thermal conductivity represent the extreme conditions. In reality, the situation is somewhere in between.
λ e c λ e λ e p
In this study, stone wool board with a porosity of 95% was used as the roof insulation material. This material has a monofilament fiber thermal conductivity of about 1.25 W/(m·K) [32]. When the rock wool board was used as the roof insulation material, heat transfer was directed in the direction of its thickness. Some studies have pointed out that the interior part of the rock wool board was mainly composed of a large number of rock wool monofilament fibers and a small number of slag balls [32]. In the thickness direction, the inclined lapping of monofilament fibers of the rock wool board at different angles did not represent single horizontal or vertical placement, and a small number of slag balls were also randomly scattered inside, leading to the coexistence of serial heat conduction and parallel heat conduction in the rock wool board. In addition, the distribution of liquid water in the pores of the porous media was irregular. In order to simplify the analysis, the effective thermal conductivity was calculated by Equation (16).
λ e = λ e p + λ e c 2
The above calculation method shows the variation law of effective thermal conductivity for the roof insulation material used in this study, and this is also shown in Figure 4.
As shown in Figure 4, the effective thermal conductivity calculated by the parallel heat conduction model changes linearly with the water saturation. In the serial heat conduction model, when the water saturation is less than 80%, the effective thermal conductivity increases slightly as the water saturation increases, from 0.025 W/(m·K) to 0.108 W/(m·K). When the water saturation is more than 80%, the change in the effective thermal conductivity relative to the water saturation increases sharply, from 0.108 W/(m·K) to 0.616 W/(m·K).
The varied relationship between the effective thermal conductivity and the water saturation calculated according to Equation (16) is shown in Figure 4. The water saturation can affect the effective thermal conductivity of rock wool board over a large range. With an increase in the water saturation, the effective thermal conductivity of rock wool board also increases. When the water saturation increases from 0% to 100%, the effective thermal conductivity increases by 933.3%, in theory. With an increase in water saturation from 0% to 30%, the effective thermal conductivity increases from 0.06 W/(m·K) to 0.14 W/(m·K), an increase of 60.7%.

2.4. Simulation Conditions

In order to determine the similarities and differences in thermal performance between the photo-thermal roof and the ordinary roof, a numerical simulation was used to create two physical models. One was a simplified three-dimensional model of an air-conditioned room with a photo-thermal roof, and the other was an ordinary air-conditioned room with the same bare roof structure and materials. The numerical model was calculated with FLUENT software. In order to simplify the model, a water pipe and its surrounding components in the center of the collector of the photo-thermal roof were considered to have the smallest width unit.
Considering the limited cooling capacity of the air conditioner, the air area of the top floor room was divided into two parts according to height. One part was the area of air 1000 mm below the roof, the non-working area, and the other part was the personnel working area. The air conditioner was able to maintain a constant temperature of 26 ℃ in the working area. Due to close contact with the roof, the temperature of the non-working area was affected by heat transfer from the roof and the temperature of the working area. In order to further simplify the model, only 0.5 m of the indoor air-conditioned area and its upper space components were modeled. In order to further simplify the model, only the non-working area and the area 0.5 m below it were modeled. The minimum size of the numerical model was 134 mm × 2000 mm × (δ + 1906) mm, where δ is the thickness of the insulation layer of the roof, which represents the amount of change.
The size of the water pipes in the solar collector was 8 × 2000 × 8 mm, and the distance between the two water pipes was 126 mm. The components used in the model were all general materials with general dimensions, and the dimensions and materials are shown in Table 2.
This simulation introduced the solar ray tracing model. The geographical location was set to 27.88° N, 112.87° E with a time zone of +8. Ideal weather conditions were set as clear and cloudless, and the time was adjusted to obtain different solar radiation conditions. The DO radiation model was chosen, and the value of angular discretization was increased appropriately to obtain a more accurate simulation result. For the turbulence model, k-ε equation models with high accuracy were used. The boundary conditions of the model are shown in Table 3.
The simulated values of the meteorological parameters varied according to the purpose of the simulation. When using experimental data to verify the model, the meteorological parameters needed to be adjusted to be consistent with the experimental data. When using the model to explore practical problems, the meteorological parameters used were the typical meteorological parameters for Xiangtan City in summer [33], and the specific values are listed in Table 4.
The air density is affected by temperature. Therefore, the Boussinesq hypothesis was set to represent air density to simplify the solution. The coefficient of thermal expansion of air was set to 0.0037/k. The SIMPLEC algorithm was used to calculate the incompressible flow field. In the solving process, when the variable residuals of the continuity equation, momentum equation, k equation, and e equation were less than 10−3 and the variable residuals of energy equations and the radiation equation were less than 10−6, convergence of the calculation was considered to be achieved.

2.5. Simulation Verification

Simulation verification was carried out using experimental data collected on July 12. Figure 5 shows that the solar radiation intensity was basically stable at about 930 W/m2, and the air temperature was stable at about 37.8 °C during the period from 10:00 to 14:30. When the solar radiation intensity and air temperature remained constant, roof heat transfer reached a steady state. The outside surface temperature of the ordinary roof continued to rise from 10:00 to 14:00, and the temperature did not rise after reaching the maximum value of 53.0 °C at 14:30. At this time, the outside surface temperature of the ordinary roof reached the corresponding steady-state value. Compared with the ordinary roof, the rise in the outside surface temperature of the photo-thermal roof was slightly delayed. The total phase delay can be calculated using Equation (17), and the delay time of the outside surface of the photo-thermal roof was 2 h. Therefore, the outside surface temperature of the photo-thermal roof reached a steady-state value of 37.0 °C at 16:30. According to Equation (17) [34], the delay time of the inner surface of the roof was 5.5 h. Therefore, under a stable external thermal environment, the inner surface temperature of the ordinary roof reached its corresponding steady-state value of 43.2 °C at 20:00, and the inner surface temperature of the photo-thermal roof reached its corresponding steady-state value of 36.8 °C at 23:00.
ϕ = D 2 × 57.3 arctg 1 1 + S 1 2 α 1 + arctg 1 1 + S n 2 α n
Under the experimental conditions, the solar radiation intensity was 930 W/m2, the air temperature was 37.8 °C, the thickness of the roof insulation layer was 100 mm, and the average water temperature in the collector was 50 °C. These values were substituted into the numerical calculation model. Considering that the experimental building was a new building, the roof had an excellent waterproofing performance. Therefore, the saturation rate was set to 0. It was calculated that the outer and inner surface temperatures of the ordinary roof were 54.3 °C and 38.7 °C, respectively, and the outer and inner surface temperatures of the photo-thermal roof were 30.7 °C and 28.1 °C, respectively. In general, the values simulated by the photo-thermal system were slightly smaller than the experimental values. This is because the radiation heat transfer between the wall and roof was not considered in the simulation calculation. In order to analyze the error between the experimental value and the simulated value, the relative error calculation results are shown in Table 5.
Table 5 shows that the simulated value for the ordinary roof was relatively close to the experimental value, and the maximum value of relative error (RE) was 8.1%. The simulated value for the photo-thermal roof was slightly different from the experimental value, and the maximum RE was 11.1%. The root-mean-squared error (RMSE) was 3.3. This suggests that the experimental values are in good agreement with the simulated values.

3. Results and Discussion

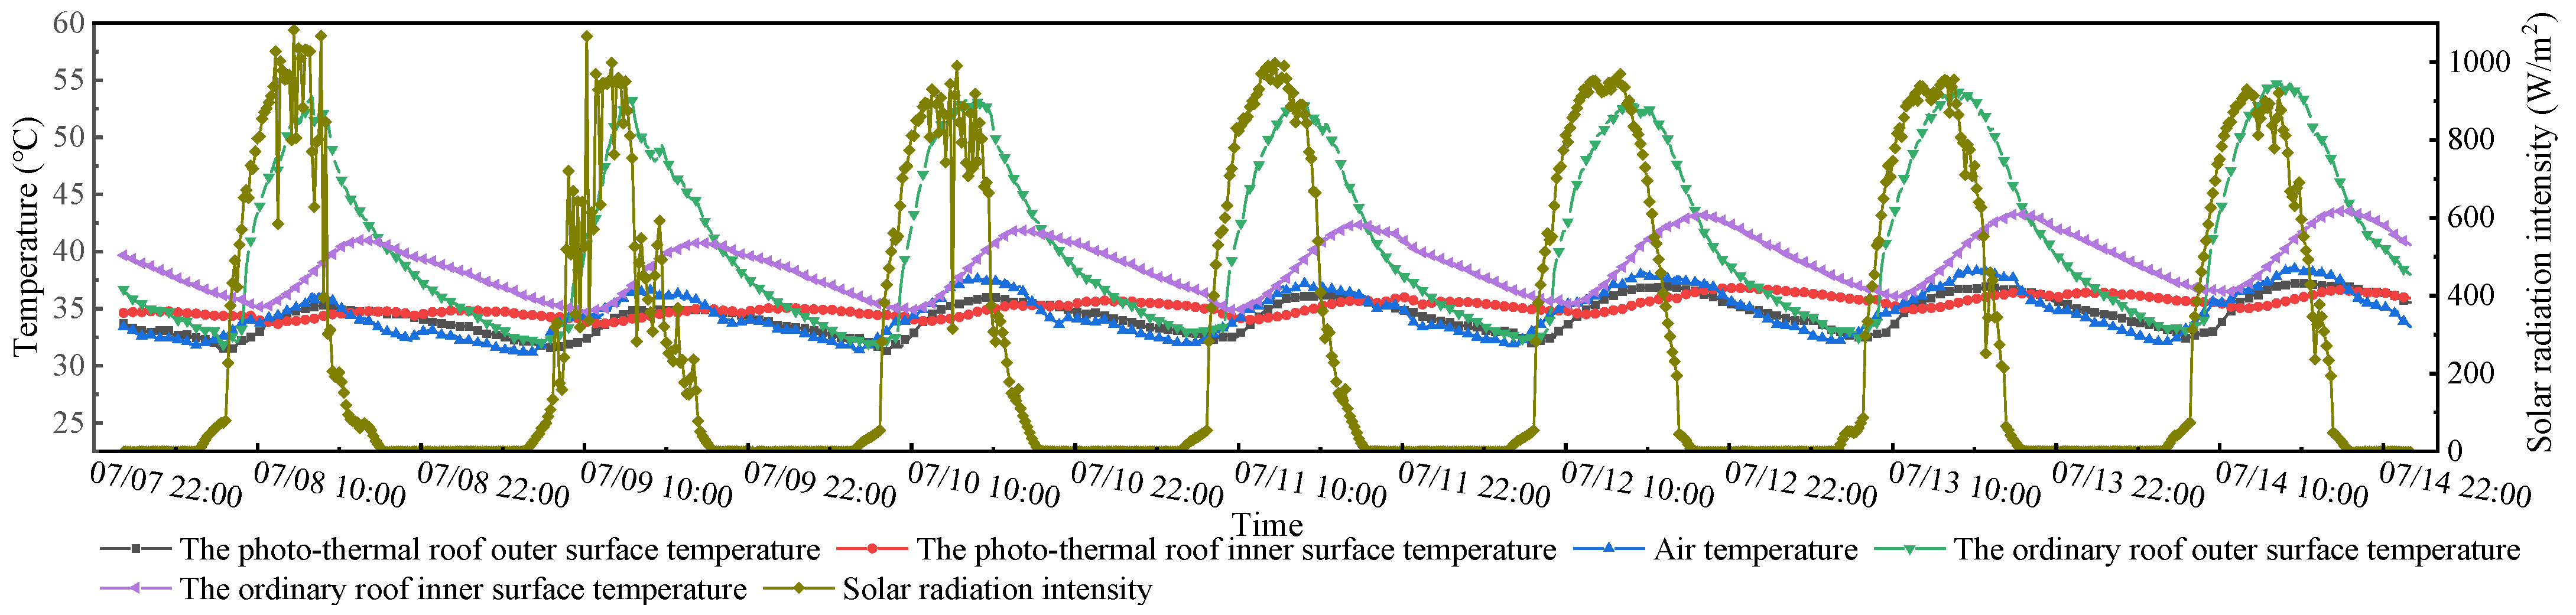
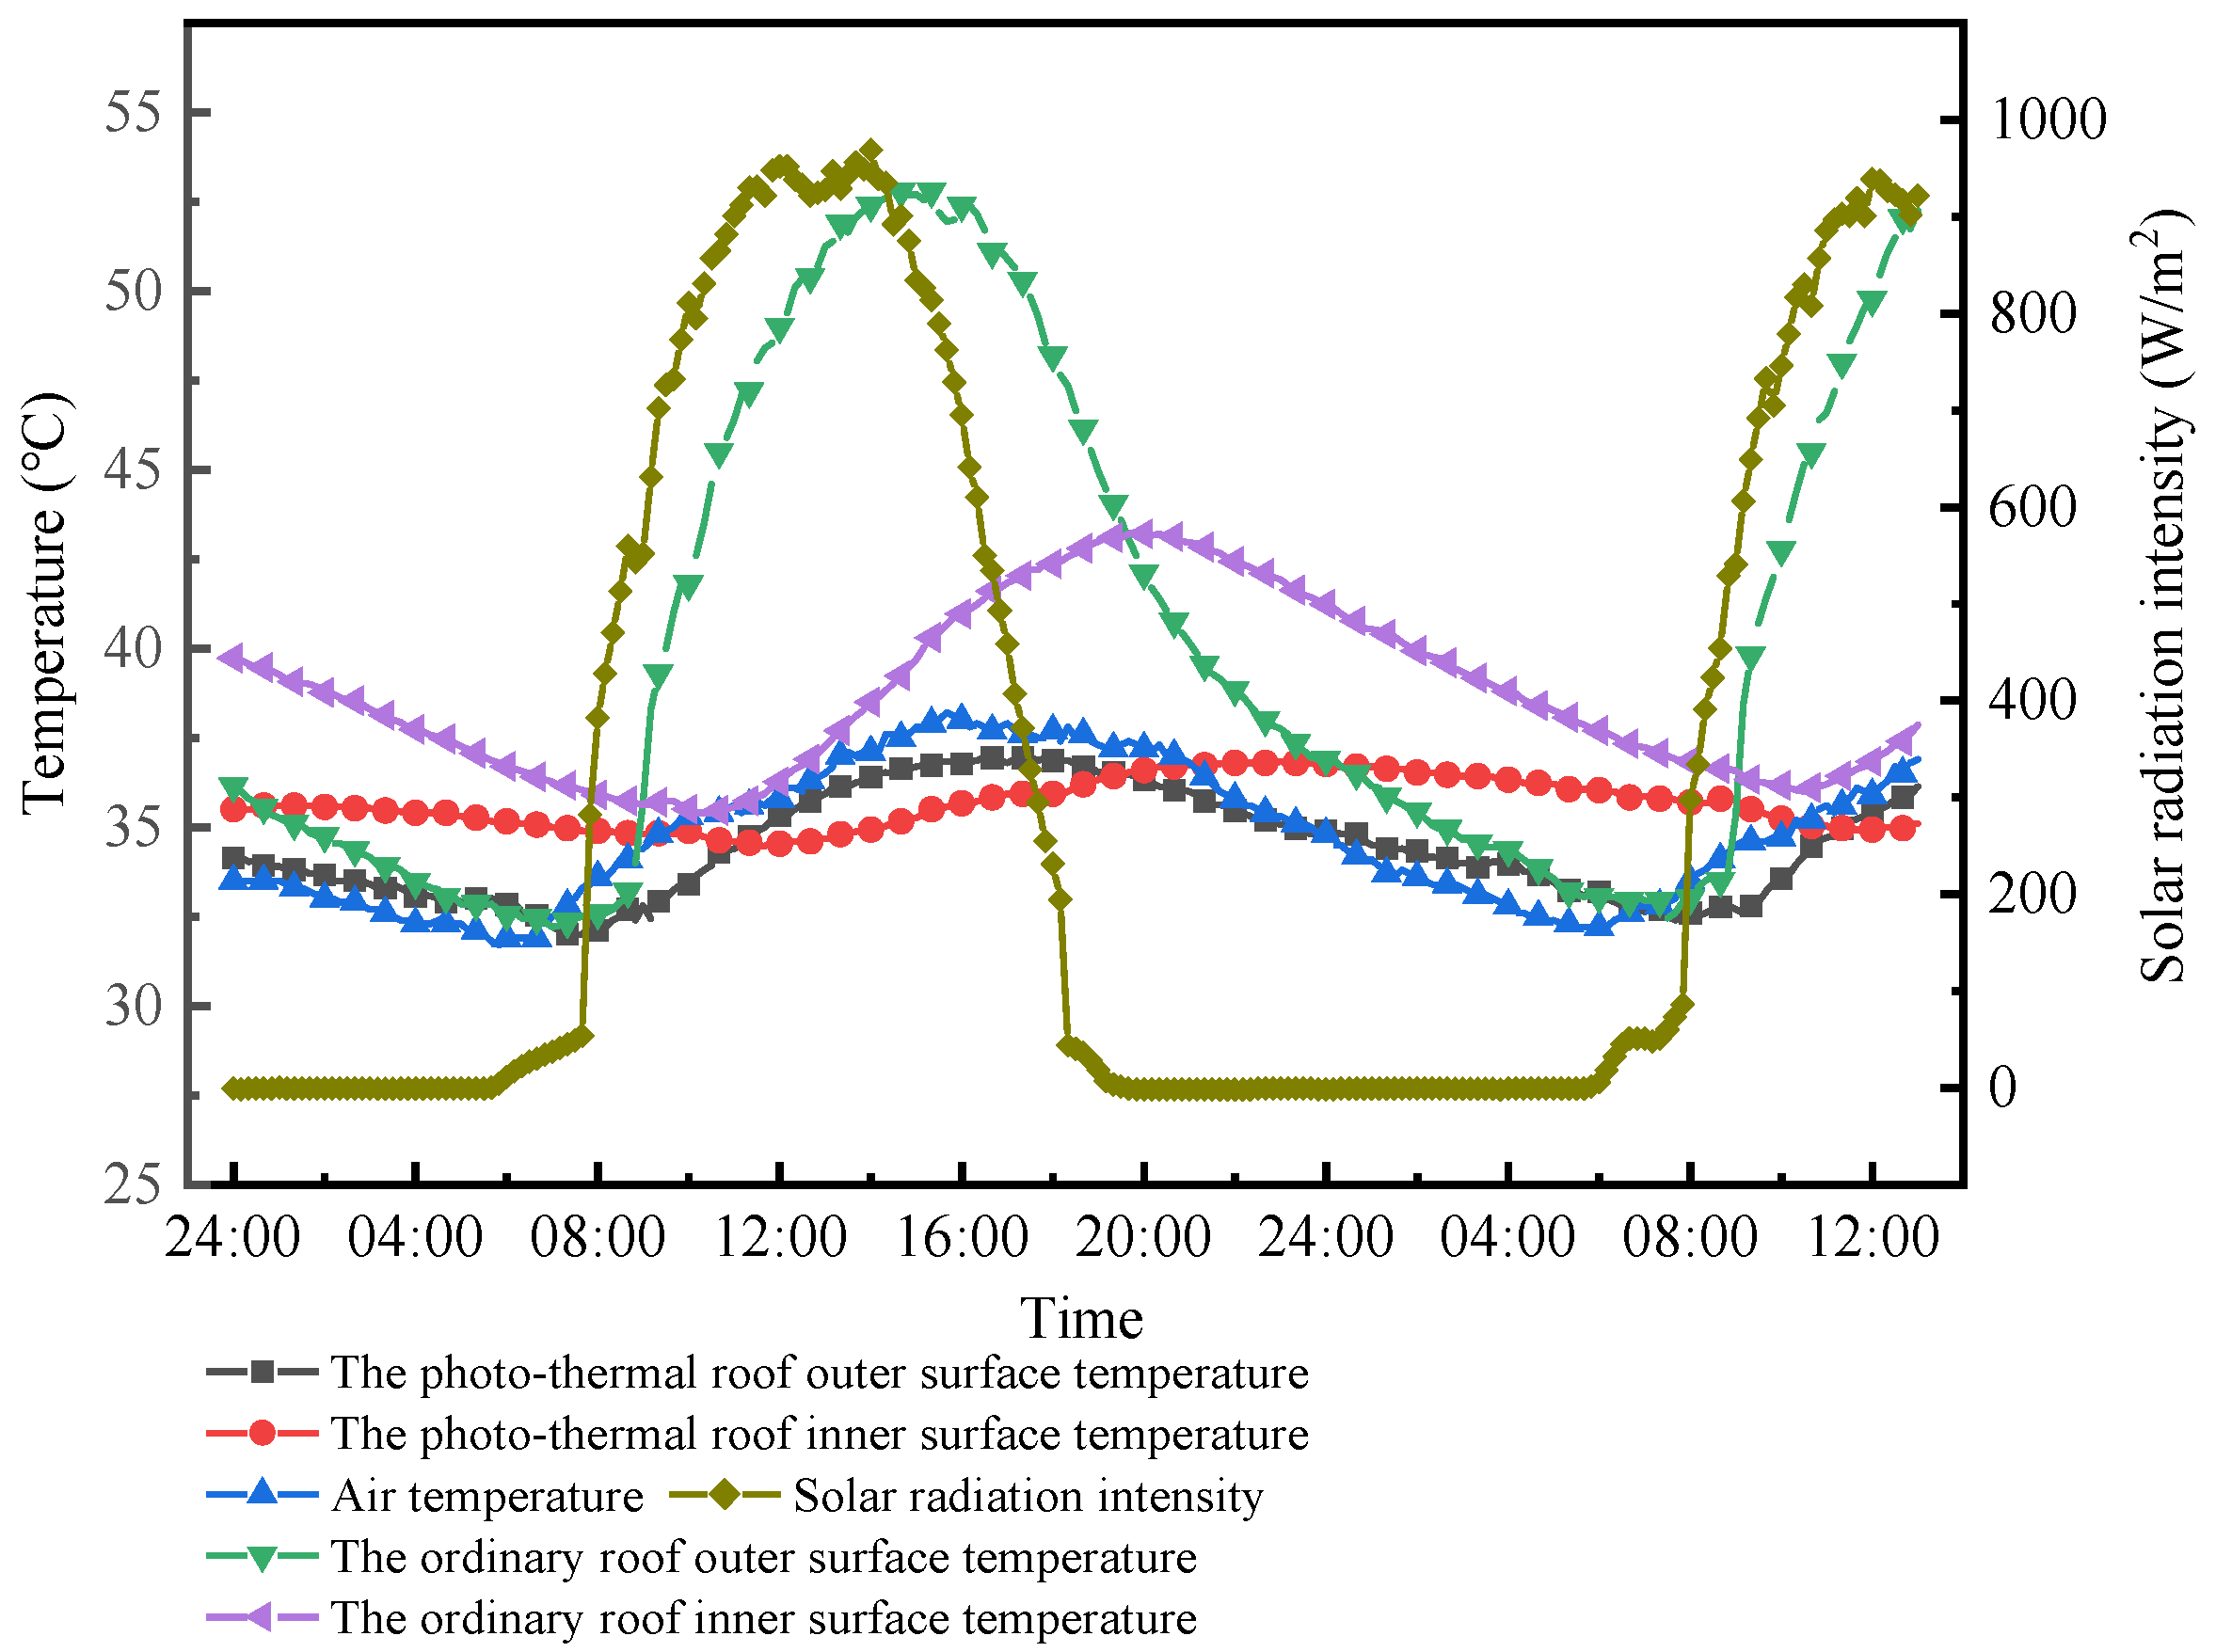
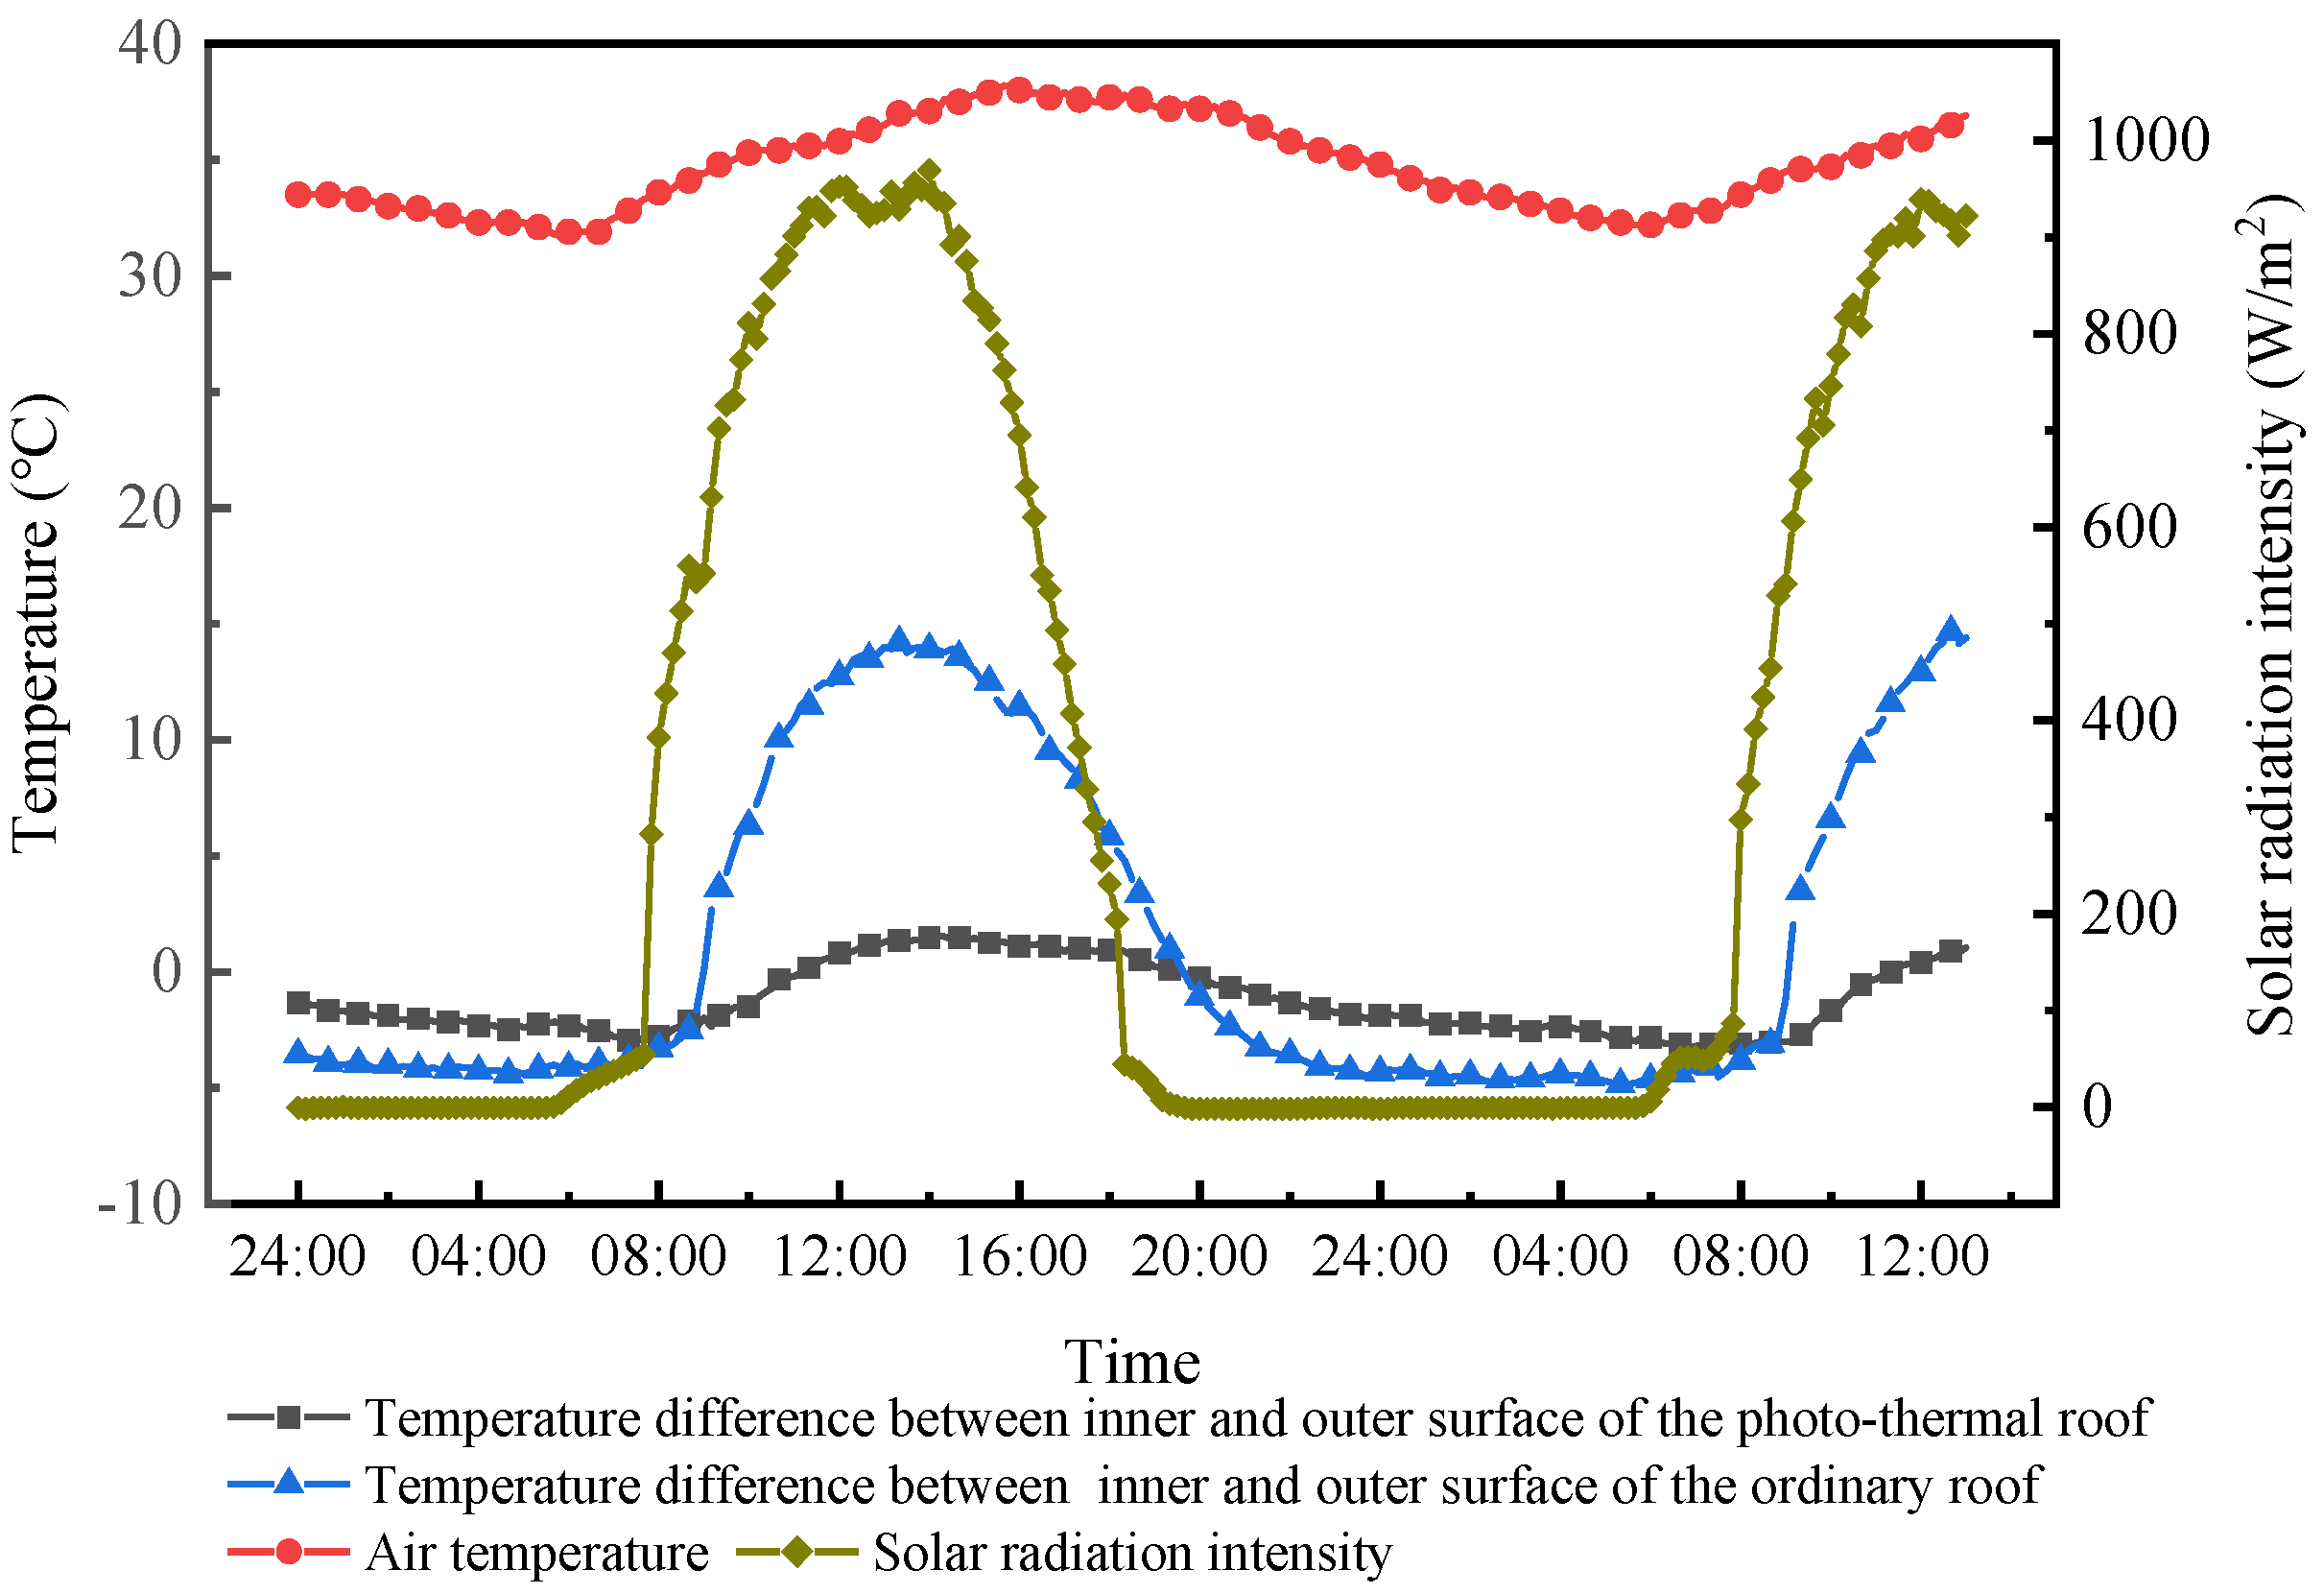
3.1. Experimental Results and Analysis

The thermal insulation performance of the roofs was tested during the hot season in 2021. Experimental data from seven consecutive sunny days from 8 to 14 July 2021 were used. The first three days were cloudy, and the influence of clouds on the solar radiation intensity value was greater on those three days than on the next four days. The relationships between the roofs’ internal and external surface temperatures and the solar radiation intensity and air temperature are shown in Figure 5.
As can be seen from Figure 5, the temperature and solar radiation intensity values measured in the experiment showed periodic changes. The solar radiation intensity began to rise from about 6:00, reaching a maximum of about 900 W/m2 from 10:00 to 14:30, and then gradually decreasing before dropping to 0 W/m2 after 19:00. The outdoor air temperature fluctuated between 31.1 and 38.6 °C and reached its maximum value at 14:00–15:30 every day.
The roof temperature changed periodically under the influences of the solar radiation intensity and air temperature. However, the peaks of different temperature curves occurred at different times and the magnitude of the temperature fluctuation differed. The outer surface temperature of the ordinary roof reached a maximum value of about 53.3 °C from 13:00 to 14:30 and then gradually decreased until the next wave cycle began at 7:30 the next day. There was a delay in the inner surface temperature fluctuations of the ordinary roof, whereby a maximum temperature of about 42.3 °C occurred between 18:00 and 19:30 every day, before gradually decreasing and reaching a minimum value at about 10:30 the next day. The outer surface temperature of the photo-thermal roof reached a maximum value of about 36.5 °C from 15:30–16:30 daily and then gradually decreased until the minimum value was reached at about 8:30 the next day. The inner surface temperature of the photo-thermal roof reached a minimum value at 12:30–13:30 daily and a maximum value of about 36.0 °C at 22:00–24:00.
The temperature fluctuations were roughly similar, but the peaks and peak times differed slightly over different periods due to fluctuations in the solar radiation intensity and air temperature during the day. The solar radiation intensity fluctuated greatly in the first three days of the experiment, the air temperature was lower, the peak of each temperature was slightly lower, and the peak appeared slightly earlier than on the last four days.
As can be seen from Figure 5, on July 12, the weather was fine with few solar rays shielded by clouds, and the meteorological conditions were in line with the typical local summer climate. Therefore, July 12 was selected as a typical day and used to analyze the relationships among various temperatures. To cover the full cycle of each curve, the timeline for typical days to 0:30 on July 12 until 12:30 on July 13. Figure 6 shows the experimental data for the typical day.
During the typical day, the outdoor air temperature was 31.7–38.2 °C, the solar radiation intensity increased from 6:00 to a maximum of 930 W/m2 from 11:00 to 14:30 and then gradually decreased to 0 W/m2 after 19:00.
As shown in Figure 6, the outer and inner surface temperatures of the photo-thermal roof were significantly lower than those of the ordinary roof for most of the study period. On the typical day, the outer and inner surface temperature peaks of the ordinary roof were 53.0 °C and 43.3 °C, while those of the photo-thermal were 37.0 °C and 36.8 °C, respectively. Under the same thermal disturbance conditions, the outer and inner surface temperature peaks of the photo-thermal roof reduced by 30.2% and 15.0%, respectively, compared with those of the ordinary roof. The heat gain of the roofs was composed of solar radiation and heat transfer from the surrounding air. The decrease in the outer surface temperature peak of the photo-thermal roof indicates a decrease in heat gain on the roof surface and a decrease in the amount of heat transferred to the inner surface of the roof through the roof structure.
This occurred because the solar irradiation on the photo-thermal roof was partly used to heat the water flow in the collector and partly used to increase the temperature of the collector, and then the heat from the collector was transferred to the outer surface of the roof. The air layer between the collector and the roof also weakened the amount of heat transfer. However, the ordinary roof was exposed directly to solar rays. When the outdoor air temperature was the same, the temperature peak of the outer surface of the ordinary roof was higher than that of the photo-thermal roof.
Figure 6 also shows that, for the ordinary roof, the outer surface temperature peak time was 14:30, the inner surface temperature peak time was 19:50, and the temperature wave delay time was 5 h and 20 min. The outer surface temperature of the photo-thermal roof reached its maximum value at 16:30 and the inner surface temperature reached its maximum value at 22:00. Compared to the ordinary roof, the temperature wave on the outer surface of the photo-thermal roof was delayed by 2 h and the inner surface temperature wave was delayed by 4 h.
In terms of the amplitude of the roof surface temperature, the order, from small to large, was as follows: the inner surface of the photo-thermal roof, the outer surface of the photo-thermal roof, the inner surface of the ordinary roof, the outer surface of the ordinary roof. On the typical day, the amplitudes were 2.0 °C, 4.5 °C, 7.3 °C, and 20.5 °C, respectively.
The outer surface temperature amplitude of the photo-thermal roof was 78.0% lower than that of the ordinary roof, and the amplitude of the surface temperature inside the photo-thermal roof was reduced by 72.6%. Thus, the photo-thermal roof was shown to have better thermal stability.
As shown in Figure 7, the change trend for the interior and exterior surface temperature difference between the ordinary roof and the photo-thermal roof was similar to that observed for solar radiation intensity. Although there was a delay in the increase in the inner surface temperature of the roofs, the time which the maximum temperature difference between the roof interior and exterior surface occurred was basically the same as that of the solar radiation intensity. When the solar radiation intensity was maximal, the roof outer surface received the most heat, while the inner surface released heat to the room at a low level, so the roof heat storage was maximal, as was the inner and outer surface temperature difference.
The maximum temperature difference between the inner and outer surfaces was 14.2 °C for the ordinary roof and 1.5 °C for the photo-thermal roof, as shown in Figure 7. Thus, in the photo-thermal roof, heat transfer was only one-ninth that in the ordinary roof under the experimental conditions. This shows that the photo-thermal roof has better insulating properties than the ordinary roof.

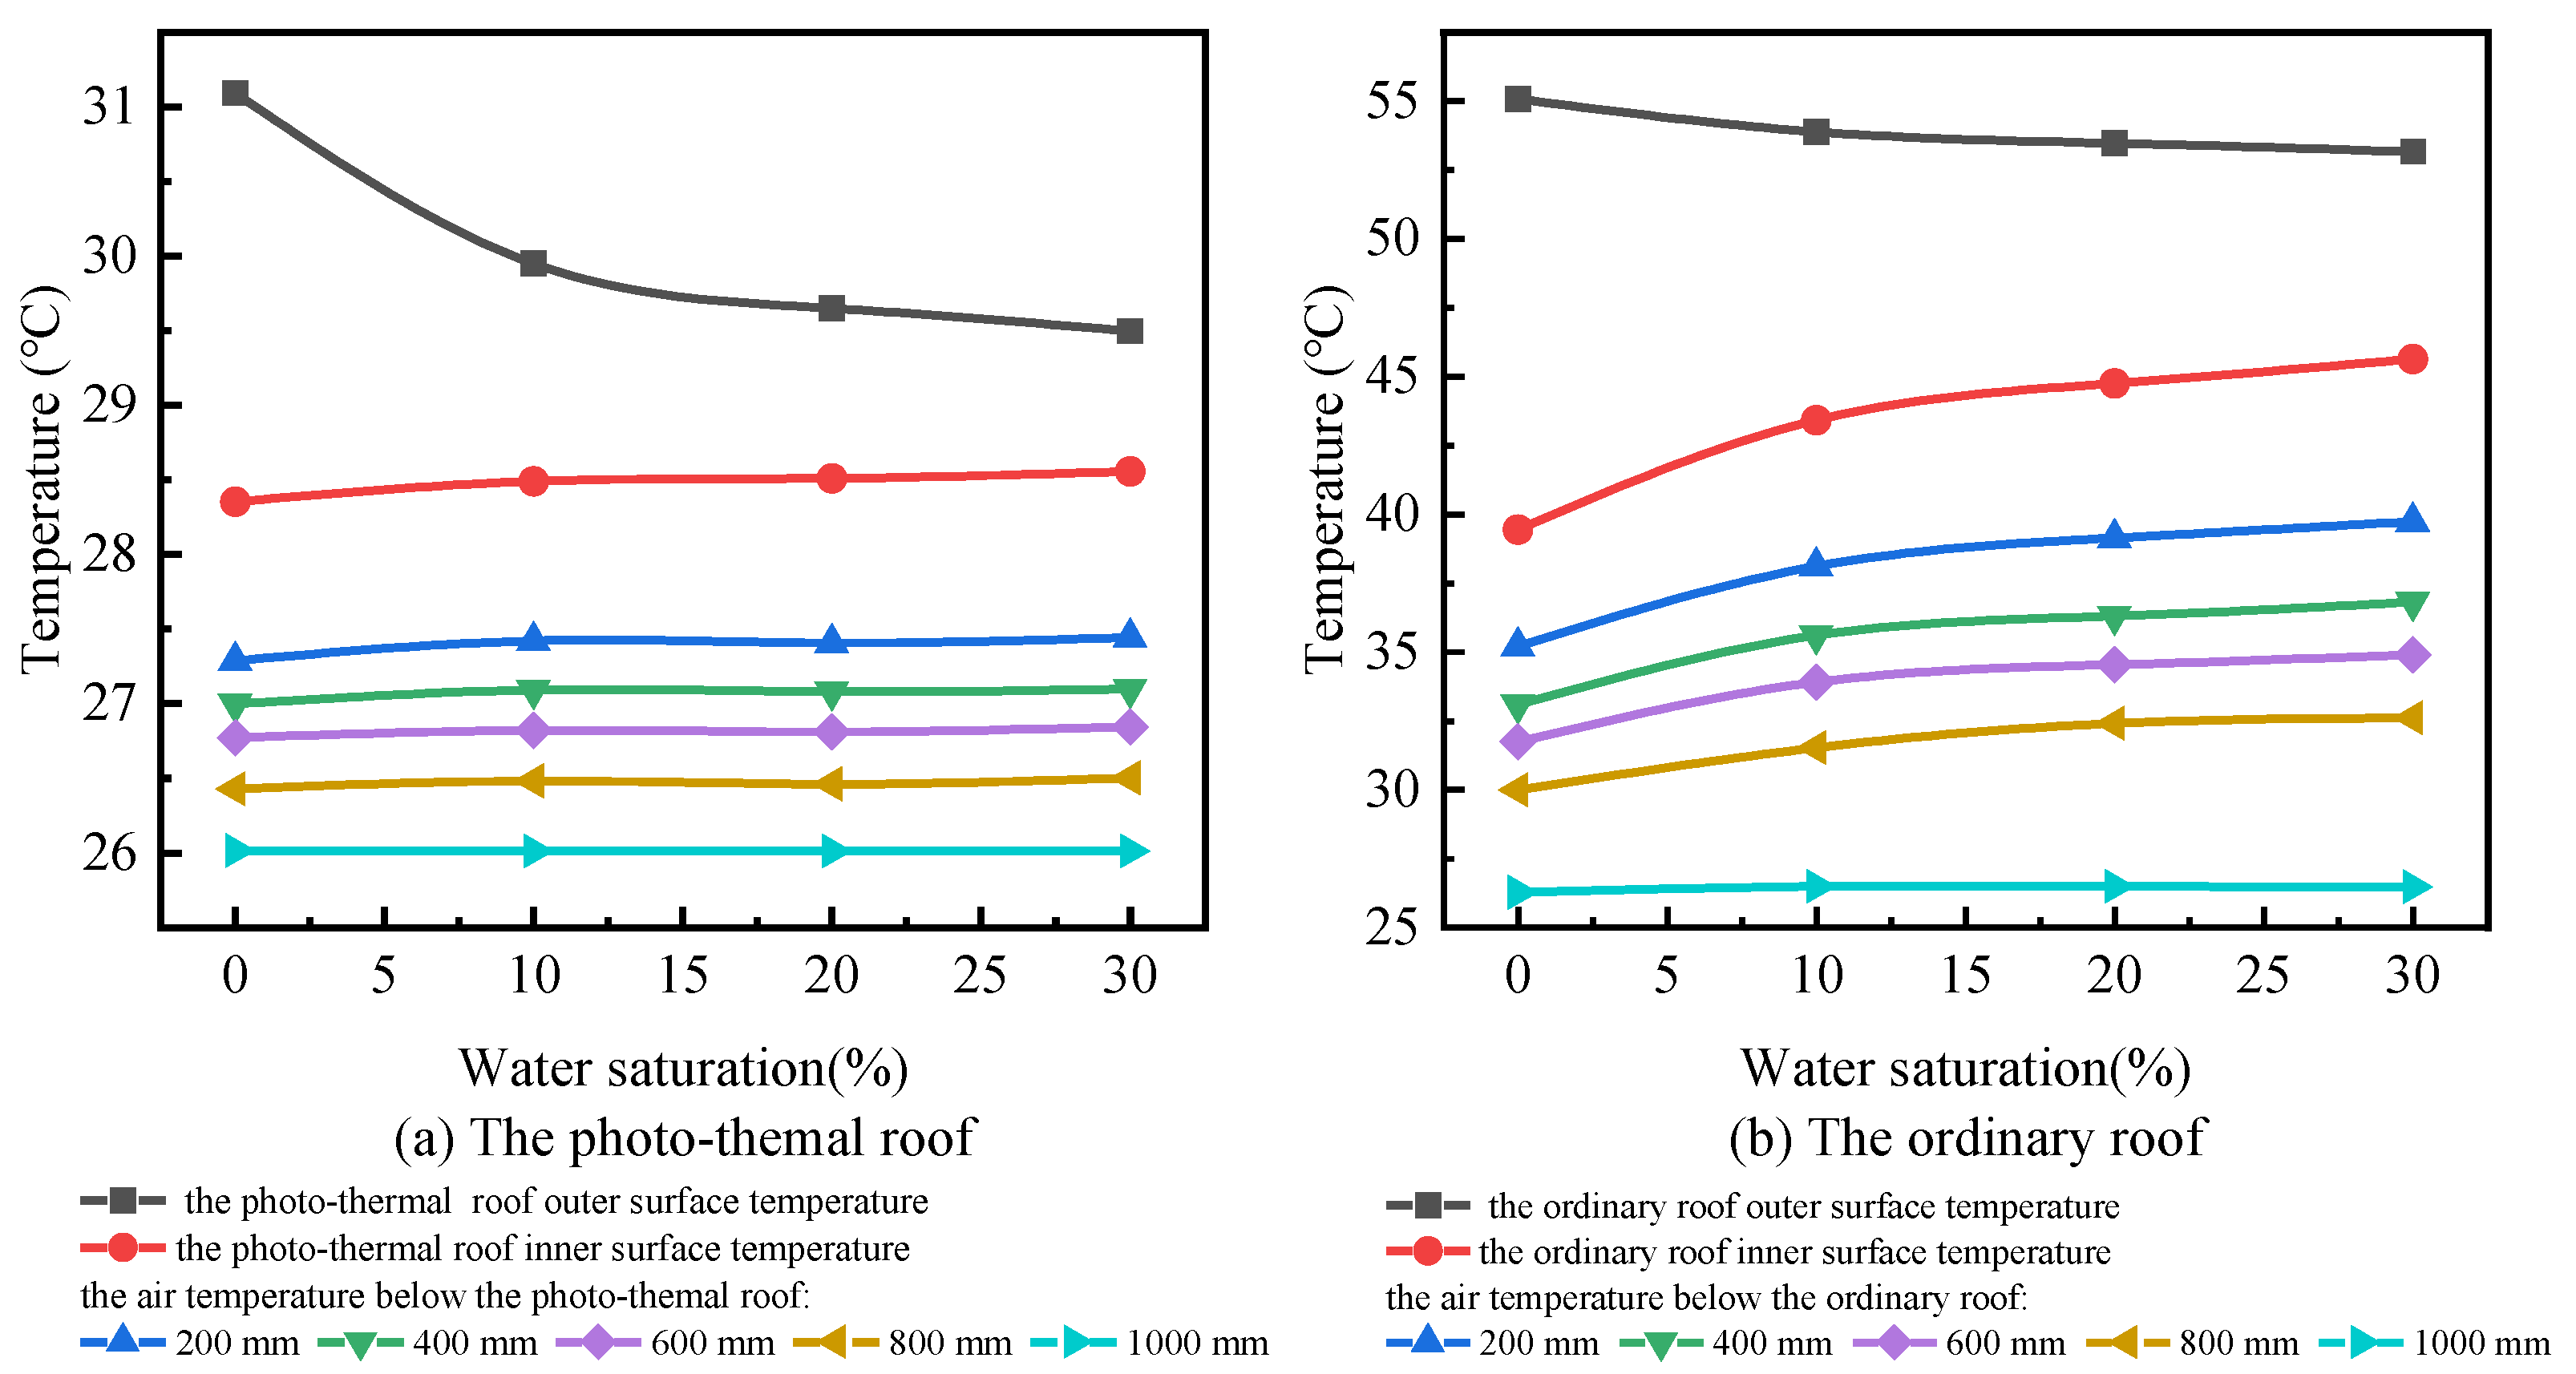
3.2. Effect of Water Saturation

In order to explore the influence of changes in the water saturation of insulation materials on the insulation performance of the photo-thermal roof, simulation studies were carried out when the water saturation level was 0, 10%, 20%, and 30%. The solar radiation intensity was set to 1000 W/m2, the air temperature to 35.8 °C, the roof insulation thickness was set to 100 mm, and the water flow was adjusted to keep the pipe wall temperature constant at 50 °C to determine the relationship between the temperature, heat flux, and water saturation for the top room model with the photo-thermal roof and the ordinary room, as shown in Figure 8 and Figure 9.
An increase in water saturation led to an increase in the effective thermal conductivity of the roof, which enhances the heat transfer of the roof. The data presented in Figure 8 and Figure 9 show that when the water saturation rose from 0 to 30%, the heat flux per unit area of the ordinary roof rose from 65.9 W/m2 to 99.1 W/m2, an increase of 50.4%; the inner surface temperature of the ordinary roof rose from 39.4 °C to 45.6 °C, an increase of 15.7%; and the air temperature 400 mm below the roof increased from 33.1 °C to 36.8 °C, an increase of 11.1%. Owing to the enhanced heat transfer, the outer surface temperature of the roofs decreased. When the water saturation rose from 0 to 30%, the outer surface temperature of the ordinary roof dropped from 55.1 °C to 53.2 °C, and the temperature gradient of the roof in the vertical direction dropped from 52.3 °C/m to 25.3 °C/m. Thus, as the water saturation of the roof insulation material increased, the heat transfer of the roof increased and the inner surface temperature and indoor air temperature increased, even though the temperature difference between the inner and outer surfaces of the roof may have reduced. The heat radiation from the inner surface of the roofs to the rooms was enhanced.
When the water saturation increased from 0 to 10%, the inner surface temperature and heat transfer of the roofs changed sharply. The inner surface temperature of the ordinary roof increased by 4 °C, and the heat flux per unit area increased by 21.0 W/m2. However, the inner surface temperature of the photo-thermal roof only increased by 0.1 °C, and the heat flux of the roof only increased by 0.6 W/m2.
With an increase in the water saturation, the change pattern of the photo-thermal roof temperature was similar to that of the ordinary roof. However, the photo-thermal roof showed a smaller temperature fluctuation. When the water saturation increased from 0 to 30%, the inner surface temperature of the photo-thermal roof rose from 28.4 °C to 28.6 °C, an increase of 0.2 °C. Compared with the ordinary roof, the temperature rise was 96.8% lower. The heat flux per unit area of the photo-thermal roof increased from 11.5 W/m2 to 12.4 W/m2, an increase of 0.9 W/m2. Compared with the ordinary roof, the increase was 97.3% lower. As the water saturation increased, the temperature of the non-working area in the photo-thermal room did not show obvious fluctuations, and the indoor air temperature distribution was more uniform.
In summary, compared with the ordinary roof, the photo-thermal roof has smaller heat transfer, lower roof temperature and indoor non-air-conditioned area temperature. An increase in water saturation of insulation materials will enhance the heat transfer of roofs. However, an increase in water saturation has less negative impact on photo-thermal buildings than on ordinary buildings.

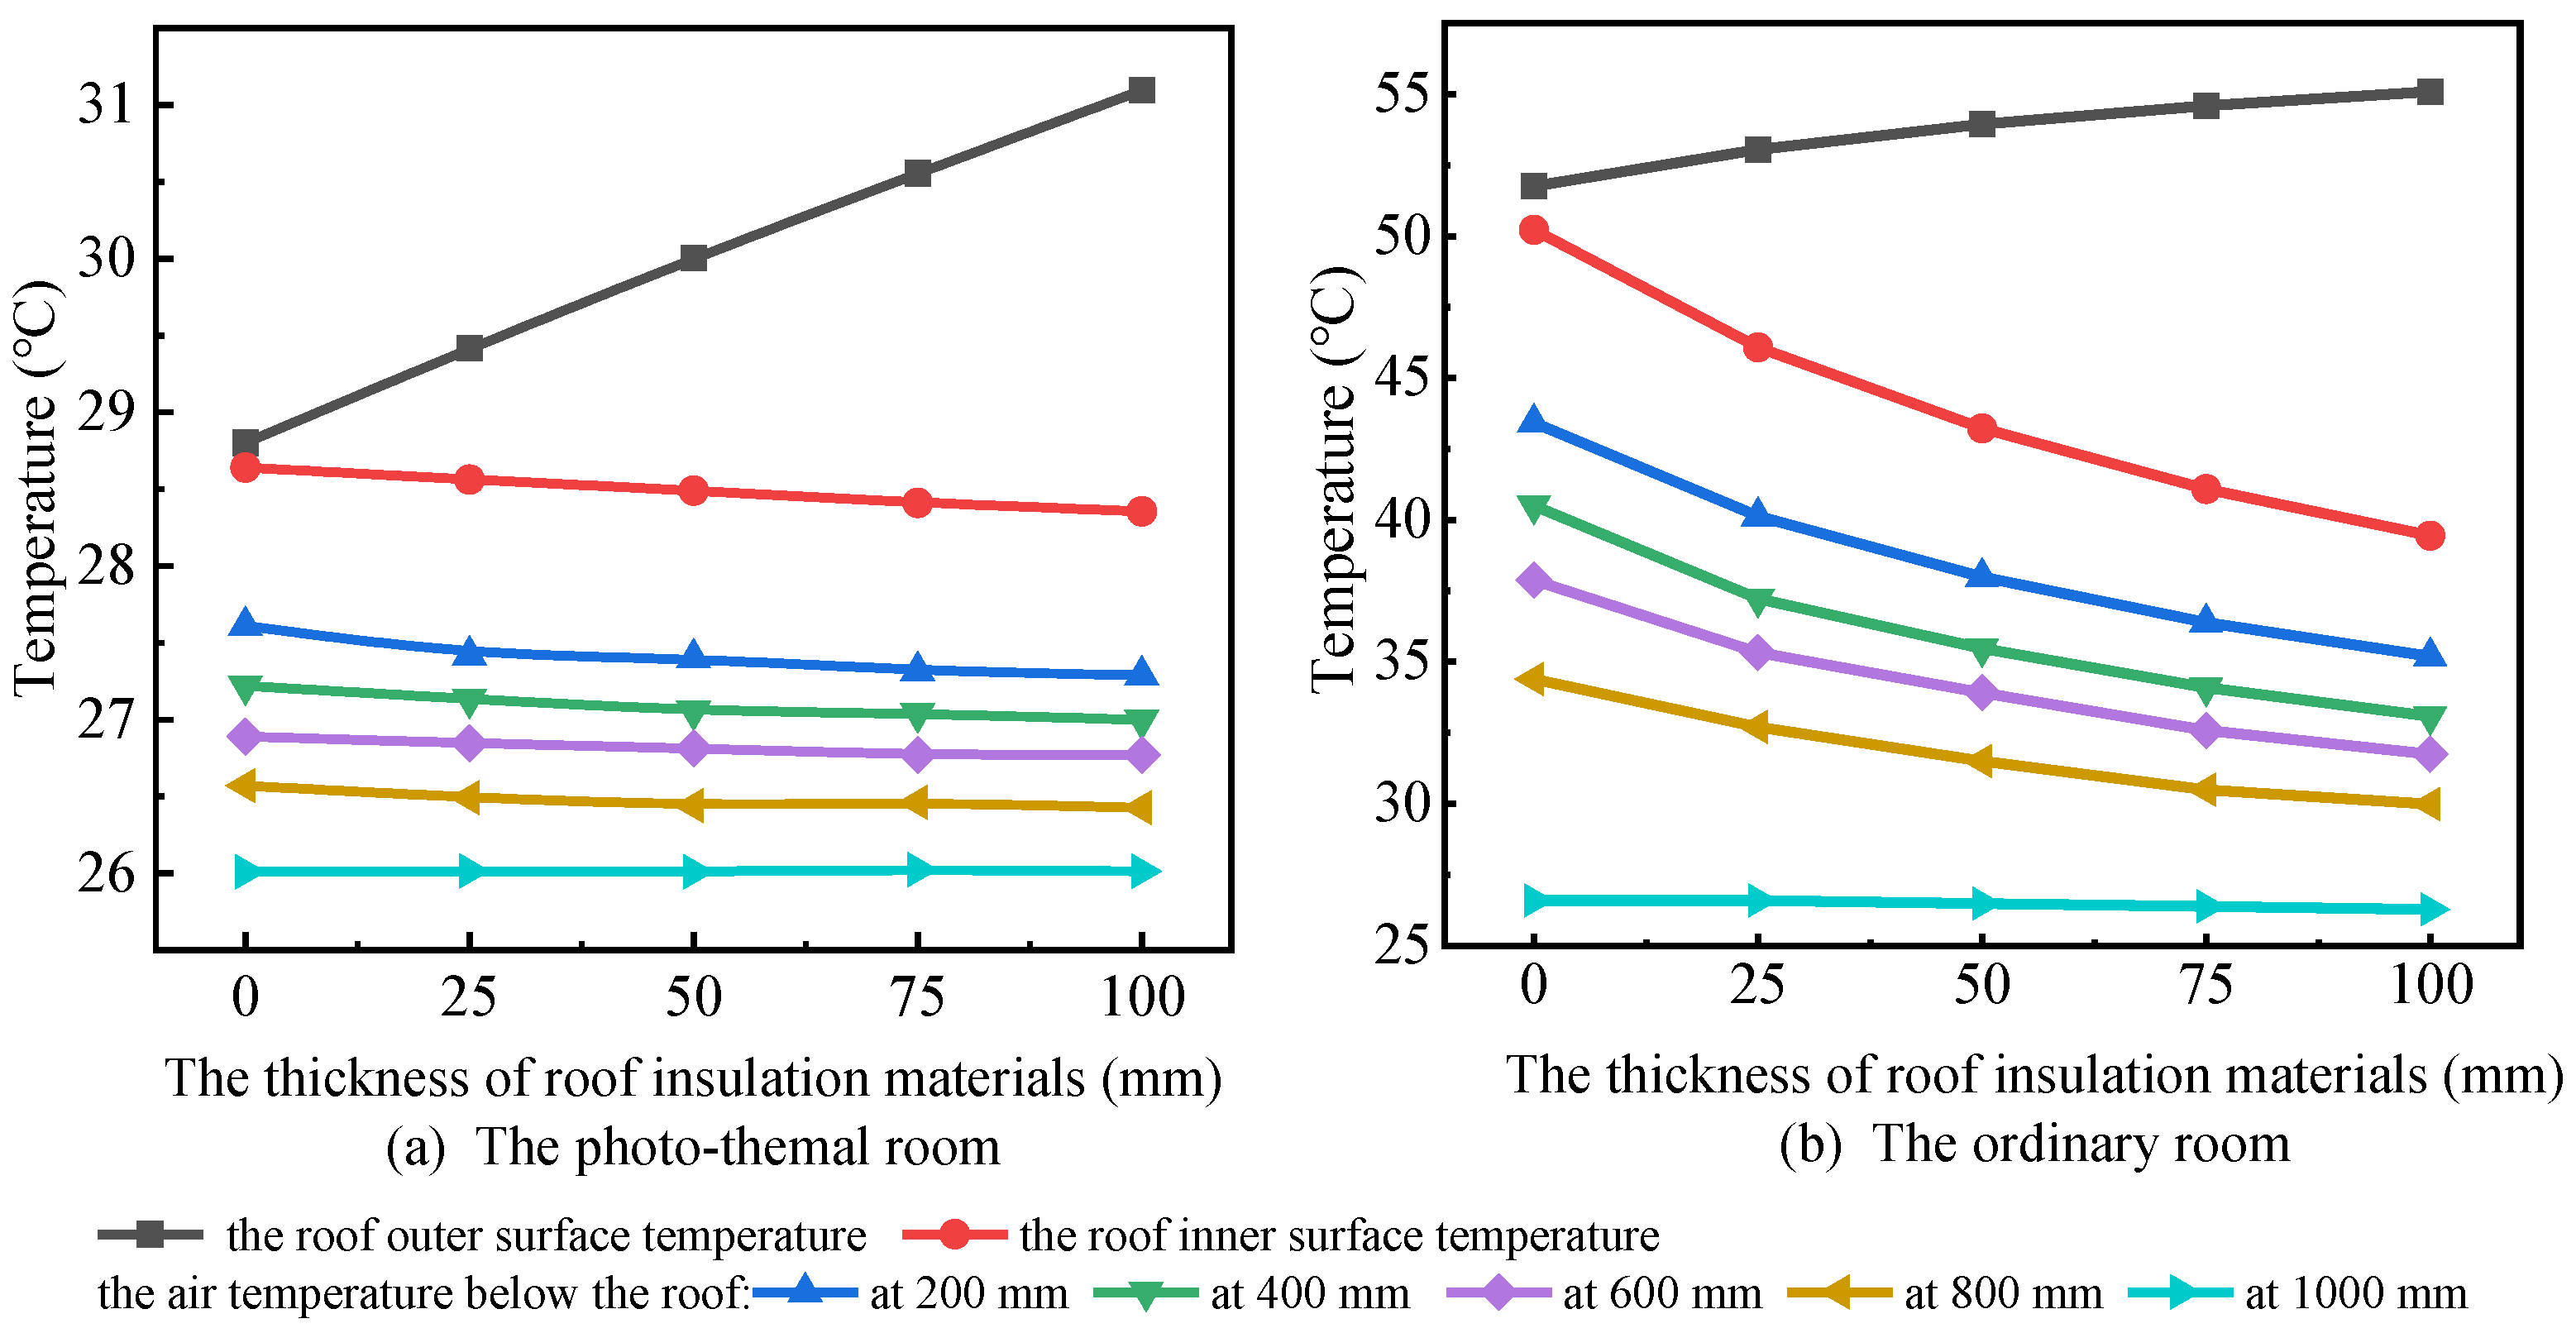
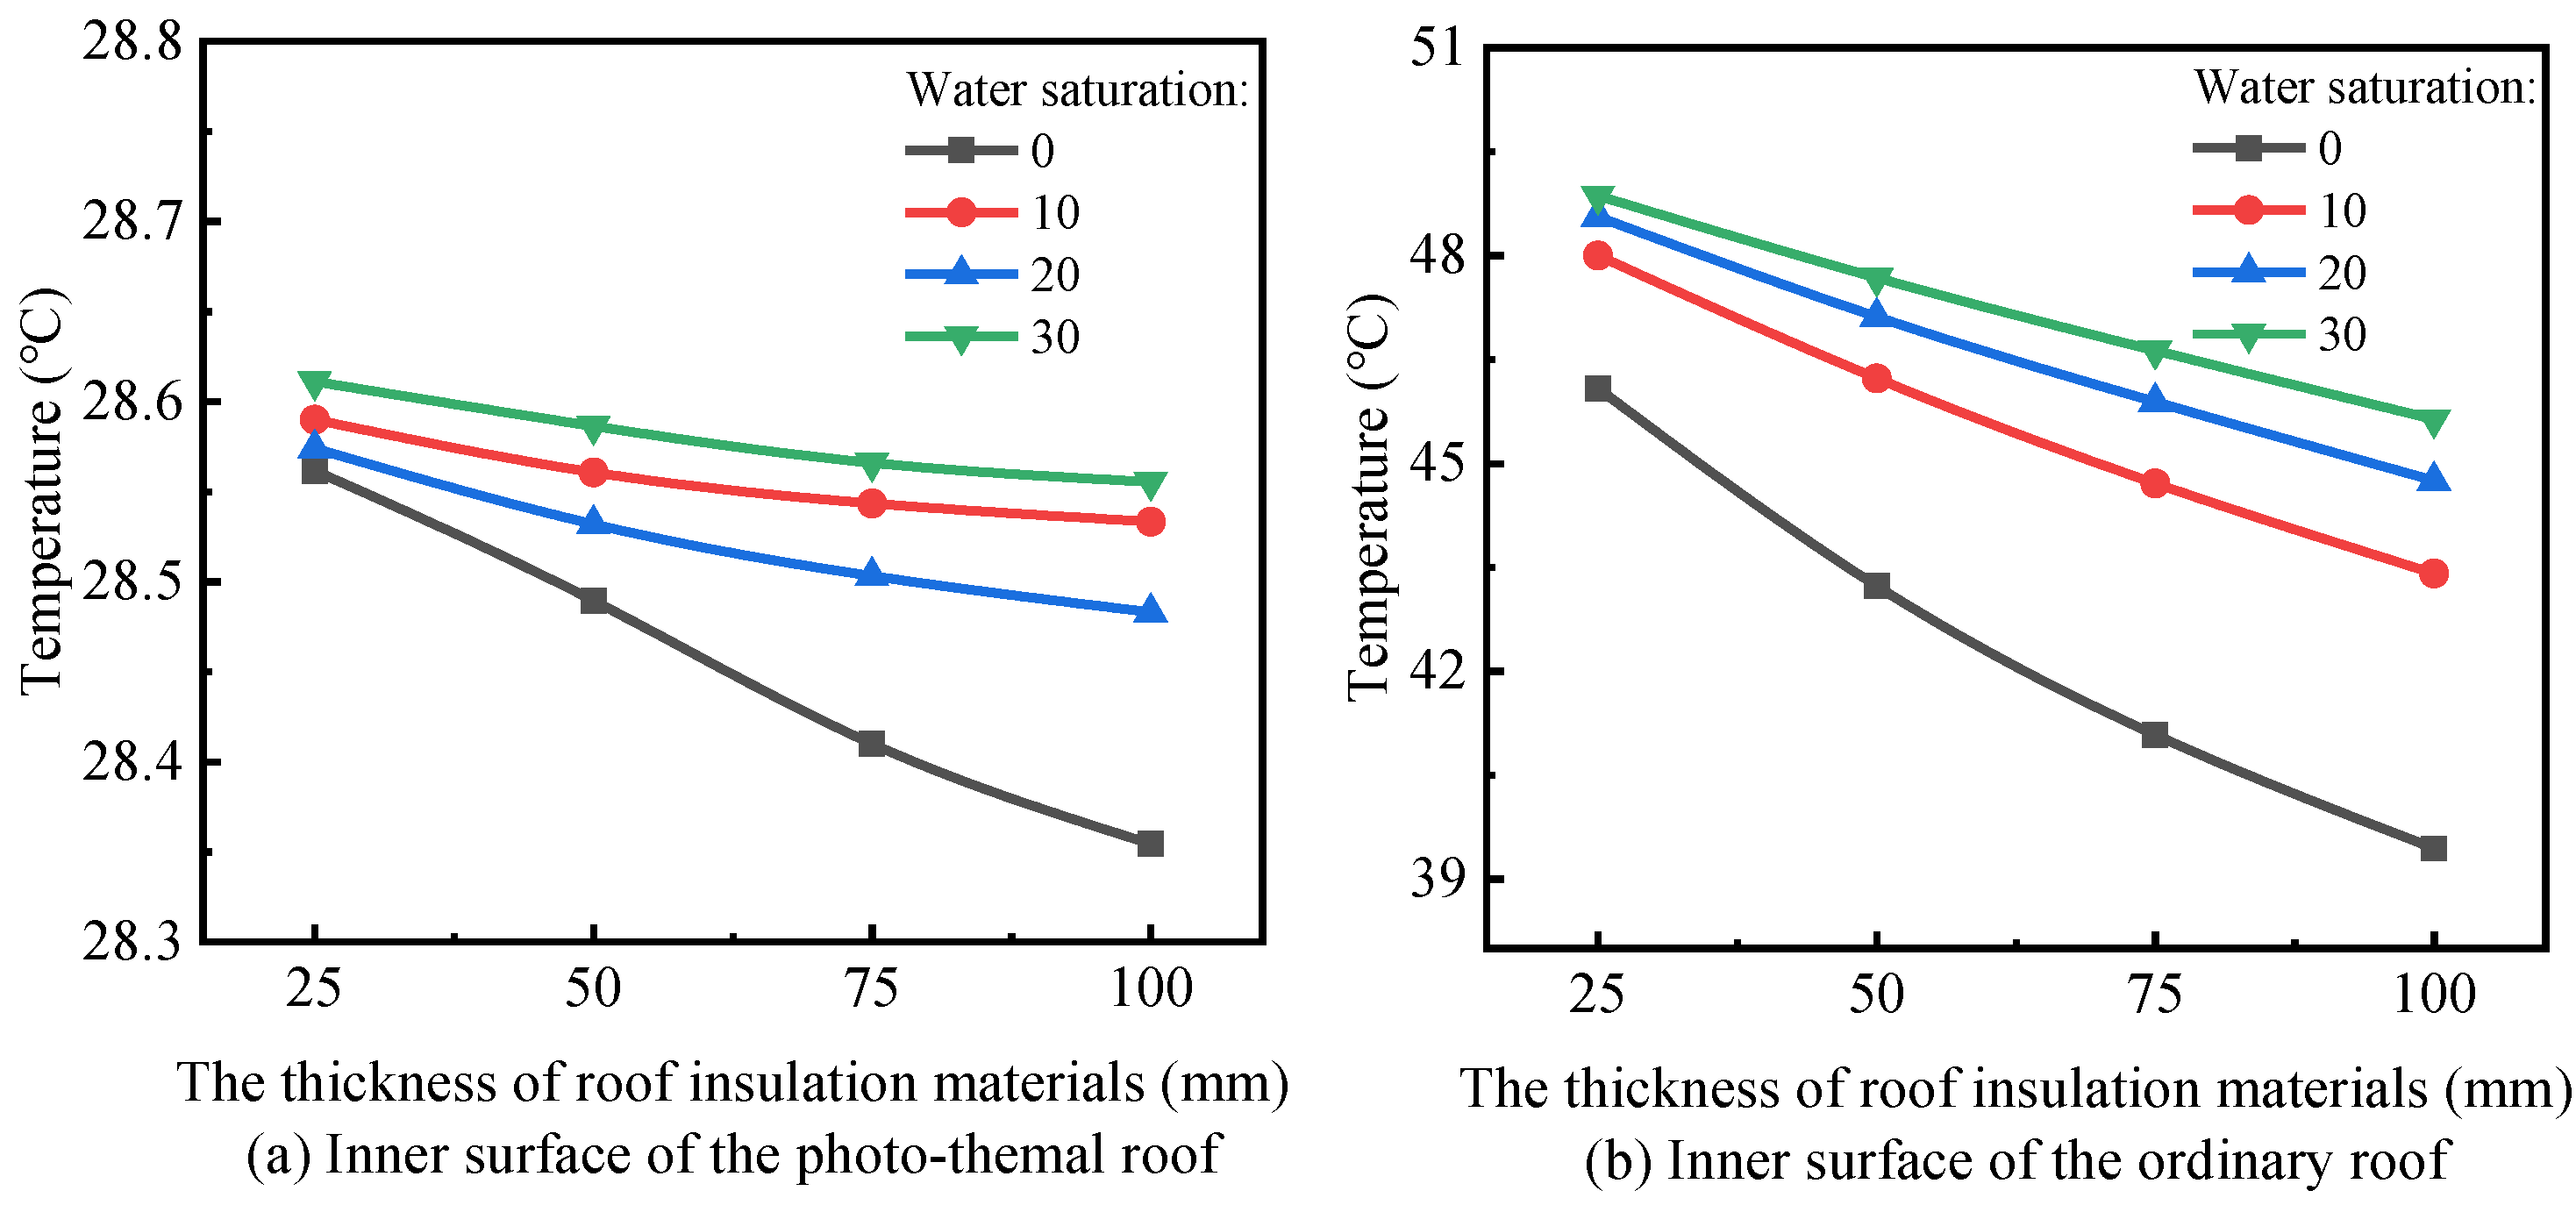
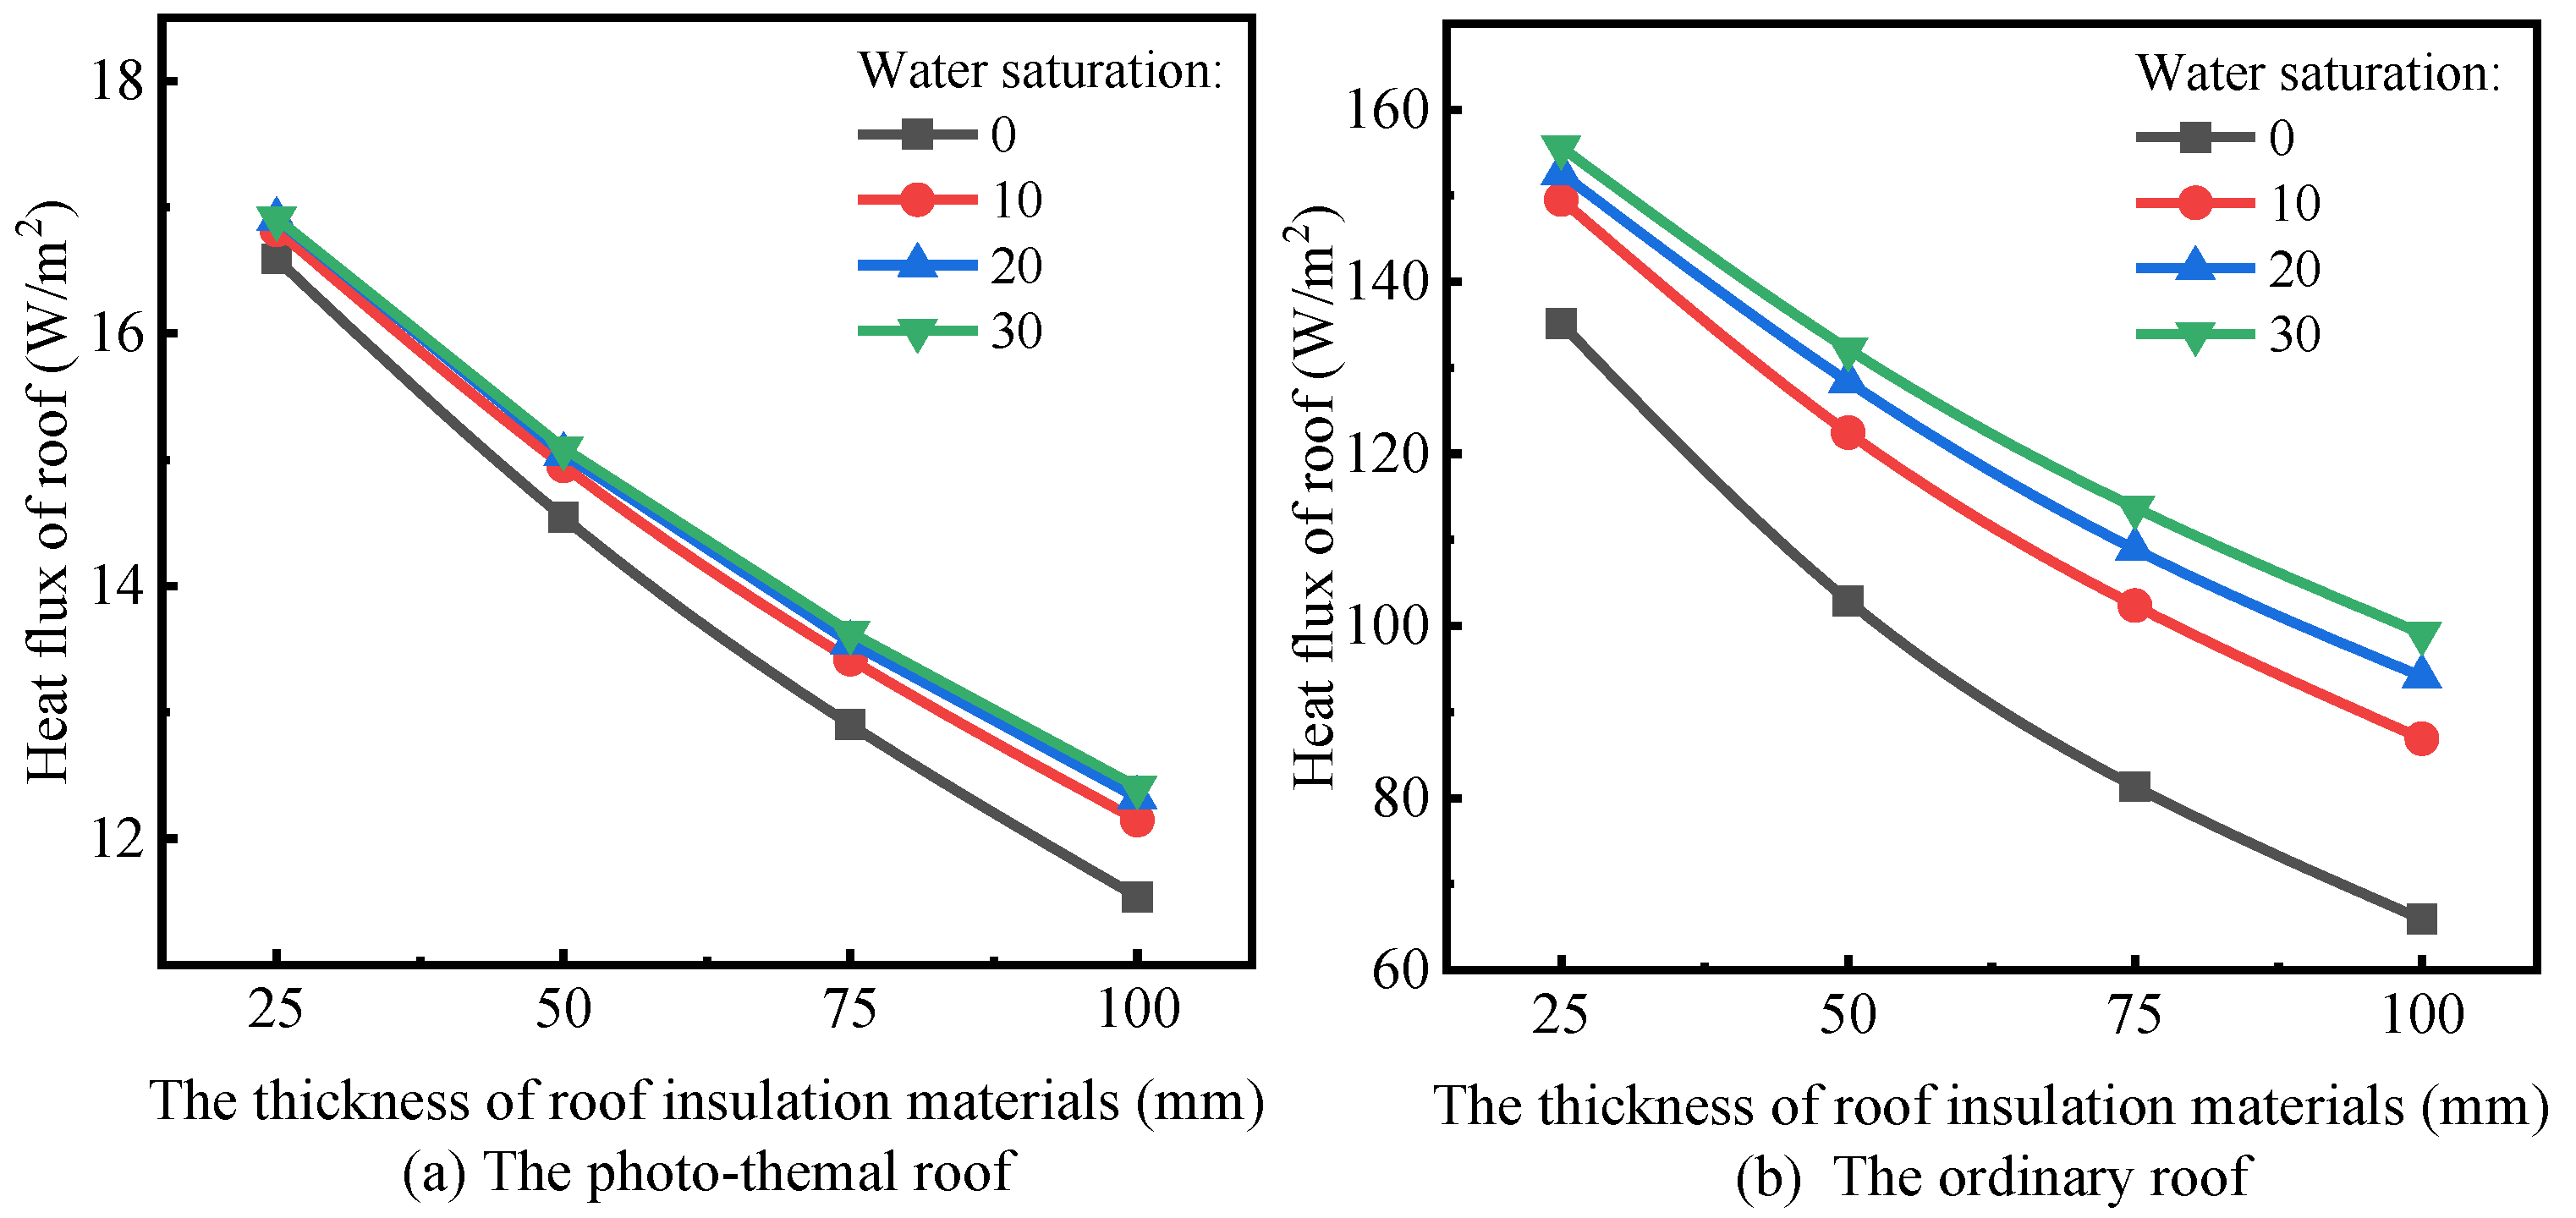
3.3. Effect of the Thickness of Roof Insulation Materials

In order to obtain an excellent thermal insulation performance, roof materials with low thermal conductivity are usually used. There are certain requirements regarding the thickness of thermal insulation materials. In hot summer and cold winter zones, 100 mm thick rock wool boards are usually used as roof insulation materials.
To determine the relationships among the temperature, heat flux, and roof insulation material thickness with the photo-thermal roof and the ordinary roof, the solar radiation intensity was set to 1000 W/m2, the air temperature was set to 35.8 °C, the water saturation level was set to 0, and the water flow was adjusted to keep the pipe wall temperature constant at 50 °C, as shown in the Figure 10 and Figure 11.
As shown in Figure 10 and Figure 11, the inner surface temperature and the indoor non-working area temperature of the roofs increased as the thickness of the insulation material decreased, while the temperature of the roof outer surface decreased. The heat flux of the roofs increased as the thickness of the insulation material decreased. When the thickness of insulation material was 100 mm, in contrast with the high temperature of 55.1 °C measured on the outside surface of the ordinary roof, the temperature of the photo-thermal roof was only 31.1 °C, a decrease of 43.2%. The inner surface temperature of the photo-thermal roof was 28.4 °C, which is 27.9% lower than that of the ordinary roof. The heat transfer per unit area of the photo-thermal roof also decreased from 65.9 W/m2 to 11.5 W/m2, a decrease of 82.5%.
When the insulation material thickness was reduced to 0, the inner surface temperature of the ordinary roof was 50.2 °C and the heat flux was 181.1 W/m2. Under the same conditions, the inner surface temperature of the photo-thermal roof was 28.6 °C, a reduction of 38.0% compared with that of the ordinary roof, and the heat flux was 19.2 W/m2, a reduction of 89.4% compared with the ordinary roof.
As shown in Figure 10 and Figure 11, the indoor non-working area temperature of the ordinary roof reached to 40.1 °C when the thickness of the insulation material was reduced from 100 mm to 0 mm. In the same situation, the maximum temperature of the indoor non-working area of the photo-thermal room was only 28.1 °C, slightly higher than the temperature of the working area. Therefore, even when the thickness of the insulation layer was 0 mm, the photo-thermal roof still had an excellent thermal insulation performance.
Under actual conditions, the water saturation of the roof insulation materials may change periodically and cannot always be maintained in a completely dry state. If the thickness and water saturation of the roof insulation material changes, the inner surface temperature and heat flux will change under the above environmental conditions. Changes are shown in Figure 12 and Figure 13.
A change in water saturation affects the effective thermal conductivity of the roof: the greater the water saturation, the greater the heat transfer of the roof, the lower the outer surface temperature of the roof, and the higher the inner surface temperature.
As shown in Figure 12 and Figure 13, a decrease in the thickness of the roof insulation material or an increase in water saturation will promote heat transfer in the roof. When the thickness of the insulation material was constant, the heat transfer of the two roofs continuously increased, and the inner surface temperature of the roofs increased constantly as the water saturation level increased. When the water saturation level was 30% and the thickness of the roof insulation material was 100 mm, the inner surface temperature of the ordinary roof was 45.6 °C and the heat flux was 99.1 W/m2. The inner surface temperature of the photo-thermal roof was 28.6 °C, 41.5% lower than that of the ordinary roof. The heat flux of the photo-thermal roof was 12.4 W/m2, 87.5% lower than that of the ordinary roof. When the water saturation level was 30% and the thickness of the roof insulation material was 25 mm, the inner surface temperature of the ordinary roof was 48.9 °C and the heat flux was 155.6 W/m2. The inner surface temperature of the photo-thermal roof was 28.5 °C, 41.7% lower than that of the ordinary roof. The heat flux of the photo-thermal roof was 16.9 W/m2, 89.1% lower than that of the ordinary roof. It can also be seen from Figure 11 and Figure 12 that the inner surface temperature of the photo-thermal roof was about 28.5 °C, which is only about 2.5 °C higher than the working area temperature as the thickness of the roof insulation layer changed from 100 mm to 25 mm and the water saturation of the insulation material increased from 0 to 30%. Thus, even when the insulation layer thickness was 25 mm and the water saturation level was high, the insulation performance of the photo-thermal roof was still good.
In summary, a decrease in the thickness of insulation material will lead to an increase in cooling load. In order to reduce the energy consumption of an air conditioner, the thickness of insulation material should be appropriately increased. The roof insulation layer is often made of porous materials. Water entering the pores of porous materials will weaken the thermal insulation performance of the roof. With high water saturation and thin thickness of the insulation layer, the photo-thermal roof can still maintain a good thermal insulation performance.

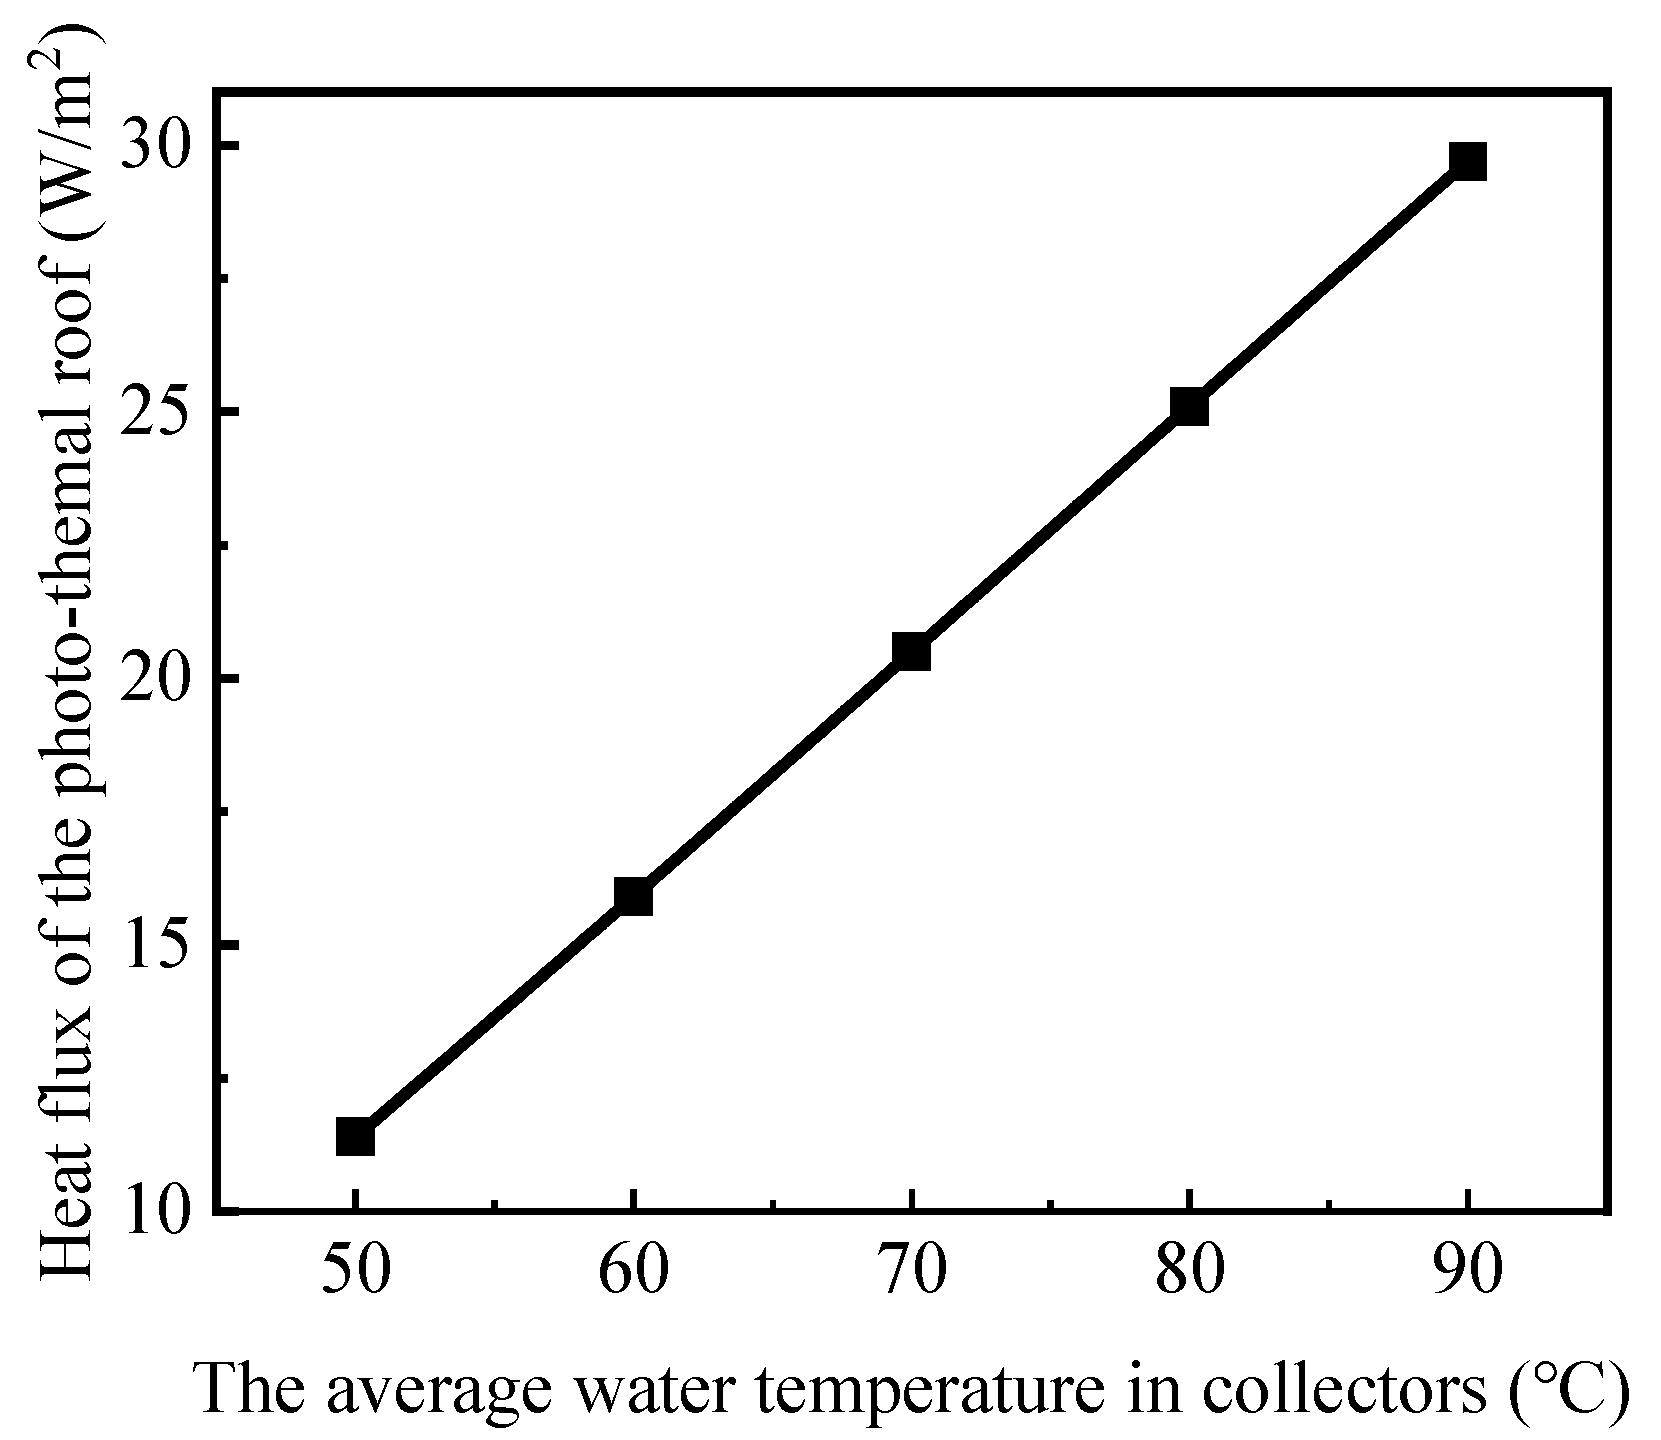
3.4. Variation in the Average Water Temperature of the Collectors

In practical projects, a certain level of moisture exists in a building’s thermal insulation materials, and the thermal conductivity is corrected. Generally, the corrected effective thermal conductivity of rock wool board is 0.07 W/(m·K). Figure 14 shows the influence of the water temperature in the collector on the temperature distribution of the room when the solar radiation intensity was 1000 W/m2, the air temperature was 35.8 °C, and the thickness of the rock wool board was 100 mm.
As shown in Figure 14, the temperature of the photo-thermal roof and the non-working area increased as the average water temperature in the collectors increased. When the average water temperature rose from 50 °C to 90 °C, the outer surface temperature of the photo-thermal roof rose from 29.9 °C to 36.5 °C, an increase of 6.6%. The inner surface temperature of the photo-thermal roof increased from 28.4 °C to 32.4 °C, an increase of 14.1%. The average temperature of the indoor non-working area increased from 26.9 °C to 29.1 °C, an increase of 8.2%. However, compared with the temperature of the ordinary roof, the photo-thermal roof still showed an excellent insulation effect. Even when the average water temperature in the collectors was 90 °C, compared with the temperature of the ordinary roof, the outer surface temperature of the photothermal roof decreased by 32.7%, the inner surface temperature decreased by 23.9%, and the average temperature in the indoor non-working area decreased by 15.2%. The increase of the average water temperature also increases the roof temperature gradient. When the average water temperature rose from 50 °C to 90 °C, the vertical temperature gradient of the photo-thermal roof rose from 5.0 W/m to 13.6 W/m. However, when the average water temperature was 90 °C, the temperature gradient of the photo-thermal roof was still 64.8% lower than that of the ordinary roof.
When the solar radiation intensity was 1000 W/m2, the air temperature was 35.8 °C, the thickness of the rock wool board was 100 mm, and the effective thermal conductivity was 0.07 W/(m·K), the heat transfer of the photo-thermal roof was affected by the change in the average water temperature in the collectors, as shown in Figure 15.
It can be seen from Figure 15 that an increase in the average water temperature in the collectors led to an increase in the photothermal roof heat transfer. When the water temperature increased from 50 °C to 90 °C, the roof heat transfer increased from 11.4 W/m2 to 29.7 W/m2, an increase of 160.5%. This occurred because the radiant heat transfer between the collector’s rear cover and the roof is the main source of heat received by the photo-thermal roof. The increase in the average water temperature also increased the temperature of the collector’s rear cover and enhanced the radiant heat transfer of the collector to the photo-thermal roof.
Under the same environmental conditions, the heat transfer of the ordinary roof was 82.1 W/m2. Even when the average water temperature was 90 °C, the heat transfer of the photo-thermal roof was 65.0% lower than that of the ordinary roof.
In order to explore the possibility of reducing the thickness of the thermal insulation layer of the photo-thermal roof under high water temperature, this paper also simulated a photo-thermal roof without insulation materials.
When the solar radiation intensity was 1000 W/m2, the air temperature was 35.8 °C and the average water temperature in the collectors was 90 °C, and the thickness of the insulation layer was adjusted; the temperature distribution in the photo-thermal room is shown in Figure 16.
As shown in Figure 16, when the thickness of the insulation layer decreased from 100 mm to 0 mm, the vertical temperature gradient of the roof decreased from 13.7 °C/m to 1.3 °C/m, the outer surface temperature of the roof decreased from 36.5 °C to 3.2 °C, the inner surface temperature increased from 32.4 °C to 32.8 °C, and the average temperature of the indoor non-working area increased from 29.1 °C to 29.3 °C. Under the above simulated conditions, when the thickness of the insulation layer changed from 100 mm to 0 mm, the roof heat transfer increased from 29.7 W/m2 to 31.5 W/m2. Therefore, the vertical temperature gradient of the photo-thermal roof is greatly reduced without insulation materials, but the increase of roof heat transfer is small. The roof insulation layer is not set, which increases the heat transfer coefficient and enhances the heat transfer of the photo-thermal roof. However, most of the heat by solar irradiation is absorbed by the water flow in the collector, and the heat transmitted to the roof is small. Increasing the heat transfer coefficient of the roof can increase the heat transfer less. From the above data, the heat transfer of the photo-thermal roof without the insulation layer is only increased by 0.8 W/m2, the inner surface temperature is increased by 0.4 °C, and the average temperature of the indoor non-working area is increased by 0.2 °C. When the water temperature is 90 °C, the cancellation of the insulation layer of the photo-thermal roof has little impact on the thermal insulation performance of the roof.
In summary, since the water flow in the collector takes away the heat energy converted by solar energy, the thermal insulation performance of photo-thermal roof is better. An increase in the average water temperature of the collector will lead to an increase in the heat transfer of the photo-thermal roof, the roof temperature, and the indoor non-working area temperature. However, when the average water temperature is 90 °C, compared with ordinary roofs, the photo-thermal roof still has smaller heat transfer, lower roof temperature, and indoor non-working area temperature. At this time, even if the insulation material thickness was reduced to 0 mm, the photo-thermal roof still has good thermal insulation performance.

4. Conclusions

This paper studies the thermal insulation performance of a building roof combined with photothermal technology. In the summer climate of a hot summer and cold winter area, the thermal performance of the photo-thermal roof and the ordinary roof is simulated, and the following conclusions are obtained:
(1) Compared with the ordinary roof, the photo-thermal roof has smaller heat transfer, and lower roof temperature and indoor non-working area temperature. Adjusting the water flow of collectors can change the heat transfer through the roof. The photo-thermal roof has better insulation performance than the ordinary roof. Under the action of outdoor calculated temperature of air conditioning in summer, when the solar radiation intensity is 1000 W/m2, the heat transfer per unit area of the photo-thermal roof is 82.5% lower than that of the ordinary roof.
(2) The water saturation of roof insulation materials is an important factor affecting insulation performance, and the influence of water saturation on the insulation performance of the ordinary roof is greater than that of the photo-thermal roof. Under the simulated conditions, the water saturation increases from 0 to 30%, the inner surface temperature of the ordinary roof rise is 6.2 °C, the photo-thermal roof temperature rise is only 0.2 °C, a decrease of 96.8%; the heat transfer per unit area of the ordinary roof increases by 33.2 W/m2, and the photo-thermal roof increases by 0.9 W/m2, a decrease of 97.3%.
(3) The influence of the insulation material thickness change on the insulation performance of the photo-thermal roof is less than the ordinary roof. When the thickness is very small, the photo-thermal roof still has excellent insulation performance. When the roof insulation layer is cancelled, the inner surface temperatures of the ordinary roof and the photo-thermal roof are 50.2 °C and 28.6 °C, respectively, and the average temperature of the indoor non-working area can reach 38.5 °C and 27.1 ℃, respectively. The insulation thickness of the photo-thermal roof can be reduced or even cancelled.

Author Contributions

Conceptualization, Y.Z. and H.S.; methodology, H.S.; software, Y.Z.; validation, J.L.; data curation, L.Z. and X.S.; writing—original draft preparation, Y.Z., H.S., L.Z. and X.S.; writing—review and editing, Y.Z., H.S. and J.L; supervision, H.S.; project administration, H.S.; funding acquisition, H.S. All authors have read and agreed to the published version of the manuscript.

Funding

This work was supported by the National Natural Science Foundation of China (Grant No.52108099) and the Excellent Youth Project of Education Bureau of Hunan Province, China (Grant No.21B0134).

Institutional Review Board Statement

The study did not require ethical approval.

Informed Consent Statement

Informed consent was obtained from all subjects involved in the study.

Data Availability Statement

Not applicable.

Conflicts of Interest

The authors declare no conflict of interest.

Nomenclature

CSpecific heat capacity of materials (J/(kg·K))
DIndex of thermal inertia
EThe total energy composed of thermodynamic and kinetic energy (J/kg)
hgConvective heat transfer coefficient of the glass cover (W/m2·K)
hi,wconvective heat transfer coefficient of the inner surface of each material layer (W/m2·K)
hjEnthalpy of matter (kJ/kg)
ho,wconvective heat transfer coefficient of the outer surface of each material layer (W/m2·K)
ISolar radiation intensity (W/m2)
JJDiffusion flux (kg/(m2·s))
PPressure (Pa)
qc,bHeat convection between the collector’s back surface and the air (W/m2)
qc,gHeat convection between the glass cover and the external environment (W/m2)
qc,inHeat convection between the roof inner surface and the indoor air (W/m2)
qc,outHeat convection between the photo-thermal roof and the air (W/m2)
qcondConductive heat flux (W/m2)
QwReleased heat by hot water (W)
qr,bHeat radiation of the collector’s back surface to the roof (W/m2)
qr,gHeat radiation of the glass cover to the external environment (W/m2)
qr,inHeat radiation of the roof inner surface to the indoor environment (W/m2)
qr,outHeat radiation of the roof to the collector’s back surface (W/m2)
SiThermal effusivity of wall inner surface (W/m2·K)
SoThermal effusivity of wall outer surface (W/m2·K)
ShHeat source (W/m3)
TbTemperature of the back surface of the collector (℃)
TgThe temperature of the glass cover (℃)
Tnother surface temperatures in the room (℃)
TskySky temperature (℃)
Ti,aThe temperature of air in contact with the inner surface of the material layer (℃)
To,aThe temperature of air in contact with the outer surface of the material layer (℃)
Ti,wThe roof inner surface temperature (℃)
To,wThe roof outer surface temperature (℃)
αgAbsorptivity of the glass cover
αpAbsorptivity of the absorber plate
αwAbsorptivity of roof outer surface
αi,wHeat transfer coefficient of wall inner surface (W/m2·K)
αo,wHeat transfer coefficient of wall outer surface (W/m2·K)
λaThermal conductivity of air (W/(m·k))
λeThermal conductivity of roof materials (W/(m·k))
λecEffective thermal conductivity of porous media satisfying serial heat conduction model (W/(m·k))
λepEffective thermal conductivity of porous media satisfying parallel heat conduction model (W/(m·k))
λlThermal conductivity of liquid phase in porous media (W/(m·k))
λpThermal conductivity of solar collectors (W/(m·k))
λsThermal conductivity of solid phase in porous media (W/(m·k))
εaThe volume percentage of the gas phase per unit volume (%)
εbEmissivity of the collector rear cover
εgEmissivity of the glass cover
εi,wEmissivity of the roof inner surface
εo,wEmissivity of the roof outer surface
τUnit time
τgTransmissivity of the glass cover
φWater saturation (%)
σThe Boltzmann constant, σ = 5.67 × 10⁻⁸ W/(m2·K4)
ϕTime lag

References

  1. Zhou, N.; Price, L.; Yande, D.; Creyts, J.; Khanna, N.; Fridley, D.; Lu, H.; Feng, W.; Liu, X.; Hasanbeigi, A.; et al. A roadmap for China to peak carbon dioxide emissions and achieve a 20% share of non-fossil fuels in primary energy by 2030. Appl. Energy 2019, 239, 793–819. [Google Scholar] [CrossRef]
  2. IEA. Online Data Services. 2019. Available online: https://www.iea.org/buildings (accessed on 20 February 2022).
  3. Lu, X.; Memari, A.M. Comparison of the Experimental Measurement Methods for Building Envelope Thermal Transmittance. Buildings 2022, 12, 282. [Google Scholar] [CrossRef]
  4. International Energy Agency. Energy and Climate Change: World Energy Outlook Special Report 2015; International Energy Agency: Paris, France, June 2015. [Google Scholar]
  5. Nikkho, S.K.; Heidarinejad, M.; Liu, J.; Srebric, J. Quantifying the impact of urban wind sheltering on the building energy consumption. Appl. Therm. Eng. 2017, 116, 850–865. [Google Scholar] [CrossRef] [Green Version]
  6. Xin, Z.; Xw, M.; By, C.; Yp, S.; Ml, S. Challenges toward carbon neutrality in China: Strategies and countermeasures. Resour. Conserv. Recycl. 2021, 176, 105959. [Google Scholar]
  7. Li, H.; Zheng, R. Energy and Economic Performance of Solar Cooling Systems in the Hot-Summer and Cold-Winter Zone. Buildings 2018, 8, 37. [Google Scholar] [CrossRef]
  8. Notton, G. Tu1205 Projet Cost Overview of BISTS State of the Art, Models and Applications. COST Action TU1205 (BISTS): Building Integration of Solar Thermal Systems; European Cooperation in Science and Technology (COST): Brussels, Belgium, 2015. [Google Scholar]
  9. Celadyn, W.; Filipek, P. Investigation of the Effective Use of Photovoltaic Modules in Architectu re. Buildings 2020, 10, 145. [Google Scholar] [CrossRef]
  10. Piratheepan, M.; Anderson, T. Performance of a Building Integrated Photovoltaic/Thermal Concentrator for Facade Applications. Sol. Energy 2017, 153, 562–573. [Google Scholar] [CrossRef] [Green Version]
  11. Fekete, I.; Farkas, I. Numerical and experimental study of building integrated solar tile collectors. Renew. Energy 2018, 137, 45–55. [Google Scholar] [CrossRef]
  12. Deng, C.; Chen, F. Preliminary investigation on photo-thermal performance of a novel embedded building integrated solar evacuated tube collector with compound parabolic concentrator. Energy 2020, 202, 117706. [Google Scholar] [CrossRef]
  13. Lin, W.; Ma, Z.; Wang, S.; Sohel, M.; Cascio, E.L. Experimental investigation and two-level model-based optimisation of a solar photovoltaic thermal collector coupled with phase change material thermal energy storage. Appl. Therm. Eng. 2021, 182, 116098. [Google Scholar] [CrossRef]
  14. Pugsley, A.; Zacharopoulos, A.; Mondol, J.D.; Smyth, M. BIPV/T facades—A new opportunity for integrated collector-storage solar water heaters? Part 1: State-of-the-art, theory and potential. Sol. Energy 2020, 207, 317–335. [Google Scholar] [CrossRef]
  15. Harmim, A.; Boukar, M.; Amar, M.; Haida, A. Simulation and experimentation of an integrated collector storage solar water heater designed for integration into building facade. Energy 2018, 166, 59–71. [Google Scholar] [CrossRef]
  16. Gautam, K.R.; Andresen, G.B. Performance comparison of building-integrated combined photovoltaic thermal solar collectors (BiPVT) with other building-integrated solar technologies. Sol. Energy 2017, 155, 93–102. [Google Scholar] [CrossRef]
  17. Luo, K.; Ji, J.; Xu, L.; Li, Z. Seasonal experimental study of a hybrid photovoltaic-water/air solar wall system. Appl. Therm. Eng. 2019, 169, 114853. [Google Scholar] [CrossRef]
  18. Rahmani, F.; Robinson, M.A.; Barzegaran, M.R. Cool roof coating impact on roof-mounted photovoltaic solar modules at texas green power microgrid. Int. J. Electr. Power Energy Syst. 2021, 130, 106932. [Google Scholar] [CrossRef]
  19. Christoph, M.; Christoph, C.; Tilmann, E.K. Progress in building-integrated solar thermal systems. Sol. Energy 2017, 154, 158–186. [Google Scholar]
  20. Ahmed, S.; Li, Z.; Javed, M.S.; Ma, T. A review on the integration of radiative cooling and solar energy harvesting. Mater. Today Energy 2021, 21, 100776. [Google Scholar] [CrossRef]
  21. Yu, G.; Yang, H.; Yan, Z.; Ansah, M.K. A review of designs and performance of facade-based building integrated photovoltaic-thermal (BIPVT) systems. Appl. Therm. Eng. 2021, 182, 116081. [Google Scholar] [CrossRef]
  22. Shao, N.; Ma, L.; Zhang, J. Experimental study on electrical and thermal performance and heat transfer characteristic of PV/T roof in summer. Appl. Therm. Eng. 2019, 162, 114276. [Google Scholar] [CrossRef]
  23. Ponechal, R.; Barňák, P.; Ďurica, P. Comparison of Simulation and Measurement in a Short-Term Evaluation of the Thermal Comfort Parameters of an Office in a Low-Carbon Building. Buildings 2022, 12, 349. [Google Scholar] [CrossRef]
  24. Sourek, M.B. Façade solar collectors. Sol. Energy 2006, 80, 1443–1452. [Google Scholar]
  25. Buonomano, A.; Forzano, C.; Kalogirou, S.A.; Palombo, A. Building-façade integrated solar thermal collectors: Energy-economic performance and indoor comfort simulation model of a water-based prototype for heating, cooling, and DHW production. Renew. Energy 2018, 137, 20–36. [Google Scholar] [CrossRef]
  26. Chang, H.; Hou, Y.; Lee, I.; Liu, T.; Acharya, T.D. Feasibility Study and Passive Design of Nearly Zero Energy Building on Rural Houses in Xi’an, China. Buildings 2022, 12, 341. [Google Scholar] [CrossRef]
  27. Gao, Y.; Shi, D.; Levinson, R.; Guo, R.; Lin, C.; Ge, J. Thermal performance and energy savings of white and sedum-tray garden roof: A case study in a Chongqing office building. Energy Build. 2017, 156, 343–359. [Google Scholar] [CrossRef] [Green Version]
  28. Tong, S.; Li, H.; Zingre, K.T.; Wan, M.P.; Chang, W.C.; Wong, S.K.; Toh, W.B.T.; Lee, I.Y.L. Thermal performance of concrete-based roofs in tropical climate. Energy Build. 2014, 76, 392–401. [Google Scholar] [CrossRef]
  29. Barone, G.; Buonomano, A.; Forzano, C.; Giuzio, G.F.; Palombo, A. Passive and active performance assessment of building integrated hybrid solar photovoltaic/thermal collector prototypes: Energy, comfort, and economic analyses. Energy 2020, 209, 118435. [Google Scholar] [CrossRef]
  30. Long, J.; Jiang, M.; Lu, J.; Du, A. Vertical temperature distribution characteristics and adjustment methods of a trombe wall. Build. Environ. 2019, 165, 106386. [Google Scholar] [CrossRef]
  31. Bowen, B.D. “Heat transfer-A basic approach”, by M. Necati Öuzisik, 1985, 780 pages, mcgraw-hill book company, (U.S.). Can. J. Chem. Eng. 1988, 66, 1036–1037. [Google Scholar] [CrossRef]
  32. Zhou, J. Study on Microstructure and Energy Saving Characteristics of Rock Wool Board Used for Building External Wall Insulation System. Master’s Thesis, Chang’an University, Xi’an, China, 2018. [Google Scholar]
  33. GB50736-2012; Design Code for Heating Ventilation and Air Conditioning of Civil Buildings: GB50736-2012. China Architecture & Building Press: Beijing, China, 2012.
  34. Heat Transfer under Periodic Heat Action; China Architecture & Building Press: Beijing, China, 1964.
Figure 1. The experimental roof situation.
Buildings 12 00410 g001
Figure 2. Locations of detectors.
Buildings 12 00410 g002
Figure 3. Roof heat transfer model.
Buildings 12 00410 g003
Figure 4. The effect of water saturation on the effective thermal conductivity of the insulation material.
Buildings 12 00410 g004
Figure 5. Variation of the temperature and solar radiation intensity on seven consecutive days.
Buildings 12 00410 g005
Figure 6. Variation in the temperature and solar radiation intensity on the typical day.
Buildings 12 00410 g006
Figure 7. Variation in the temperature difference between internal and external surfaces and the solar radiation intensity on the typical day.
Buildings 12 00410 g007
Figure 8. The effect of water saturation on temperature distribution in the rooms.
Buildings 12 00410 g008
Figure 9. The influence of water saturation on the heat flux of the roofs.
Buildings 12 00410 g009
Figure 10. The influence of the insulation material thickness on the room temperature distribution.
Buildings 12 00410 g010
Figure 11. The influence of the insulation material thickness on the heat flux in the roofs.
Buildings 12 00410 g011
Figure 12. The influence of the thickness of insulation materials on the roof inner surface temperature when the water saturation changes.
Buildings 12 00410 g012
Figure 13. The influence of the thickness of insulation materials on the heat flux of the roof when the water saturation changes.
Buildings 12 00410 g013
Figure 14. Temperature distribution of the roofs and non-air-conditioned area at different water temperatures.
Buildings 12 00410 g014
Figure 15. Effect of average water temperature in collectors on heat transfer of the photo-thermal roof.
Buildings 12 00410 g015
Figure 16. Effect of insulation material thickness on the temperature of the photo-thermal roof and the indoor non-air-conditioned area under high water temperatures.
Buildings 12 00410 g016
Table 1. Test instruments and types and test parameters.
Test ParametersTest InstrumentTypeAccuracy
Solar radiation intensitySolar pyrometerTBQ-2≤0.2%
TemperatureThermocoupleNi-Cr and Ni-Si±0.5 °C
Data acquisition unitXSR-70A≤0.2%
Table 2. Physical properties of each material layer used in the model.
Material LayersSizeDensity (kg/m3)Specific Heat Capacity (J/(kg·K))Thermal Conductivity (W/(m·K))
x × y × z (mm3)
Glass cover1000 × 2000 × 4.525008400.76
Air layer in collector1000 × 2000 × 451.20510050.026
Absorber plate1000 × 2000 × 1.52719871202.4
Copper pipe8 × 2000 × 88978381387.6
Insulation in collector1000 × 2000 × 555013800.04
Air layer4000 × 5000 × 1001.20510050.026
Reinforced concrete layer1000 × 2000 × 16025008601.73
Insulation layer1000 × 2000 × δ1207500.04
Cement mortar layer1000 × 2000 × 4020008400.87
Table 3. Simulation conditions.
BoundaryTypeValueRemarks
Glass coverConvective heat transfer surfaceαg = 0.12
τg = 0.8
Introduction of solar radiation from the solar ray tracing model.
Absorber plateCoupling surfaceαp = 0.95-
Copper pipeTemperature surface/Coupling surface50 °C/-The temperature of the pipe was kept constant by adjusting the water flow.
Insulation in collectorCoupling surface--
Outside surface of the photo-thermal roofCoupling surface--
Outside surface of the ordinary roofMixedαw = 0.6-
Inner surface of roofsCoupling surface--
Contact surface between air-conditioned area and non-air-conditioned areaCoupling surface--
Table 4. Typical meteorological parameters in summer in Xiangtan City, China.
Solar Radiation Intensity (W/m2)Ambient Temperature (°C)Wind Speed (m/s)Sky Temperature (K)
100035.82.6296
Table 5. Relative mean error for the simulation and experimental results.
Comparison of Simulation and Experimental ResultsOrdinary Roof Outer Surface TemperatureOrdinary Roof Inner Surface TemperaturePhoto-Thermal Roof Outer Surface TemperaturePhoto-Thermal Roof Inner Surface Temperature
Experimental values53.043.237.036.8
Simulation values51.339.733.532.7
RE (%)3.2%8.1%9.5%11.1%
RMSE3.3
Publisher’s Note: MDPI stays neutral with regard to jurisdictional claims in published maps and institutional affiliations.

