
Machine Learning Techniques Focusing on the Energy Performance of Buildings: A Dimensions and Methods Analysis


Abstract
:1. Introduction
- RQ1: What are the most relevant machine learning or statistical approaches that automatically evaluate buildings’ EP using EPC data?
- RQ2: What are the most relevant machine learning or statistical approaches for predicting energy-efficient retrofit measures to improve buildings’ EP?
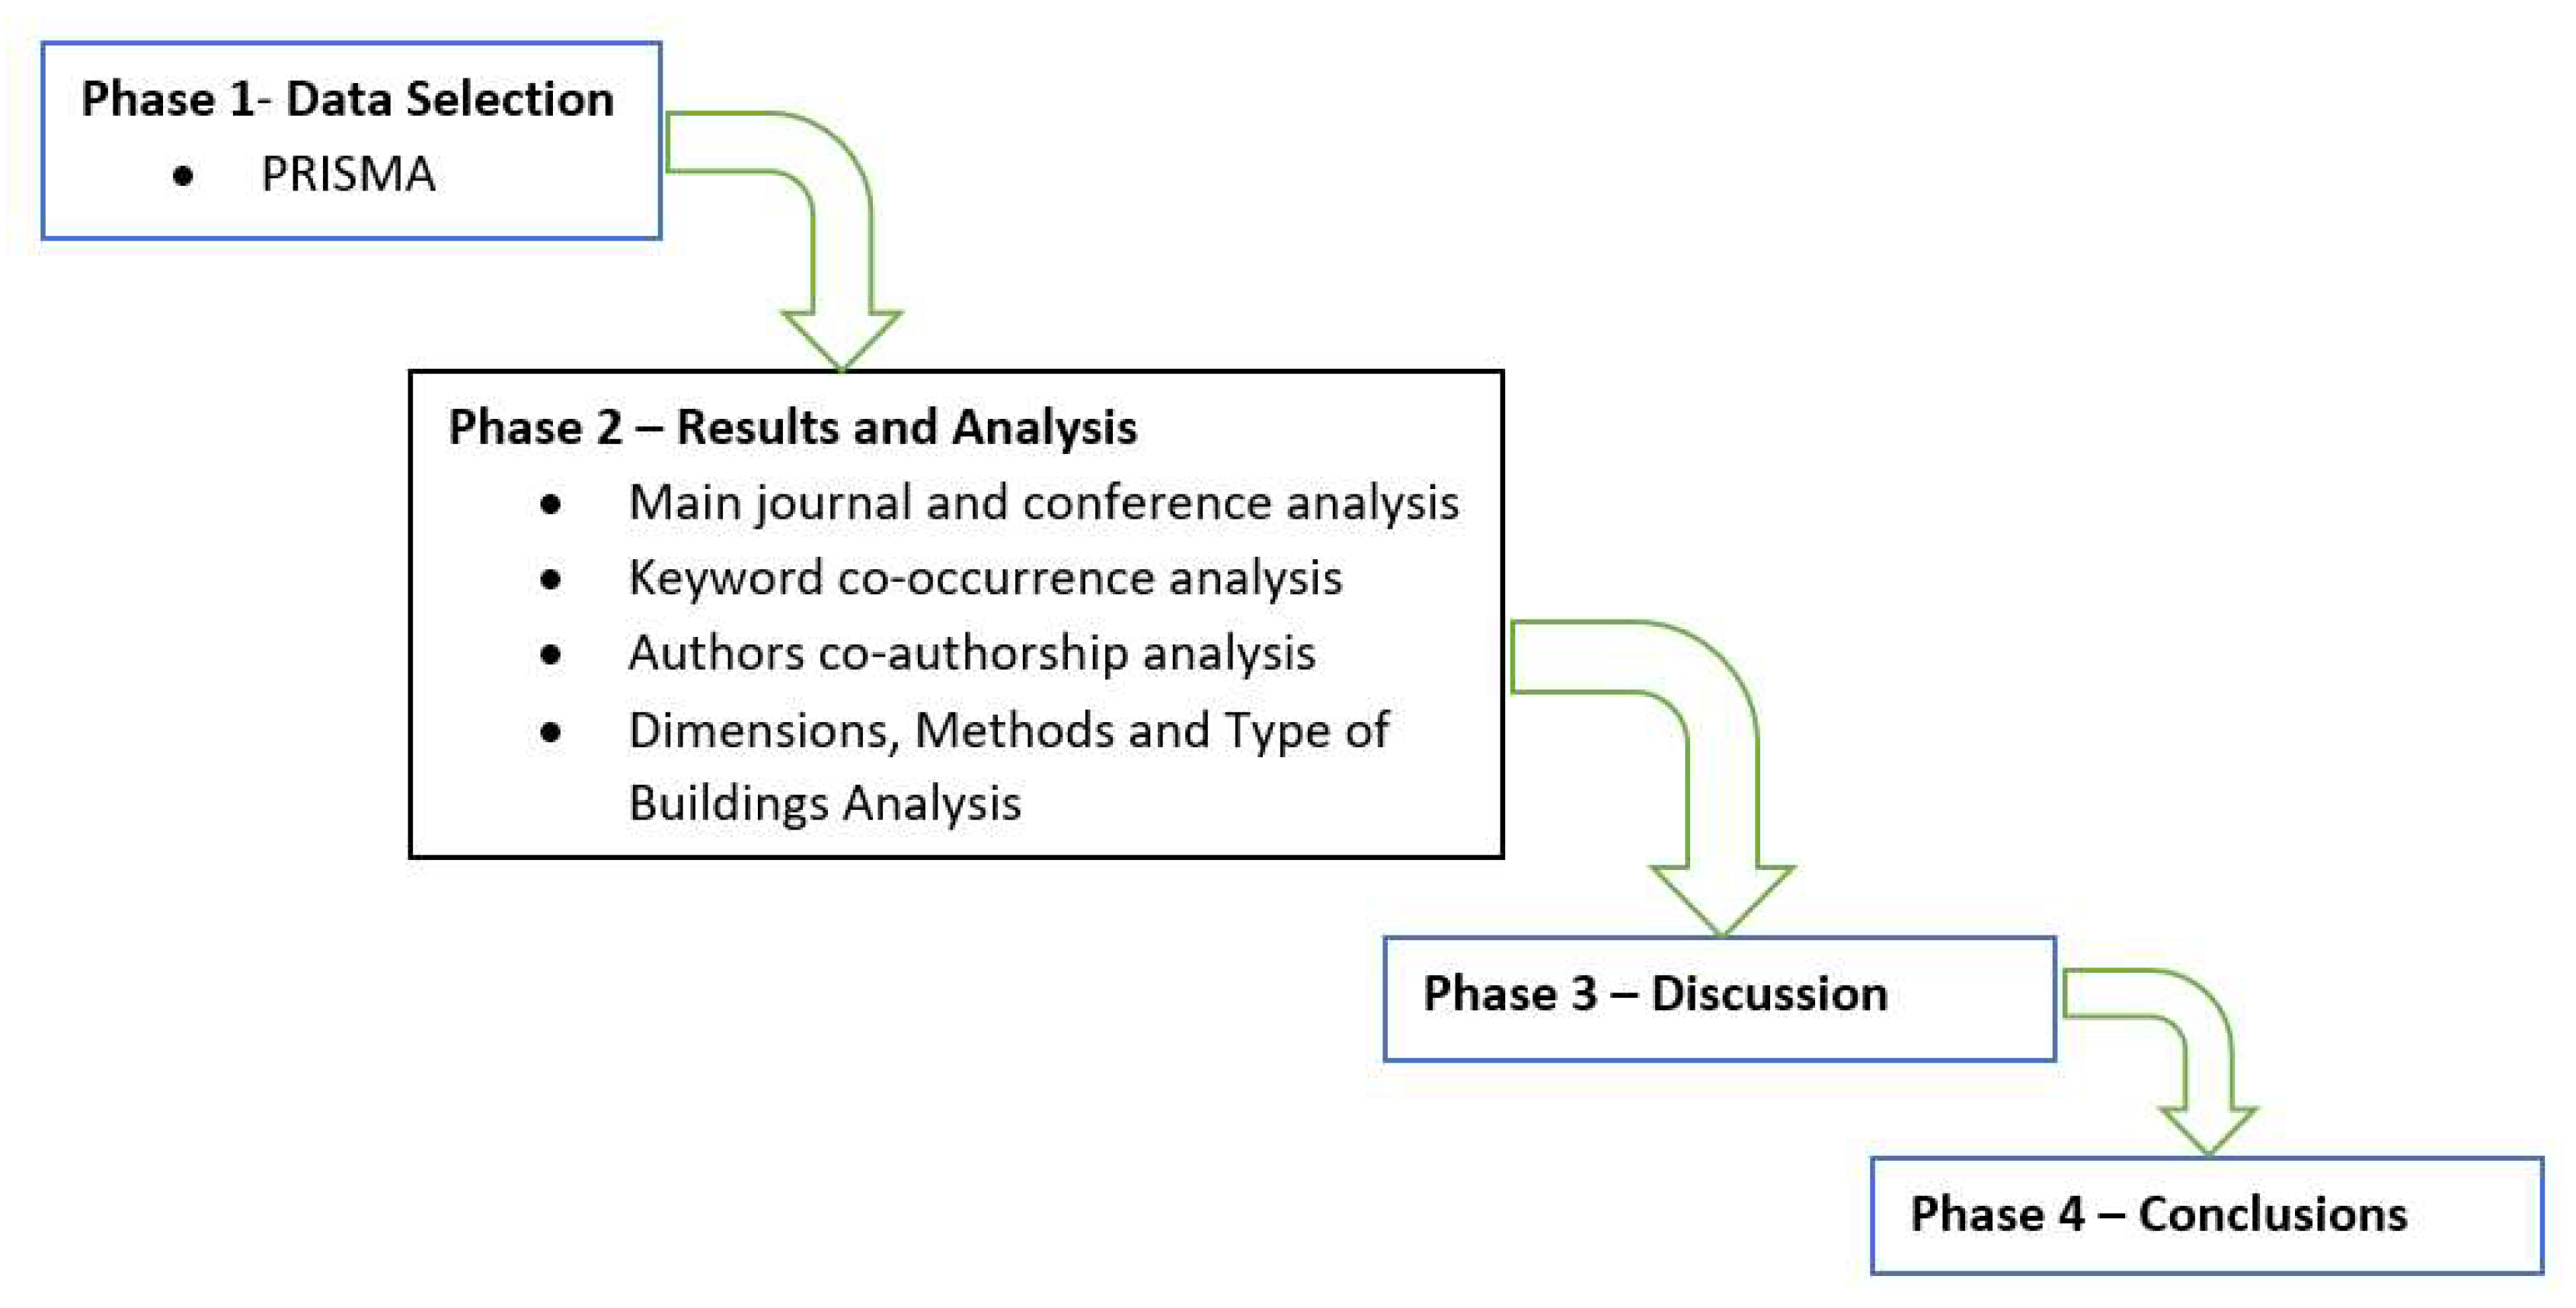
2. Methodology
3. Data Collection
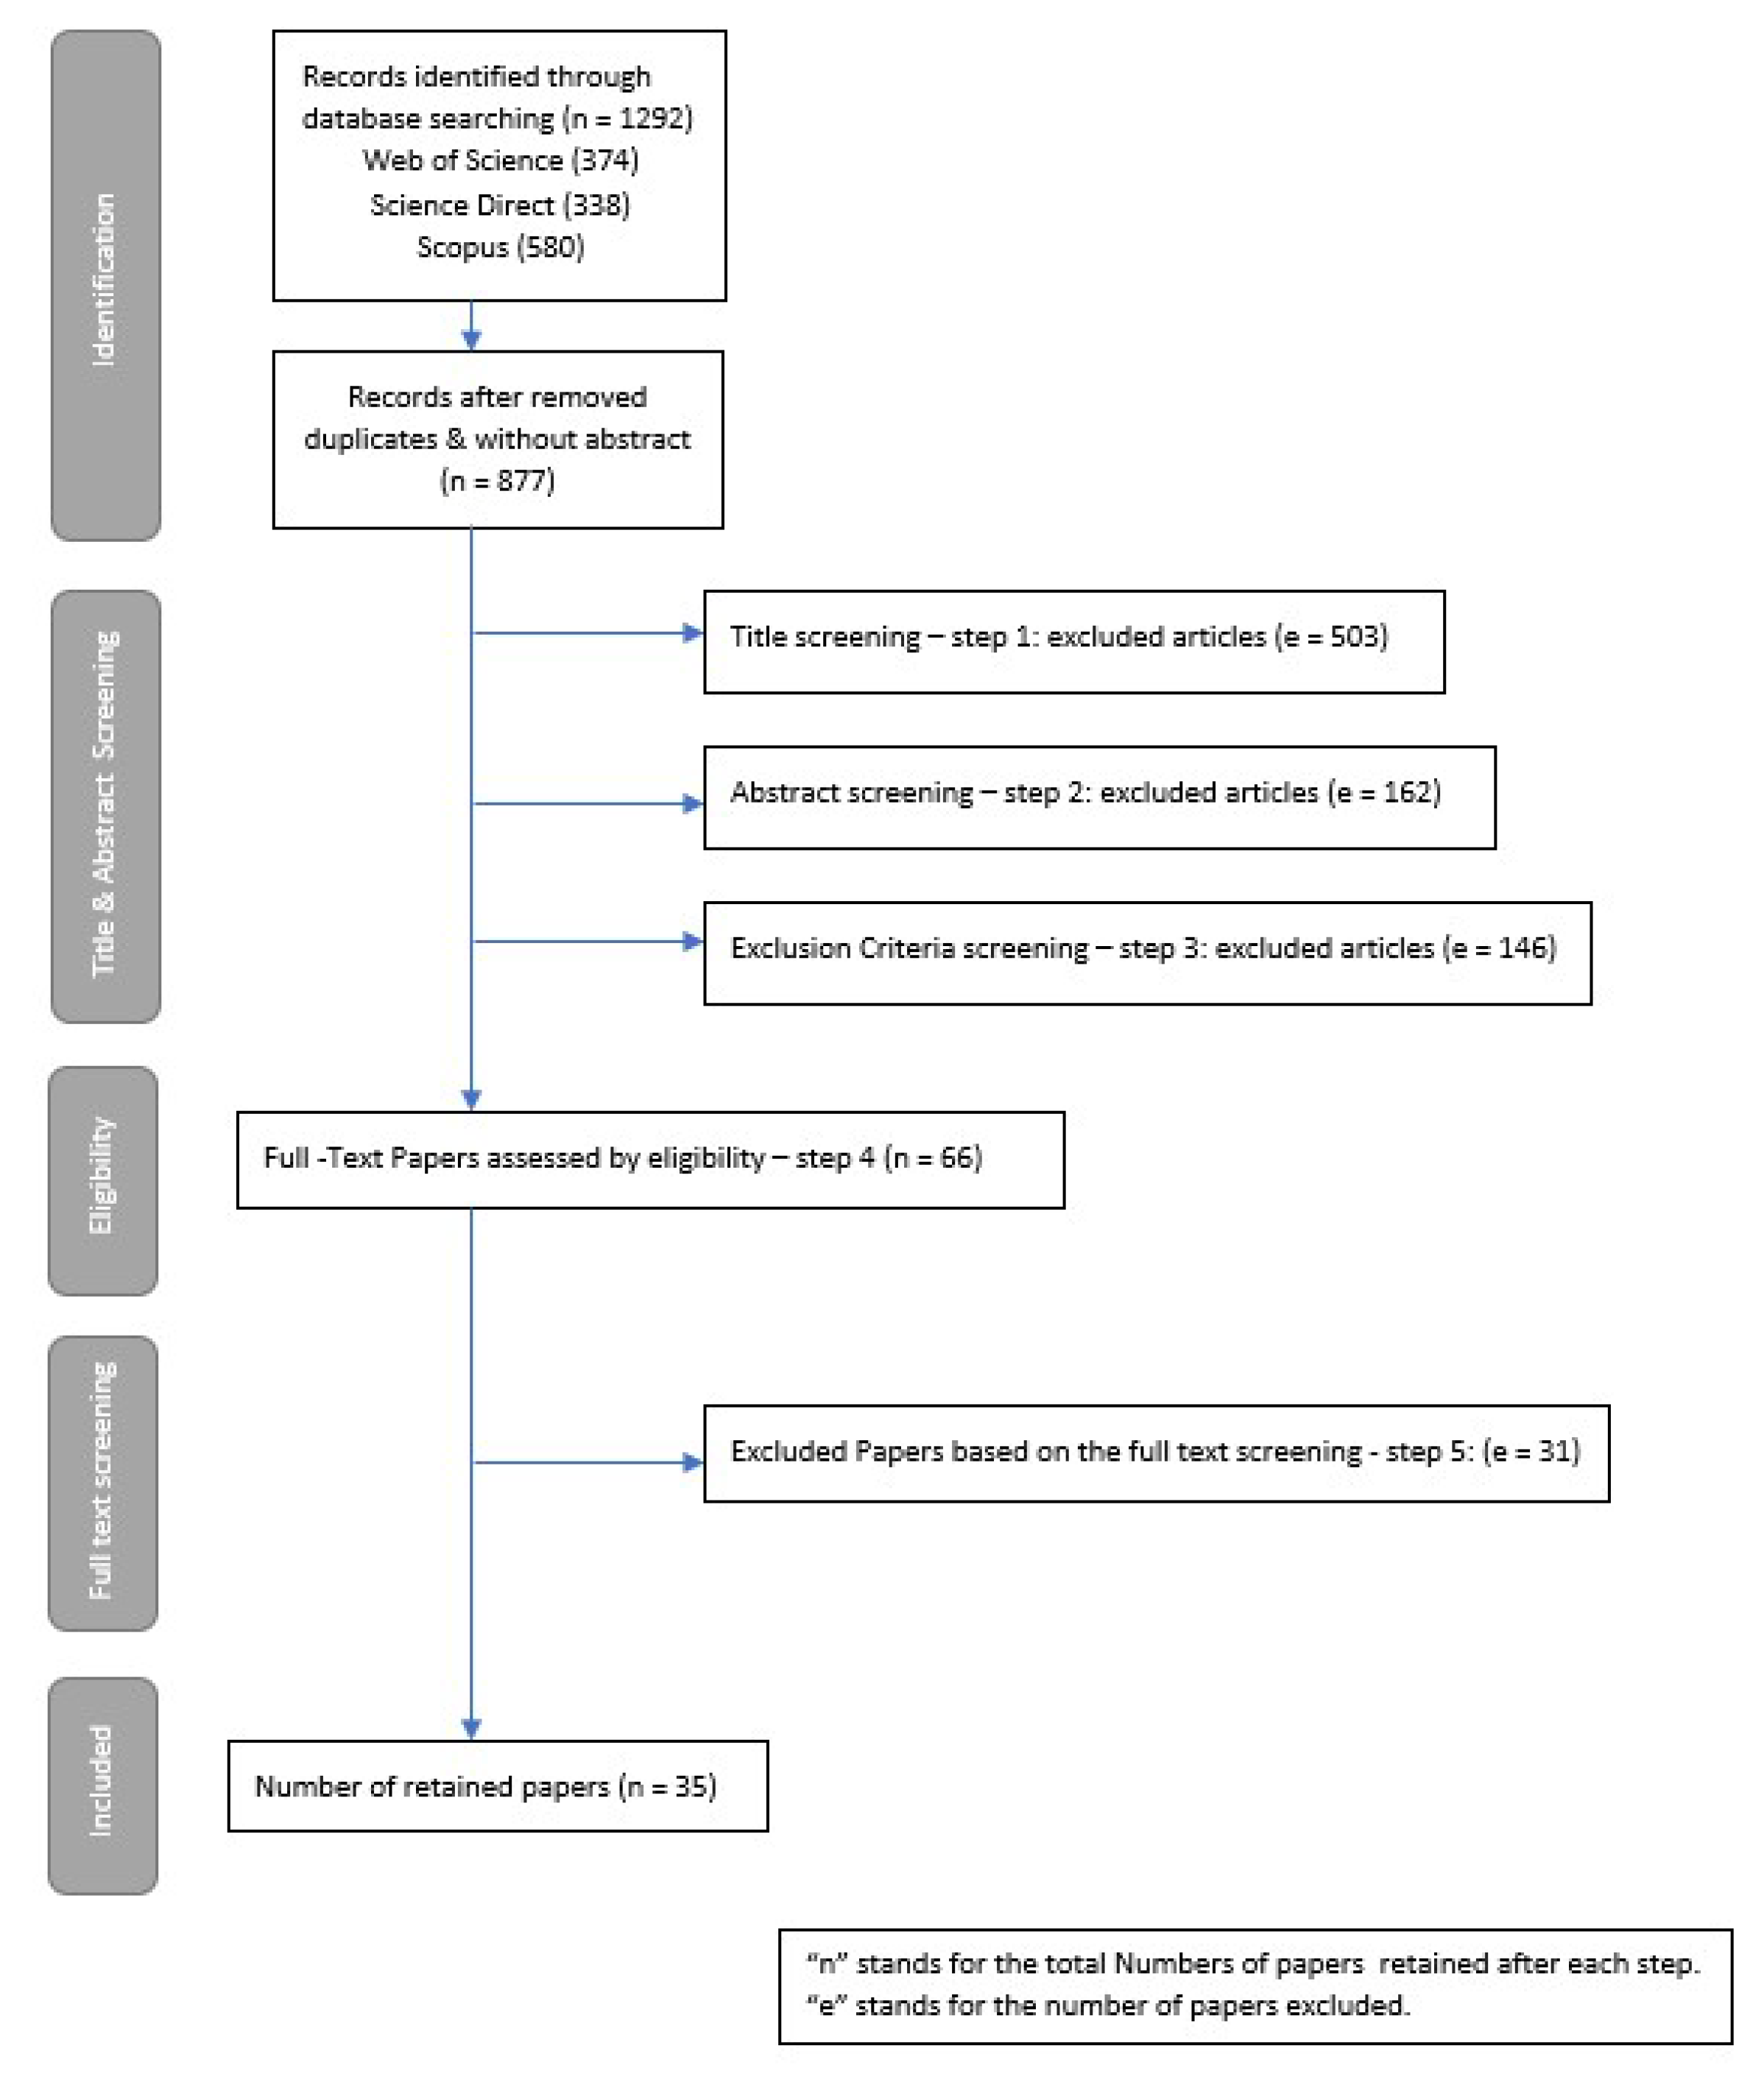
3.1. PRISMA Method
(“energy retrofit*” OR “energy performance” OR “energy analysis” AND (“artificial intelligence” OR “artificial neural networks” OR “machine learning” OR “genetic algorithms” OR “classification” OR “clustering analysis”) OR “certificat*” OR “hypercube” OR “k-means”)
3.2. PRISMA Results
4. Results and Analysis
4.1. Journals and Conferences Analysis
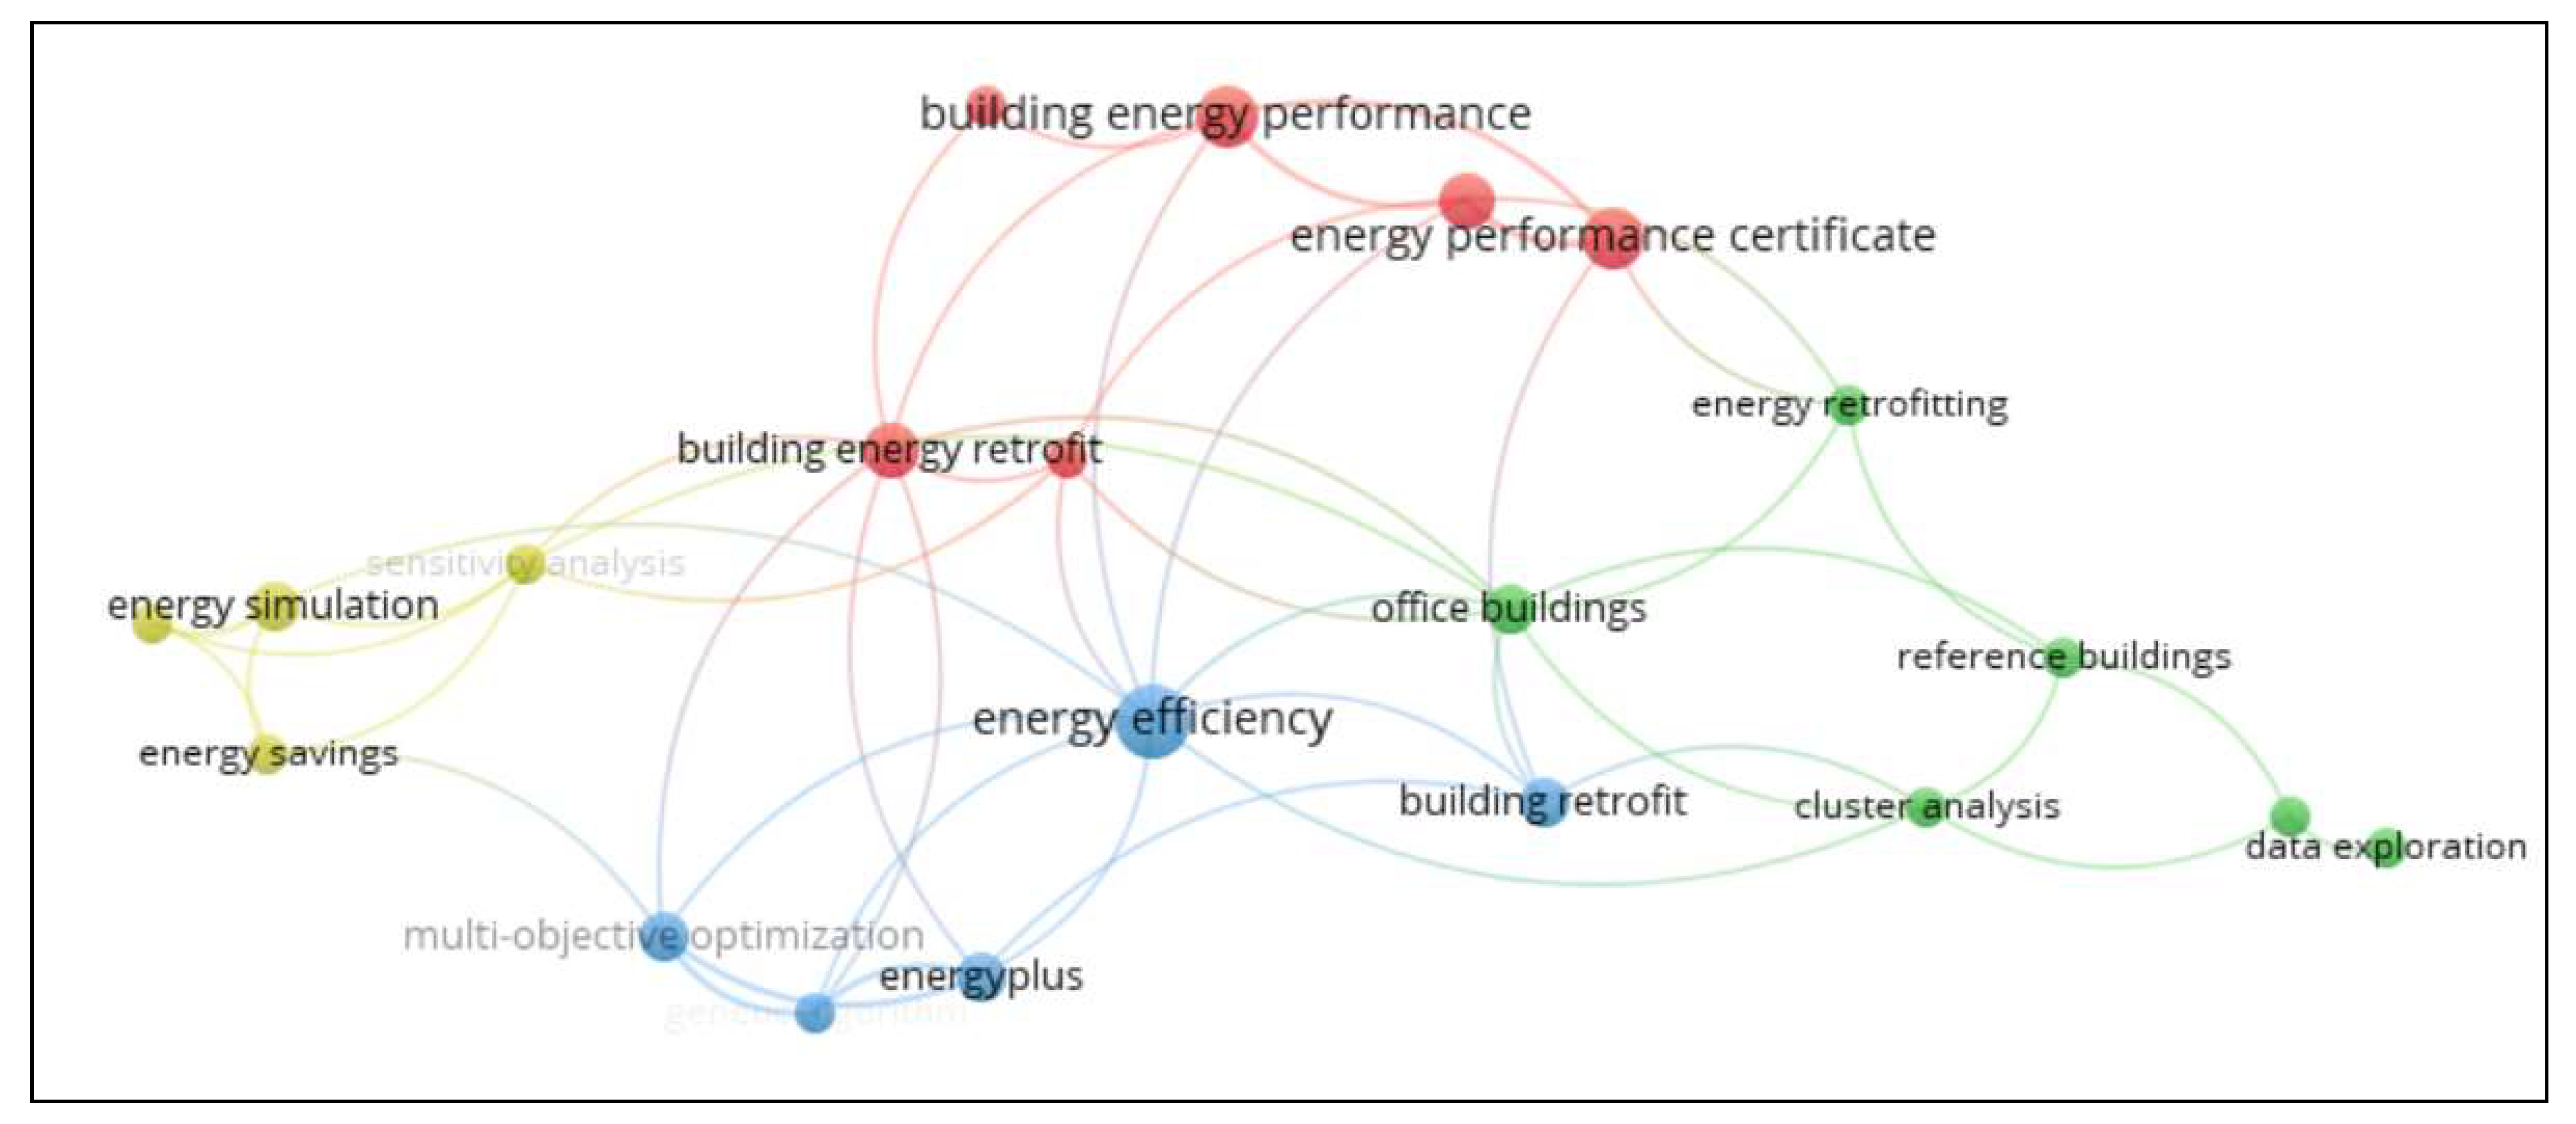
4.2. Keyword Co-Occurrence Analysis
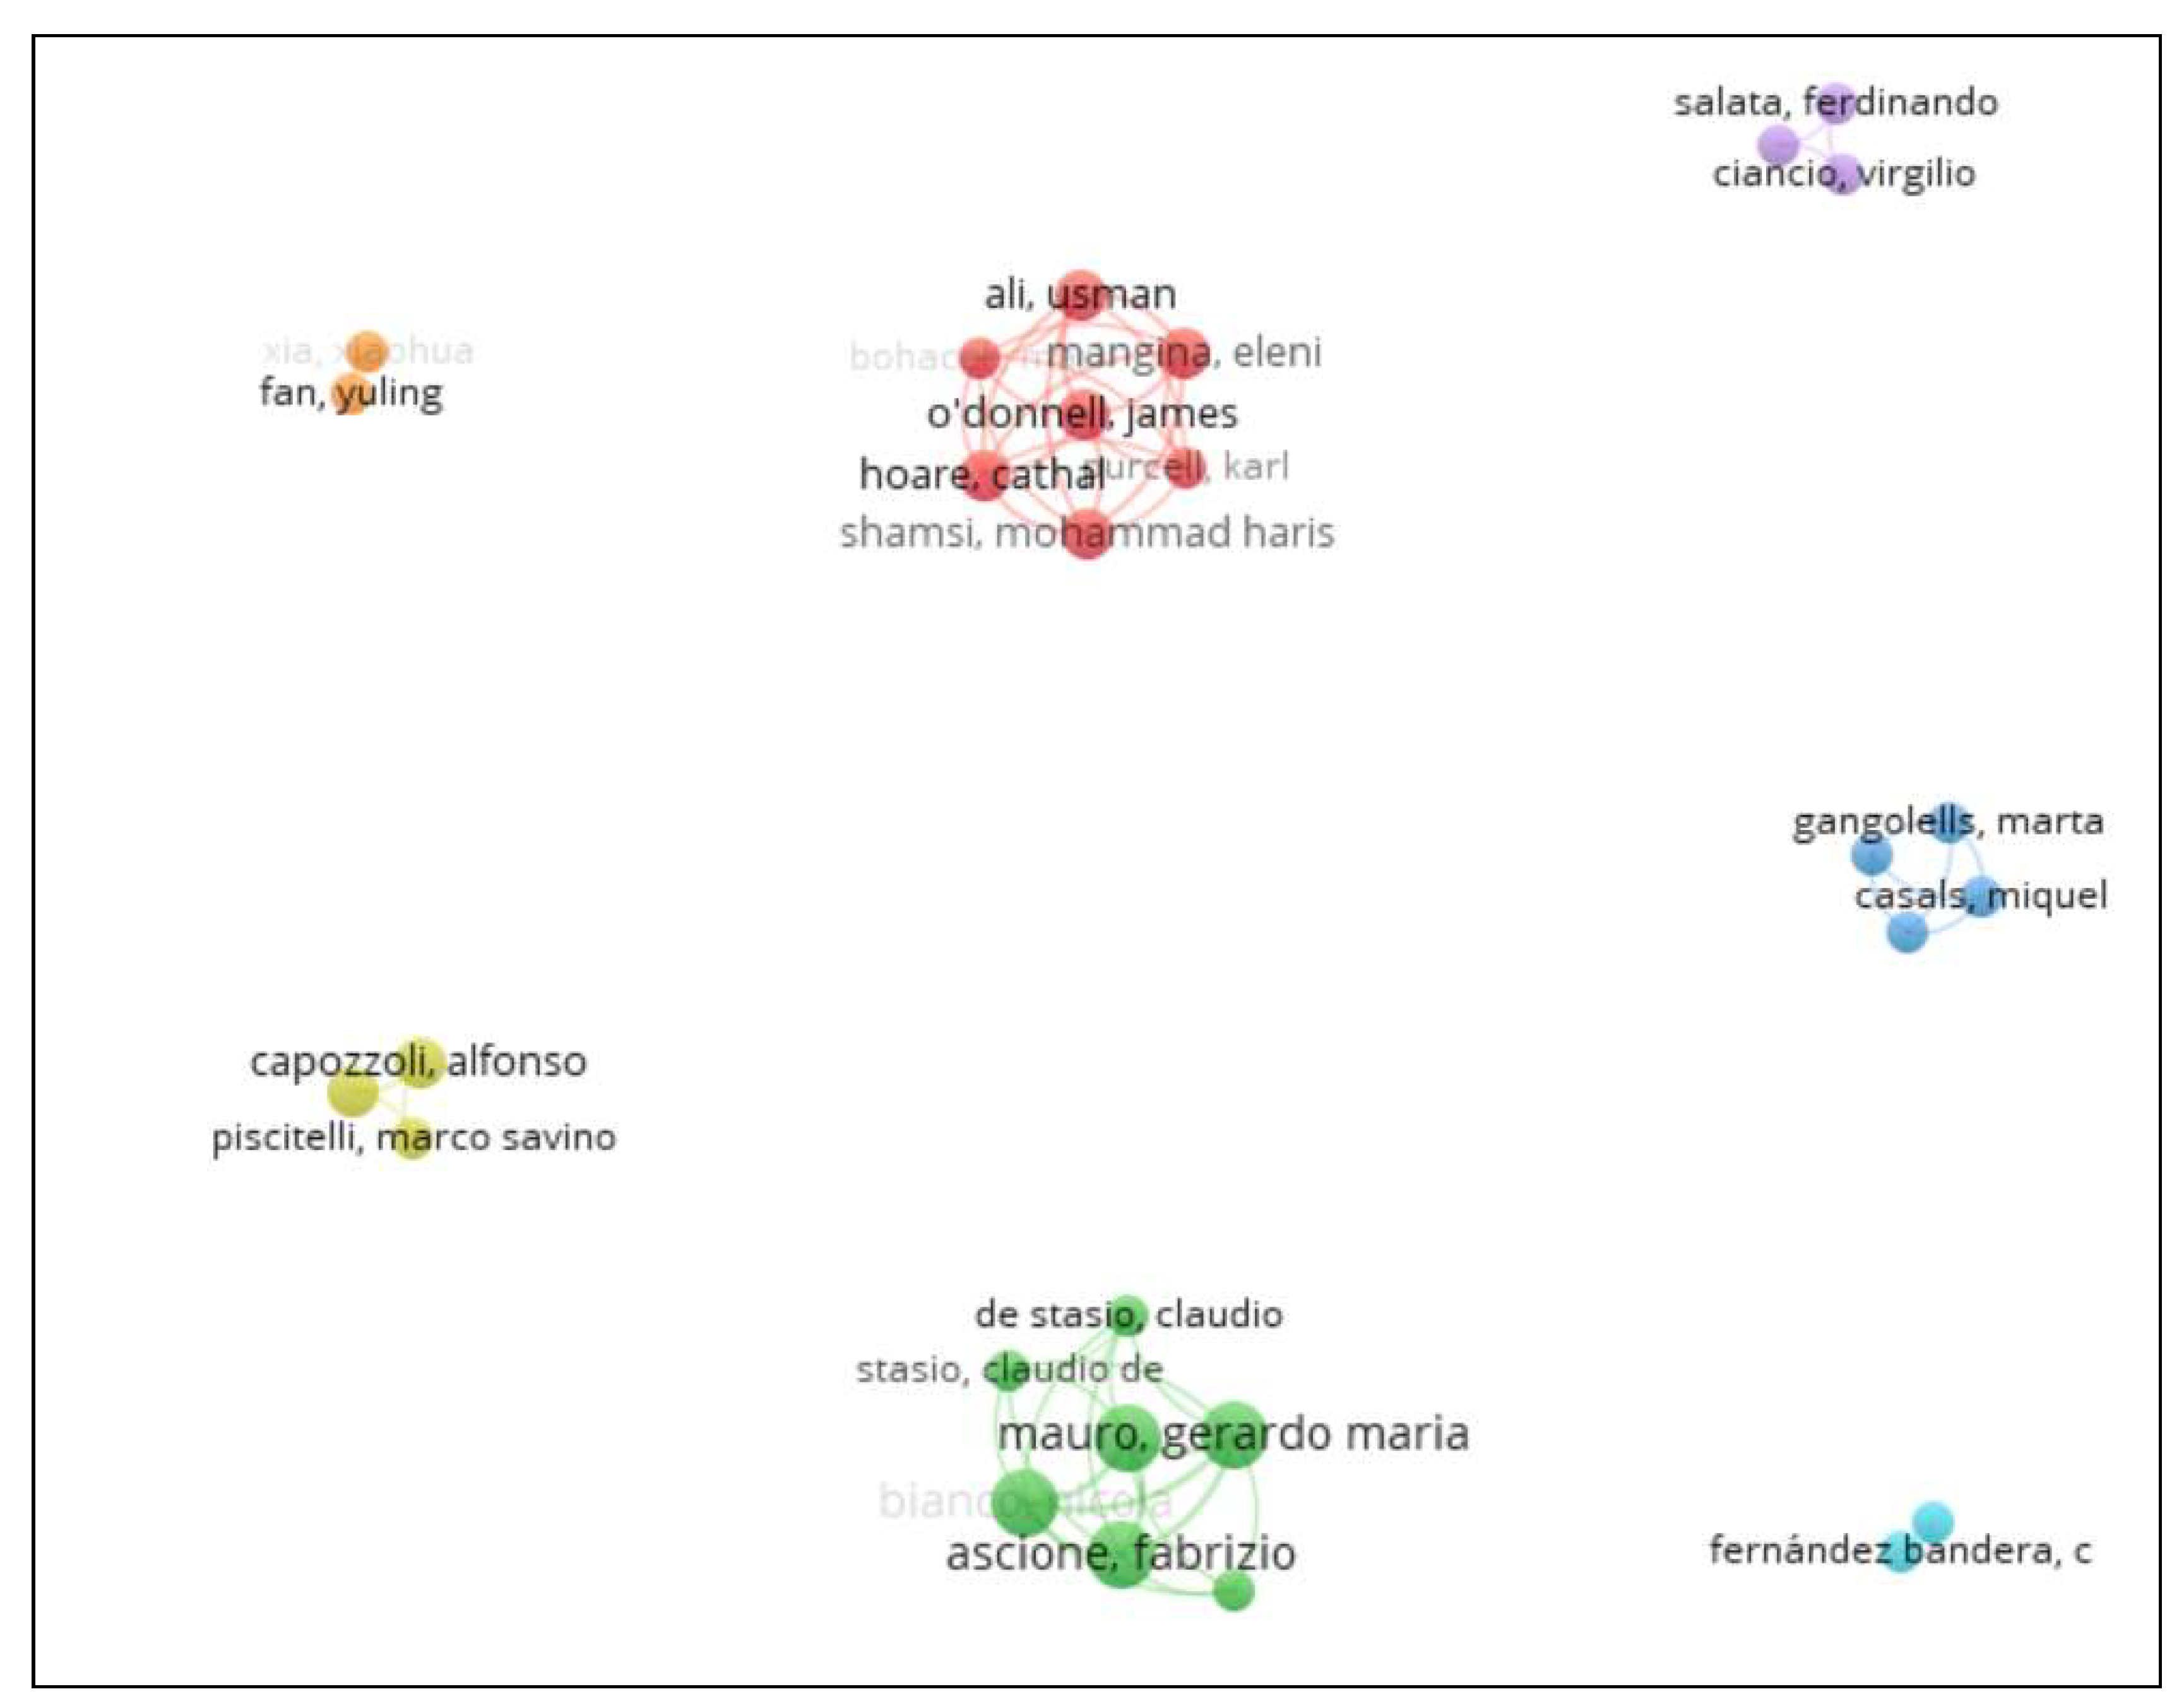
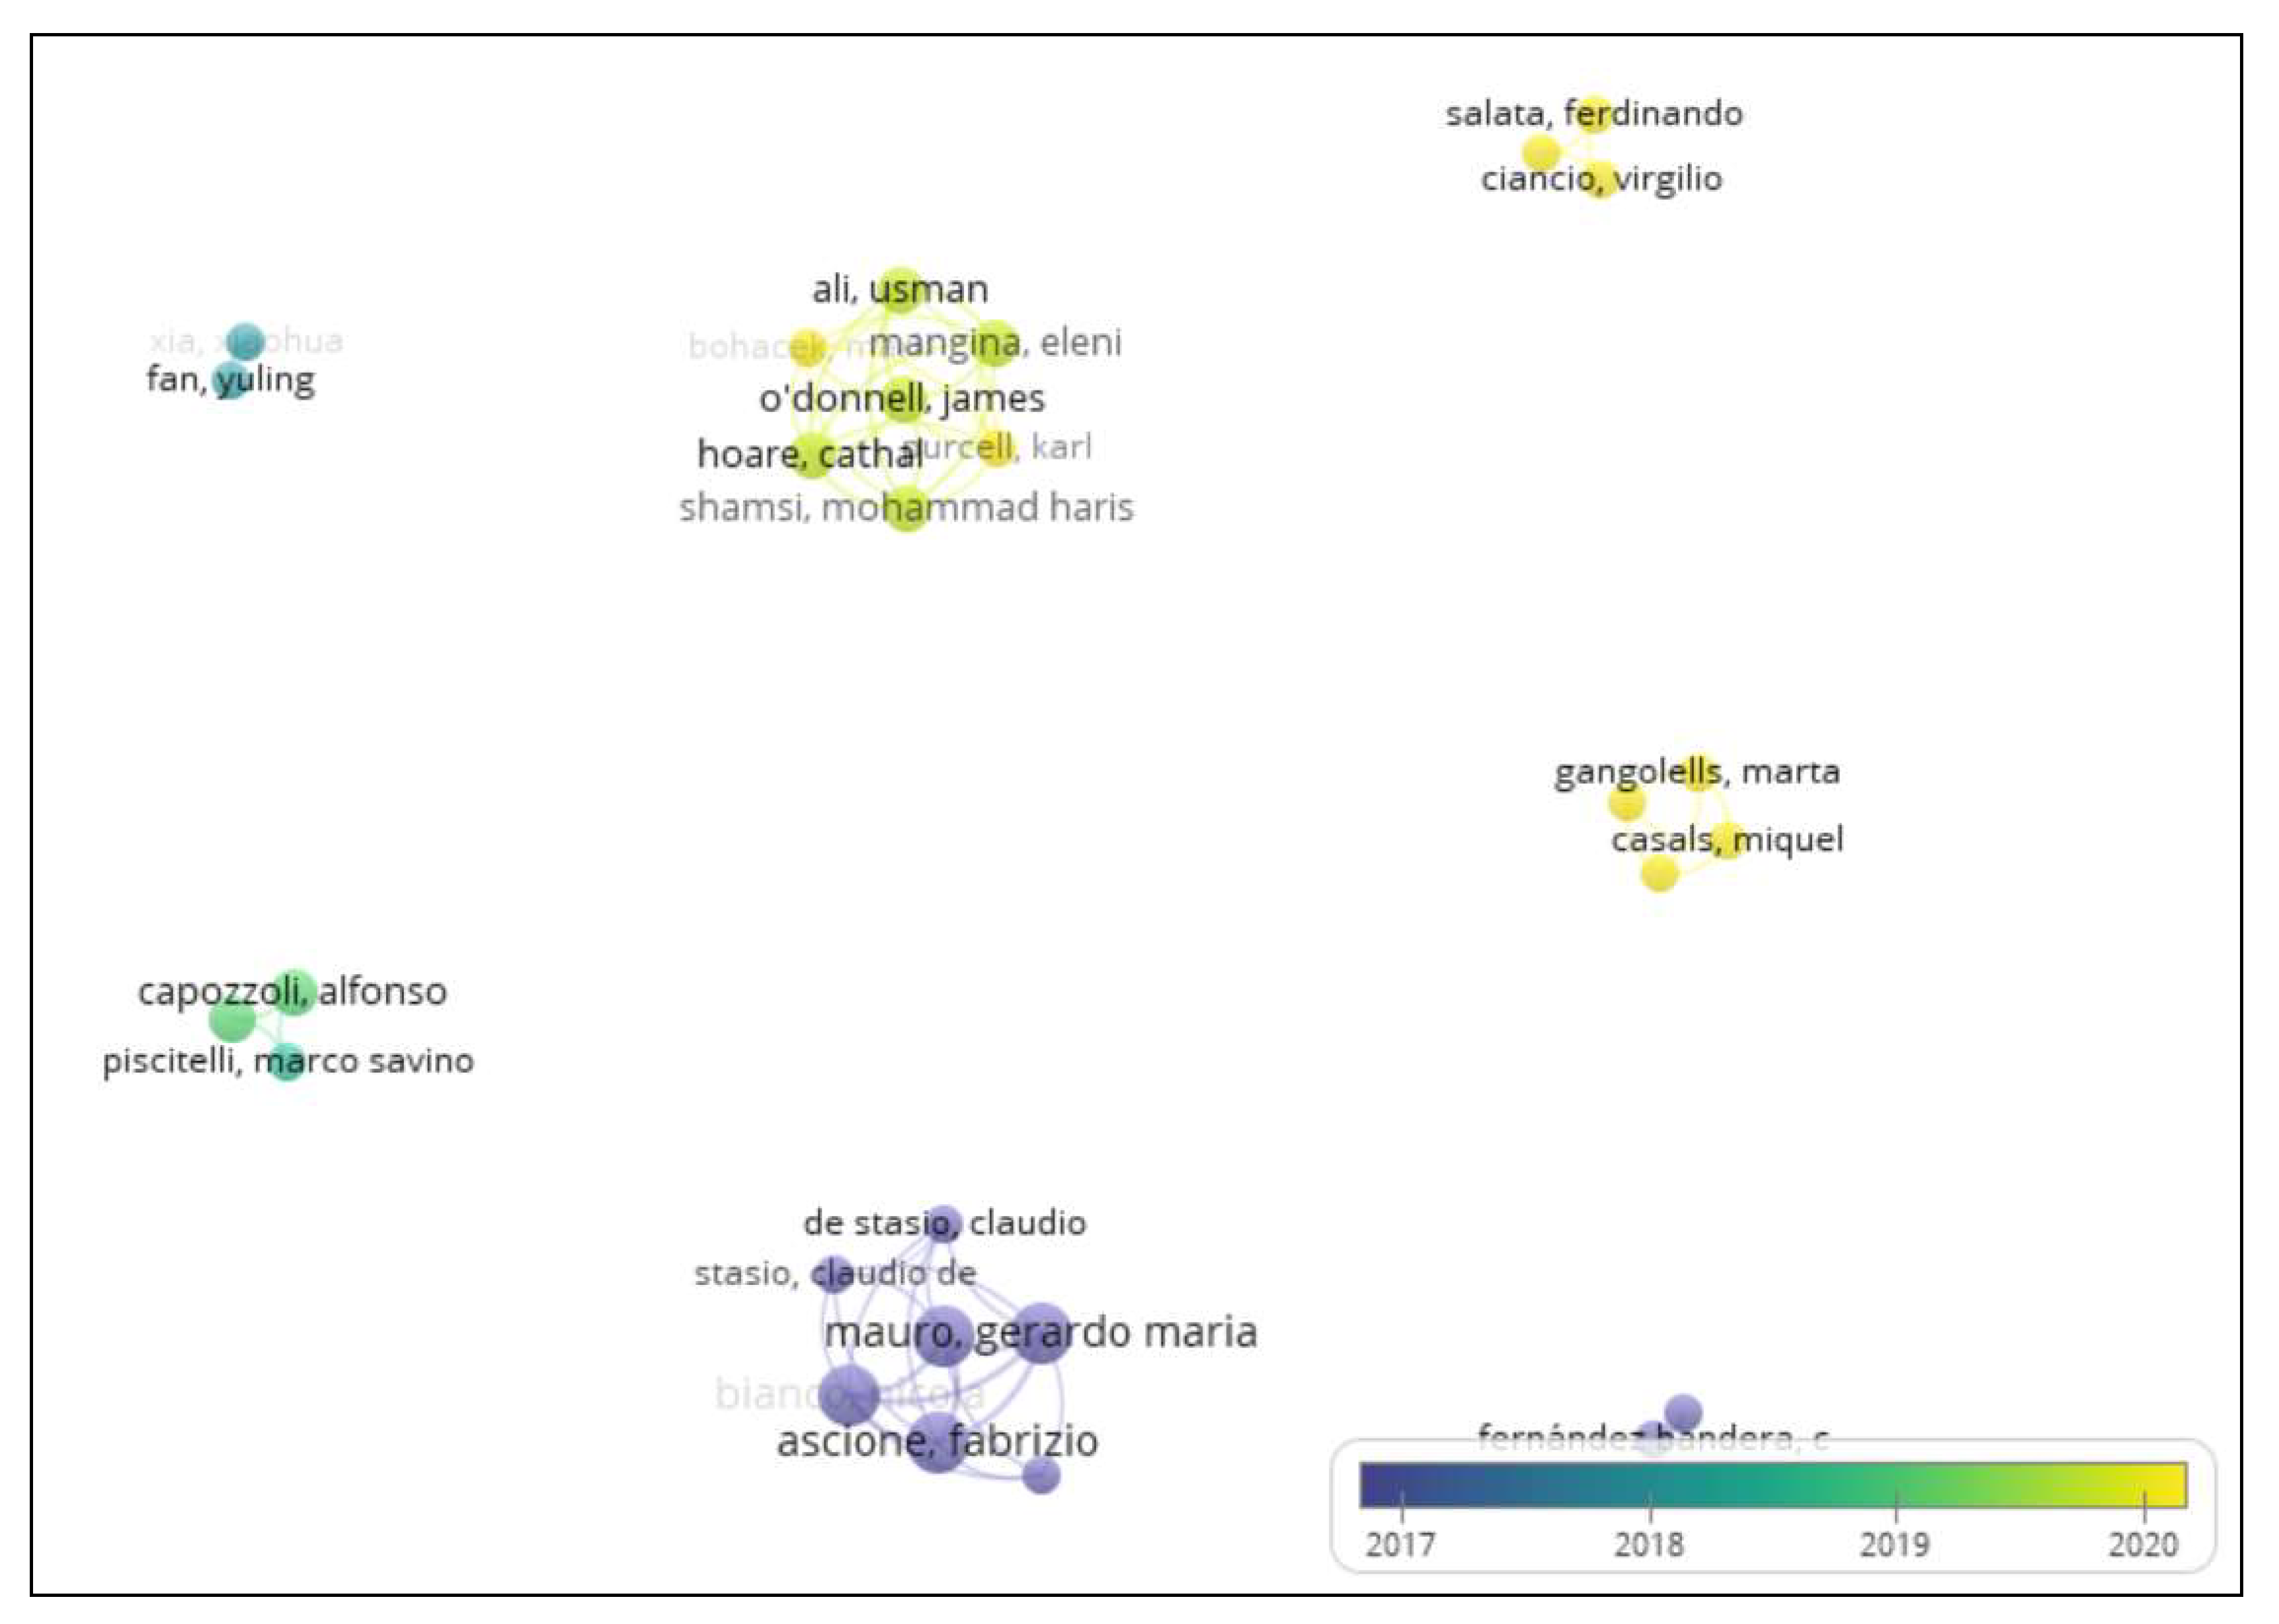
4.3. Authors’ Co-Authorship Analysis
4.4. Most Cited Publications
4.5. Type of Buildings, Dimensions, and Methods Analysis
- Climate: location, weather, building orientation.
- Building geometry: building shape, building type, building fabric, number of floors, window-wall ratios.
- Non-geometric building data: envelope U-values, construction assemblies, heating ventilation, air conditioning (HVAC) systems properties, building age.
- Energy consumption: electricity consumption, energy use, average global efficiency for space heating, HVAC systems, internal heat gain, and lighting.
- Energy performance: standard emission rate, CO2 emissions, terminal unit energy, energy performance index, the efficiency of the subsystems for space heating.
- Financial attributes: cost data of different renovation measures
- Occupational characteristics.
5. Discussion
- RQ1: What are the most relevant machine learning or statistical approaches that automatically evaluate buildings’ energy performance using EPC data?
- RQ2: What are the most relevant ML or statistical approaches for predicting energy-efficient retrofit measures to improve buildings’ energy performance?
5.1. Research Questions Discussion
5.2. Knowledge Gap
5.3. Study Limitations
6. Conclusions
Author Contributions
Funding
Informed Consent Statement
Acknowledgments
Conflicts of Interest
References
- Rocha, P.; Kaut, M.; Siddiqui, A.S. Energy-efficient building retrofits: An assessment of regulatory proposals under uncertainty. Energy 2016, 101, 278–287. [Google Scholar] [CrossRef] [Green Version]
- A European Green Deal. Available online: https://ec.europa.eu/info/strategy/priorities-2019-2024/european-green-deal_en (accessed on 1 May 2021).
- Eurostat. Shedding Light on Energy in the EU—A Guided Tour of Energy Statistics, 2021st ed.; Eurostat: Luxembourg, 2021. [Google Scholar] [CrossRef]
- Canevari, C. How the EU Built the 2030 Energy Efficiency Target; European Commission DG Energy: Vienna, Austria, 2018. [Google Scholar]
- United Nations. Transforming Our World: The 2030 Agenda for Sustainable Development. 2020. Available online: https://sdgs.un.org/2030agenda (accessed on 13 May 2020).
- European. Final Energy Consumption by Sector and Fuel in Europe. 2020. Available online: https://www.eea.europa.eu/data-and-maps/indicators/final-energy-consumption-by-sector-10/assessment (accessed on 10 February 2020).
- Eurostat. Energy Statistics—An Overview. 2021. Available online: https://ec.europa.eu/eurostat/statistics-explained/index.php?title=Energy_statistics_-_an_overview#Final_energy_consumption (accessed on 30 November 2021).
- Koo, C.; Hong, T. Development of a dynamic operational rating system in energy performance certificates for existing buildings: Geostatistical approach and data-mining technique. Appl. Energy 2015, 154, 254–270. [Google Scholar] [CrossRef]
- Mehmood, M.U.; Chun, D.; Zeeshan; Han, H.; Jeon, G.; Chen, K. A review of the applications of artificial intelligence and big data to buildings for energy-efficiency and a comfortable indoor living environment. Energy Build. 2019, 202, 109383. [Google Scholar] [CrossRef]
- Molina-Solana, M.; Ros, M.; Ruiz, M.D.; Gómez-Romero, J.; Martin-Bautista, M. Data science for building energy management: A review. Renew. Sustain. Energy Rev. 2017, 70, 598–609. [Google Scholar] [CrossRef] [Green Version]
- Vaquero, P. Buildings Energy Certification System in Portugal: Ten years later. Energy Rep. 2019, 6, 541–547. [Google Scholar] [CrossRef]
- Moher, D.; Liberati, A.; Tetzlaff, J.; Altman, D.G.; The PRISMA Group. Preferred reporting items for systematic reviews and meta-analyses: The PRISMA Statement. PLoS Med. 2009, 6, e1000097. [Google Scholar] [CrossRef] [Green Version]
- VOSviewer—Visualizing Scientific Landscapes. Available online: https://www.vosviewer.com// (accessed on 23 January 2021).
- Fathi, S.; Srinivasan, R.; Fenner, A.; Fathi, S. Machine learning applications in urban building energy performance forecasting: A systematic review. Renew. Sustain. Energy Rev. 2020, 133, 110287. [Google Scholar] [CrossRef]
- Wei, Y.; Zhang, X.; Shi, Y.; Xia, L.; Pan, S.; Wu, J.; Han, M.; Zhao, X. A review of data-driven approaches for prediction and classification of building energy consumption. Renew. Sustain. Energy Rev. 2018, 82, 1027–1047. [Google Scholar] [CrossRef]
- Wang, Z.; Srinivasan, R. A review of artificial intelligence based building energy use prediction: Contrasting the capabilities of single and ensemble prediction models. Renew. Sustain. Energy Rev. 2016, 75, 796–808. [Google Scholar] [CrossRef]
- Seyedzadeh, S.; Rahimian, F.; Glesk, I.; Roper, M. Machine learning for estimation of building energy consumption and performance: A review. Vis. Eng. 2018, 6, 5. [Google Scholar] [CrossRef]
- Grillone, B.; Danov, S.; Sumper, A.; Cipriano, J.; Mor, G. A review of deterministic and data-driven methods to quantify energy efficiency savings and to predict retrofitting scenarios in buildings. Renew. Sustain. Energy Rev. 2020, 131, 110027. [Google Scholar] [CrossRef]
- Pickering, C.; Byrne, J. The benefits of publishing systematic quantitative literature reviews for PhD candidates and other early-career researchers. High. Educ. Res. Dev. 2014, 33, 534–548. [Google Scholar] [CrossRef] [Green Version]
- Mendeley, Elsevier. 2019. Available online: https://www.mendeley.com/?interaction_required=true (accessed on 10 January 2017).
- Semple, S.; Jenkins, D. Variation of energy performance certificate assessments in the European Union. Energy Policy 2019, 137, 111127. [Google Scholar] [CrossRef]
- Scimago Lab. Scimago Journal & Country Rank, Scimago J. Ctry. Rank. 2021. Available online: https://www.scimagojr.com/ (accessed on 10 July 2021).
- Ascione, F.; Bianco, N.; De Stasio, C.; Mauro, G.M.; Vanoli, G.P. Multi-stage and multi-objective optimization for energy retrofitting a developed hospital reference building: A new approach to assess cost-optimality. Appl. Energy 2016, 174, 37–68. [Google Scholar] [CrossRef]
- Ascione, F.; Bianco, N.; De Stasio, C.; Mauro, G.M.; Vanoli, G.P. A Methodology to Assess and Improve the Impact of Public Energy Policies for Retrofitting the Building Stock: Application to Italian Office Buildings. Int. J. Heat Technol. 2016, 34, S277–S286. [Google Scholar] [CrossRef]
- Ascione, F.; Bianco, N.; De Stasio, C.; Mauro, G.M.; Vanoli, G.P. Addressing Large-Scale Energy Retrofit of a Building Stock via Representative Building Samples: Public and Private Perspectives. Sustainability 2017, 9, 940. [Google Scholar] [CrossRef] [Green Version]
- Ascione, F.; Bianco, N.; De Masi, R.F.; Mauro, G.M.; Vanoli, G.P. Resilience of robust cost-optimal energy retrofit of buildings to global warming: A multi-stage, multi-objective approach. Energy Build. 2017, 153, 150–167. [Google Scholar] [CrossRef]
- Ascione, F.; Bianco, N.; de Masi, R.F.; Mauro, G.M.; Vanoli, G.P. Energy retrofit of educational buildings: Transient energy simulations, model calibration and multi-objective optimisation towards nearly zero-energy performance. Energy Build 2017, 144, 303–319. [Google Scholar] [CrossRef]
- Ali, U.; Shamsi, M.H.; Bohacek, M.; Purcell, K.; Hoare, C.; Mangina, E.; O’Donnell, J. A data-driven approach for multi-scale GIS-based building energy modeling for analysis, planning and support decision making. Appl. Energy 2020, 279, 115834. [Google Scholar] [CrossRef]
- Ali, U.; Shamsi, M.H.; Bohacek, M.; Hoare, C.; Purcell, K.; Mangina, E.; O’Donnell, J. A data-driven approach to optimize urban scale energy retrofit decisions for residential buildings. Appl. Energy 2020, 267, 114861. [Google Scholar] [CrossRef]
- Ali, U.; Shamsi, M.H.; Hoare, C.; Mangina, E.; O’Donnell, J. A data-driven approach for multi-scale building archetypes de-velopment. Energy Build 2019, 202, 109364. [Google Scholar] [CrossRef]
- Gangolells, M.; Gaspar, K.; Casals, M.; Ferré-Bigorra, J.; Forcada, N.; Macarulla, M. Life-cycle environmental and cost-effective energy retrofitting solutions for office stock. Sustain. Cities Soc. 2020, 61, 102319. [Google Scholar] [CrossRef]
- Gangolells, M.; Casals, M.; Ferré-Bigorra, J.; Forcada, N.; Macarulla, M.; Gaspar, K.; Tejedor, B. Office representatives for cost-optimal energy retrofitting analysis: A novel approach using cluster analysis of energy performance certificate databases. Energy Build. 2019, 206, 109557. [Google Scholar] [CrossRef]
- Di Corso, E.; Cerquitelli, T.; Piscitelli, M.S.; Capozzoli, A. Exploring Energy Certificates of Buildings through Unsupervised Data Mining Techniques. IEEE Xplore 2017, 991–998. [Google Scholar] [CrossRef]
- Cerquitelli, T.; Di Corso, E.; Proto, S.; Bethaz, P.; Mazzarelli, D.; Capozzoli, A.; Baralis, E.; Mellia, M.; Casagrande, S.; Tamburini, M. A Data-Driven Energy Platform: From Energy Performance Certificates to Human-Readable Knowledge through Dynamic High-Resolution Geospatial Maps. Electronics 2020, 9, 2132. [Google Scholar] [CrossRef]
- Attanasio, A.; Piscitelli, M.S.; Chiusano, S.; Capozzoli, A.; Cerquitelli, T. Towards an Automated, Fast and Interpretable Estimation Model of Heating Energy Demand: A Data-Driven Approach Exploiting Building Energy Certificates. Energies 2019, 12, 1273. [Google Scholar] [CrossRef] [Green Version]
- Rosso, F.; Ciancio, V.; Dell’Olmo, J.; Salata, F. Multi-objective optimization of building retrofit in the Mediterranean climate by means of genetic algorithm application. Energy Build. 2020, 216, 109945. [Google Scholar] [CrossRef]
- Salata, F.; Ciancio, V.; Dell’Olmo, J.; Golasi, I.; Palusci, O.; Coppi, M. Effects of local conditions on the multi-variable and multi-objective energy optimization of residential buildings using genetic algorithms. Appl. Energy 2019, 260, 114289. [Google Scholar] [CrossRef]
- Ruiz, G.R.; Bandera, C.F.; Temes, T.G.-A.; Gutierrez, A.S.-O. Genetic algorithm for building envelope calibration. Appl. Energy 2016, 168, 691–705. [Google Scholar] [CrossRef]
- Niemelä, T.; Kosonen, R.; Jokisalo, J. Cost-effectiveness of energy performance renovation measures in Finnish brick apartment buildings. Energy Build. 2017, 137, 60–75. [Google Scholar] [CrossRef] [Green Version]
- Beccali, M.; Ciulla, G.; Brano, V.L.; Galatioto, A.; Bonomolo, M. Artificial neural network decision support tool for assessment of the energy performance and the refurbishment actions for the non-residential building stock in Southern Italy. Energy 2017, 137, 1201–1218. [Google Scholar] [CrossRef]
- Copiello, S.; Gabrielli, L.; Bonifaci, P. Evaluation of energy retrofit in buildings under conditions of uncertainty: The prominence of the discount rate. Energy 2017, 137, 104–117. [Google Scholar] [CrossRef]
- Bre, F.; Fachinotti, V. A computational multi-objective optimization method to improve energy efficiency and thermal comfort in dwellings. Energy Build. 2017, 154, 283–294. [Google Scholar] [CrossRef] [Green Version]
- Nutkiewicz, A.; Yang, Z.; Jain, R.K. Data-driven Urban Energy Simulation (DUE-S): A framework for integrating engineering simulation and machine learning methods in a multi-scale urban energy modeling workflow. Appl. Energy 2018, 225, 1176–1189. [Google Scholar] [CrossRef]
- Shen, P.; Braham, W.; Yi, Y. The feasibility and importance of considering climate change impacts in building retrofit analysis. Appl. Energy 2018, 233-234, 254–270. [Google Scholar] [CrossRef]
- Nilashi, M.; Dalvi-Esfahani, M.; Ibrahim, O.; Bagherifard, K.; Mardani, A.; Zakuan, N. A soft computing method for the prediction of energy performance of residential buildings. Measurement 2017, 109, 268–280. [Google Scholar] [CrossRef]
- Eskander, M.; Reyes, M.E.S.; Silva, C.A.S.; Vieira, S.; Sousa, J.M.C. Assessment of energy efficiency measures using multi-objective optimization in Portuguese households. Sustain. Cities Soc. 2017, 35, 764–773. [Google Scholar] [CrossRef]
- Hirvonen, J.; Jokisalo, J.; Heljo, V.J.; Kosonen, R. Towards the EU Emission Targets of 2050: Cost-Effective Emission Reduction in Finnish Detached Houses. Energies 2019, 12, 4395. [Google Scholar] [CrossRef] [Green Version]
- Hosseini, M.; Lee, B.; Vakilinia, S. Energy performance of cool roofs under the impact of actual weather data. Energy Build. 2017, 145, 284–292. [Google Scholar] [CrossRef]
- Fan, Y.; Xia, X. Building retrofit optimization models using notch test data considering energy performance certificate compliance. Appl. Energy 2018, 228, 2140–2152. [Google Scholar] [CrossRef]
- Cecconi, F.R.; Moretti, N.; Tagliabue, L. Application of artificial neutral network and geographic information system to evaluate retrofit potential in public school buildings. Renew. Sustain. Energy Rev. 2019, 110, 266–277. [Google Scholar] [CrossRef] [Green Version]
- Seyedzadeh, S.; Pour Rahimian, F.; Oliver, S.; Rodriguez, S.; Glesk, I. Machine learning modelling for predicting non-domestic buildings energy performance: A model to support deep energy retrofit decision-making. Appl. Energy 2020, 279, 115908. [Google Scholar] [CrossRef]
- Zekić-Sušac, M.; Scitovski, R.; Has, A. Cluster analysis and artificial neural networks in predicting energy efficiency of public buildings as a cost-saving approach. Croat. Rev. Econ. Bus. Soc. Stat. 2018, 4, 57–66. [Google Scholar] [CrossRef] [Green Version]
- Qu, K.; Chen, X.; Ekambaram, A.; Cui, Y.; Gan, G.; Økland, A.; Riffat, S. A novel holistic EPC related retrofit approach for residential apartment building renovation in Norway. Sustain. Cities Soc. 2019, 54, 101975. [Google Scholar] [CrossRef]
- Ahern, C.; Norton, B. A generalisable bottom-up methodology for deriving a residential stock model from large empirical databases. Energy Build. 2020, 215, 109886. [Google Scholar] [CrossRef]
- Belaïd, F.; Ranjbar, Z.; Massié, C. Exploring the cost-effectiveness of energy efficiency implementation measures in the residential sector. Energy Policy 2021, 150, 112122. [Google Scholar] [CrossRef]
- Von Platten, J.; Sandels, C.; Jörgensson, K.; Karlsson, V.; Mangold, M.; Mjörnell, K. Using Machine Learning to Enrich Building Databases—Methods for Tailored Energy Retrofits. Energies 2020, 13, 2574. [Google Scholar] [CrossRef]
- García-Nieto, P.J.; García-Gonzalo, E.; Paredes-Sánchez, J.P.; Sánchez, A.B. A new hybrid model to foretell thermal power efficiency from energy performance certificates at residential dwellings applying a Gaussian process regression. Neural Comput. Appl. 2020, 33, 6627–6640. [Google Scholar] [CrossRef]
- Geissler, S.; Androutsopoulos, A.; Charalambides, A.G.; Escudero, C.J.; Jensen, O.M.; Kyriacou, O.; Petran, H. ENERFUND—Identifying and rating deep renovation opportunities. IOP Conf. Ser. Earth Environ. Sci. 2019, 323, 012174. [Google Scholar] [CrossRef]
- Pistore, L.; Pernigotto, G.; Cappelletti, F.; Gasparella, A.; Romagnoni, P. A stepwise approach integrating feature selection, regression techniques and cluster analysis to identify primary retrofit interventions on large stocks of buildings. Sustain. Cities Soc. 2019, 47, 101438. [Google Scholar] [CrossRef]
- European Commission. Directive 2002/91/EC of the European Parliament and of the Council of 16 December 2002 on the energy performance of buildings. 2002. Available online: https://eur-lex.europa.eu/legal-content/EN/TXT/PDF/?uri=%0ACELEX:32002L0091&from=IT (accessed on 10 March 2019).
- Directive 2010/31/EU of the European Parliament and of the Council of 19 May 2010 on the Energy Performance of Buildings (Recast); European Union: Brussels, Belgium, 2010.
- EnergyPlus. Available online: https://energyplus.net/ (accessed on 2 March 2019).
- TRNSYS. Transient System Simulation Tool. Available online: http://www.trnsys.com (accessed on 2 March 2019).
- Tadeu, S.F.; Alexandre, R.F.; Tadeu, A.J.; Antunes, C.H.; Simões, N.A.; da Silva, P.P. A comparison between cost optimality and return on investment for energy retrofit in buildings—A real options perspective. Sustain. Cities Soc. 2016, 21, 12–25. [Google Scholar] [CrossRef]
- Ciro, G.C.; Dugardin, F.; Yalaoui, F.; Kelly, R. A NSGA-II and NSGA-III comparison for solving an open shop scheduling problem with resource constraints. IFAC PapersOnLine 2016, 49, 1272–1277. [Google Scholar] [CrossRef]
- Albuquerque, V.; Dias, M.S.; Bacao, F. Machine Learning Approaches to Bike-Sharing Systems: A Systematic Literature Review. ISPRS Int. J. Geo Inf. 2021, 10, 62. [Google Scholar] [CrossRef]


| Journals | No. | Publisher | Country | Field Publisher |
|---|---|---|---|---|
| Applied Energy | 9 | Elsevier BV | United Kingdom | Energy, Engineering, Environmental Science |
| Energy and Buildings | 7 | Elsevier BV | Netherlands | Engineering |
| Sustainable Cities & Society | 4 | Elsevier BV | Netherlands | Energy, Engineering, Social Sciences |
| Energies | 3 | MDPI Multidisciplinary Digital Publishing Institute | Switzerland | Energy, Engineering, Mathematics |
| Energy | 2 | Elsevier Ltd. | United Kingdom | Energy, Engineering, Environmental Science, Mathematics |
| Sustainability | 1 | MDPI AG | Switzerland | Energy, Environmental Science, Social Sciences |
| IEEE Transactions on Automation Science and Engineering | 1 | Institute of Electrical & Electronics Engineers Inc. | United States | Engineering |
| Renewable & Sustainable Energy Reviews | 1 | Elsevier Ltd. | United Kingdom | Energy |
| Measurement | 1 | Taylor & Francis Ltd. | United Kingdom | Mathematics, Social Sciences |
| Croatian Review of Economic, Business & Social Statistics | 1 | Croatian Statistical Association | Croatian | Statistics |
| Journal Electronics | 1 | Science Press | China | Engineering |
| Energy Policy | 1 | Elsevier BV | United Kingdom | Energy, Environmental Science |
| Neural Computing & Applications | 1 | Springer London | United Kingdom | Computer Science |
| Conference | No. | Publisher Country | Field |
|---|---|---|---|
| IEEE International Conference on Internet of Things and Green Computing and Communications & Cyber, Physical and Social Computing and Smart Data (2017) | 1 | United Kingdom | Computer Science |
| IOP Conference Series: Earth and Environmental Science (2019) | 1 | Indonesia | Environmental Science |
| Keywords | Occurrence | Total Link Strength |
|---|---|---|
| Energy Efficiency | 7 | 10 |
| Building Energy Retrofit | 4 | 8 |
| Machine Learning | 4 | 8 |
| Office Buildings | 3 | 8 |
| Building Energy Performance | 5 | 7 |
| Energy Performance Certificate | 5 | 7 |
| Energyplus | 3 | 7 |
| Multi-Objective Optimization | 3 | 7 |
| Genetic Algorithm | 2 | 6 |
| Sensitivity Analysis | 2 | 6 |
| Artificial Neural Networks | 2 | 5 |
| Building Retrofit | 3 | 5 |
| Cluster Analysis | 2 | 5 |
| Energy Simulation | 3 | 5 |
| Energy Retrofitting | 2 | 4 |
| Energy Savings | 2 | 4 |
| Genetic Algorithm (Nsga-Ii) | 2 | 4 |
| Reference Buildings | 2 | 4 |
| Dell’olmo, Jacopo | 2 | 4 |
| Piscitelli, Marco Savino | 2 | 4 |
| Salata, Ferdinando | 2 | 4 |
| Energy Performance Certificates | 2 | 3 |
| Building Sampling | 2 | 2 |
| Fernández Bandera, C | 2 | 2 |
| Ramos Ruiz, G | 2 | 2 |
| Data Exploration | 2 | 1 |
| Authors | Documents | Total Link Strength |
|---|---|---|
| Ascione, Fabrizio | 5 | 21 |
| Bianco, Nicola | 5 | 21 |
| Mauro, Gerardo Maria | 5 | 21 |
| Vanoli, Giuseppe Peter | 5 | 21 |
| Ali, Usman | 3 | 16 |
| Hoare, Cathal | 3 | 16 |
| Mangina, Eleni | 3 | 16 |
| O’Donnell, James | 3 | 16 |
| Shamsi, Mohammad Haris | 3 | 16 |
| Bohacek, Mark | 2 | 12 |
| Purcell, Karl | 2 | 12 |
| De Stasio, Claudio | 3 | 9 |
| De Masi, Rosa Francesca | 2 | 8 |
| Casals, Miquel | 2 | 6 |
| Ferré-Bigorra, Jaume | 2 | 6 |
| Gangolells, Marta | 2 | 6 |
| Macarulla, Marcel | 2 | 6 |
| Capozzoli, Alfonso | 3 | 5 |
| Cerquitelli, Tania | 3 | 5 |
| Ciancio, Virgilio | 2 | 4 |
| Dell’olmo, Jacopo | 2 | 4 |
| Piscitelli, Marco Savino | 2 | 4 |
| Salata, Ferdinando | 2 | 4 |
| Fernández Bandera, C | 2 | 2 |
| Ramos Ruiz, G | 2 | 2 |
| N | Ref. | Publication | Dimension Category | Methods | Building Type | No. of Citations |
|---|---|---|---|---|---|---|
| 1 | [16] | Applied Energy | -Thermo-physical characteristics -Building envelope -HVAC systems -Weather -Energy use | -Simulation -Latin hypercube sampling -Pareto—sensitive Analysis -Genetic Algorithm | Hospital | 84 |
| 2 | [31] | Applied Energy | -Climatic location -Geometry -Construction elements -Building properties -Internal temperature measures | -Genetic Algorithm NSGA-II -Simulation -Parametric analysis -Sensitivity analysis -Uncertainty analysis: fi, CV(RMSE) | University | 44 |
| 3 | [20] | Energy & Buildings | -Building envelope -Building operation -HVAC systems -Financial attributes | -Genetic algorithms -Transient energy simulations | University | 44 |
| 4 | [32] | Energy & Buildings | -Building Envelope -HVAC systems -Internal heat gains -Weather -Cost of different renovation measures | -Simulation-based Optimisation methods -Pareto-Archive NSGA-II Genetic algorithm | Residential | 39 |
| 5 | [33] | Energy | -Thermophysical parameters -HVAC plants -Typology -Building characteristics -Climate -Geometry -Energy consumption | -Artificial neural networks (ANN) | School | 37 |
| 6 | [34] | Energy | -Climatic location -Building materials -Financial attributes | -Life-Cycle Cost method -Monte Carlo simulation -Discount rate | Residential | 35 |
| 7 | [35] | Energy & Buildings | -Design variables -Climate (Thermal zone) -Cooling and heating | -Pareto front -Simulation -Non-dominated Sorting Genetic Algorithm-II (NSGA-II) | Residential | 30 |
| 8 | [36] | Applied Energy | -Geometry -Weather -Construction materials | -Energy Simulation -Residual network model | Residential | 27 |
| 9 | [30] | Applied Energy | -Climate -Building location -Energy sources (gas and electricity) -Building characteristics -Installation systems -Photovoltaic -Thermal solar panels -Building geometry | -Simulations -Active Archive Non-Dominated Sorting Genetic Algorithm (aNSGA-II type). -Pareto frontier | Residential | 22 |
| 10 | [37] | Applied Energy | -Weather -Building Envelope -HVAC systems -Energy use | -Latin-hypercube sampling -Joint mutual information maximization -Energy conservation measure | Residential and offices | 21 |
| 11 | [38] | Measurement | -Building envelope -Orientation -Heating load -Cooling load | -Estimation Maximization algorithm -Adaptive Neuro-Fuzzy Inference System method -Principal Component Analysis | Residential | 14 |
| 12 | [22] | Applied Energy | -Building geometry -Energy performance index -Building shape -Dwelling type -Building envelope -Number of floors; walls, and windows -Envelope U-values -Construction assemblies -HVAC systems | -Crude statistical analysis -Visual analysis of statistical representation (Box plots) -Local Outlier Factor (LOF) algorithms -Deep Learning -Rule Induction -Neural Network -Naïve Bayes -Decision Tree -Random Forest -Gradient Boosted Trees -Learning Vector Quantization (LVQ) -9 k-Nearest Neighbors (kNN). | Residential | 14 |
| 13 | [29] | Energy & Buildings | -Geometry -Envelope -Useful floor area (m2) -Building shape -Climate zone Window -Glazing type -Wall insulation -Heating system Heating -Energy source -Cooling system Cooling | -Sorting genetic algorithm (aNSGA-II) -Optimal solution in the R 4 space -Pareto frontier -Simulation | Residential | 14 |
| 14 | [39] | Sustainable Cities & Society | -Building Envelope -Heating systems -HVAC systems -Electricity consumption | -REVIT -Simulation -Genetic algorithm | Residential | 13 |
| 15 | [18] | Sustainability | -Geometry -Building envelope -Building operation -HVAC systems -Climate | -Latin hypercube sampling technique -Simulation-based large-scale uncertainty/sensitivity Analysis of Building EP | Residential, Offices and Schools | 12 |
| 16 | [40] | Energies | -Weather -Building age -Construction year -Building envelope -Heating/ Cooling systems | -Group by building age -Simulation Monte Carlo -Genetic Algorithm NSGA-II | Residential | 12 |
| 17 | [41] | Journal IEEE Transactions on Automation Science & Engineering | -Building intrinsic properties -Occupancy patterns -Environmental conditions | -Artificial neural network -Genetic algorithm -Multi regression analysis -Principal component analysis | Care home | 9 |
| 18 | [28] | Energies | -Geometry -Envelope -Construction year -Average global efficiency for space heating | -Artificial Neural Network -Support Vector Machine -Reduced Error Pruning Tree -Random Forests | Residential | 8 |
| 19 | [42] | Applied Energy | -Building envelope -Indoor facilities | -Manual grouping method and ‘notch test’ data -Generic Algorithm -Mathematics | Offices | 7 |
| 20 | [43] | Renewable & Sustainable Energy Reviews | -Thermophysical properties -Building envelope | -Artificial neural network (ANN) -K-means clustering -Geographic information systems (GIS) | School | 7 |
| 21 | [44] | Applied Energy | -Hot water -Internal heat gain and lighting -Wall to floor and window -Standard Emission Rate -Air infiltration rate -Terminal unit energy -Demand and cooling system efficiency. -Roof wall ratio -Solar radiation on the roof | -Simplified Building Energy Model (SBEM) tool -Sensitivity analysis -Gradient boosted regression trees (GBRT) -Cross-validation -Standard statistical re-sampling method, -Sequential Model-based Algorithm Configuration (SMAC) | Commercial, School | 7 |
| 22 | [45] | Croatian Review of Economic, Business & Social Statistics | -Geospatial -Construction shape -Heating characteristics -Cooling characteristics -Meteorological characteristics -Occupational characteristics -Energetic characteristics | -Artificial neural network (ANN) -K-means clustering -Correlation Analysis -Chi-square tests -Symmetric mean average percentage error -DBSCAN algorithm | Residential, Offices and Schools | 6 |
| 23 | [21] | Applied Energy | -Geometric data: building shape, building type, building fabric, number of floors, window-wall ratios -Non-geometric building: envelope U-values, construction assemblies, Heating Ventilation, Air Conditioning (HVAC) systems properties -EPC data -Building footprint -Building height data | -GIS -Decision Analysis (MCDA) approach -Fuzzy string algorithms -Jaro -Jaro–Winkler -Levenshtein -JaccnaïveNaive Bayes Generalized Linear Model -Logistic Regression -Deep Learning -Decision Trees -Random Forest -Gradient Boosted Trees -Support Vector Machine | Residential | 6 |
| 24 | [46] | Sustainable Cities & Society | -Geometrical -Thermophysical features | -Wrapper Feature Selection -Random Forests -K-means Clustering | Schools | 5 |
| 25 | [25] | Energy & Buildings | -Building norm -Window glazing -Climate zone -Cooling system -Useful floor area -Shape factor -Domestic hot water energy source -Heating energy source -Existence of thermal insulation in building envelopes | -K-means Clustering -Correlation analysis -Stepwise regression analysis -Root-mean-square standard deviation -Elbow method | Offices industrial—residential | 5 |
| 26 | [47] | Sustainable Cities & Society | -Climate zone -Building layout -Seasonal efficiency Heat delivery efficiency -Average water inlet temperature Hot water supply temperature -Mechanical ventilation Infiltration -Maximum power consumption -Luminous energy conversion efficiency Schedule -Occupants Lighting | -Dynamic simulation tool -IES Virtual Environment (VE) -Combination packages -Energy Limiting Difference (ELD) assessment factor | Residential | 4 |
| 27 | [48] | Energy & Buildings | -Construction age -Building size -Heating and hot water systems -Heat loss through the building fabric -Climatic location -Operation & occupancy pattern -Heating demand | -Statistical approach -Synthetical Average Building (SyAv) approach identifies | Residential | 4 |
| 28 | [23] | Energy & Buildings | -Geometric data -Envelope U-values -HVAC systems -Construction year -Climate zone | -Local Outlier Factor algorithm -K-means clustering -Weighting coefficients -Building national statistics -Building EP Simulation -Geographical Information System (GIS) visualization maps | Residential | 2 |
| 29 | [26] | IEEE International Conference on Internet of Things and Green Computing & Communications & Cyber, Physical & Social Computing & Smart Data (2017) | -Buildings Characteristics -Efficiency of the subsystems for space heating -System efficiency -EP (Normalized primary energy demand for space heating [kWh/m2], etc.) | -Pearson correlation analysis -Principal component analysis -K-means clustering -Classification and Regression Tree algorithm -Silhouette based indices -Singular value decomposition -Statistics -Boxplot distributions -Generalized association rule | Residential | 2 |
| 30 | [49] | Energy Policy | -Dwelling type -Year of construction -Dwelling size -Occupancy status -Energy class -Surface coefficient of heat exchange -Real energy consumption -Systematic energy source -Heating system type -Region Climatic zone -Urban size -Renovation changes | -Statistical approach -Cost–benefit analysis. -Monte Carlo simulation -Sensitivity analysis -Hierarchical Classification (Ward’s criterion) | Residential | 2 |
| 31 | [50] | IOP Conference Series: Earth & Environmental Science | -HVAC systems -Envelope U-values | -ENERFUND tool -Geographical Information System (GIS) visualization | Commercial and Residential | 1 |
| 32 | [27] | Electronics | -Aspect ratio -Surface area -Floor area -Average u-value of the vertical opaque envelope -Average u-value of the windows -Heating system global efficiency -Construction year | -Density-based spatial clustering of application with noise algorithm (dbscan) -Pearson correlation -Max–min binormalization -Elbow method -K-means -Spatial constrained k-nn -Geospatial maps | Residential | 1 |
| 33 | [51] | Energies | -Building type -Number of stories -Construction year -Heated space per story -Area code -Number of stairwells per Apartment | -Google Street View -ANN -Image recognition -Stepwise regression -Logistic regression (LR) -Support vector machines (SVM) | Residential | 1 |
| 34 | [24] | Sustainable Cities & Society | -Useful floor area (m2) -Building shape -Climate zone Window -Glazing type -Wall insulation -Heating system Heating -Energy source -Cooling system Cooling | -Statistical approach -Life-cycle energy impact: Calculate the global energy savings -Life-cycle economic impact -Calculate life environmental impact | Offices | 1 |
| 35 | [52] | Neural Computing & Applications | -Useful surface (m2) -Thermal power (kW) -CO2 emissions -Primary energy consumption -Opaque enclosures -Holes and skylights | -Statistical approach -Bayesian Gaussian process regression (GPR) -Genetic algorithms (GAs) -Limited-memory Broyden–Fletcher–Goldfarb– Shanno (L-BFGS) optimizers | Residential | 0 |
| No. | Building Type | Dimension Category | Reference |
|---|---|---|---|
| 1 | Hospital | -Thermo-physical characteristics -Building envelope -HVAC systems -Weather -Energy use | [16] |
| 3 | University/School | -Building envelope -Building operation -HVAC systems -Financial attributes -Thermophysical parameters -Typology -Climate -Geometry -Energy consumption -Hot water -Internal heat gain and lighting -Standard Emission Rate -Air infiltration rate -Terminal unit energy -Demand and cooling system efficiency. -Roof wall ratio -Solar radiation on the roof | [20,31,33,43,44,46] |
| 4 | Residential | -Building Envelope -Geometry -HVAC systems -Internal heat gains -Weather -Building materials -Financial attributes -Cost data of different renovation measures -Building–location–orientation -Photovoltaic -Energy performance index -Envelope U-values -Construction assemblies -Thermal solar panels -Electricity consumption -Building age -Construction year -Average global efficiency for space heating -EPC -Construction age -EP (Normalized primary energy demand for space heating [kWh/m2], etc.) -Occupancy status -Energy class -Renovation changes -CO2 emissions -Primary energy consumption | [21,22,23,26,27,28,29,30,32,34,35,36,38,39,40,47,48,49,51,52] |
| 4 | Residential and offices | -Weather -Building Envelope -HVAC systems -Energy use -Envelope U-values | [37,50] |
| 5 | Residential, Offices and Schools | -Geometry -Building envelope -HVAC systems -Climate -Geospatial -Construction shape -Occupational characteristics -Energetic characteristics -Building Insulation | [18,25,45] |
| 6 | Care homes | -Building intrinsic properties -Occupancy patterns -Environmental conditions | [41] |
| 7 | Offices | -Building envelope -Indoor facilities -Useful floor area (m2) -Building shape -Climate -Glazing type -Wall insulation -Heating system -Energy source -Cooling system | [24,42] |
| No. | Computational Intelligence Method | Dimension Category | Reference |
|---|---|---|---|
| 1 | Simulation | -Climate -Building geometry -Non-geometric building data -Energy consumption -Energy performance | [16,18,20,23,29,30,31,32,34,37,39,40,47,49] |
| 2 | Genetic Algorithm | -Climate -Geometric building -Non-geometric building data -Energy consumption -Energy performance -Financial attributes | [16,20,29,30,31,32,35,39,40,41,42,52] |
| 3 | Sensitivity analysis | -Climate -Building geometry -Non-geometric building data -Energy consumption -Energy performance -Financial attributes | [31,44,49] |
| 4 | Artificial neural networks (ANN) | -Climate -Building geometry -Non-geometric building data -Energy consumption -Energy performance -Occupational characteristics | [28,33,41,43,45,51] |
| 5 | K-means clustering | -Climate -Building geometry -Non-geometric building data -Energy consumption -Energy performance -Occupational characteristics | [23,25,26,27,43,45,46] |
| 6 | Geographic information systems (GIS) | -Climate -Building geometry -Non-geometric building data -Energy consumption -Energy performance | [21,23,27,43,50,51] |
| 7 | DBSCAN algorithm | -Climate -Building geometry -Non-geometric building data -Energy consumption -Energy performance -Occupational characteristics | [27,45] |
| 8 | Correlation analysis | -Climate -Building geometry -Non-geometric building data -Energy consumption -Energy performance -Occupational characteristics | [23,25,26,27,45] |
| 9 | Statistical approach | -Climate data -Building geometry -Non-geometric building data -Energy consumption -Energy performance | [22,23,24,25,26,29,30,35,41,42,44,48,49,51,52] |
| 10 | Cost-Benefit analysis | -Climate data -Building geometry -Non-geometric building data -Energy consumption -Energy performance -Financial attributes | [24,34,49] |
| 11 | Principal Component Analysis | -Climate -Building geometry -Non-geometric building data -Energy consumption | [38,41] |
Publisher’s Note: MDPI stays neutral with regard to jurisdictional claims in published maps and institutional affiliations. |
© 2021 by the authors. Licensee MDPI, Basel, Switzerland. This article is an open access article distributed under the terms and conditions of the Creative Commons Attribution (CC BY) license (https://creativecommons.org/licenses/by/4.0/).
Share and Cite
Anastasiadou, M.; Santos, V.; Dias, M.S. Machine Learning Techniques Focusing on the Energy Performance of Buildings: A Dimensions and Methods Analysis. Buildings 2022, 12, 28. https://doi.org/10.3390/buildings12010028
Anastasiadou M, Santos V, Dias MS. Machine Learning Techniques Focusing on the Energy Performance of Buildings: A Dimensions and Methods Analysis. Buildings. 2022; 12(1):28. https://doi.org/10.3390/buildings12010028
Chicago/Turabian StyleAnastasiadou, Maria, Vítor Santos, and Miguel Sales Dias. 2022. "Machine Learning Techniques Focusing on the Energy Performance of Buildings: A Dimensions and Methods Analysis" Buildings 12, no. 1: 28. https://doi.org/10.3390/buildings12010028
APA StyleAnastasiadou, M., Santos, V., & Dias, M. S. (2022). Machine Learning Techniques Focusing on the Energy Performance of Buildings: A Dimensions and Methods Analysis. Buildings, 12(1), 28. https://doi.org/10.3390/buildings12010028