
Effect of Lane Narrowing Implemented on an Urban Dual Carriageway on Speed Reduction and Acoustic Environment


Abstract
:1. Introduction
2. Materials and Methods
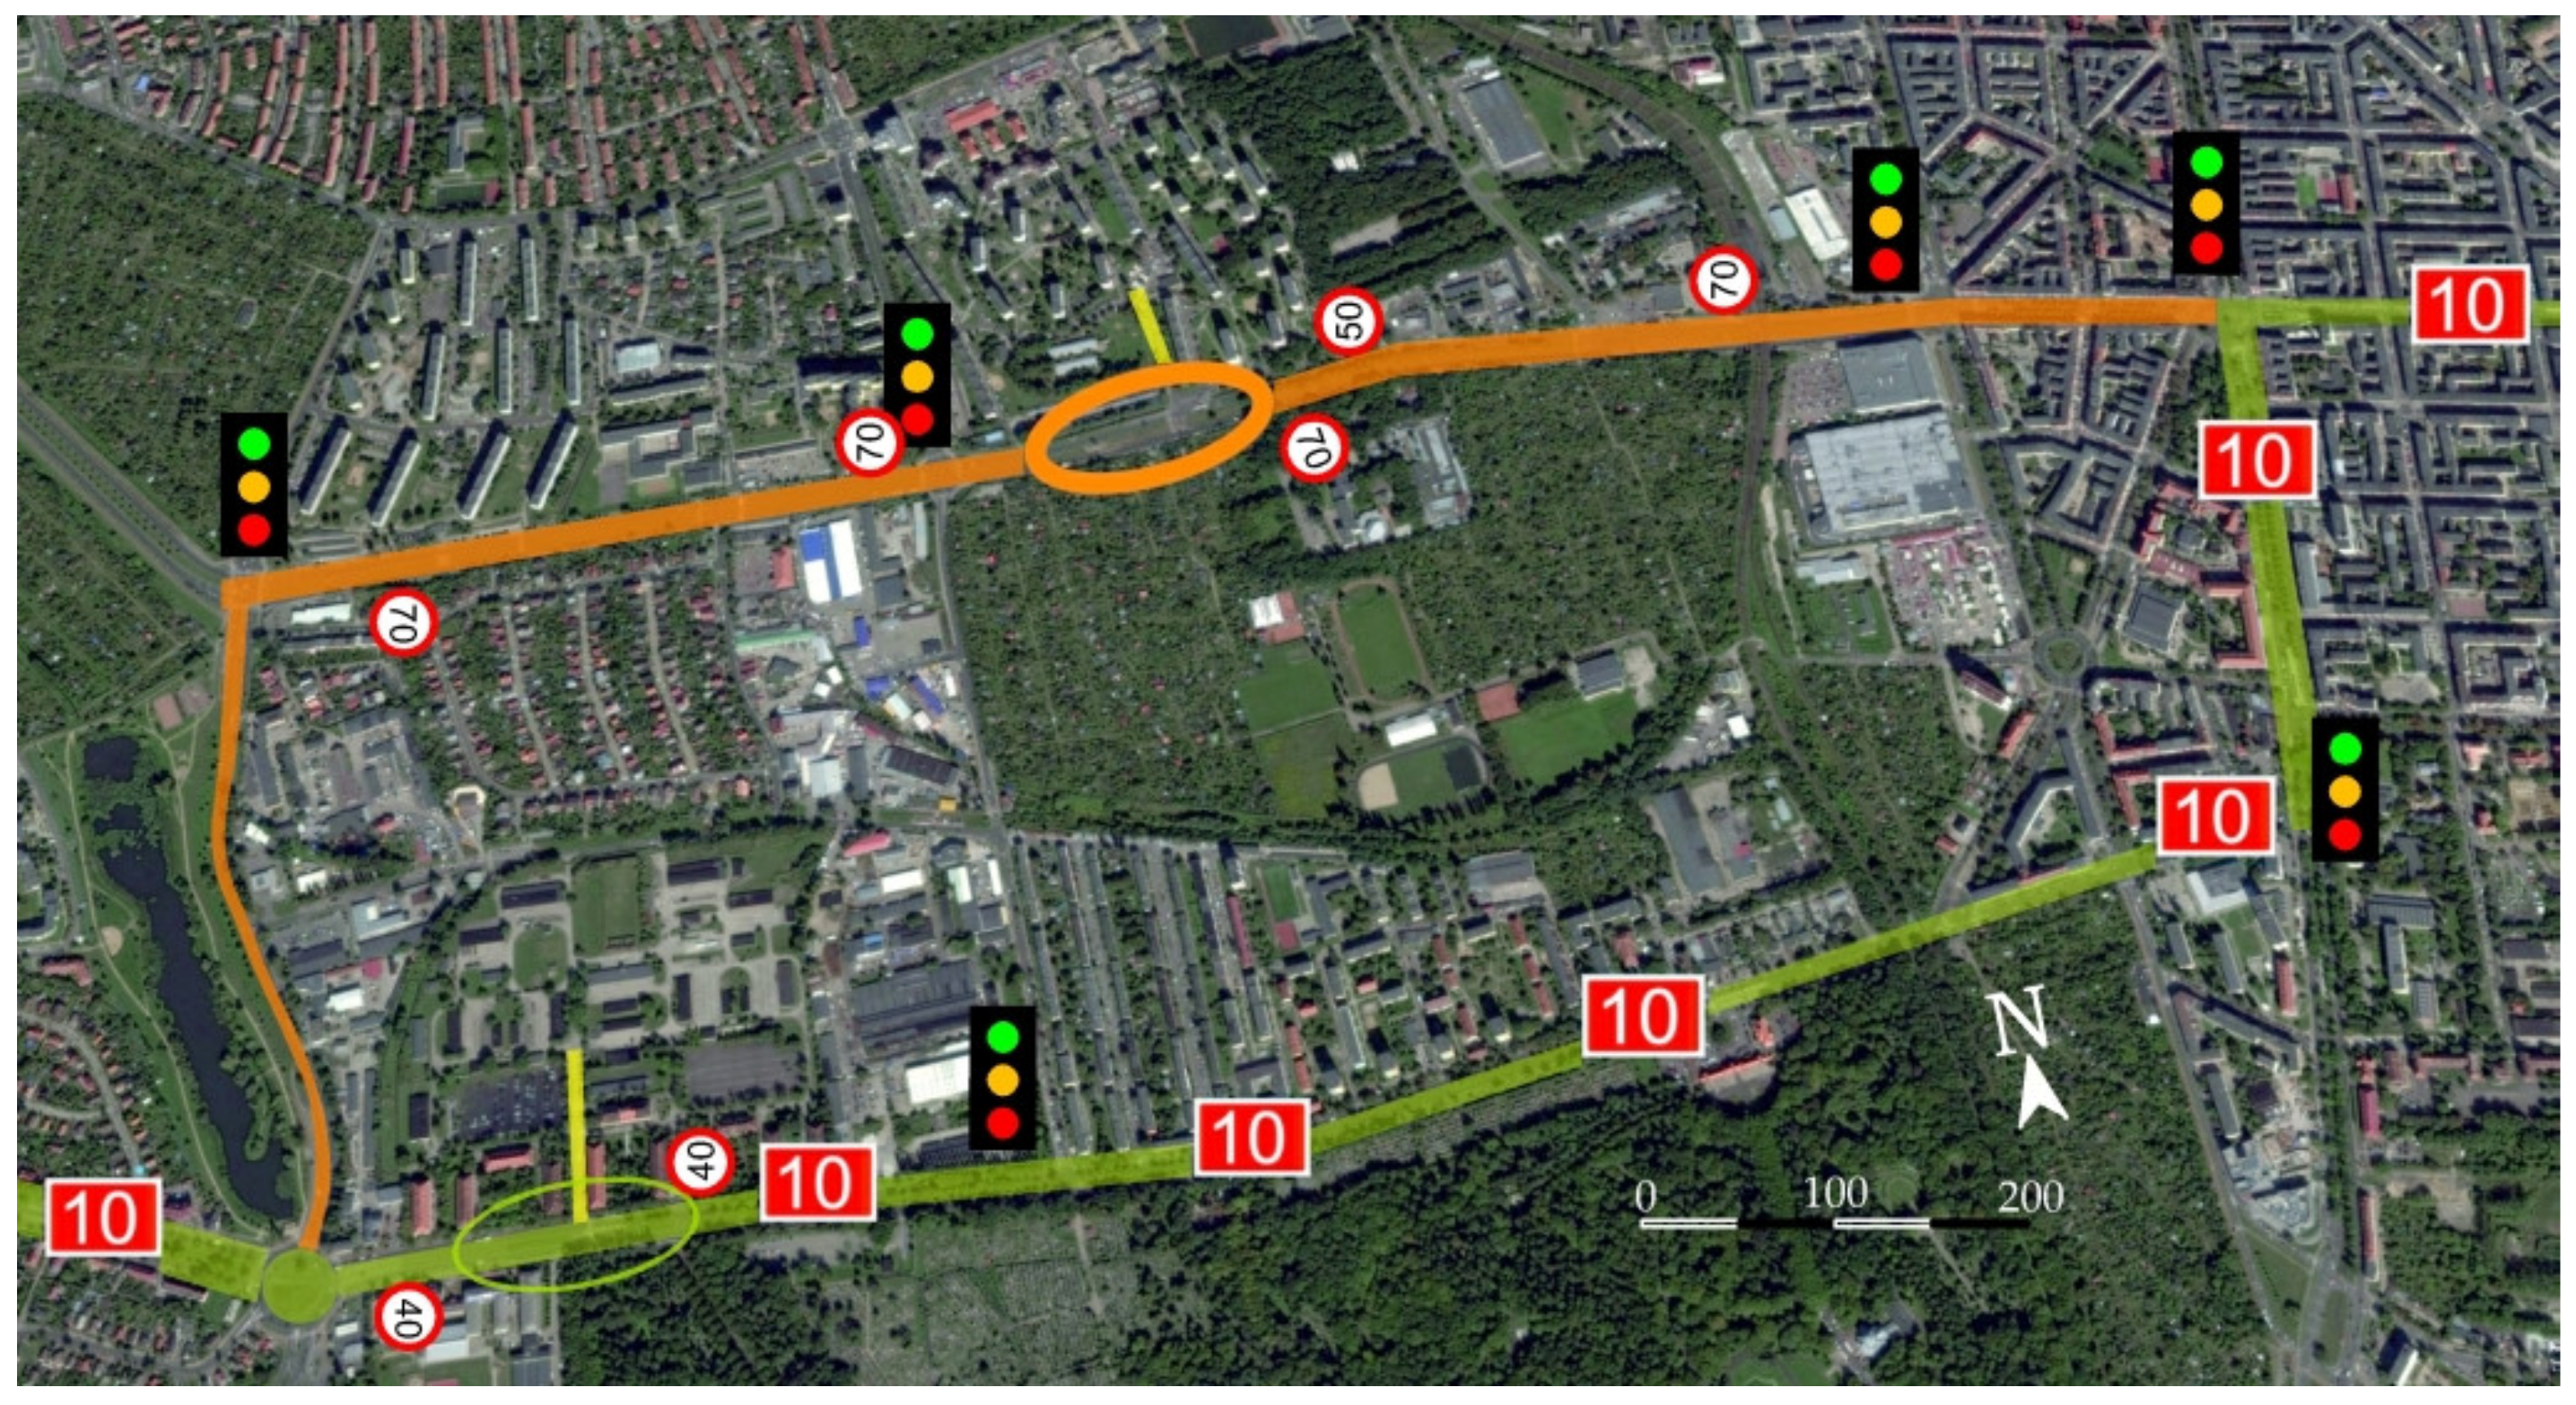
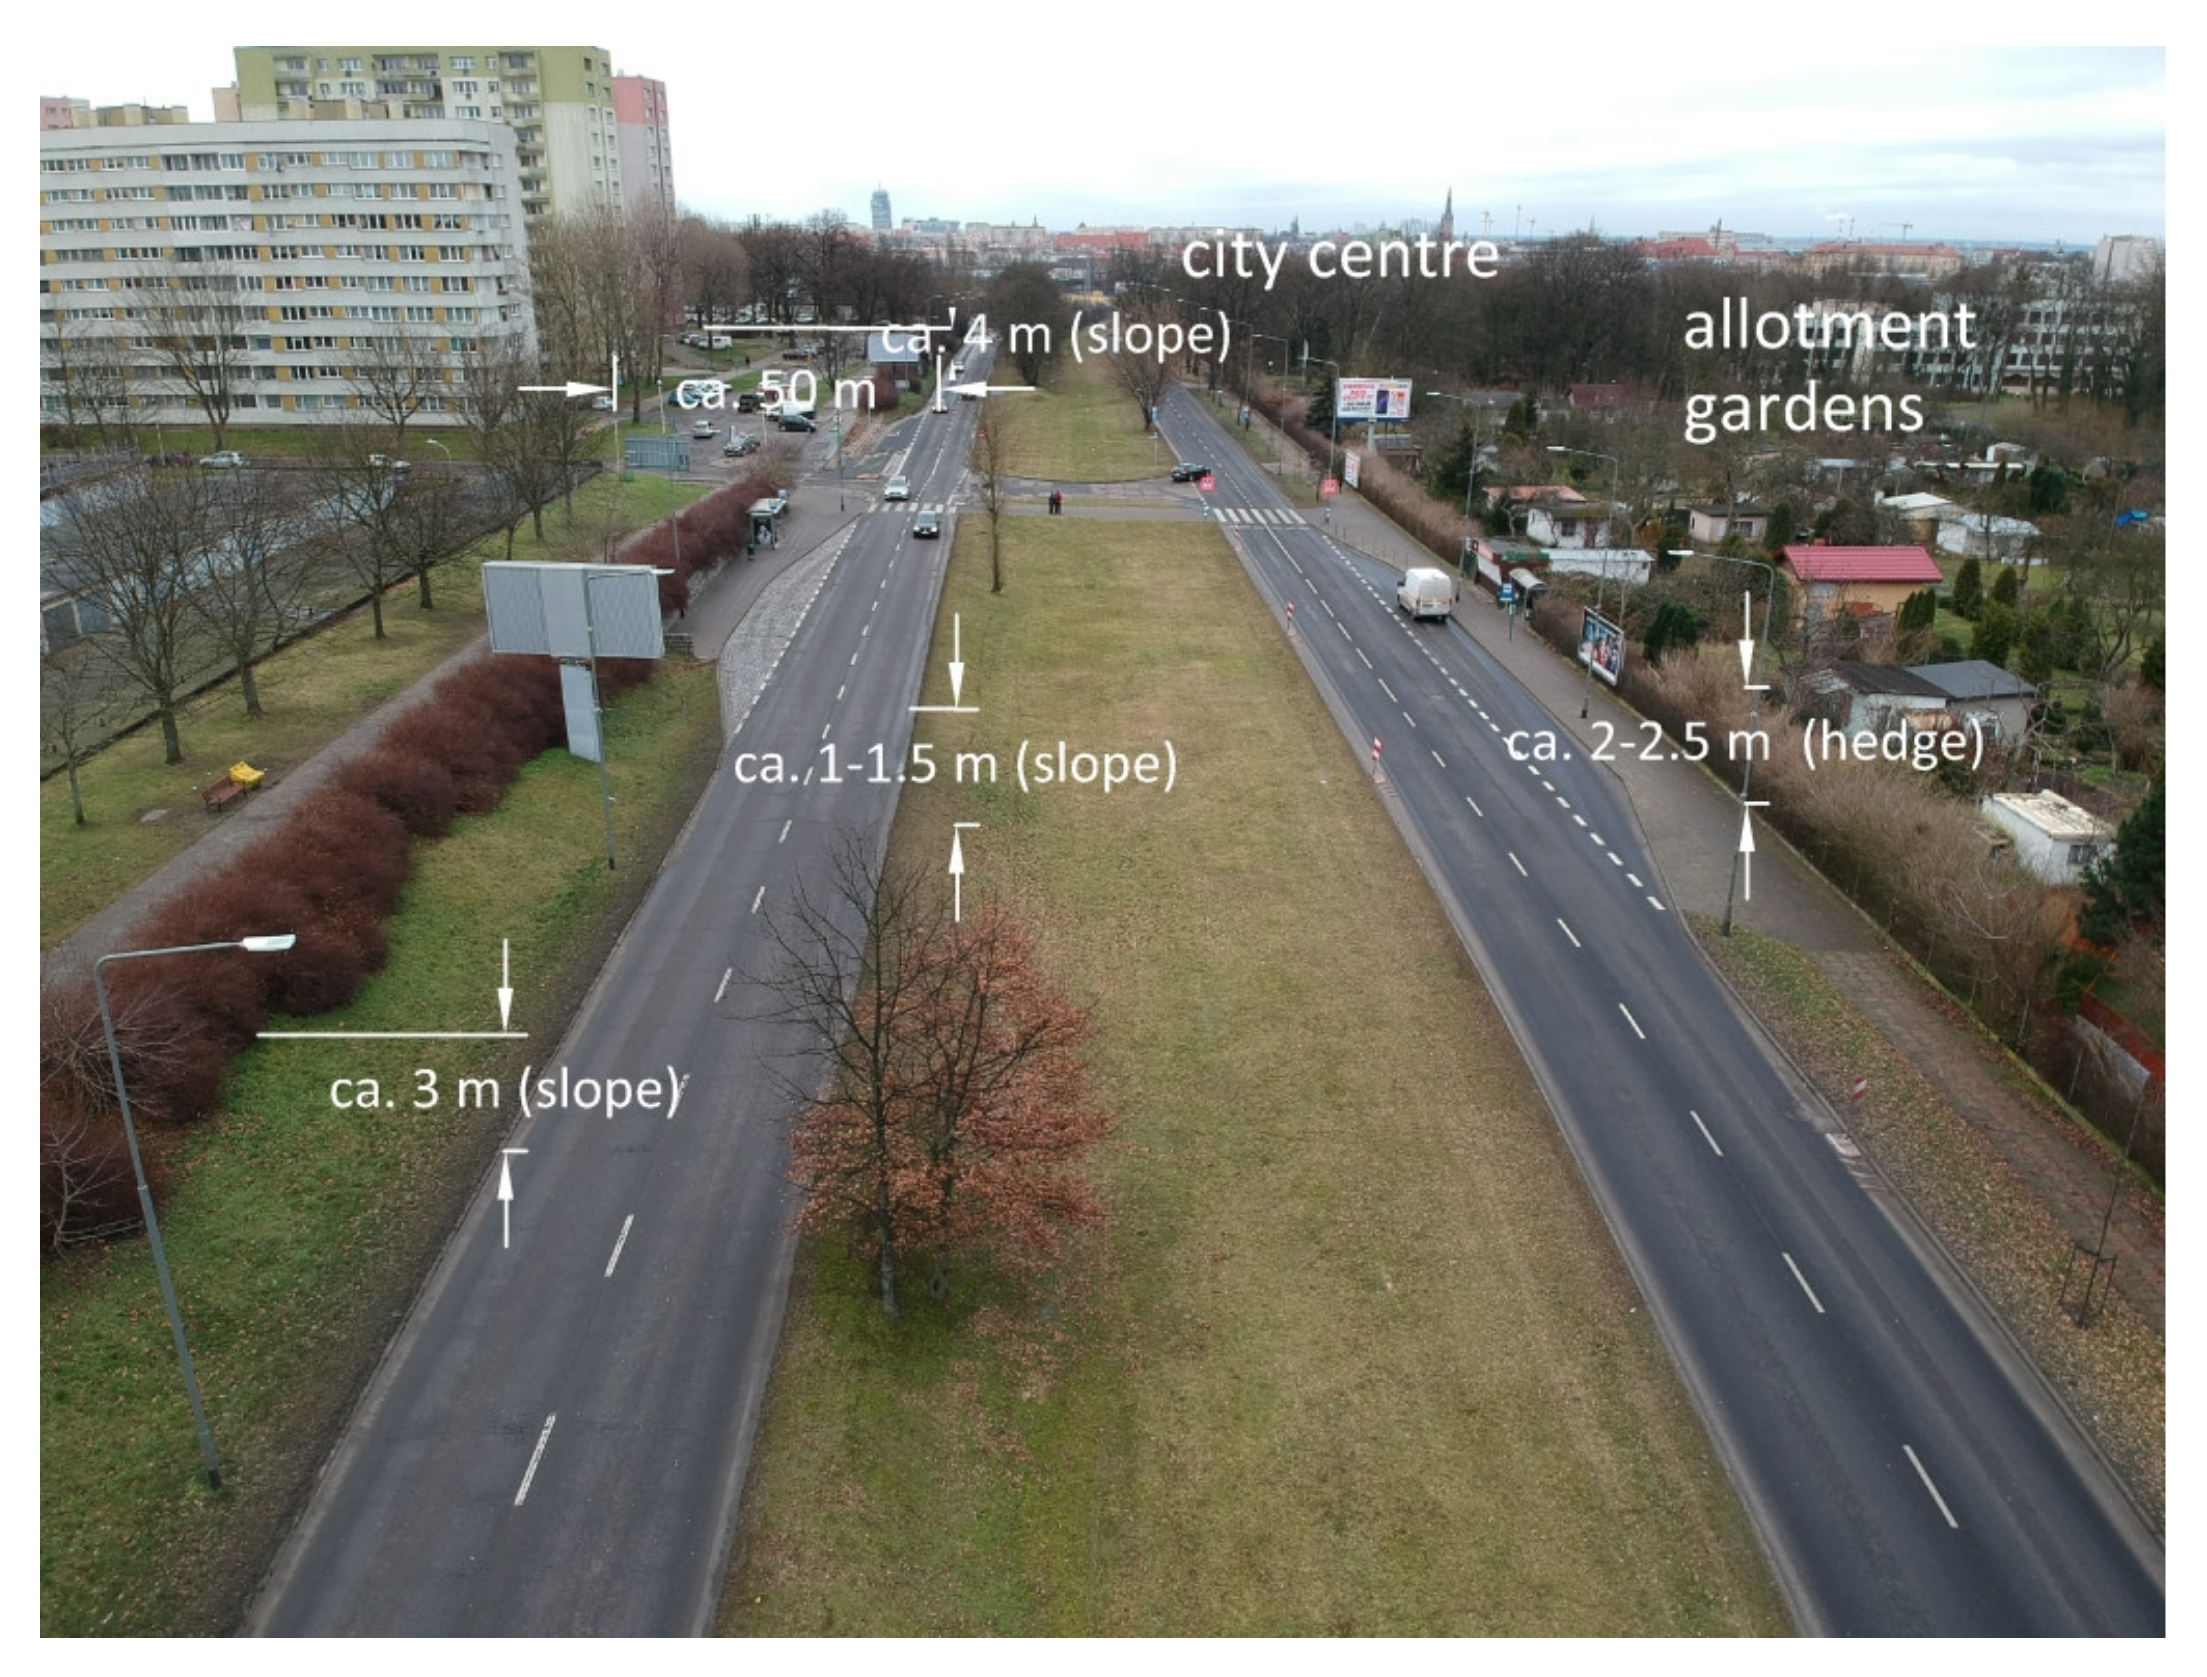
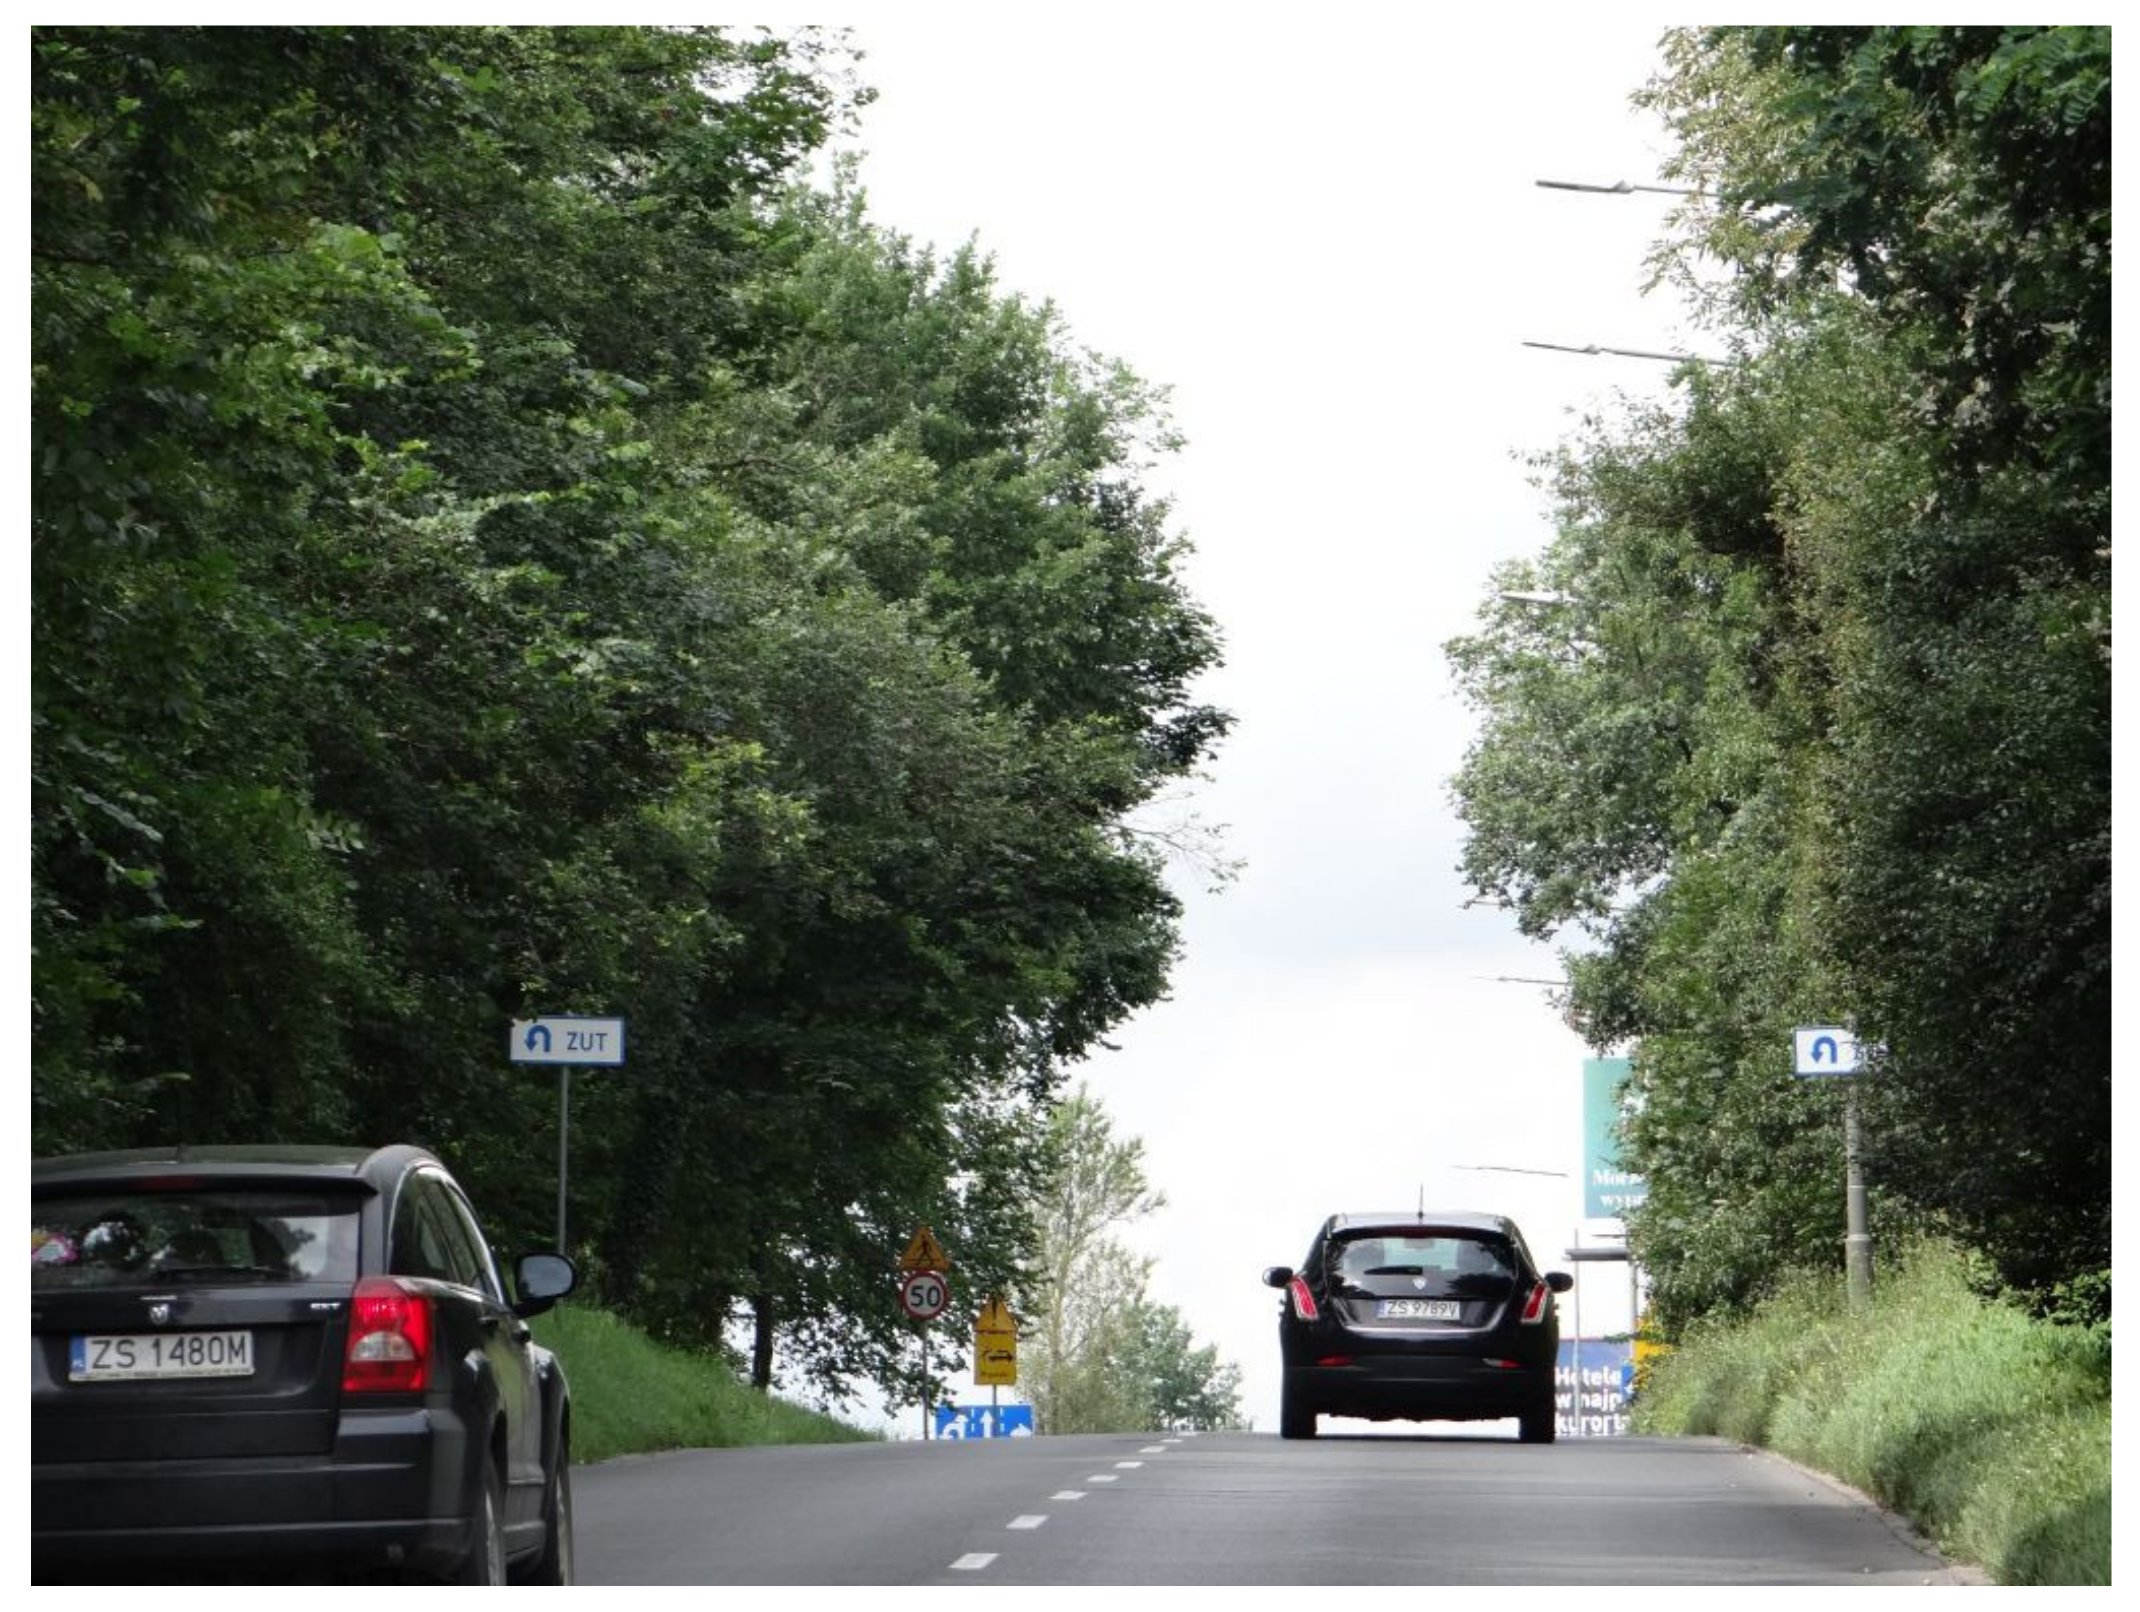
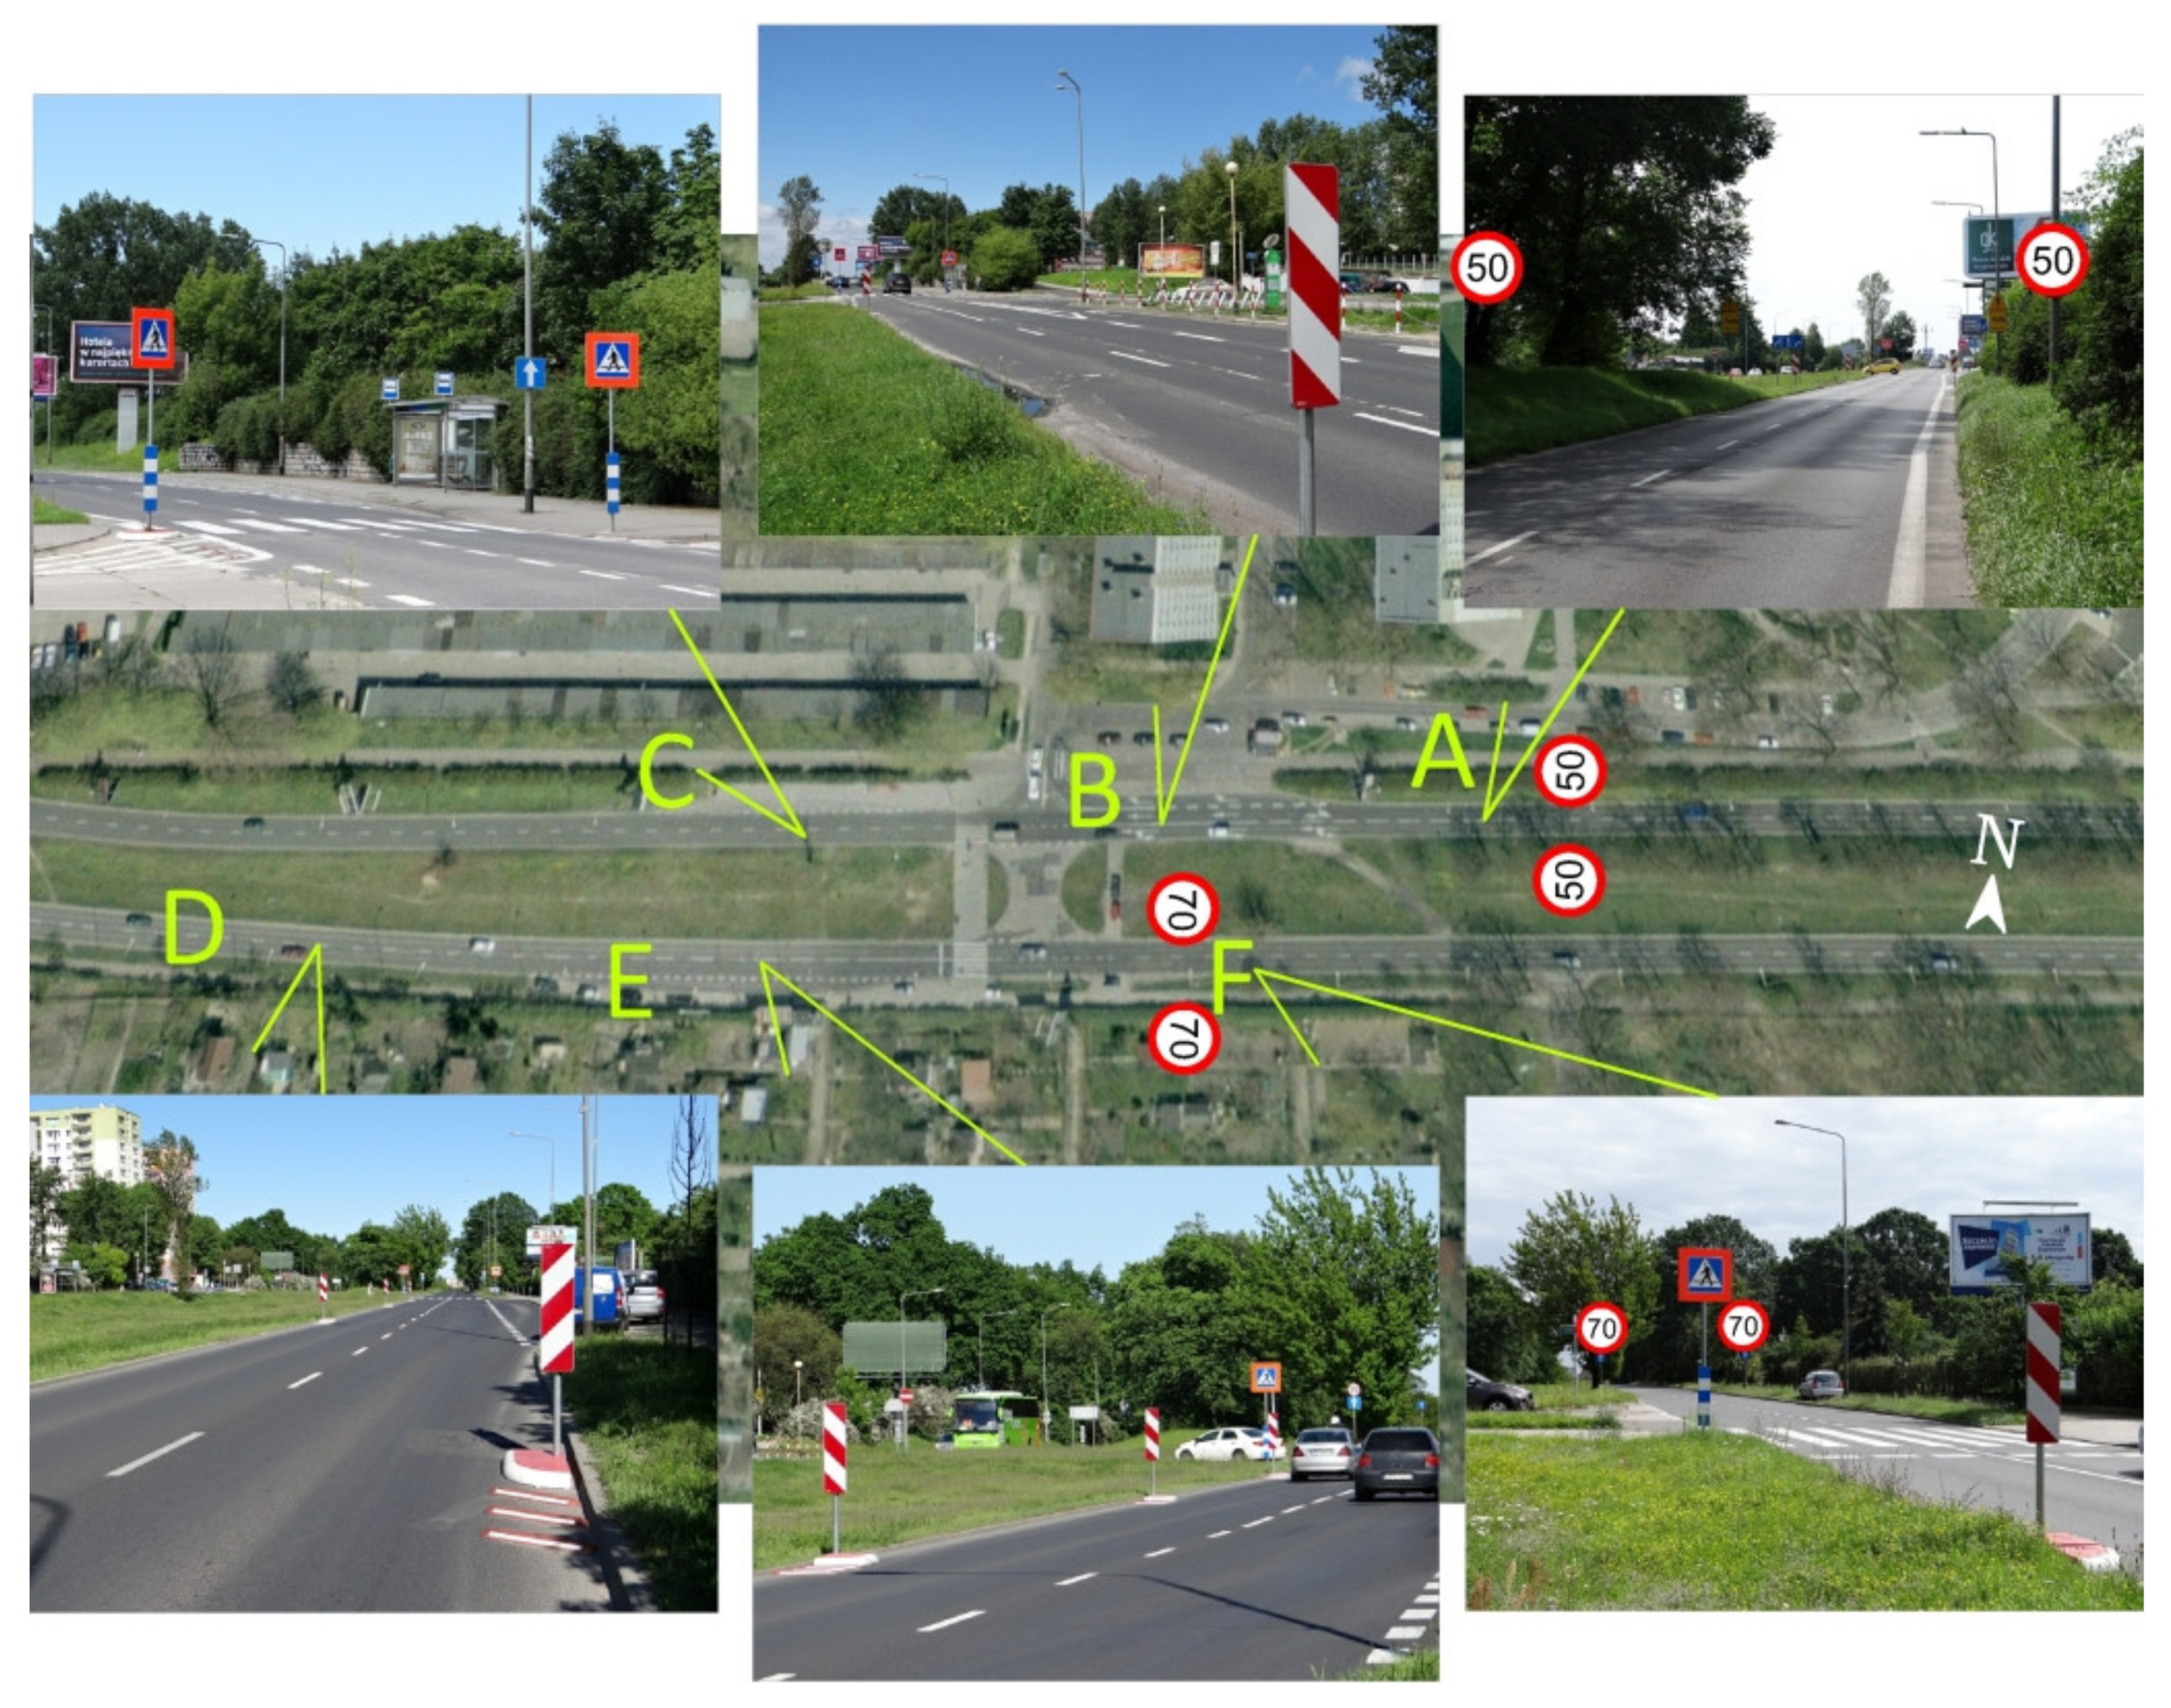
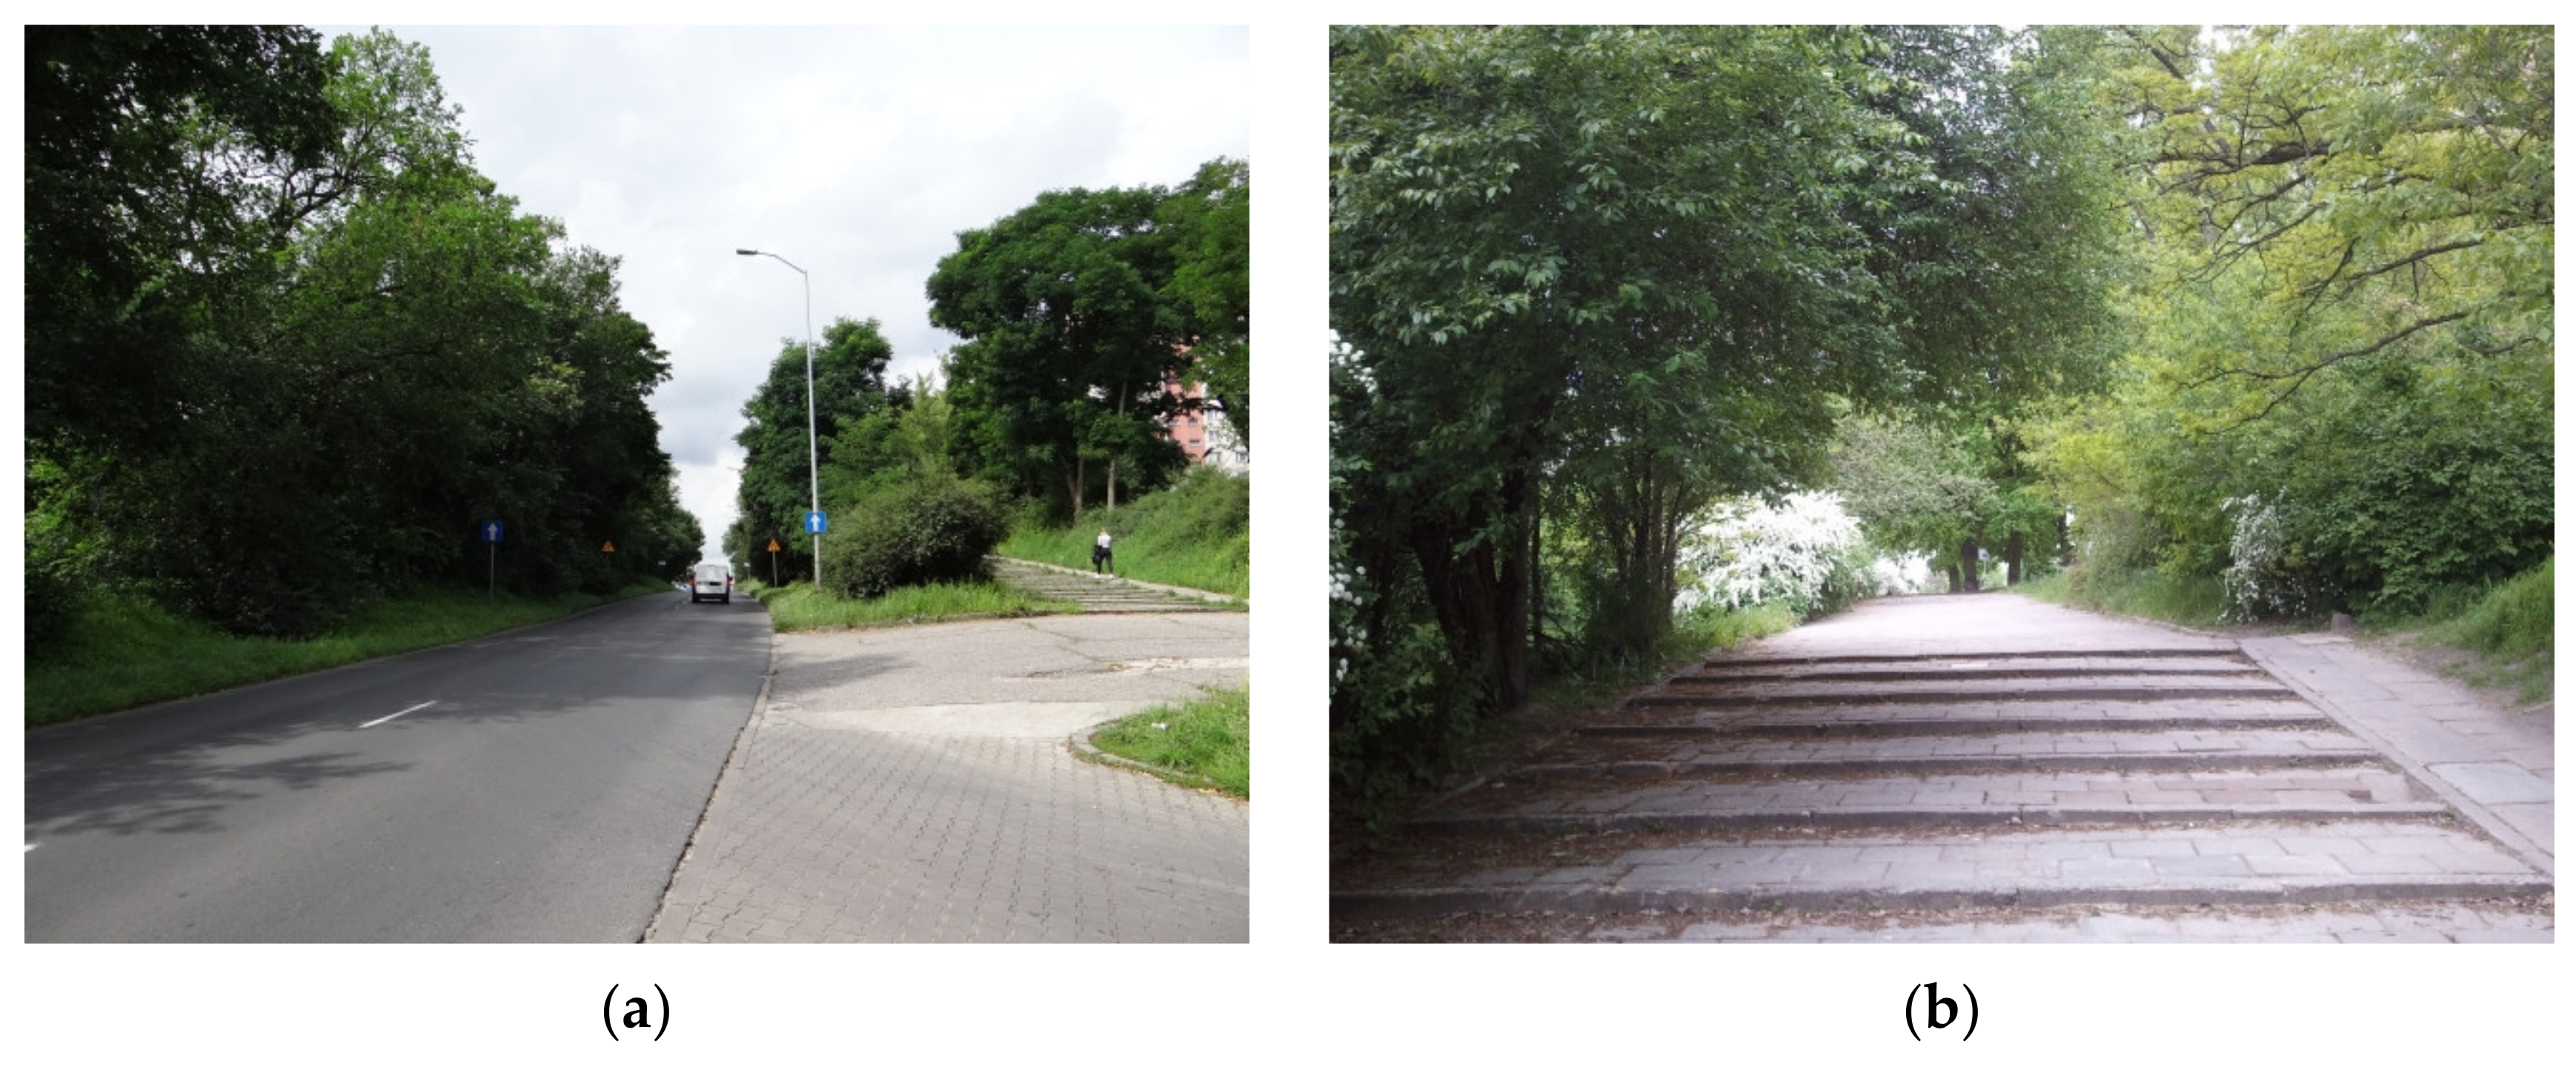
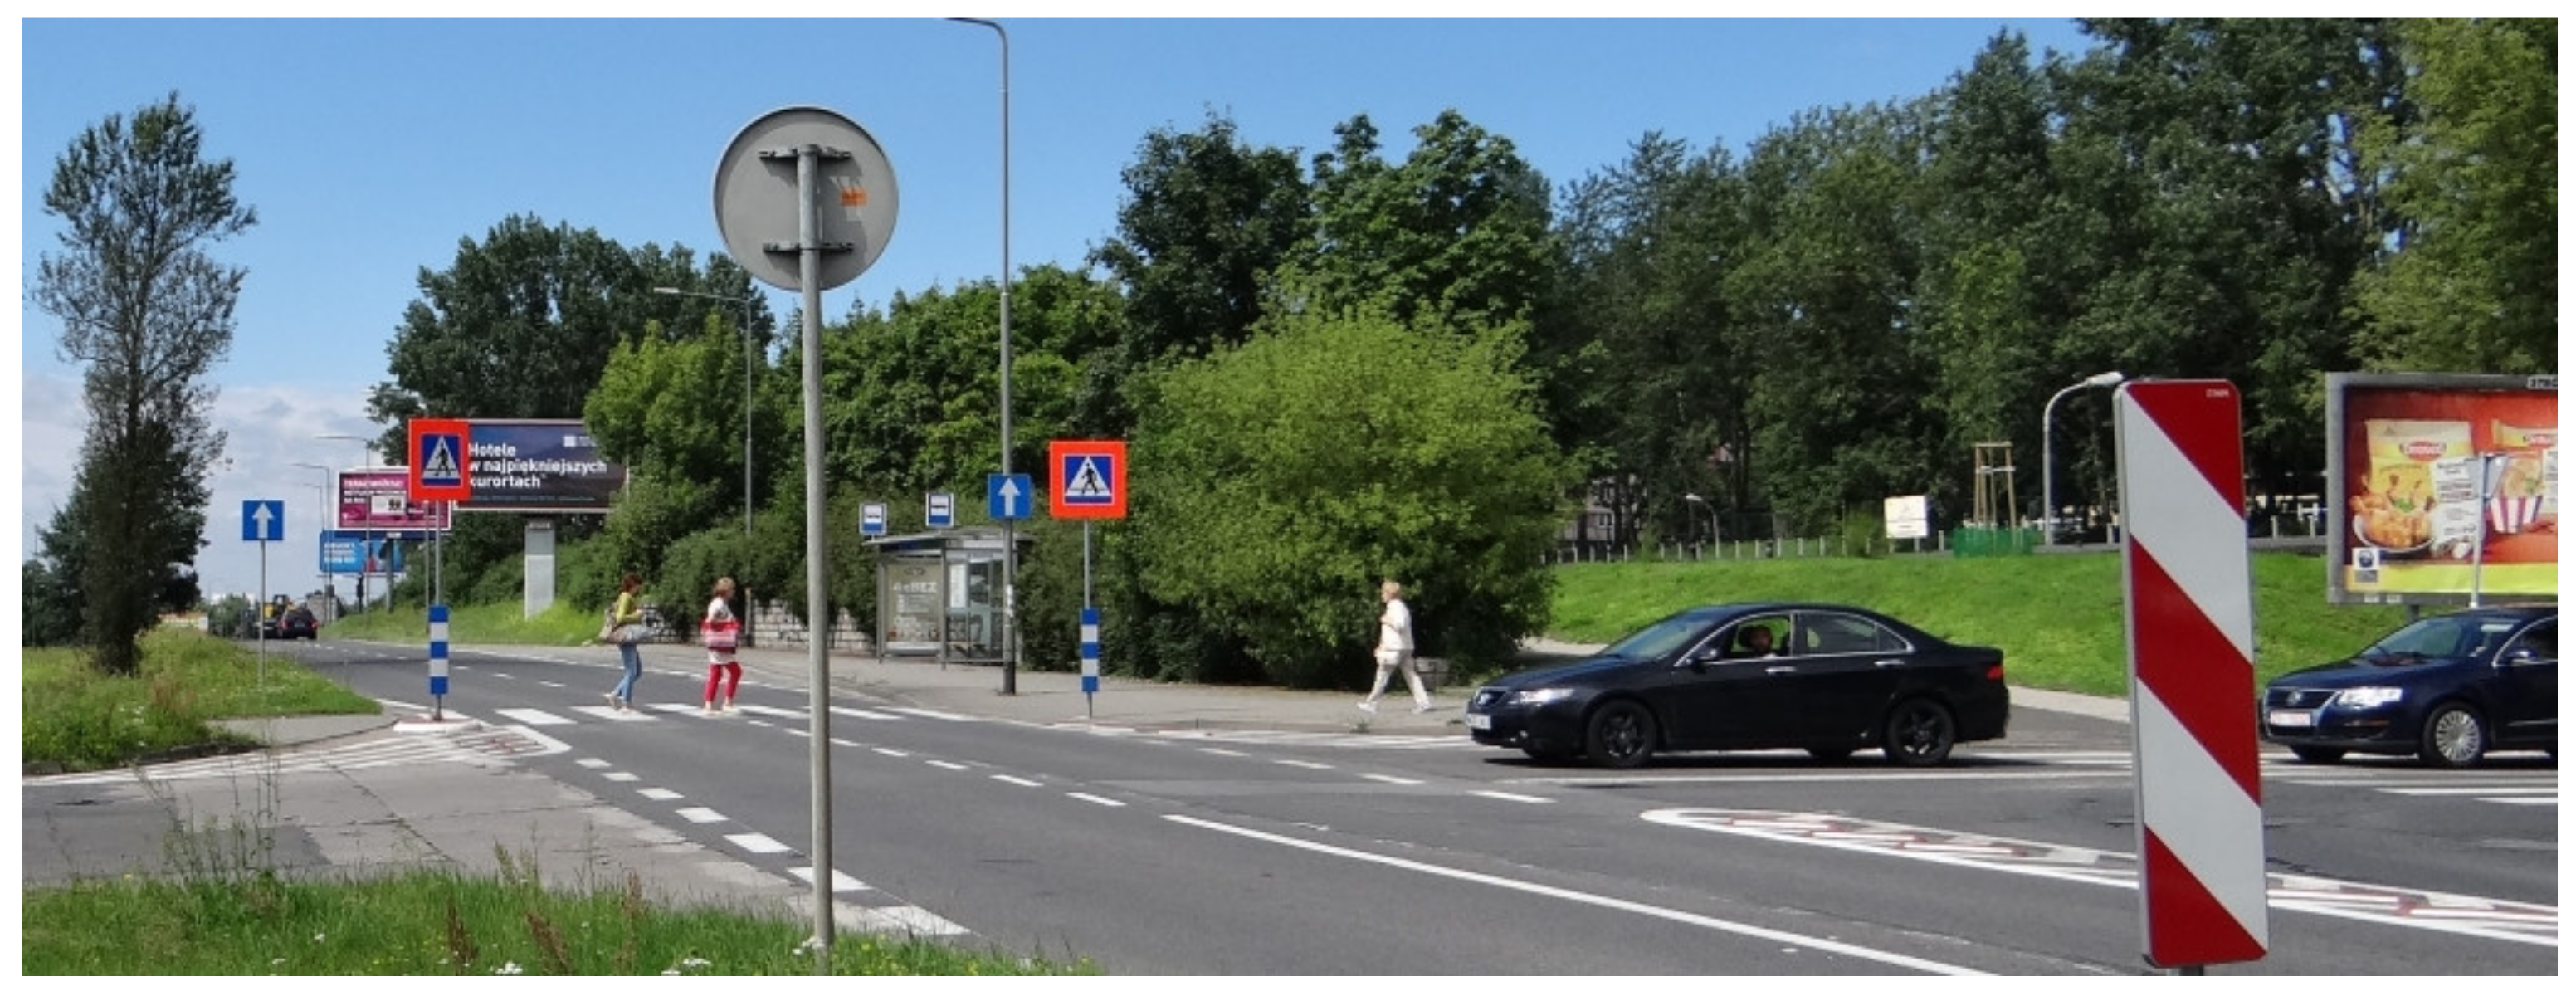
2.1. Subject of Study and Study Area
2.2. Measurement Method
2.3. Research Methods
3. Results
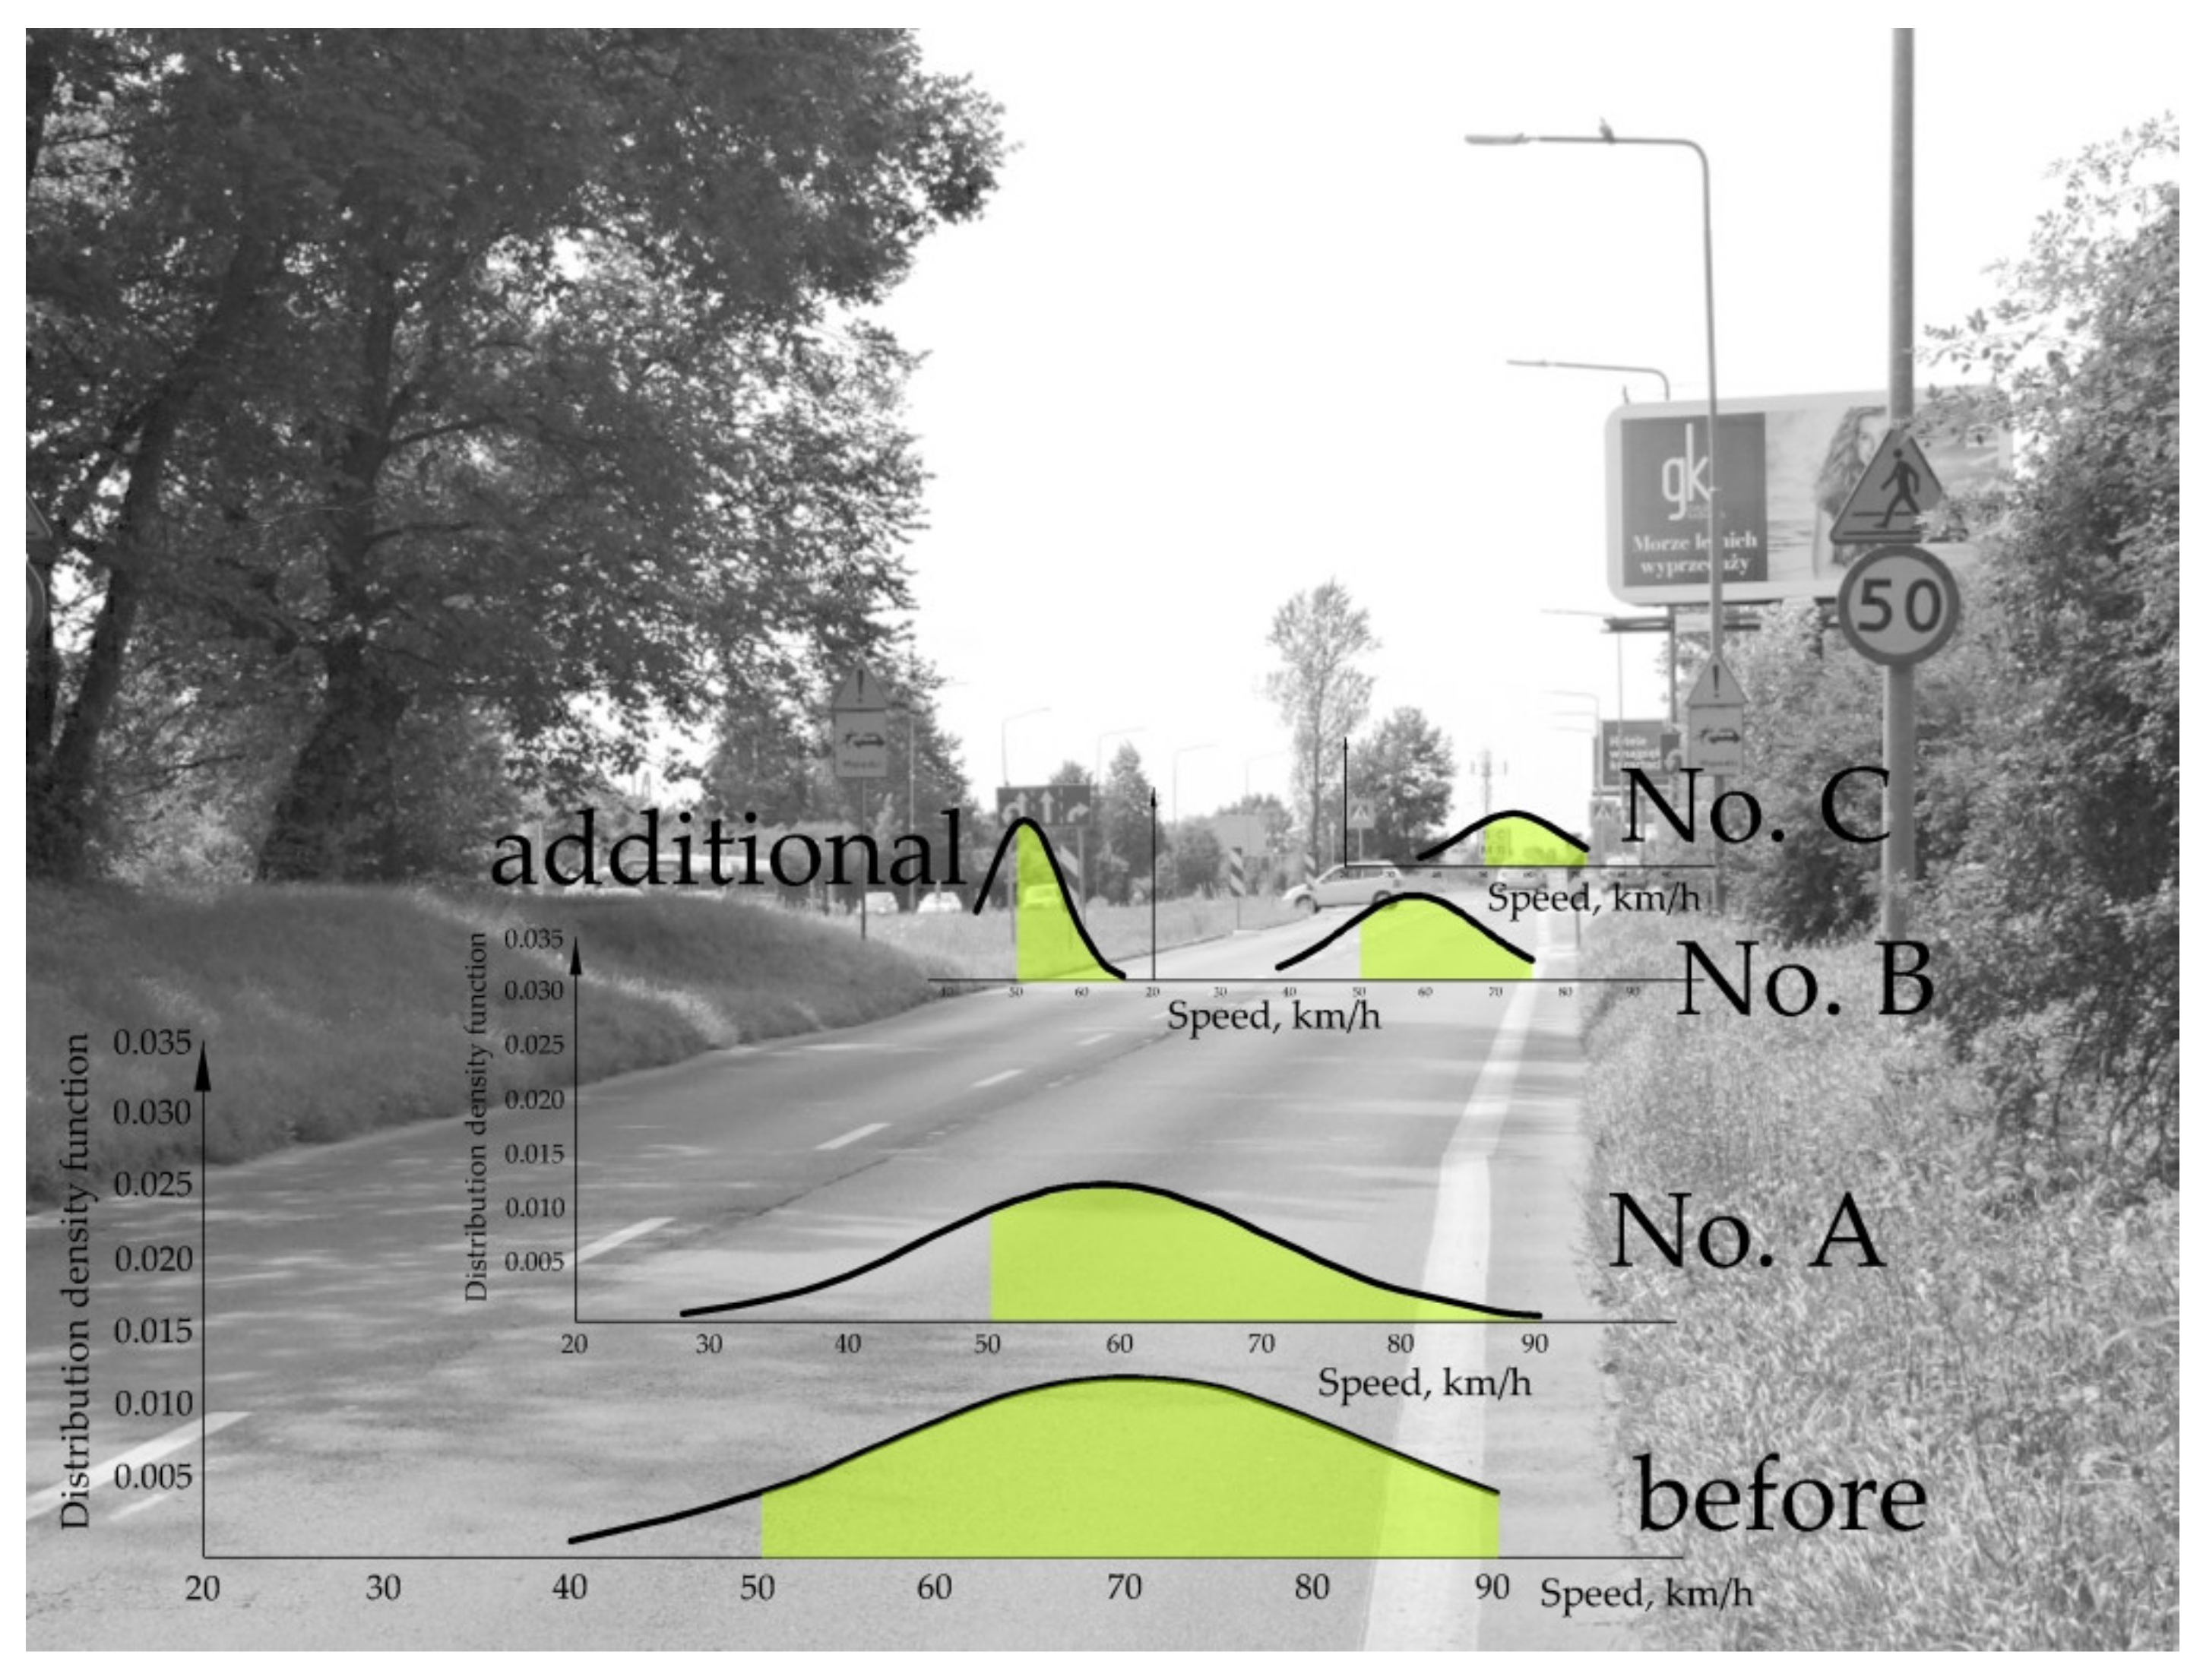
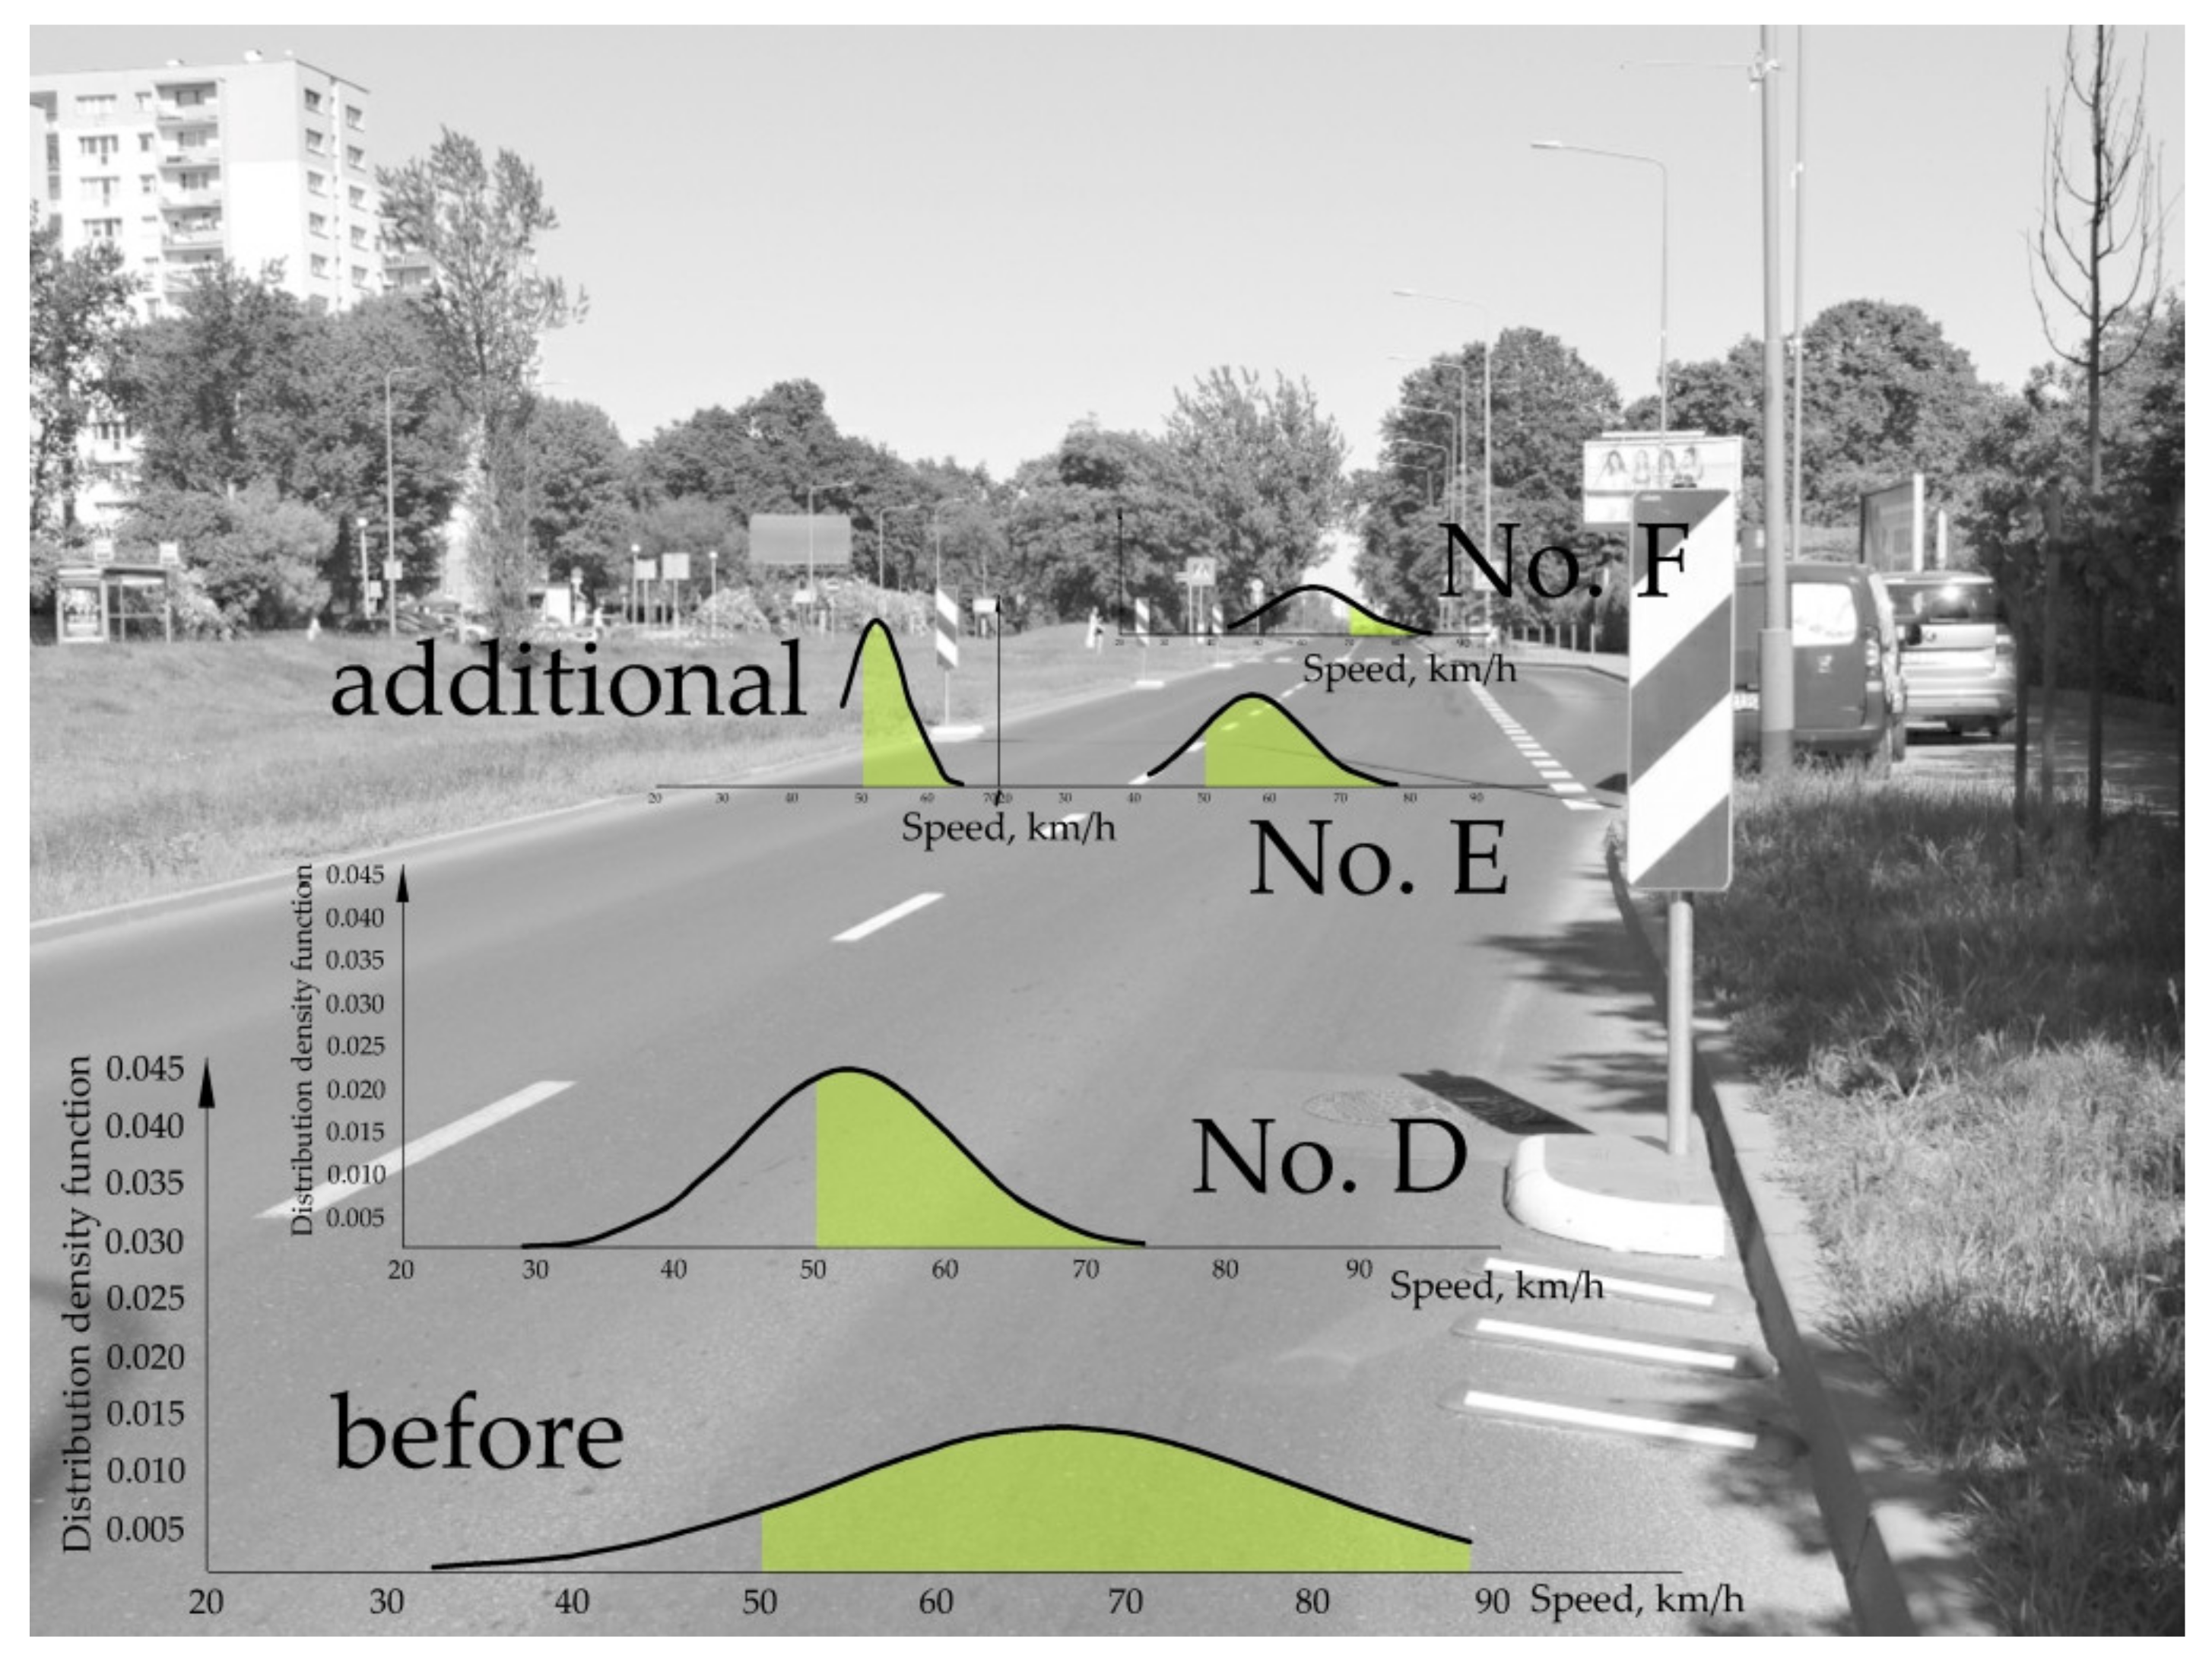
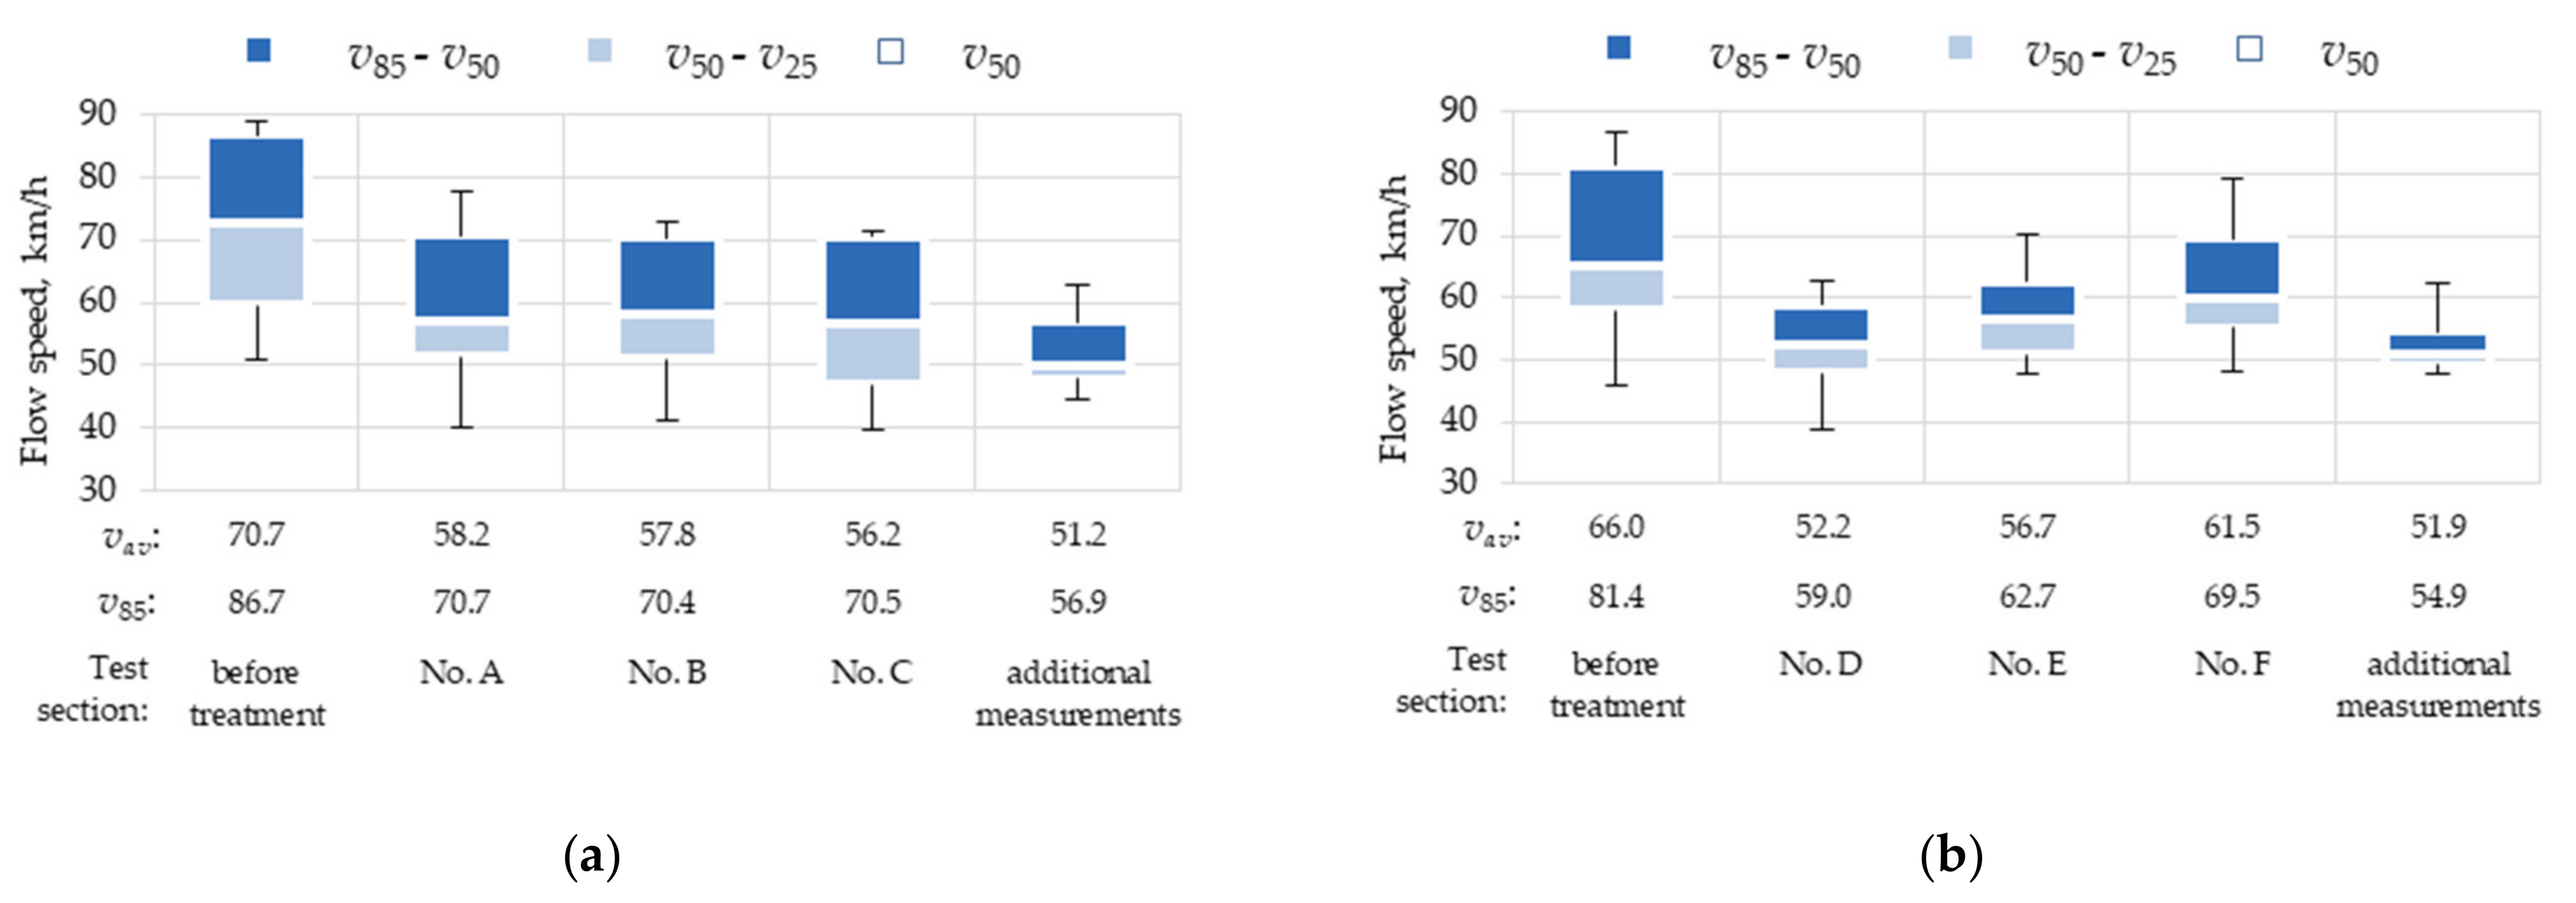
3.1. Speed Data
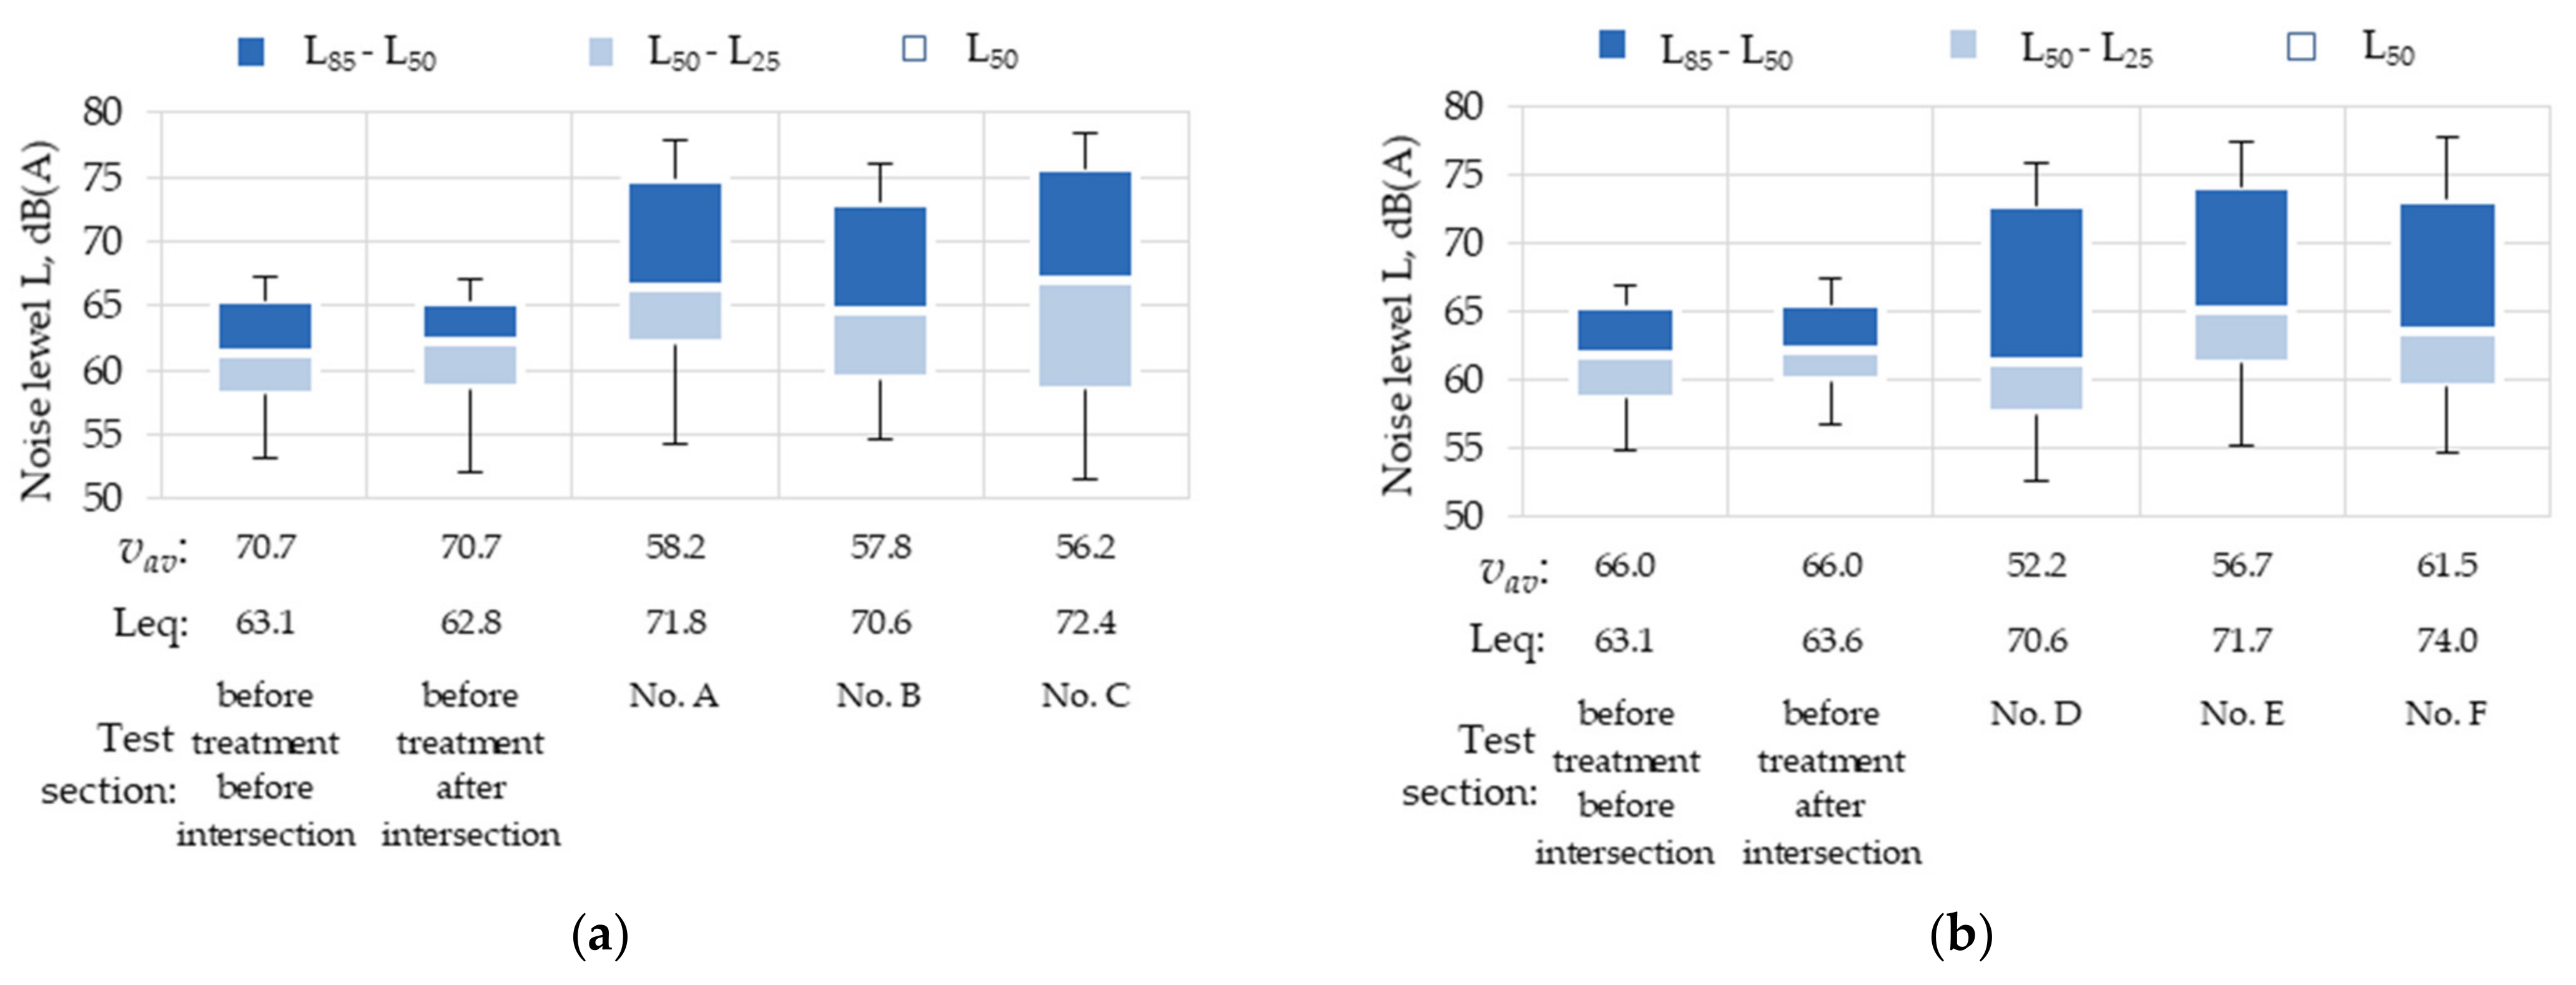
3.2. Noise Measurement Data
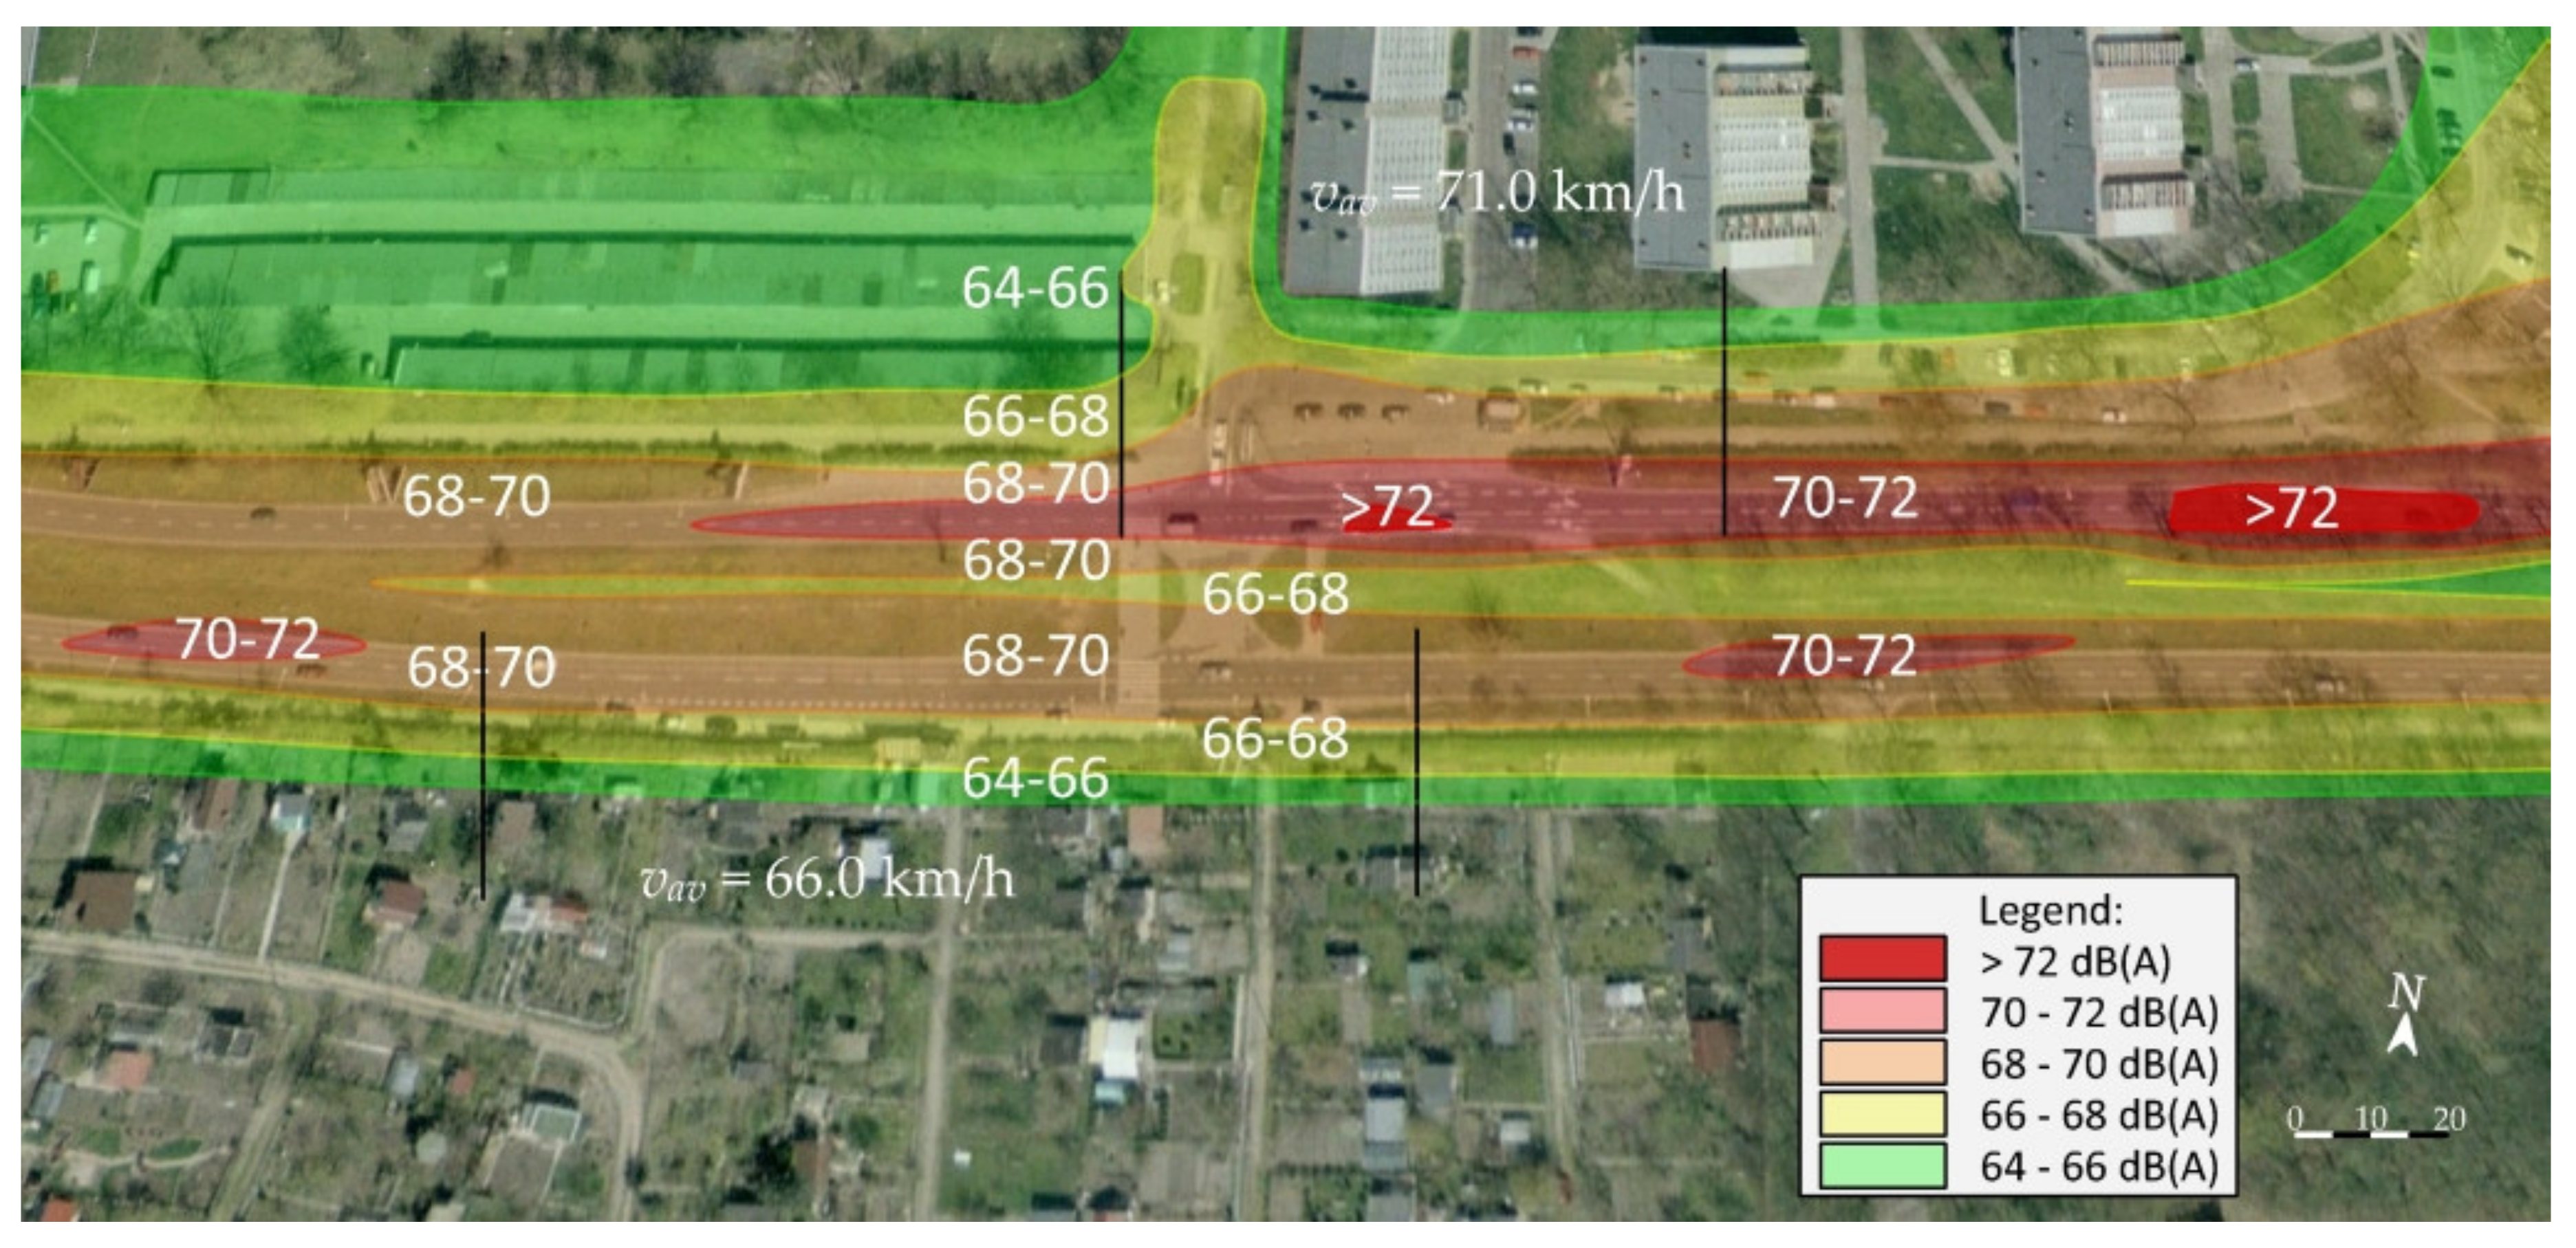
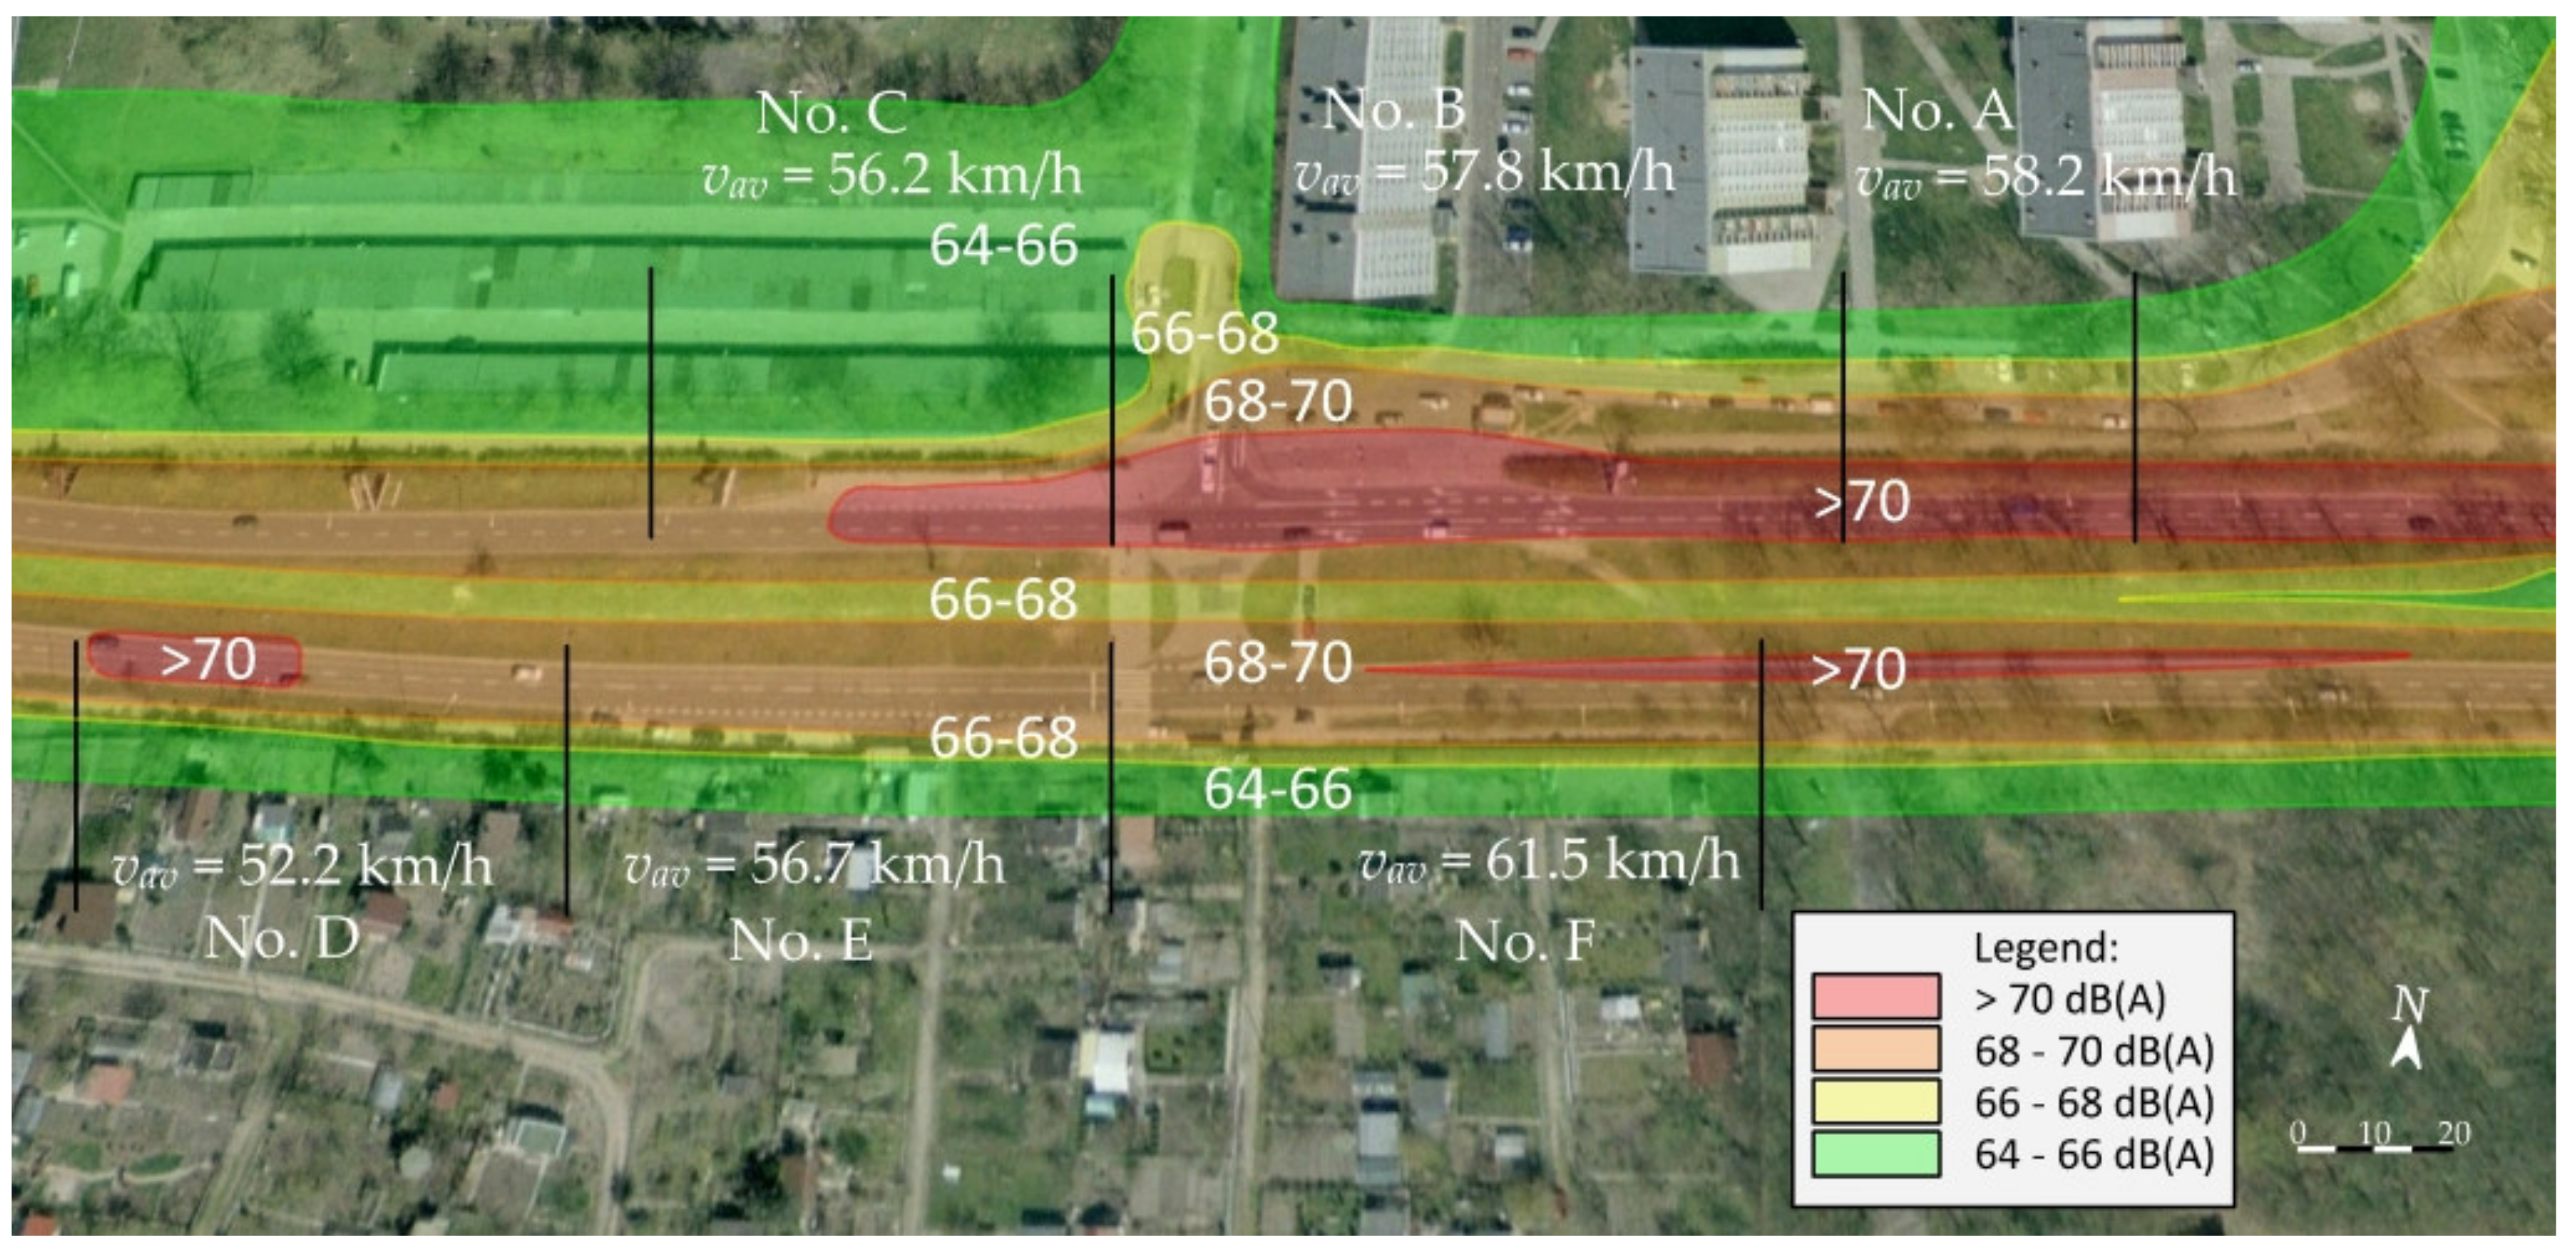
3.3. Noise Maps in the Study Area
4. Discussion
5. Conclusions
Author Contributions
Funding
Institutional Review Board Statement
Informed Consent Statement
Data Availability Statement
Conflicts of Interest
References
- Road Safety TOOLKIT. Speed Management Techniques Aimed at Persuading Drivers to Adopt Safe Speeds Include Police Enforcement, Driver Education, Speed Limits and Engineering Treatments; Speed Menagement: London, UK, 2021; Available online: http://toolkit.irap.org/default.asp?page=treatment&id=33 (accessed on 5 December 2020).
- WHO. Speed Management—A Road Safety Manual for Decision-Makers and Practitioners; GRSP: Geneva, Switzerland, 2008; Available online: https://www.who.int/roadsafety/projects/manuals/speed_manual/speedmanual.pdf (accessed on 5 December 2020).
- SWOV Institute for Road Safety Research. Traffic Calming Schemes, Opportunities and Implementation Strategies; R-2003-22; van Schagen, I., Ed.; SWOV: Leidschendam, The Netherland, 2003; Available online: https://www.gtkp.com/assets/uploads/20100110-011359-5067-R-2003-22.pdf (accessed on 5 December 2016).
- Urban Traffic Areas, Booklet 3, Cross-Sectional Profiles; Road Directorate—Road Regulation Committee RD-RRC: København, Denmark, 2000.
- Urban Traffic Areas—Part 7—Speed Reducers; Vejdirektoratet-Vejregeludvalget: København, Denmark, 1991.
- Roads Development Guide; East Ayrshire Strathclyde Regional Council: Glasgow, UK, 1995; Available online: https://www.ayrshireroadsalliance.org/Resources/pdf/Permit-application-forms/East-Ayrshire/RoadsDevelopmentGuideEAC.pdf (accessed on 17 May 2016).
- Directives for the Design of Urban Roads. RASt 06; Working Group Highway Design, FGSV, Road and Transportation Research Association RTRA Germany Köln Edition: Köln, Germany, 2006.
- Guidelines for Traffic Calming; Public Works City of Sparks, Traffic Division: Reno, NV, USA, 2007; Available online: https://cityofsparks.us/wp-content/uploads/2017/01/traffic-calming-guidelines.pdf (accessed on 17 May 2016).
- Crevier, C. Les Aménagements en Modération de la Circulation, Étude et Applications; École De Technologie Supérieure Université Du Québec: Montreal, QC, Canada, 2007; Available online: http://www.bv.transports.gouv.qc.ca/mono/0967225.pdf (accessed on 7 December 2016).
- Poe, C.M.; Mason, J.M. Analyzing Influence of Geometric Design on Operating Speeds Along Low-Speed Urban Streets: Mixed-Model Approach. Transp. Res. Rec. J. Transp. Res. Board 2000, 1, 18–25. [Google Scholar] [CrossRef]
- Lamm, R.; Choueri, E.M.; Psarianos, B.P. A Practical Safety Approach to Highway Geometric Design, International Case Studies. In Proceedings of the International Symposium on Highway Geometric Design Practices, Boston, MA, USA, 30 August–1 September 1995. [Google Scholar]
- Zhu, H.; Almukdad, A.; Iryo-Asano, M.; Alhajyaseen, W.K.M.; Hideki Nakamura, H.; Xin Zhang, X. A novel agent-based framework for evaluating pedestrian safety at unsignalized mid-block crossings. Accid. Anal. Prev. 2021, 159, 106288. [Google Scholar] [CrossRef] [PubMed]
- Gonzalo-Ordena, H.; Pérez-Acebob, H.; Unamunzagaa, A.L.; Arcea, M.R. Effects of traffic calming measures in different urban areas. Transp. Res. Proc. 2018, 33, 83–90. [Google Scholar] [CrossRef]
- Distefano, N.; Leonardi, S. Effects of Speed Table, Chicane and Road Narrowing on Vehicle Speeds in Urban Areas. In Proceedings of the VI International Symposium New Horizons 2017 of Transport and Communications, Sarajevo/Bosnia, Herzegovina, 17–18 November 2018; Available online: https://www.researchgate.net/publication/328738163_EFFECTS_OF_SPEED_TABLE_CHICANE_AND_ROAD_NARROWING_ON_VEHICLE_SPEEDS_IN_URBAN_AREAS (accessed on 17 May 2020).
- Loprencipe, G.; Moretti, L.; Pantuso, A.; Banfi, E. Raised Pedestrian Crossings: Analysis of Their Characteristics on a Road Network and Geometric Sizing Proposal. Appl. Sci. 2019, 9, 2844. [Google Scholar] [CrossRef] [Green Version]
- Akgol, K.; Gunay, B.; Aydin, M.M. Geometric optimisation of chicanes using driving simulator trajectory data. Proc. Inst. Civ. Eng. Transp. 2019, 1900019, 1–11. [Google Scholar] [CrossRef]
- Mok, J.H.; Landphair, H.C.; Naderi, J.R. Landscape Improvement Impacts on Roadside Safety in Texas. Landsc. Urban Plan. 2006, 78, 263–274. [Google Scholar] [CrossRef]
- Paige, M. Speed and Road Traffic Noise. The Role that Lower Speeds Could Play in Cutting Noise from Traffic; Report; UK Noise Association: London, UK, 2009. [Google Scholar]
- European Environment Agency. Environmental Noise in Europe—2020; Publications Office of the European Union: Luxembourg, 2020. [Google Scholar]
- Blue Book Road Infrastructure, Jaspers. In Niebieska Książka. Sektor Transportu Publicznego w Miastach, Aglomeracjach i Regionach; 2015. Available online: https://www.cupt.gov.pl/ (accessed on 30 November 2020).
- ISO. Sustainable Development in Communities—Management System for Sustainable Development—Requirements with Guidance for Use; International Organization for Standardization: Geneva, Switzerland, 2016. [Google Scholar]
- Jaskuła, P.; Ejsmont, J.; Stienss, M.; Ronowski, G.; Szydłowski, C.; Świeczko-Żurek, B.; Ryś, D. Initial Field Validation of Poroelastic Pavement Made with Crumb Rubber, Mineral Aggregate and Highly Polymer-Modified Bitumen. Materials 2020, 13, 1339. [Google Scholar] [CrossRef] [Green Version]
- Gardziejczyk, W.; Jaskuła, P.; Ejsmont, J.; Motylewicz, M.; Stienss, M.; Mioduszewski, P.; Gierasimiuk, P.; Zawadzki, M. Investigation of Sound Properties of Poroelastic Asphalt Mixtures in Laboratory and Field Conditions. Materials 2021, 14, 2649. [Google Scholar] [CrossRef]
- Gardziejczyk, W.; Motylewicz, M. Przebudowa dróg i ulic a klimat akustyczny w ich otoczeniu. Mater. Bud. 2015, 7, 99–101. [Google Scholar] [CrossRef]
- Xiong, Y.; Tuononen, A. A laser-based sensor system for tire tread deformation measurement. IOP Publ. Meas. Sci. Technol. 2014, 25, 115103. [Google Scholar] [CrossRef]
- Heutschi, K.; Favre A-Ch Thomann, G.; Wunderli, J.-M.; Schrade, A.; Brink, M. Tempo 30 als Lärmschutzmassnahme: Grundlagenpapier zu Recht—Akustik—Wirkung, Eidgenössische Kommission für Lärmbekämpfung; EKLB: Bern, Switzerland, 2015. [Google Scholar]
- World Health Organization. Burden of Disease from Environmental Noise—Quantification of Healthy Life Years Lost in Europe; WHO Regional Office for Europe: Copenhagen, Denmark, 2011; Available online: https://apps.who.int/iris/handle/10665/326424 (accessed on 29 August 2020).
- Dickens, R.; Angulo, M.; Turner, S.; Gill, J.; Abdul, M.; Hirani, H. Environmental Noise: Valuing Impacts on: Sleep Disturbance, Annoyance, Hypertension, Productivity and Quiet; Report; Interdepartmental Group on Costs and Benefits Noise Subject Group, Department for Enviroment Foof & Rural Affairs: London, UK, 2014. [Google Scholar]
- Engel, Z. Ochrona Środowiska przed Drganiami i Hałasem; PWN: Warszawa, Poland, 2001. [Google Scholar]
- Klasy Pochłaniania Dźwięku. Available online: https://www.ecophon.com/pl/about-ecophon/acoustic-knowledge/how-to-create-good-room-acoustics/sound-absorption-classes/ (accessed on 8 September 2020).
- Sadowski, J.; Szudrowicz, B. The Influence of Materials and Construction on the Sound Climate in Dwellings and Its Effect on Residents’ Health. Final report (Project No 05-202-2, cooperation PI-USA); Building Research Institute: Warsaw, Poland, 1975. [Google Scholar]
- Sadowski, J. Akustyka w Urbanistyce Architekturze i Budownictwie; Arkady: Warszawa, Poland, 1971. [Google Scholar]
- Wilkosz-Mamcarczyk, M. Rola zieleni w procesach rewitalizacji miast (w kontekście zrównoważonego rozwoju). Ph.D. Thesis, Politechnika Krakowska, Kraków, Poland, 2015. Available online: https://repozytorium.biblos.pk.edu.pl/redo/resources/26236/file/suwFiles/WilkoszMamcarczykM_RolaZieleni.pdf (accessed on 10 September 2021).
- Dzhambov, A.M.; Dimitrova, D.D. Urban green spaces’ effectiveness as a psychological buffer for the negative health impact of noise pollution: A systematic review. Noise Health 2014, 16, 157–165. [Google Scholar] [CrossRef]
- Uebel, K.; Marselle, M.; Dean, A.J.; Rhodes, J.R.; Bonn, A. Urban green space soundscapes and their perceived restorativeness. People Nat. 2021, 3, 756–769. [Google Scholar] [CrossRef]
- Franěk, M.; Režný, L.; Šefara, D.; Cabal, J. Effect of birdsongs and traffic noise on pedestrian walking speed during different seasons. PeerJ 2019, 7, e7711. [Google Scholar] [CrossRef]
- Hedblom, M.; Knez, I.; OdeSang, Å.; Gunnarsson, B. Evaluation of natural sounds in urban greenery: Potential impact for urban nature preservation. R. Soc. Open Sci. 2017, 4, 170037. [Google Scholar] [CrossRef] [Green Version]
- Abbott, P.; Tyler, J.; Layfield, R. Traffic Calming: Vehicle Noise Emissions Alongside Speed Control Cushions and Road Humps, Raport 180; Transport Research Laboratory TRL: Berkshire, UK, 1995. [Google Scholar]
- Bachok, K.S.R.; Hamsa, A.A.K.; bin Mohamed, M.Z.; Ibrahim, M. A theoretical overview of road hump effects on traffic noise in improving residential well-being. Transp. Res. Proc. 2017, 25, 3383–3397. [Google Scholar] [CrossRef]
- Džambas, T.; Dragčević, V.; Lakušić, J. Impact of vertical traffic calming devices on environmental noise. Građevinar 2020, 12, 1131–1143. [Google Scholar] [CrossRef]
- Ellebjerg, L. Noise Control through Traffic Flow Measures—Effects and Benefits Report 151; Danish Road Institute—Electronic: Hedehusene, Denmark, 2007. [Google Scholar]
- Gozalo, G.R.; Suárez, E.; Montenegro, A.L.; Arenas, J.P.; Juan Miguel Barrigón Morillas, J.M.B.; González, D.M. Noise Estimation Using Road and Urban Features. Sustainability 2020, 12, 9217. [Google Scholar] [CrossRef]
- Wilson, K.; Pettit, C.H.L.; Ostashew, V.E. Sound propagation in the atmospheric boundary layer, Sounds Today. Spring 2015, 11, 44–53. [Google Scholar]
- Google Earth. Available online: http://www.earth.google.com (accessed on 12 September 2020).
- ISO. Description, Measurement and Assessment of Environmental Noise, Part 2: Determination of Environmental Noise Levels; International Organization for Standardization: Geneva, Switzerland, 2017. [Google Scholar]
- Solomon, D. Accidents on Main Rural Highways Related to Speed, Drivers and Vehicle; Bureau of Public Roads: Washington, DC, USA, 1964. [Google Scholar]
- World Health Organization. Environmental Noise Guidelines for the European Region; World Health Organization—Regional Office for Europe: Copenhagen, Denmark, 2018; Available online: https://www.euro.who.int/en/publications/abstracts/environmental-noise-guidelines-for-the-european-region-2018 (accessed on 14 September 2020).
- Van den Berghe, W. Road safety Thematic Report—Speeding; European Road Safety Observatory, European Commission, Directorate General for Transport: Brussels, Belgium, 2020; Available online: https://ec.europa.eu/transport/road_safety/sites/default/files/pdf/2020-10-08-road_safety_thematic_report_speed.pdf (accessed on 20 August 2021).
- Martin, J.L.; Wu, D. Pedestrian fatality and impact speed squared: Cloglog modeling from French national data. Traffic Inj. Prev. 2018, 19, 94–101. [Google Scholar] [CrossRef]
- Heutschi, K.; Favre A-Ch Thomann, G.; Wunderli, J.M.; Schrade, A.; Brink, M. La Limitation à 30 km/h Comme Mesure de Protection Contre le Bruit; Commission Fédérale pour la Lutte Contre le Bruit CFLB: Berne, Switzerland, 2015. [Google Scholar]
- Abhijith, K.V.; Kumar, P.; Gallagher, J.; McNabola, A.; Baldauf, R.; Pilla, F.; Broderick, B.; Di Sabatino, S.; Pulvirenti, B. Air pollution abatement performances of green infrastructure in open road and built-up street canyon environments—A review. Atmos. Environ. 2017, 162, 71–86. [Google Scholar] [CrossRef]
- Suchocka, M. Drzewo jako element zielonej infrastruktury. Probl. Ekol. Kraj. 2013, T.XXXVI, 85–94. [Google Scholar]
- Budziński, B.; Sołowczuk, A. Wpływ zagospodarowania terenu na klimat akustyczny na terenie MOP. Przegląd Komun. 2015, LXX, 6–10. Available online: http://www.przeglad.komunikacyjny.pwr.wroc.pl/06_2015/PK_06_15.pdf (accessed on 20 October 2015).
- Al-Dabbous, A.N.; Kumar, P. The influence of roadside vegetation barriers on airborne nanoparticles and pedestrians exposure under varying wind conditions. Atmos. Environ. 2014, 90, 113–124. [Google Scholar] [CrossRef] [Green Version]
- Brantley, H.L.; Hagler, G.S.W.; Deshmukh, P.J.; Baldauf, R.W. Field assessment of the effects of roadside vegetation on near-road black carbon and particulate matter. Sci. Total Environ. 2014, 468–469, 120–129. [Google Scholar] [CrossRef] [Green Version]
- Gromke, C.; Jamarkattel, N.; Ruck, B. Influence of roadside hedgerows on air quality in urban street canyons. Atmos. Environ. 2016, 139, 75–86. [Google Scholar] [CrossRef]


| Test Section | Average Speed, km/h | 85th Percentile Speed, km/h | Standard Deviation | Goodness-of-Fit K-S Test, λα = 1.36 |
|---|---|---|---|---|
| ca. 600 m long straight approach section | ||||
| Before treatment | 70.7 | 86.7 | 12.9 | 0.78 |
| No. A before narrowing | 58.2 | 70.7 | 12.5 | 0.42 |
| No. B before crossing | 57.8 | 70.4 | 10.2 | 0.36 |
| No. C after narrowing | 56.2 | 70.5 | 10.9 | 1.09 |
| No. B (additional measurements) | 51.2 | 56.9 | 5.4 | 1.01 |
| ca. 130 m long straight approach section | ||||
| Before treatment | 66.0 | 81.4 | 11.7 | 0.46 |
| No. D before narrowing | 52.2 | 59.0 | 7.7 | 0.50 |
| No. E before crossing | 56.7 | 62.7 | 7.5 | 0.66 |
| No. F after narrowings | 61.5 | 69.5 | 9.6 | 0.67 |
| No. E (additional measurements) | 51.9 | 54.6 | 4.1 | 0.38 |
| Test Section | Average Speed, km/h | 85% Percentile Speed, km/h | Reduction Speed | |
|---|---|---|---|---|
| ∆vav | ∆v85 | |||
| ca. 600 m long straight approach section | ||||
| Before treatment | 70.7 | 86.7 | 12.9 | 16.3 |
| No. B before crossing | 57.8 | 70.4 | ||
| Before treatment | 70.7 | 86.7 | 19.5 | 29.8 |
| No. B (additional measurements) | 51.2 | 56.9 | ||
| ca. 130 m long straight approach section | ||||
| Before treatment | 66.0 | 81.4 | 9.2 | 18.7 |
| No. E before crossing | 56.7 | 62.7 | ||
| Before treatment | 66.0 | 81.4 | 14.1 | 26.8 |
| No. E (additional measurements) | 51.9 | 54.6 | ||
| Test Section | Leq, dB(A) | Lmax, dB(A) |
|---|---|---|
| ca. 600 m long straight approach section | ||
| Before treatment before intersection | 63.1 | 80.7 |
| Before treatment after intersection | 62.8 | 72.8 |
| No. A before narrowing | 71.8 | 86.4 |
| No. B (before crossing) | 70.6 | 90.7 |
| No. C after narrowings | 72.4 | 86.7 |
| ca. 130 m long straight approach section | ||
| Before treatment before intersection | 63.1 | 79.3 |
| Before treatment after intersection | 63.6 | 76.3 |
| No. D before narrowing | 70.6 | 90.8 |
| No. E (before crossing) | 71.7 | 91.1 |
| No. F after narrowings | 74.0 | 100.3 |
Publisher’s Note: MDPI stays neutral with regard to jurisdictional claims in published maps and institutional affiliations. |
© 2021 by the authors. Licensee MDPI, Basel, Switzerland. This article is an open access article distributed under the terms and conditions of the Creative Commons Attribution (CC BY) license (https://creativecommons.org/licenses/by/4.0/).
Share and Cite
Sołowczuk, A.B.; Kacprzak, D. Effect of Lane Narrowing Implemented on an Urban Dual Carriageway on Speed Reduction and Acoustic Environment. Buildings 2022, 12, 31. https://doi.org/10.3390/buildings12010031
Sołowczuk AB, Kacprzak D. Effect of Lane Narrowing Implemented on an Urban Dual Carriageway on Speed Reduction and Acoustic Environment. Buildings. 2022; 12(1):31. https://doi.org/10.3390/buildings12010031
Chicago/Turabian StyleSołowczuk, Alicja Barbara, and Dominik Kacprzak. 2022. "Effect of Lane Narrowing Implemented on an Urban Dual Carriageway on Speed Reduction and Acoustic Environment" Buildings 12, no. 1: 31. https://doi.org/10.3390/buildings12010031
APA StyleSołowczuk, A. B., & Kacprzak, D. (2022). Effect of Lane Narrowing Implemented on an Urban Dual Carriageway on Speed Reduction and Acoustic Environment. Buildings, 12(1), 31. https://doi.org/10.3390/buildings12010031