Abstract
The welding of fine-grained steels is a very specific technology because of the requirement for the heat input limit value. Applying temperature cycles results in an intense grain growth in a high-temperature heat-affected zone (HAZ). This has a significant effect on the changing of strength properties and impact values. The intensity of grain coarsening in the HAZ can be predicted based on the experimentally determined activation energy and material constant, both of which define grain growth kinetics. These quantities, together with real measured welding cycles, can be subsequently used during experiments to determine mechanical properties in a high-temperature HAZ. This paper shows a methodical procedure leading to the obtainment of the material quantities mentioned above that define the grain growth, both at fast and slow temperature cycles. These data were used to define the exposure temperature and the soaking time in a vacuum furnace to prepare test samples with grain sizes corresponding to the high-temperature HAZ of welded joints for the testing procedures. Simultaneously, by means of the thermo-mechanical simulator Gleeble 3500, testing samples were prepared which, due to a temperature gradient, created conditions comparable to those in the HAZ. The experiments were both carried out with the possibility of free sample dilatation and under a condition of zero dilation, which happens when the thermal expansion of a material is compensated by plastic deformation. It has been found that shape of the temperature cycle, maximal achieved cycle temperature, cooling rate, and, particularly, the time in which the sample is in the austenite region have significant effects on the resulting change of properties.
1. Introduction
The effort to obtain steels with higher mechanical properties is also associated with attempts to reduce grain size, as the yield strength (the Hall-Petch equation) and other mechanical properties are dependent on grain size. In addition to other changes caused by welding processes, a change in grain size, especially in a high-temperature heat-affected zone (HAZ) area, is a very negative phenomenon. For thermomechanically processed steels, these phenomena are unfavorable and, unfortunately, irreversible. Considerable attention therefore needs to be paid to the issue of grain growth in the HAZ of welded joints. Grain size is important, not only for the material mechanical properties but also for the course of transformation processes. An austenitic transformation leads to longer times and increases the risk of martensite formation.
Changes in grain size occur during transformation processes, recrystallization processes, and long-term temperature exposures. The thermodynamic driving force of grain growth is the reduction of surface Gibbs free energy. Grain growth leads to a reduction in the grain boundary area and, thus, to a reduction in the amount of free energy. The change of grain size is related to changes in temperature and is also dependent on the proportional amount of the relevant phase. The following basic rules apply to grain growth [1]:
- Grain growth occurs by moving grain boundaries rather than coalescing.
- The motion of the grain boundary is interrupted, and the direction of motion may suddenly change.
- Grain can grow into another at the expense of its volume.
- Grain consumption rates at the expense of others are often increased when grains are almost consumed.
- The curved border usually migrates to its center of curvature.
- If the grain boundaries of one phase meet at angles other than 120° grains with an acute angle are consumed so that the angle approaches 120°.
The first models based on these physical foundations were developed in the early 1950s (Smith. 1952; Burke and Turnbul, 1952) [1]. However, there was a big difference between theoretically and experimentally determined values. In 1980, a new approach based on computer simulations was applied, and processes that were difficult to observe experimentally (such as the volume change rate of individual grains) could now be observed on the basis of simulation calculations. Several simulation methods have been developed over the years, with the “Monte Carlo Potts model” being the most used. A description of this method is given in [2,3]. The general relationship for grain growth is given by (1), and the constant K is expressed by (2) [4].
In Equations (1) and (2), D is the current grain size, D0 is the initial grain size, K is the proportionality constant that depends on the thermodynamic temperature T and the activation energy Q required for grain growth, R is a universal gas constant, t is a soaking time at a given temperature, and m is a material exponential coefficient.
It has been shown experimentally that the values of the coefficient m are in the range of 2–5. The value of m = 2 is valid if the grain growth process is exclusively controlled by diffusion. The value of m = 4 is used in the case of combination precipitation and diffusion along the grain boundary. As is shown below, other factors also affect grain growth [4,5].
As was already mentioned above, grain growth is dependent on the exposure temperature and the soaking time at this temperature, but it is also affected by other phenomena such as secondary precipitation. It has been found experimentally that the partial growth of grains already occurs after the transformation temperature has been reached. However, a noticeable grain growth in steels is only evident at temperatures above 900 °C [6,7]. At the same time, as temperature rises, grain growth rate increases, but there are a number of factors that slow down its growth kinetics. Most often, there is growth slowdown due to the presence of other particles that prevent the grain boundaries from moving. These are mainly very small oxides, sulfides, nitrides, carbides, or silicate particles [4]. These particles may already be present in the material, or they may precipitate along grain boundaries at the exposure temperature. Thanks to them, restoring forces (Zener drag forces) act against the grain growth direction and arise at the borders [4]. As a result, the grain size limit, for which the grain growth driving force is in balance with Zener drag forces, can be determined. This dimension is defined by Equation (3) as following [8]:
In Equation (3), Rcrit defines the grain size limit expressed as the critical grain radius, A is the material constant for a given steel type, r is the particle mean radius preventing grain motion, and f is the volume fraction of these particles. The influence of Zener forces on the fixation of grain boundaries can be observed, especially at lower temperatures when all particles preventing the motion of grain boundaries are present. At higher temperatures, these particles gradually dissolve, and the Zener drag forces decrease [8].
In his work, Górka described the influence of temperature cycles on the mechanical properties of the S700MC steel [9]. The maximum value of a temperature cycle was 1250 °C. An important conclusion of this work was the fact that, due to performed temperature cycles, all realized cooling conditions (t8/5—the time required to cool the sample from 800 to 500 °C for the given temperature cycle) revealed a significant decrease in the impact strength at the test temperature of −30 °C. In another publication [10], the same author studied the effect of a simulated temperature cycle on the properties and structure of the HAZ of S700MC 10 mm thick steel plates. The simulation was prepared for both a simple and complex temperature cycle. The heat treatment results were studied by a Charpy pendulum impact test, a static tensile test, a hardness measurement, and metallographic analysis.
An analysis of the results proved that the temperature cycles during welding strongly influence the structural and phase changes in a HAZ. A rapid decrease of toughness in the affected material is associated with the separation processes of MX-type phases and the dissolution of Nb carbides and V carbonitrides in austenite during heating. Checking the amount of heat input into the joint area during welding makes it possible to reduce the unfavorable precipitation processes in the weld and HAZ, which ensures adequate joint strength. Similar conclusions were made by Górka in his work [11].
In [12], Górka dealt with the assessment of the microstructure and properties of the S700MC heat-affected zone after heating to 1250 °C and cooling by specified cooling rates as following: t8/5 = 3, 5, 10, 15, 30, 60, and 120 s. The influence of temperature cycle parameters was evaluated by a metallographic analysis, a hardness evaluation, a Charpy impact test, and a static tensile test. It was determined that for all t8/5 values, the impact strength values were very low, and the austenite transformation conditions were not a reliable basis to evaluate the weldability of this group of steels. Similar results were provided by study [13], where the author focused on the evaluation of S700MC weldability by various welding methods. Lahtinen et al. [14] dealt with the weldability of 8 mm sheets from two types of high-strength fine-grained steels—namely, S700MC and S690QL. Two-layer welded joints made by MAG technology with four different heat input values from 0.7 to 1.4 kJ·mm−1, which corresponded to values t8/5 = 5, 10, 15, and 20 s. Tests carried out on all materials included the determination of ultimate tensile strength, hardness profiles (HV5), Charpy impact tests, and microstructure analysis by scanning electron microscopy (SEM). The most notable differences in the mechanical properties of welded joints among tested materials were observed in Charpy impact tests, mostly close to the melting boundary, whereas the heat-treated steel was more vulnerable to heat affected zone (HAZ) embrittlement than TMCP steel. Rahman et al., in their work [15], dealt with S700MC-steel austenite-grain-size, which has a direct influence on the course of austenite transformation during cooling. They described a model of non-isothermal grain growth which includes the influence of the Zener effect. The study confirmed that the grain growth kinetics of a HAZ strongly depend on precipitates dissolution kinetics.
Numerical simulations have provided a significant contribution to the optimization of welding conditions. Kik et al. [16] dealt with the application of simulation computations for a T-weld made by laser and hybrid methods for sheets of 10 mm thickness. The simulation program SYSWELD was used in these computations, and possibilities of its application are now presented.
The SYSWELD simulation program is based on Equations (1) and (2), and computations are based on Equation (4), this expressing the grain growth rate.
This computational relationship is intended for cases where the amount of austenite in the structure is constant or decreases. In cases where the austenite content of the structure increases, two situations may arise:
- The size of existing grains increases;
- there is the formation of new grains with an initial zero size or with a much smaller initial size than the existing grains in the structure.
In the second case, the grain size computation is carried out in accordance with Equation (5). In Equation (5), the λ value expresses the current ratio of austenite in the structure and the λ value of the transformation rate of this phase. In cases where austenite is no longer formed (λ ≤ 0), Equation (4) is applied [17].
For the purpose of simulation computations, input data are necessary to predict the finite states of the structure and properties in the welded joint area. Therefore, it is not necessary to determine and describe all phenomena and processes during individual temperature cycles. However, it is necessary to obtain data for the prediction of finite states on the basis of realized experiments. This is also the background for the method for determining HAZ grain size values for S700MC steel.
2. Materials and Methods
2.1. Experimental S700MC Material
S700MC steel is one of the fine-grained high-strength steels. It is a thermomechanically rolled steel with a minimum guaranteed yield strength of 700 MPa, a low carbon content, an increased manganese content, and a reduced sulfur content. It is designed for cold forming, can be welded, and is micro-alloyed by Al, Ti, Nb, and V, where the sum of Nb, V, and Ti should not exceed 0.22 wt%. Micro-alloying, together with thermomechanical processing, leads to grain refinement and thus to increasing strength and toughness. S700MC steel is used for statically and dynamically stressed structures, especially in the field of transport. It can be used in the manufacture of axles and the undercarriage frames of cars and trucks, sub-assemblies of cranes, and possibly also mining machines. The reason for its use is to reduce weight while maintaining sufficient strength properties.
The steel tested in this work was delivered in the form of a 10 mm sheet. It has a ferritic-bainitic structure (Figure 1, left) and its grain size was measured by electron backscatter diffraction (EBSD) analysis (Figure 1, right). The resulting mean grain size of the supplied material was 3.35 µm. The chemical composition of the S700MC steel found by a Q4 Tasman spectrometer is shown in Table 1. The EN 10149-2 standard specifies a minimum allowable yield strength of Re = 700 MPa for S700MC steel, a tensile strength Rm in the range of 750–950 MPa, and a ductility greater than 12%.

Figure 1.
Ferritic-bainitic structure (left) and EBSD grain size analysis (right) of tested S700MC steel.

Table 1.
Chemical composition (wt%) of the S700MC steel.
2.2. Methodological Procedure and Experimental Determination of Activation Energy Q Values and Kinetic Constant of Grain Growth K
For the prediction of grain coarsening intensity during welding, it is necessary to start from Equations (1) and (2). For this, however, it is necessary to determine the value of the proportionality constant K as well as the value of the activation energy Q needed to determine the total exponential constant K0. Both of these values are temperature dependent and can be experimentally determined from samples exposed to at least two different temperatures and at least three different soaking times at these temperatures. Nevertheless, only a very approximate activation energy value of Q can be obtained by this method. It is more accurate to use at least 9, but preferably 12, samples exposed to heat under different conditions [6].
To determine the Q and K values, S700MC steel samples were subjected to a set of temperature-loadings as following: Exposure temperatures of 900, 1000, 1100, and 1200 °C; and soaking times of 0.5, 2, 4, and 8 h. Samples of 12 × 12 × 20 mm3 were exposed to temperatures in a Reetz vacuum furnace at a pressure about 6 × 10⁻⁴ Pa. Both the heating and cooling rate were 7 °C∙min−1. The reason for using the vacuum furnace was to prevent surface oxidation and the possible contamination of the sample by the diffusion of gases from the surrounding atmosphere.
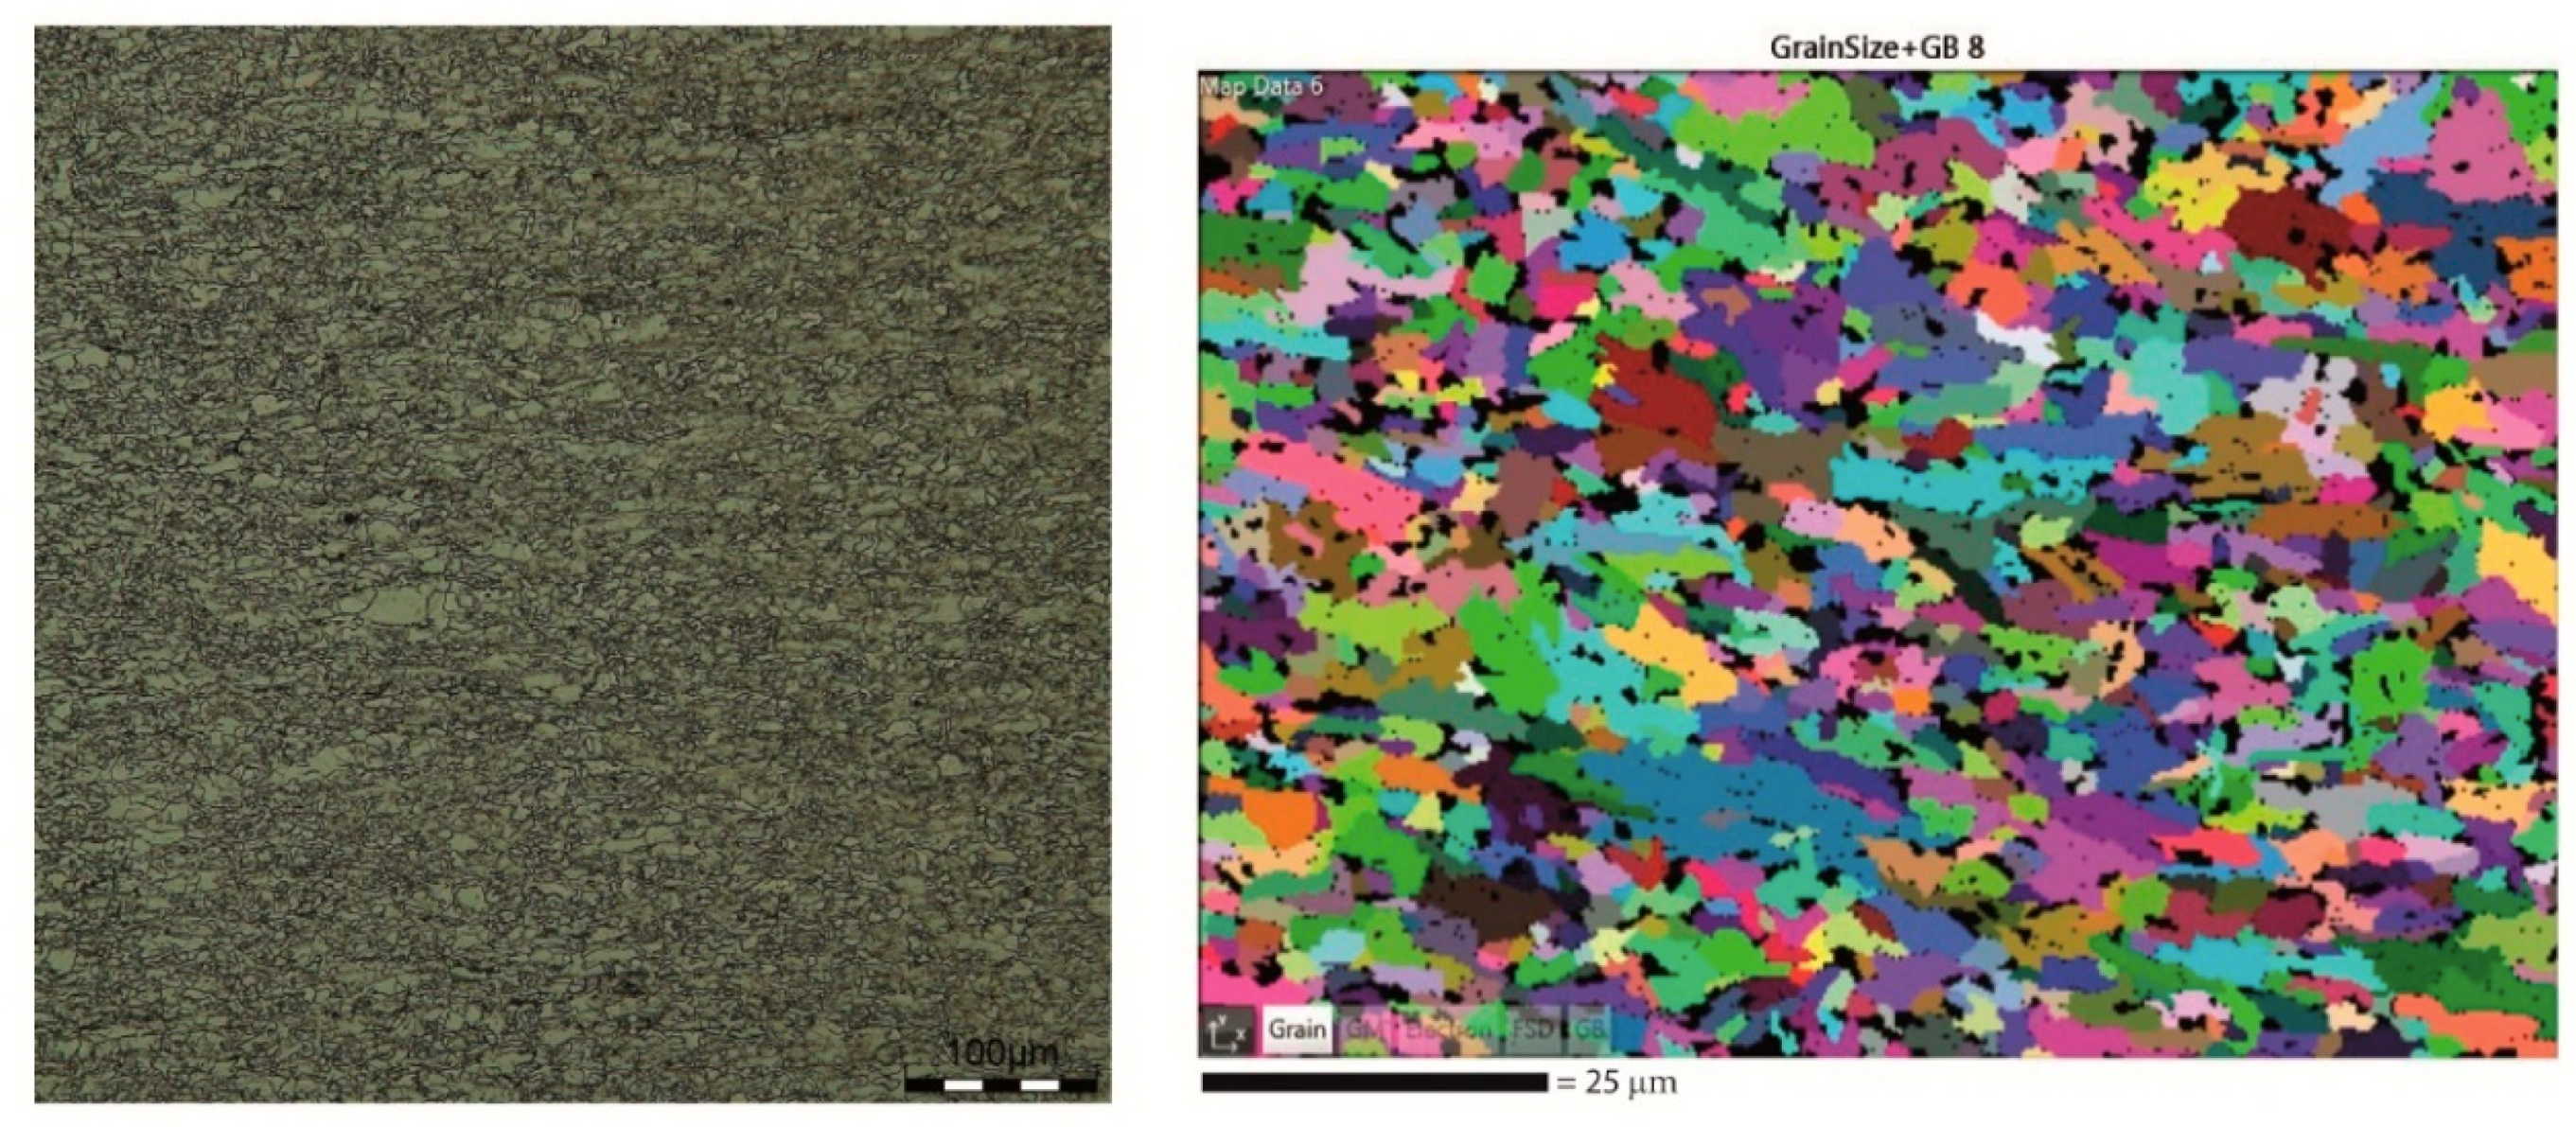
After temperature exposure, the samples were cut in the middle and metallographically prepared for EBSD analysis to evaluate their grain size with an electron microscope (HV 30 kV; beam intensity 18; WD 12.9 mm). A total of 3 areas of 450 × 450 µm2 were scanned on each sample. Figure 2 show the results of EBSD analysis on samples with temperatures of 900, 1000, 1100, and 1200 °C and a soaking time of 2 h. The mean grain size in µm (determined as the average from three measured areas) is given in Table 2 for all types of samples.
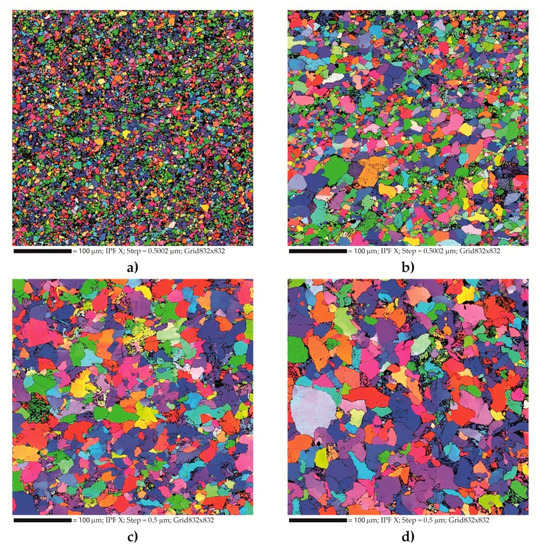
Figure 2.
Results of EBSD analysis of grain size determination after 2 h at exposure temperature: (a) 900 °C; (b) 1000 °C; (c) 1100 °C; and (d) 1200 °C.
Table 2.
EBSD grain size analysis results expressed as mean grain size (µm) for the indicated exposure temperatures and soaking times on these temperatures.
Based upon the data in Table 2, it is already possible to determine the activation energy for the grain growth Q of the S700MC steel. However, in the first phase, the partial exponential constants KT characteristic for each of the exposure temperatures and the initial grain size values D0 corresponding to individual temperatures at a soaking time of t = 0 s must be determined first. The initial grain size D0 should approximately correspond to the HAZ grain coarsening values when applying a welding cycle, with a maximum that corresponds to the exposure temperature.
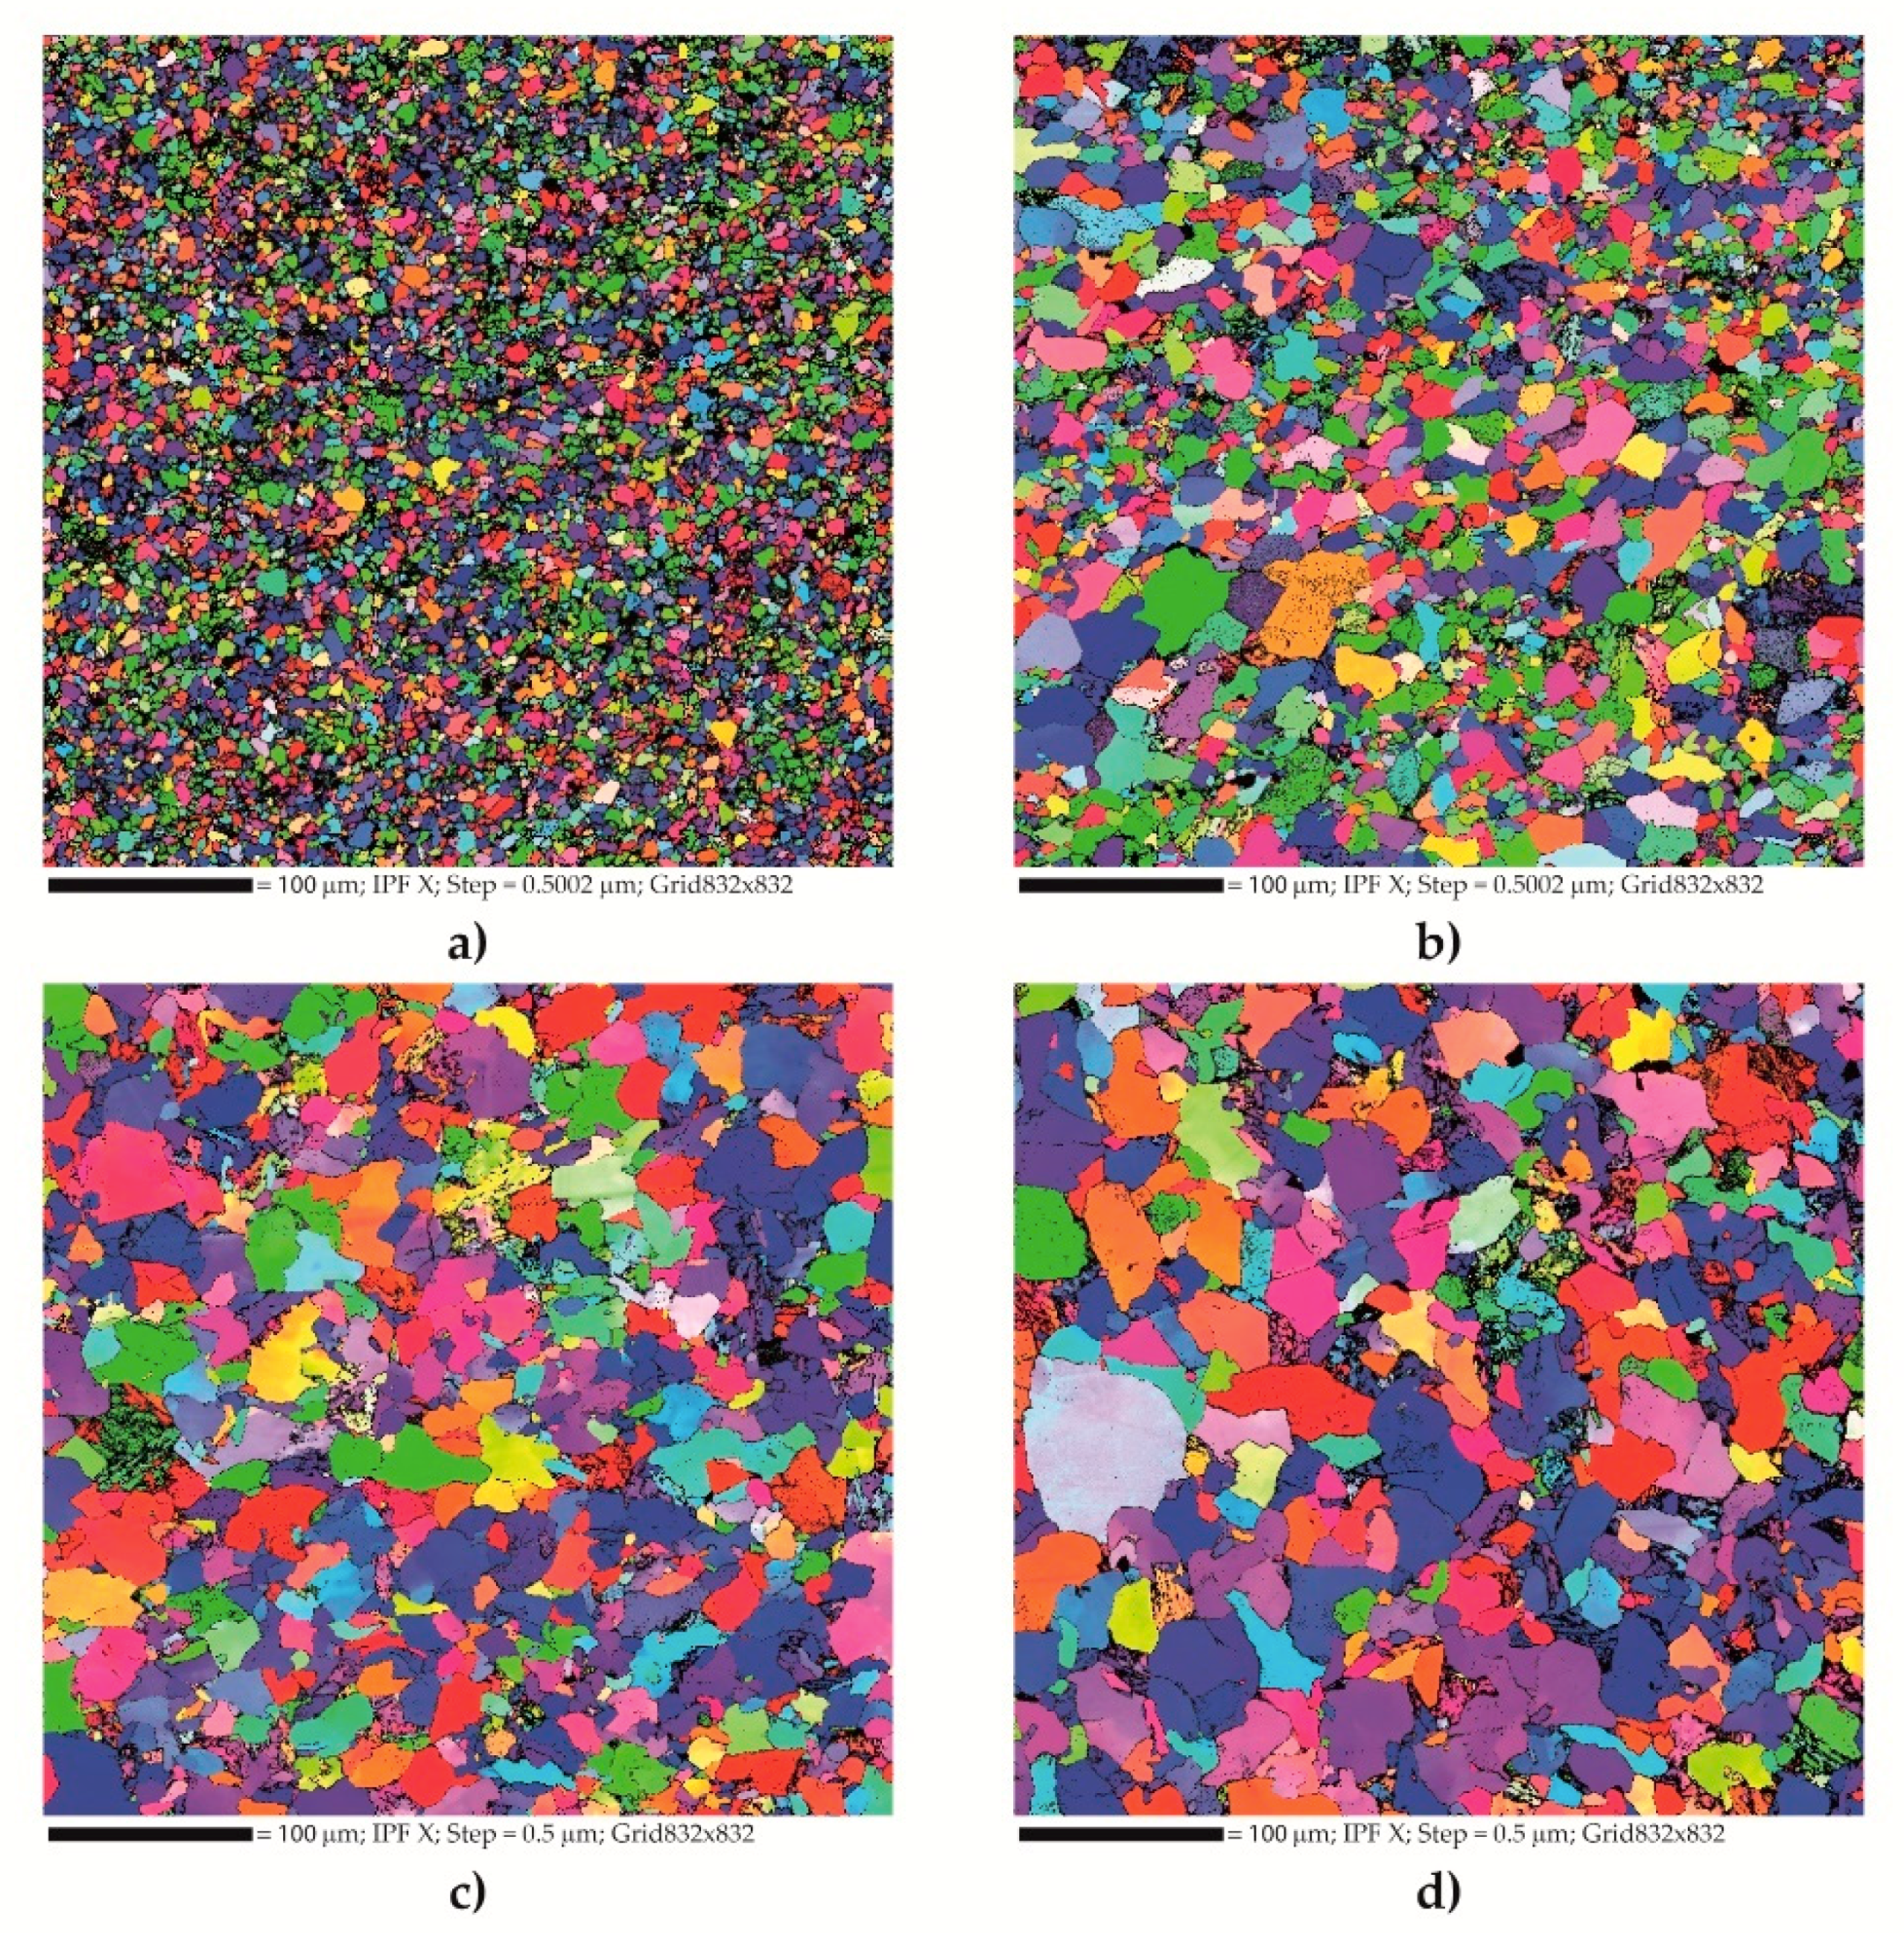
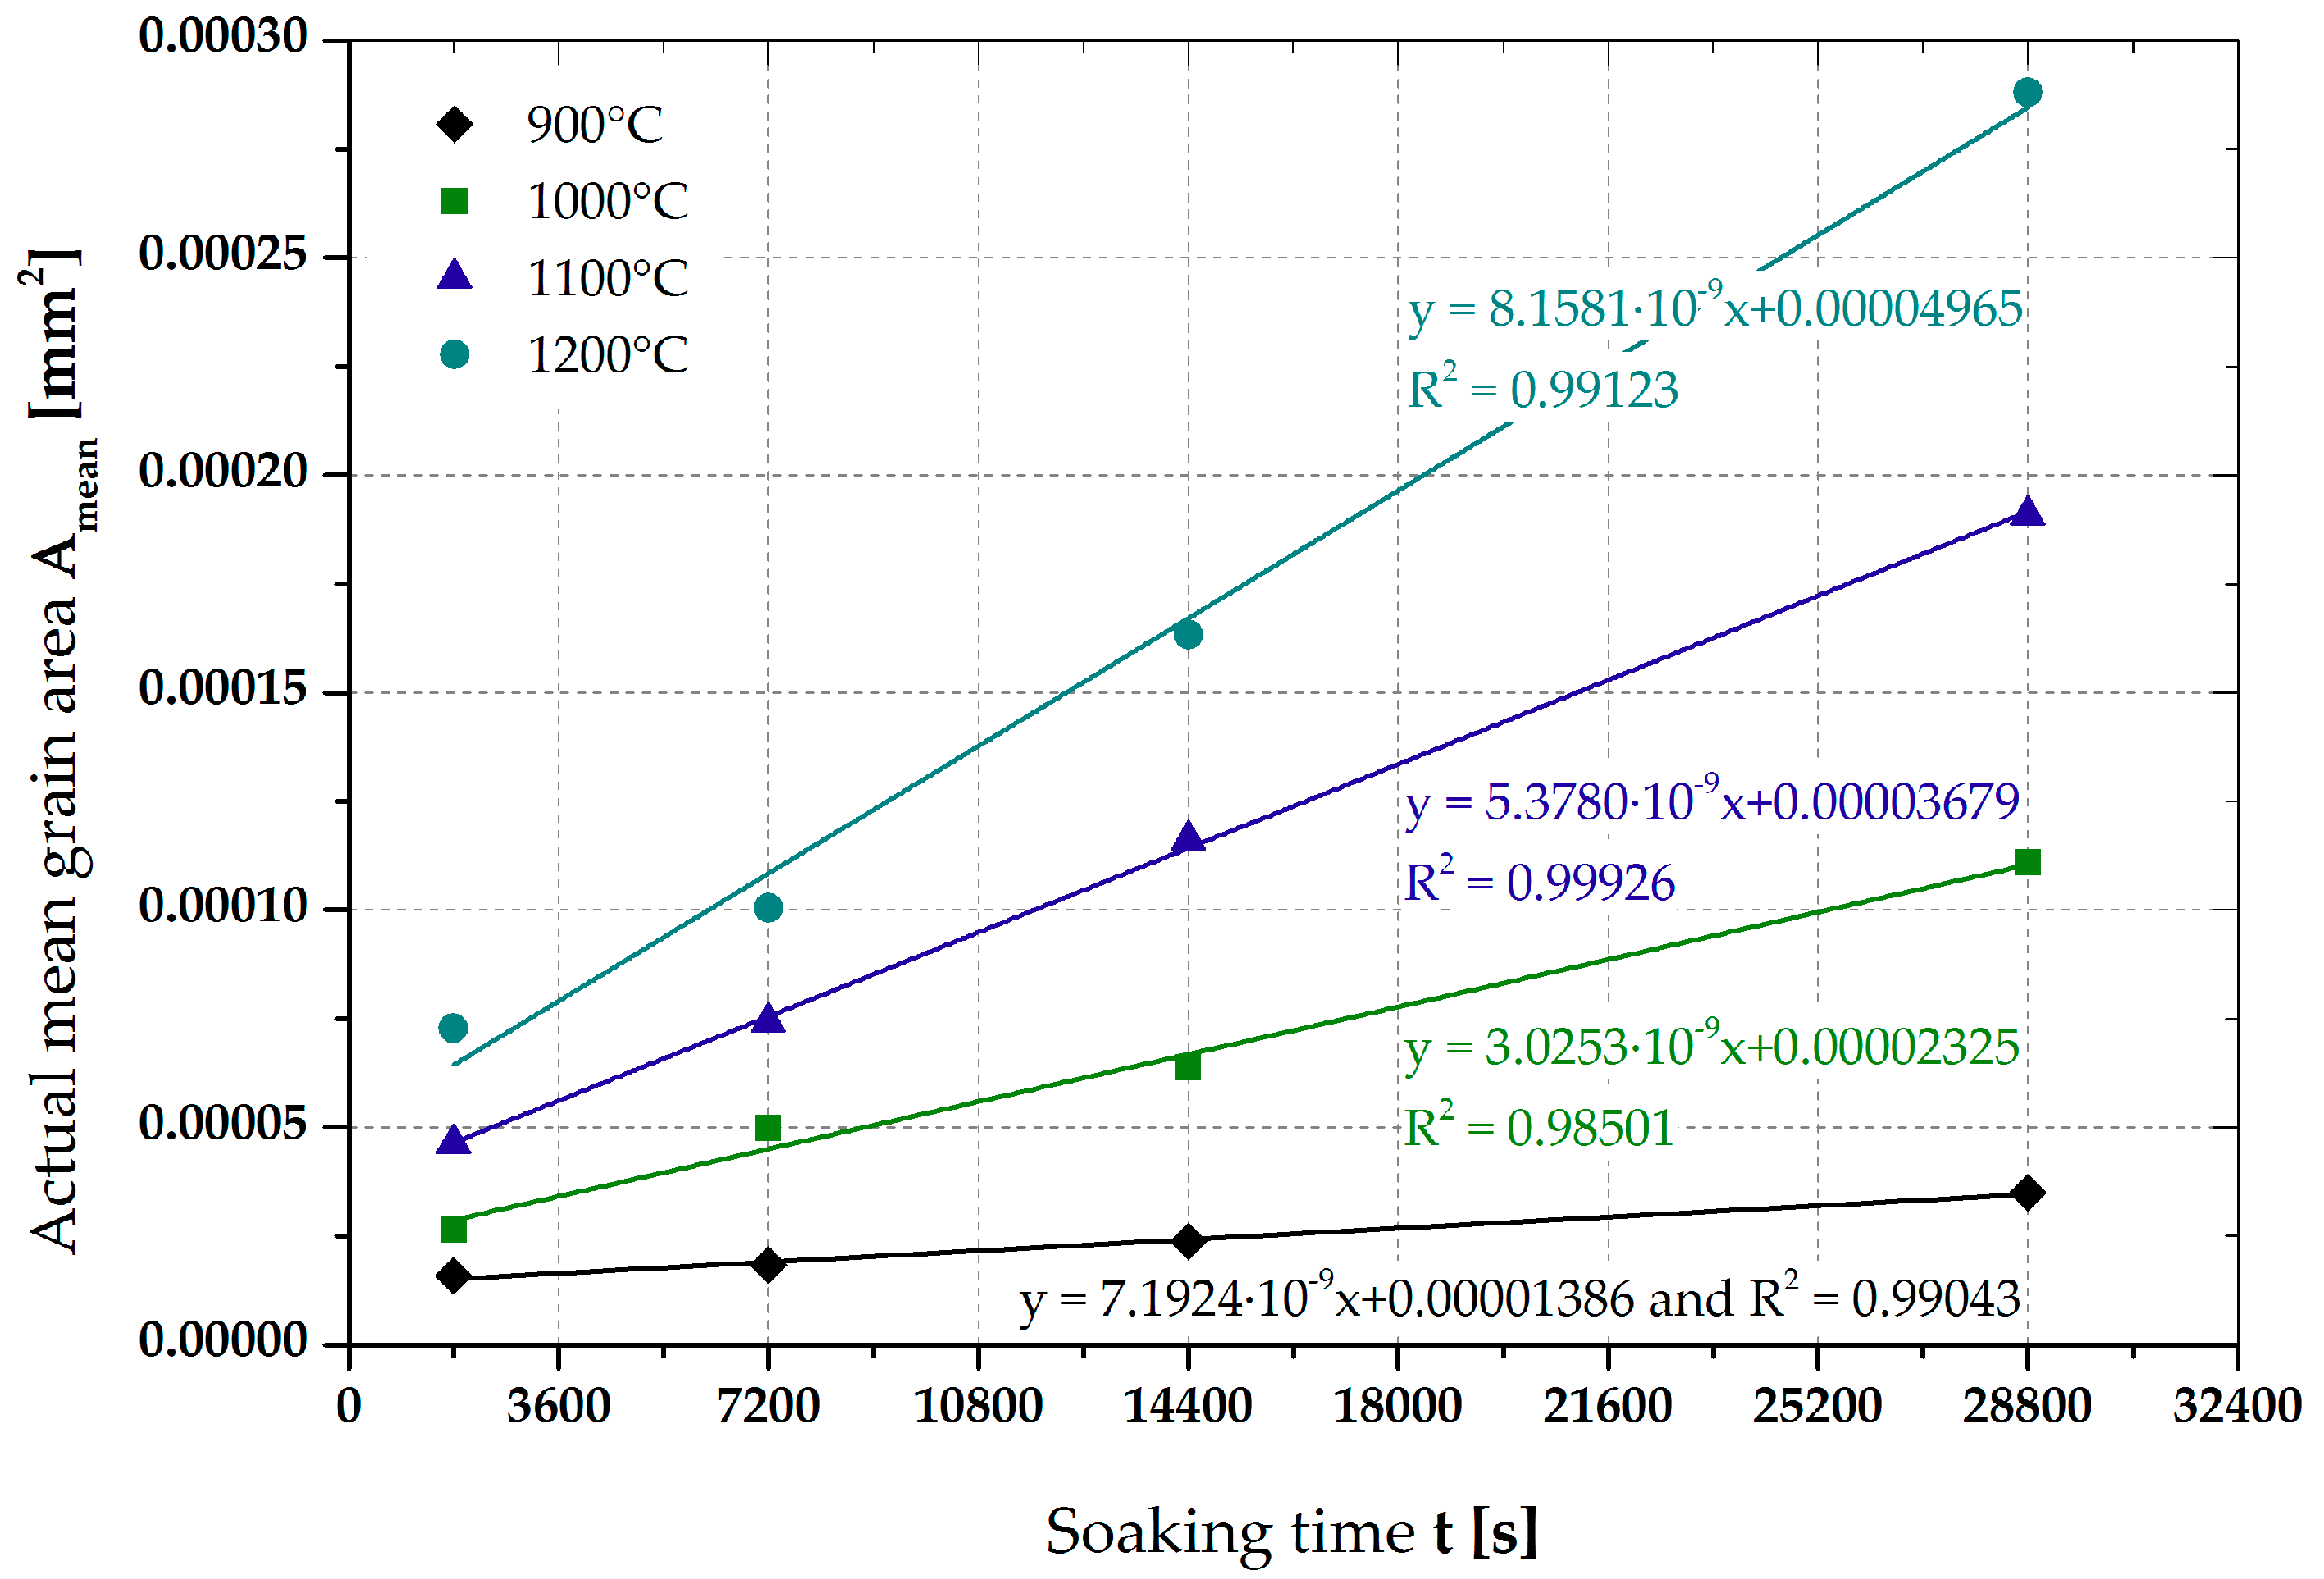
The way to obtain values D0 and KT is shown in Figure 3. The graph shows, for the individual temperatures of the experiment, the average mean values of grain size (Table 2) obtained experimentally or, more precisely, their second squares representing the mean grain areas. Each of the exposure temperatures in the graph is expressed by a trend line and its equation. From the slope of the trend line, it is then possible to deduct the value of each partial exponential constant KT as well as the initial grain size D0.
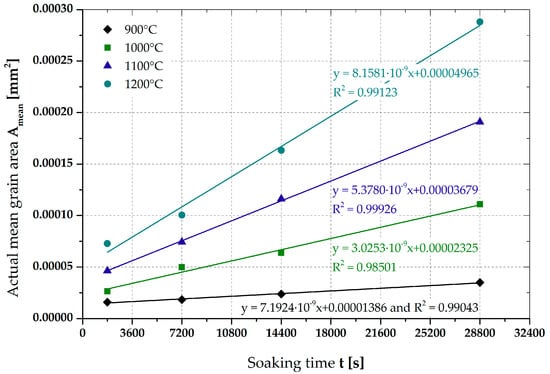
Figure 3.
Actual mean grain area for S700MC steel vs. soaking time at temperatures of 900 °C, 1000 °C, 1100 °C, and 1200 °C (according to ISO 643).
Table 3. shows the values of the determined partial exponential constant KT and the initial grain size D0.
Table 3.
Values of partial exponential constants KT and initial grain size D0 for a given temperature.
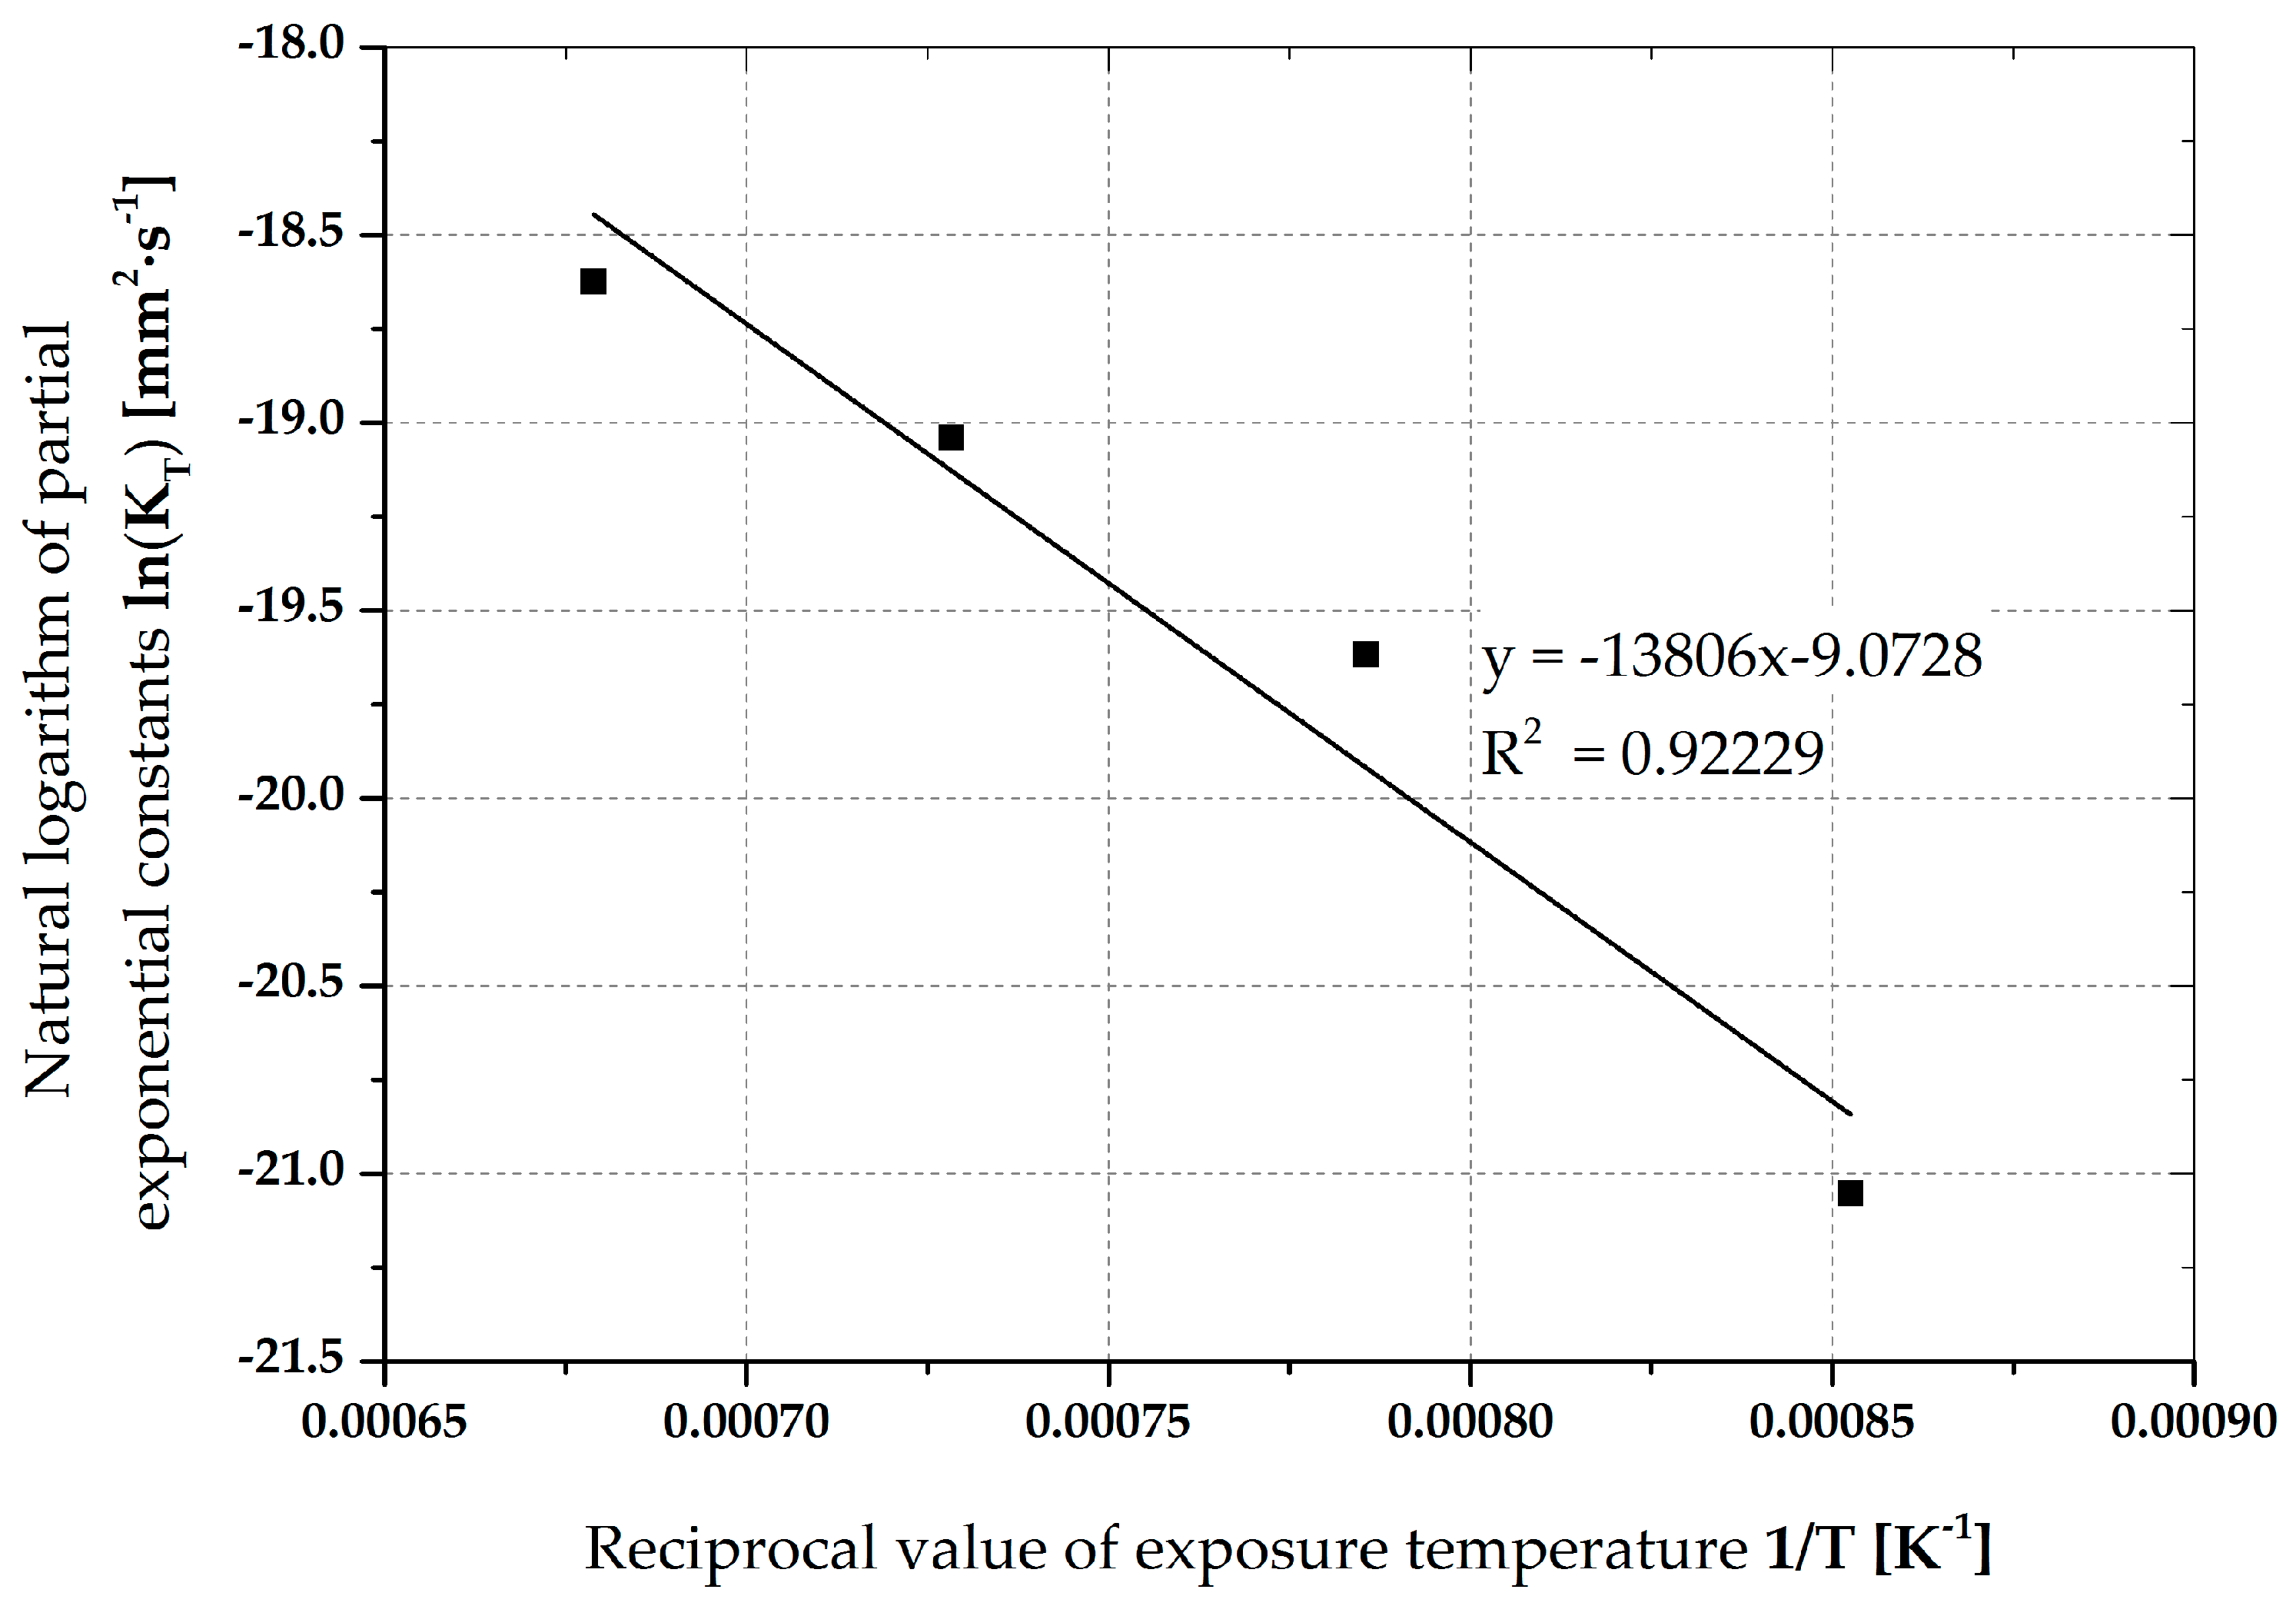
The method of determining the grain growth activation energy Q as well as the total exponential constant K0 is apparent from Figure 4. The graph shows the values of the natural logarithm for determined partial exponential constants KT in dependence on the reciprocal values of exposure temperatures expressed in kelvin [T−1]. As a result, a trend line can be created, and its equation is expressed in the following format (6).
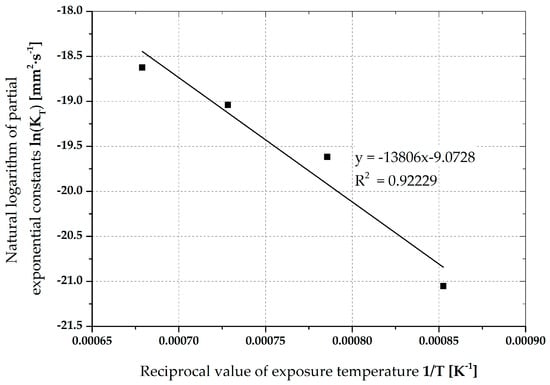
Figure 4.
Determination the total exponential constant K0 and the grain growth activation energy Q.
The constant C in Equation (6) defines the slope of trend line and, together with the universal gas constant R, is used to calculate the value of activation energy Q in accordance with Equation (7). The constant B in Equation (6) is then used to calculate the total exponential constant K0, in accordance with Equation (8).
Using the trend line data (Figure 4) and Equations (7) and (8), the activation energy of grain growth Q = 264.02 kJ·mol−1 and proportionality constants K0 = 11.47 × 10⁻⁵ (mm2·s−1) were obtained for the S700MC steel. Using these variables, the temperature dependence of the proportionality constant K, also known as the grain growth kinetics curve, can be defined in accordance with Equation (2). Table 4 shows the computed values of the proportionality constant K for a temperature range of 20–1500 °C. The data can be used as input data for numerical simulations of grain growth in any computational program. They can also be used for the simplified prediction of a grain growth rate made manually based on the knowledge of a real welding cycle.
Table 4.
Computed proportional constant values K defining grain growth kinetics for S700MC steel.
2.3. Welding Experiments
To obtain the real temperature welding cycles and to assess the effect of grain coarsening in a HAZ on the change of strength and brittle-fracture properties, welding experiments (according to ISO 4063-135) were performed for S700MC steel. A joint was designed as a double-sided fillet weld on 10 mm thick plates. Welding was done by means of linear automatic machine with a BDH Puls Syn 550 power source in a synergistic mode with an adjusted current of 315 A and a welding speed of 0.5 m·min−1. All process parameters were monitored by Weld Monitor with a 25 kHz recording frequency. The following actual welding parameters were obtained by means of monitoring: The effective current Ief = 353.2 A, the effective arc voltage Uef = 29.7 V, the welding speed vs = 0.503 m·min−1, the wire feed speed vd = 10.03 m·min−1, and the gas flow of 15 dm3·min−1. A Boehler UNION NiMoCr with a diameter of 1.2 mm was used as filler material, and the mixed gas M21 was used as a shielding gas, according to ISO 14175.
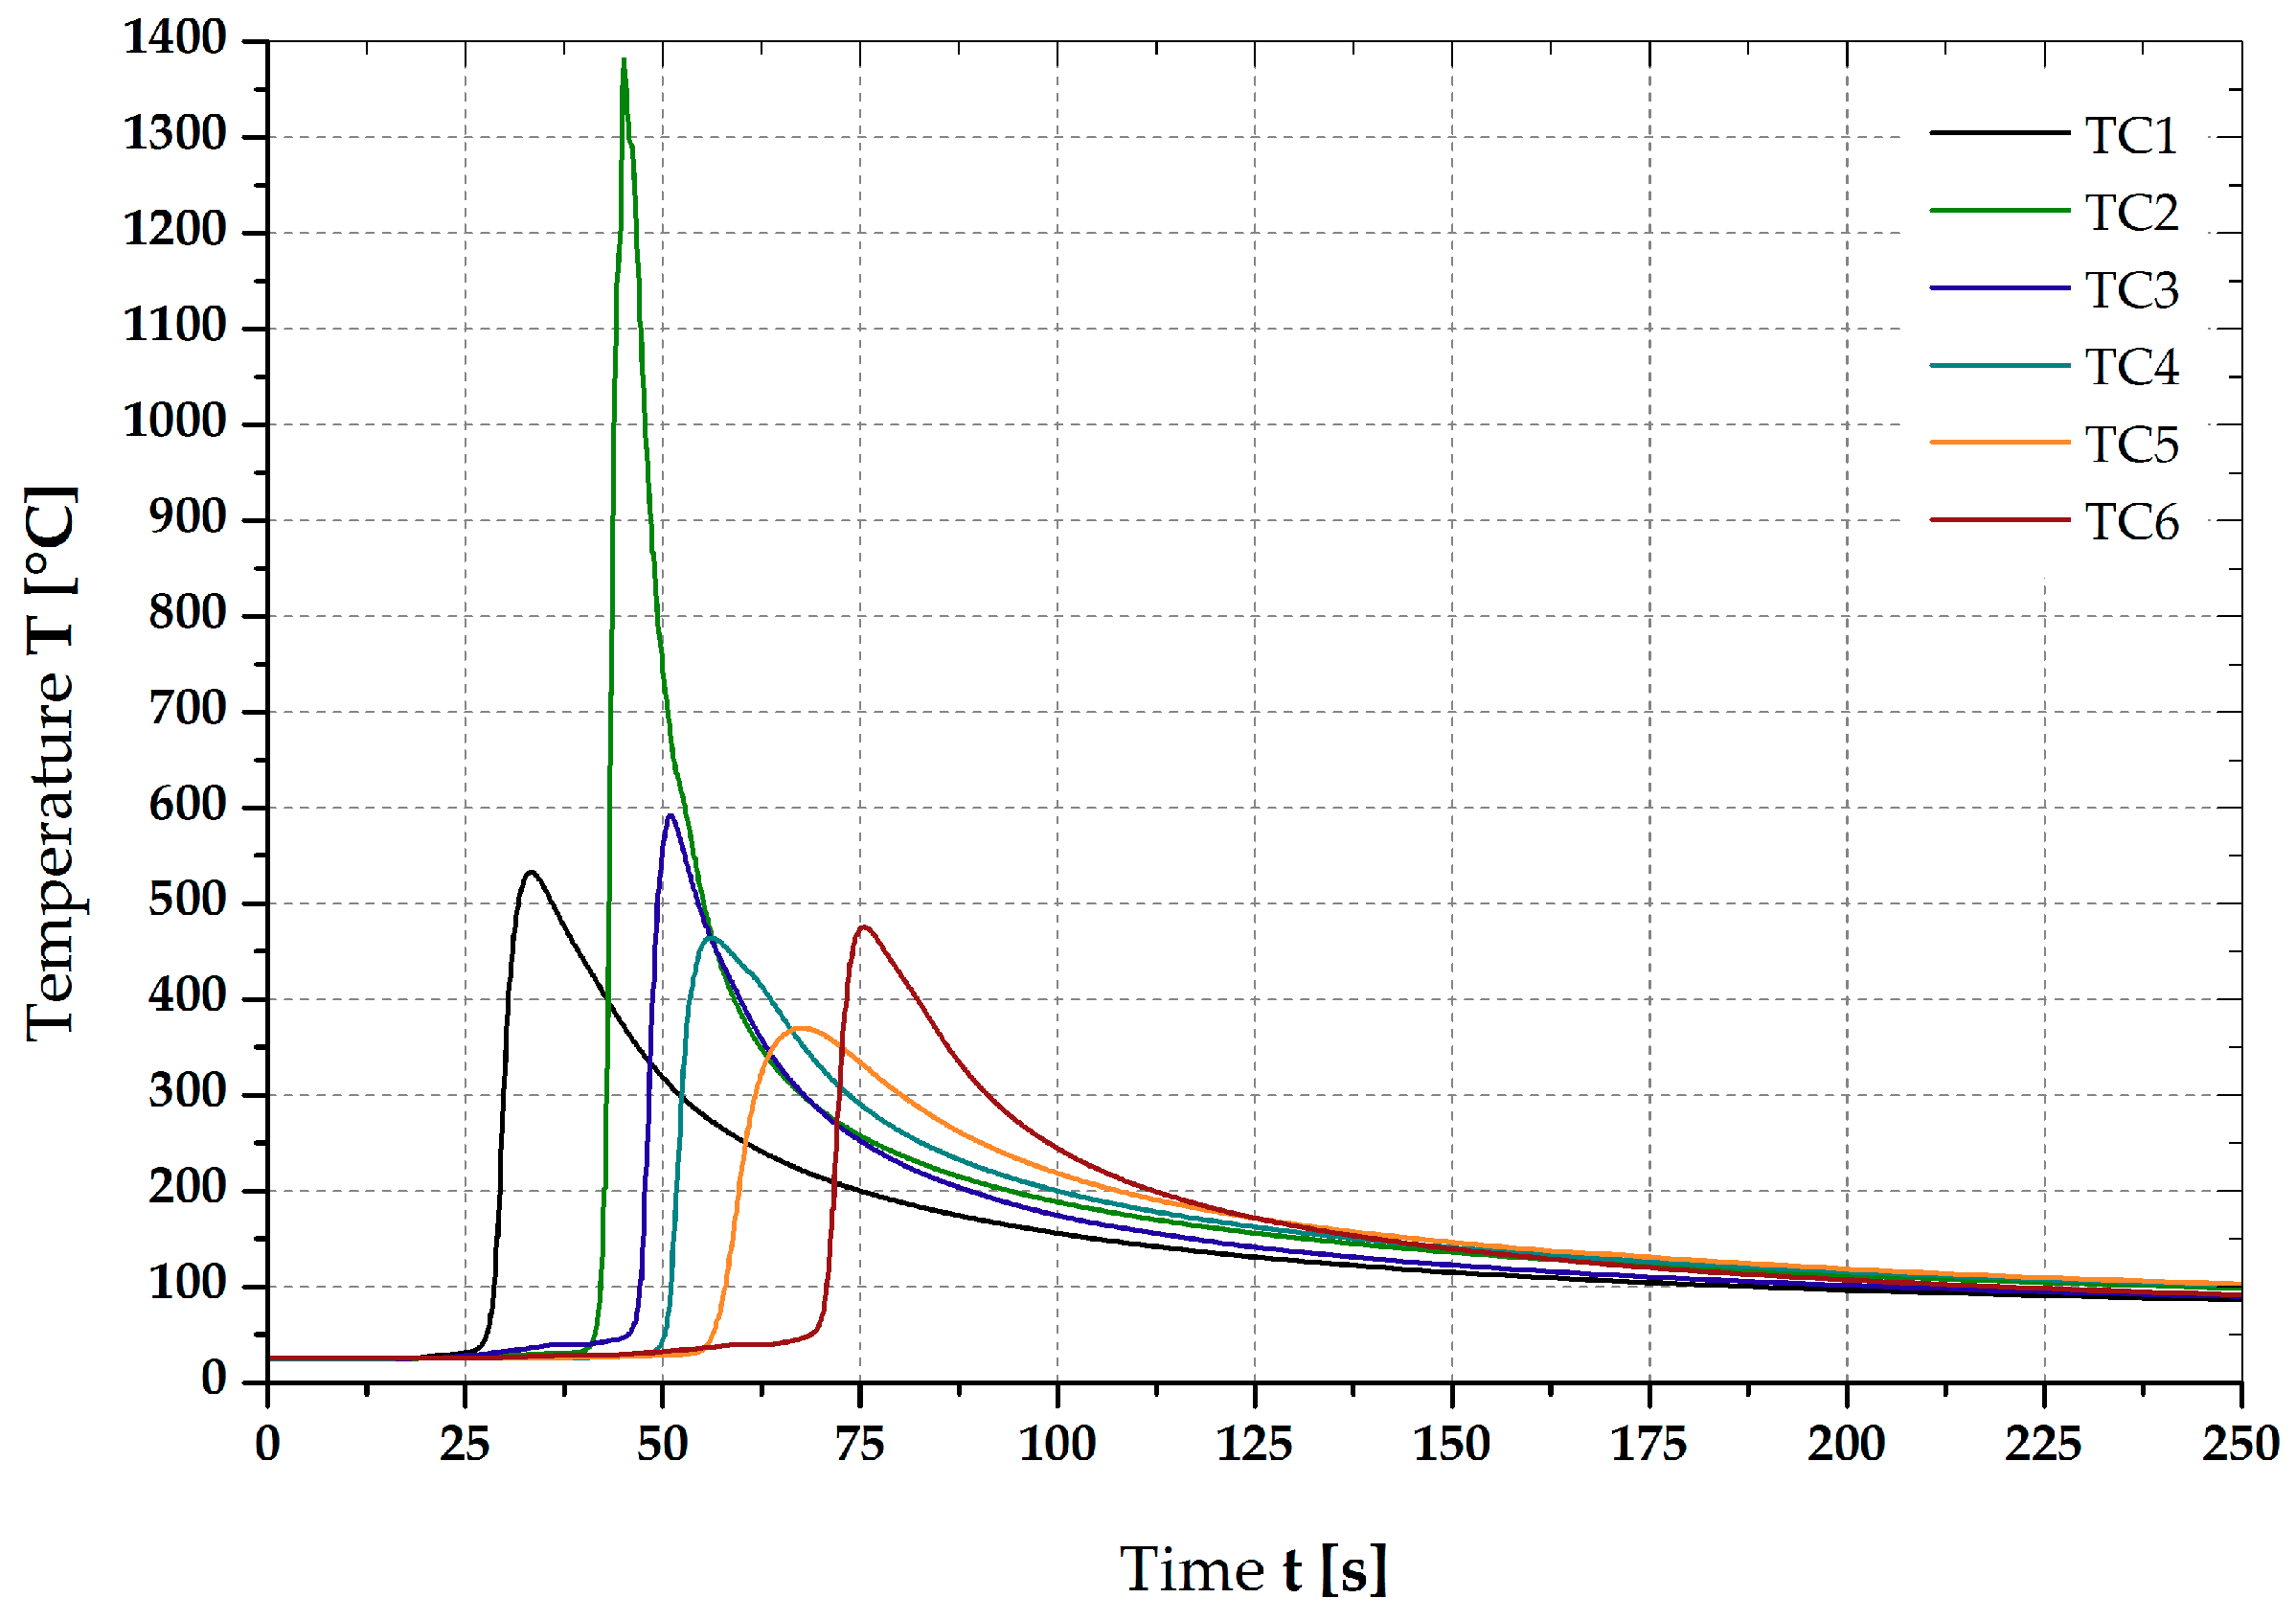
During the welding process, temperature cycles in the HAZ were recorded by the DiagWeld system. This is a special device developed on TUL that allows for temperature recording by various types of thermocouples with a recording frequency of up to 100 Hz (depending on the number of thermocouples). The device has a galvanically isolated control panel, thus eliminating the influence of magnetic fields and high voltages during the welding and high-frequency heating of a material. The thermocouples were condenser welded into 4 mm diameter holes drilled into the weld flange at different distances from the material surface and, thus, at different distances from the fusion boundary. In total, 6 thermocouples of the S-type (90%Pt/10%Rh–Pt) were used. The temperature cycles obtained are shown in Figure 5. The only thermocouple TC2 (located 0.2 mm from the fusion boundary) measured a temperature cycle with a maximum temperature of 1383 °C—a temperature that was already part of the high-temperature HAZ area. This temperature cycle was then used bothto predict grain coarsening results in the HAZ by using the experimentally measured proportionality constant K and to apply these results to the thermal-mechanical simulator Gleeble 3500; this cycle was also used to prepare test specimens to determine mechanical properties and KV2 in the HAZ area of the tested fillet weld joint of S700MC steel.

Figure 5.
Thermal cycles obtained during welding of a S700MC steel fillet weld joint.
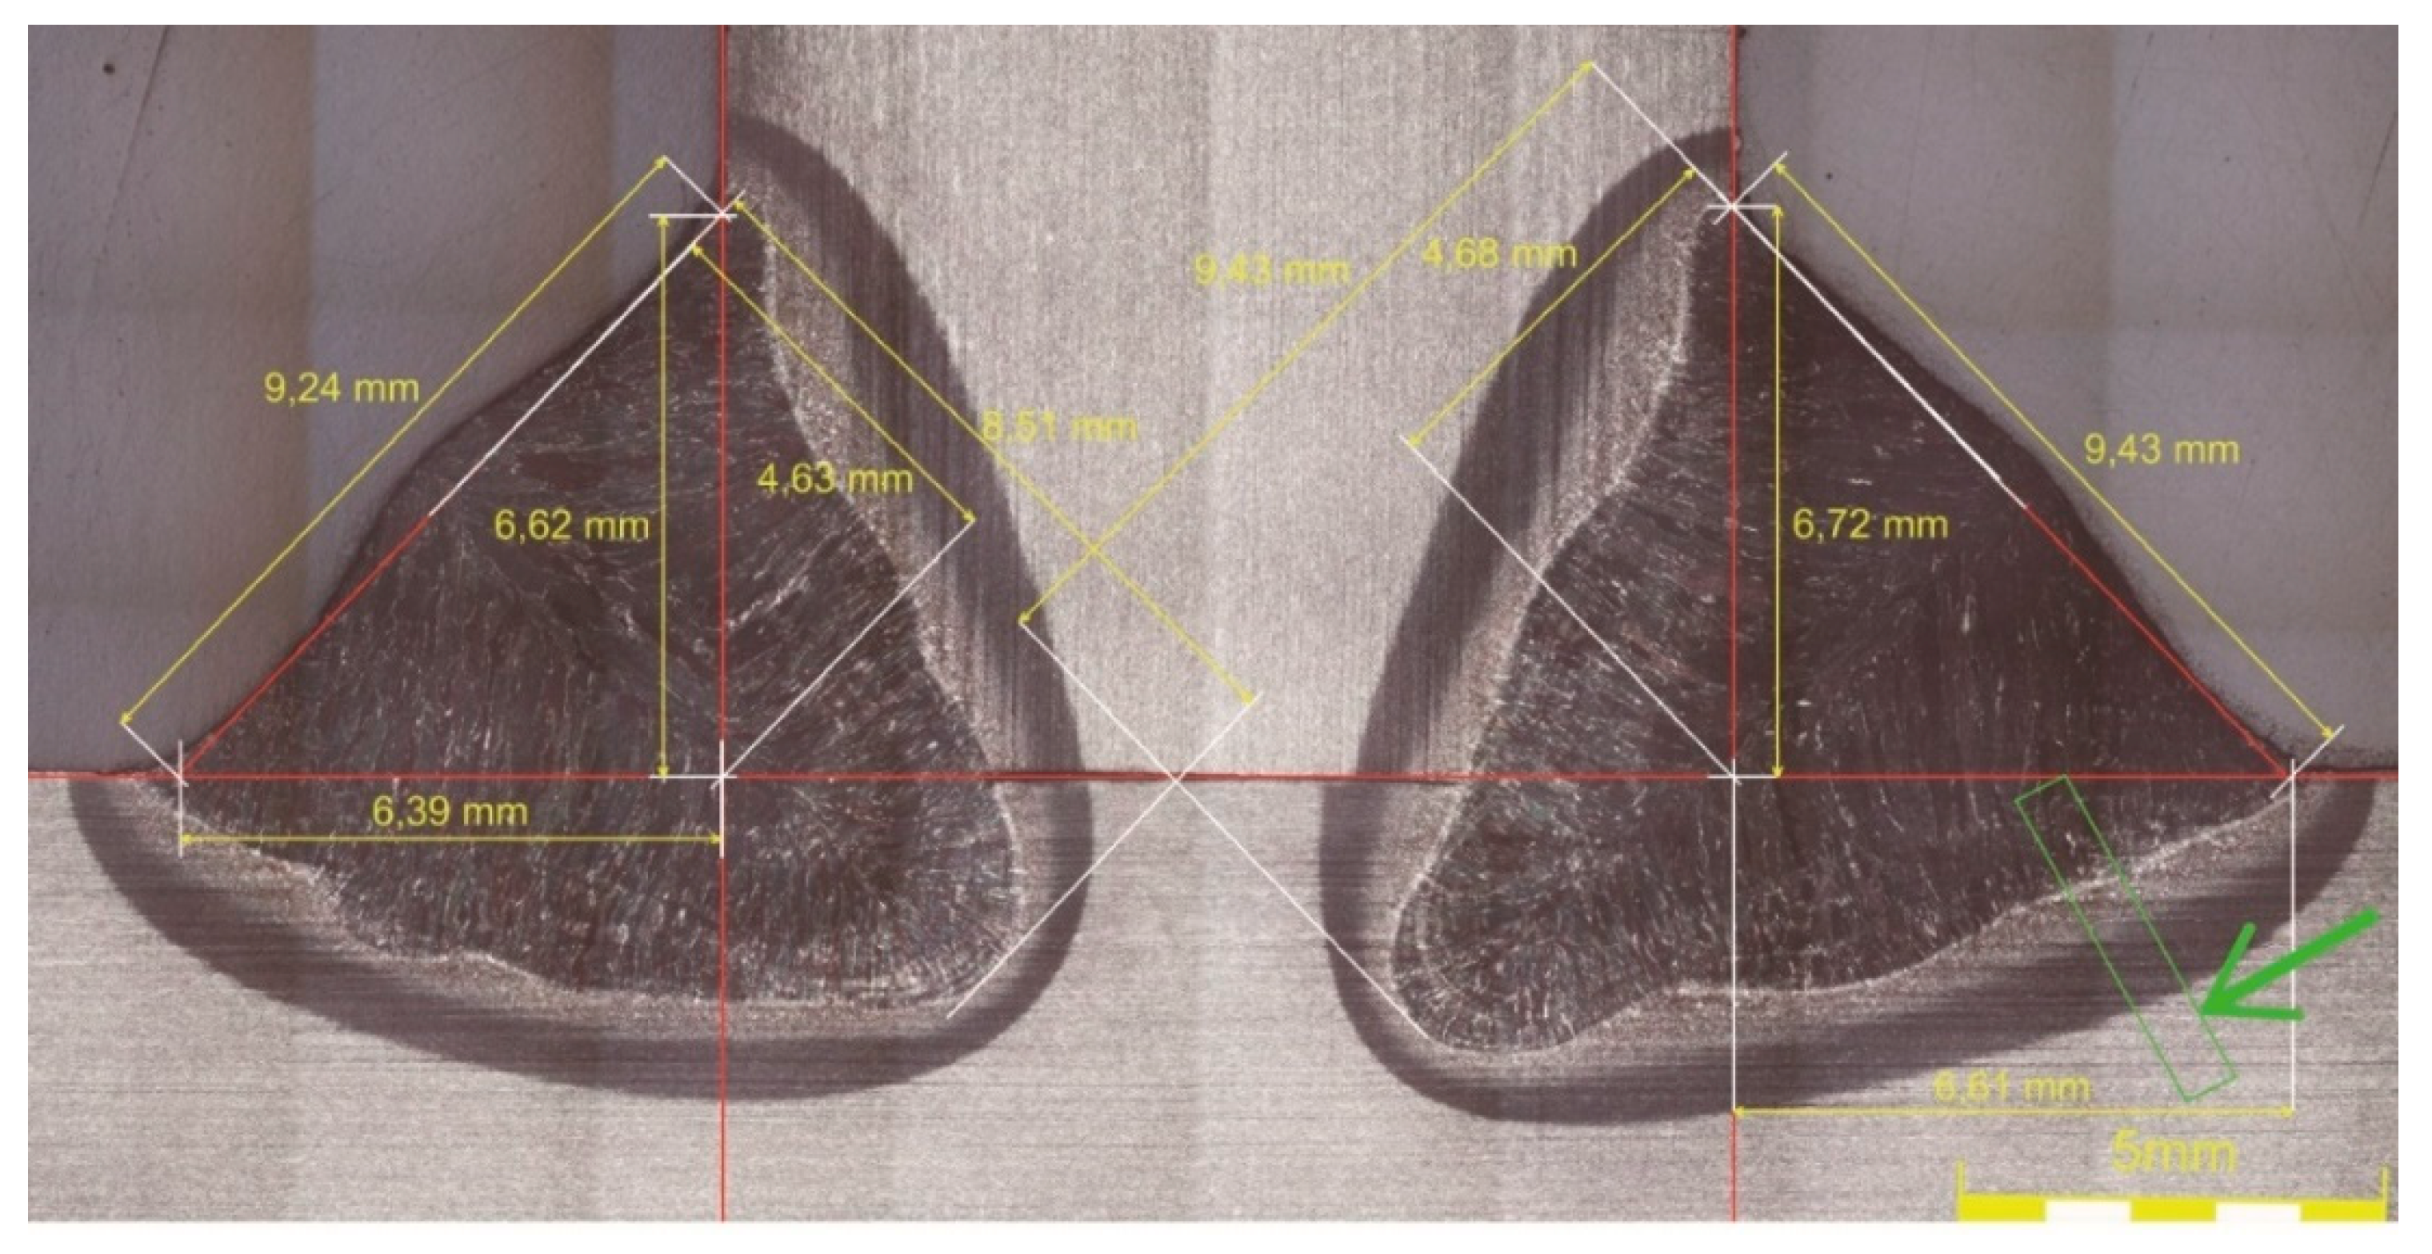
Figure 6 shows a metallographic scratch pattern, including the basic geometric evaluation of the individual runs. An EBSD analysis was performed on the weld on the Run 1 to determine the grain size during the transition from the weld through the HAZ to the parent material. In the EBSD analysis, a total area of 0.6 × 4 mm2 was scanned, and this is shown in Figure 6 by a green rectangle and a green arrow. A detail of the grain coarsening in the high-temperature HAZ is shown in Figure 7.
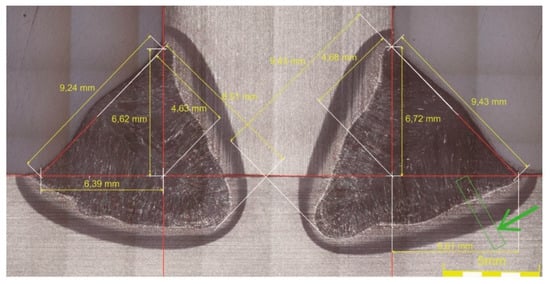
Figure 6.
Geometrical evaluation of the weld and the grain size measurement area (green rectangle).

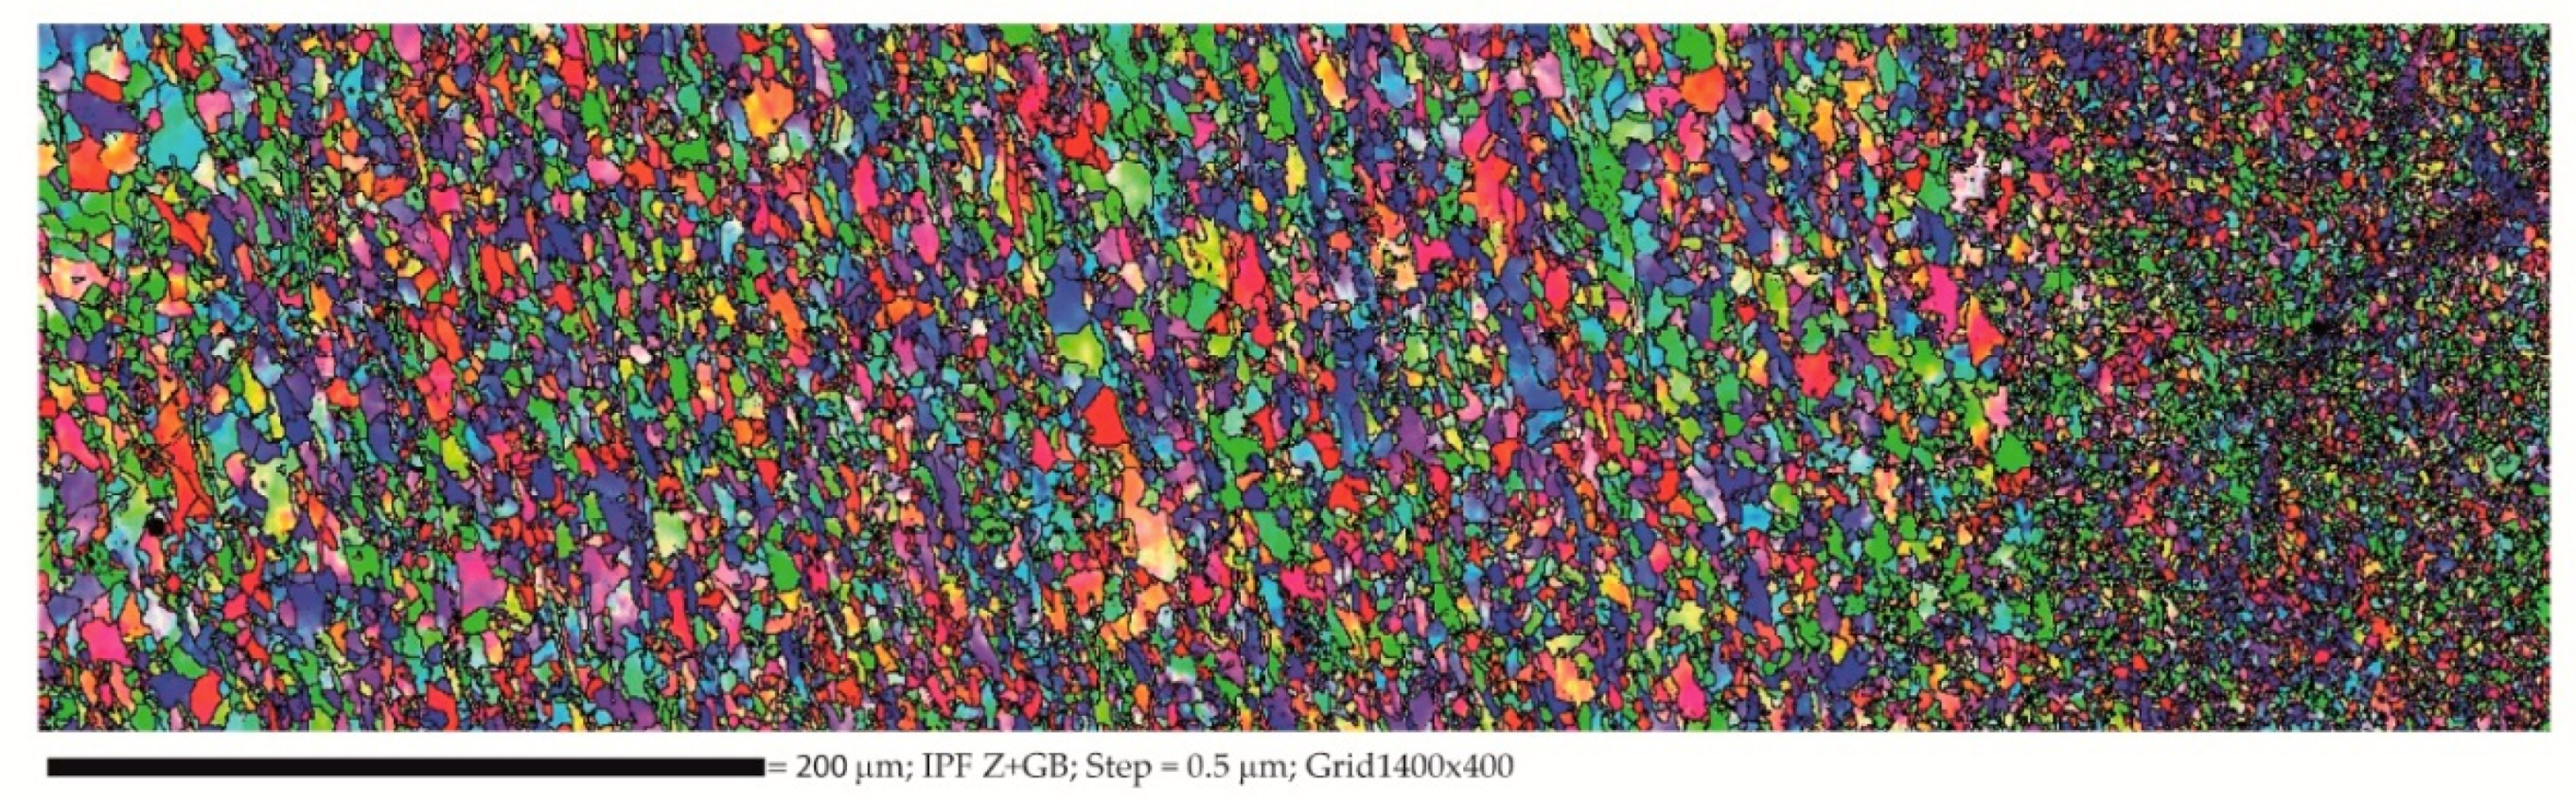
Figure 7.
Detail of grain coarsening in the high-temperature heat-affected zone (HAZ) as it is shown in Figure 6.
2.4. Preparation of Test Samples for Measurement of Mechanical Properties and KV2 Values in HAZ
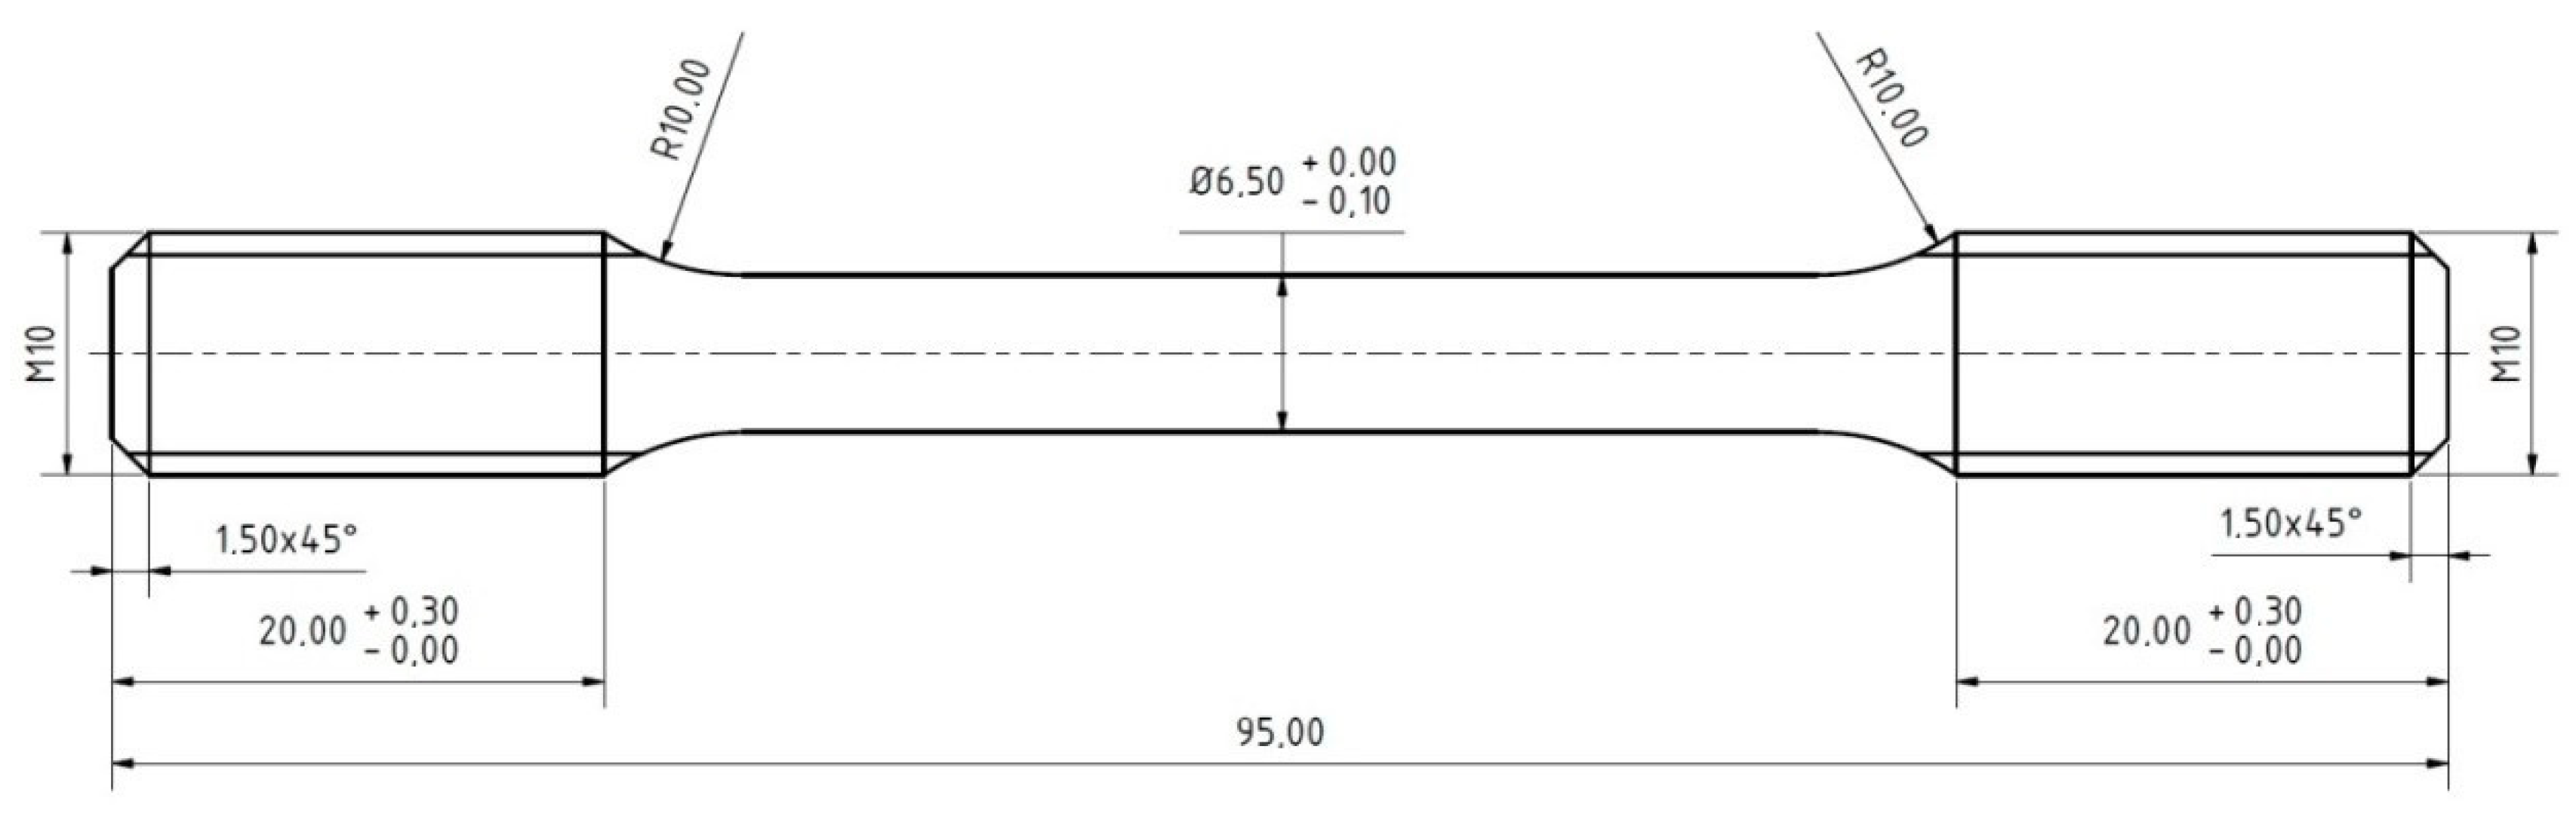
From our knowledge of the actual temperature cycle measured during welding, the proportionality constant K and the actual grain size in the high-temperature HAZ, samples could be prepared to determine the mechanical properties of the KV2 values in the HAZ of a S700MC steel fillet weld. Two aspects, local and global, were used to prepare the sample. The local aspect allowed for the determination of the mechanical properties of a particular grain size applied to the entire sample volume. The final machined testing samples were placed in a Reetz vacuum furnace and, based upon the knowing of proportionality constant K, the exponent m, the actual experimentally determined grain size in the high-temperature HAZ, the exposure temperature, and the soaking time at this temperature could be determined. Specifically, the exposure temperature was 1100 °C, and the soaking time was 418 min. In this way, the samples shown in Figure 8 were used for a static tensile test, Figure 9 shows samples used for static tensile test in the Gleeble 3500 and the samples in Figure 10 were used for a Charpy impact test, according to ISO 148-1.
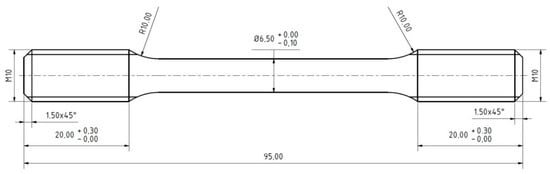
Figure 8.
Samples used to measure mechanical properties as exposed in a vacuum furnace (unit: mm).
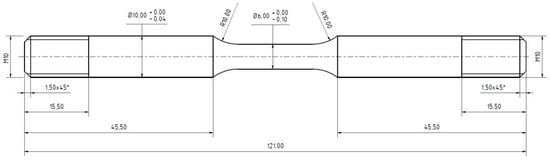
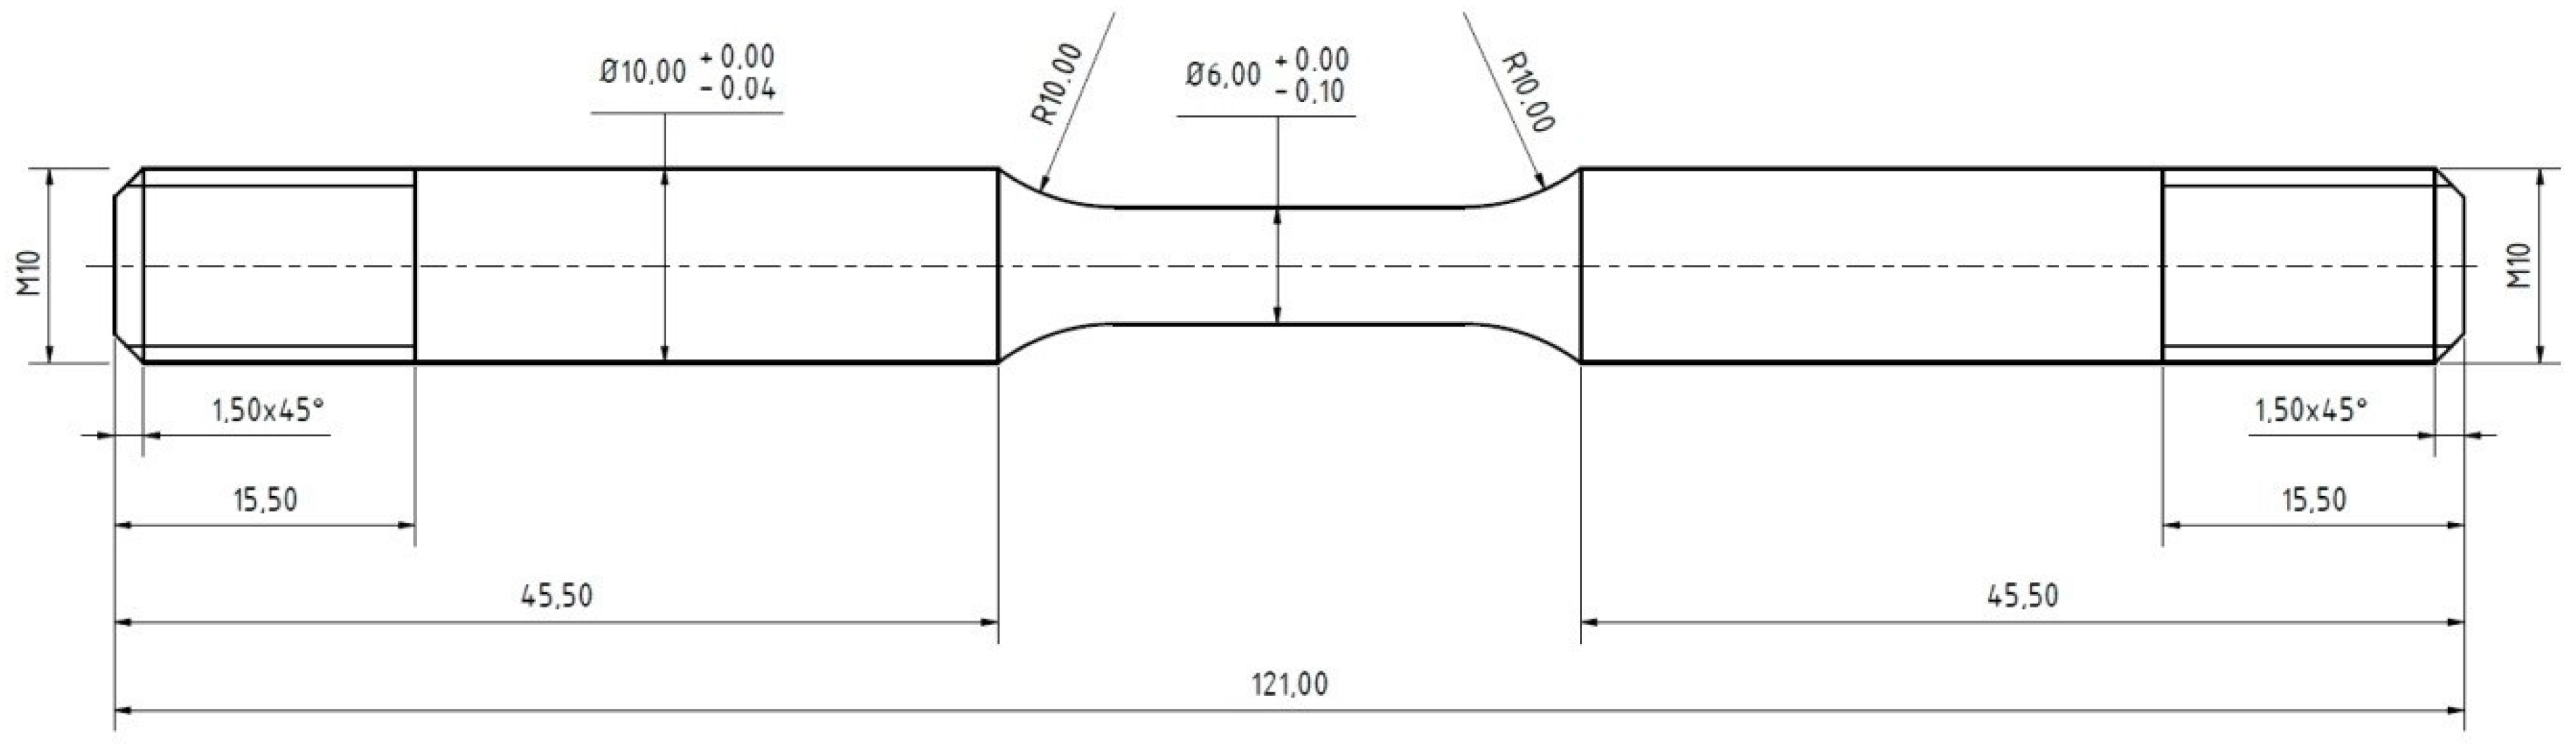
Figure 9.
Samples used to measure mechanical properties after applying a temperature cycle in the Gleeble 3500 (unit: mm).
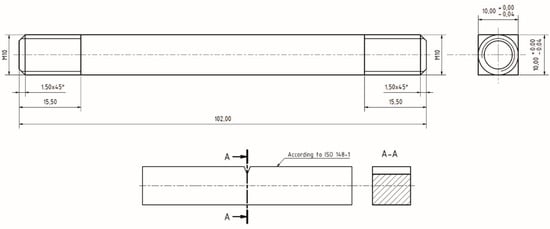
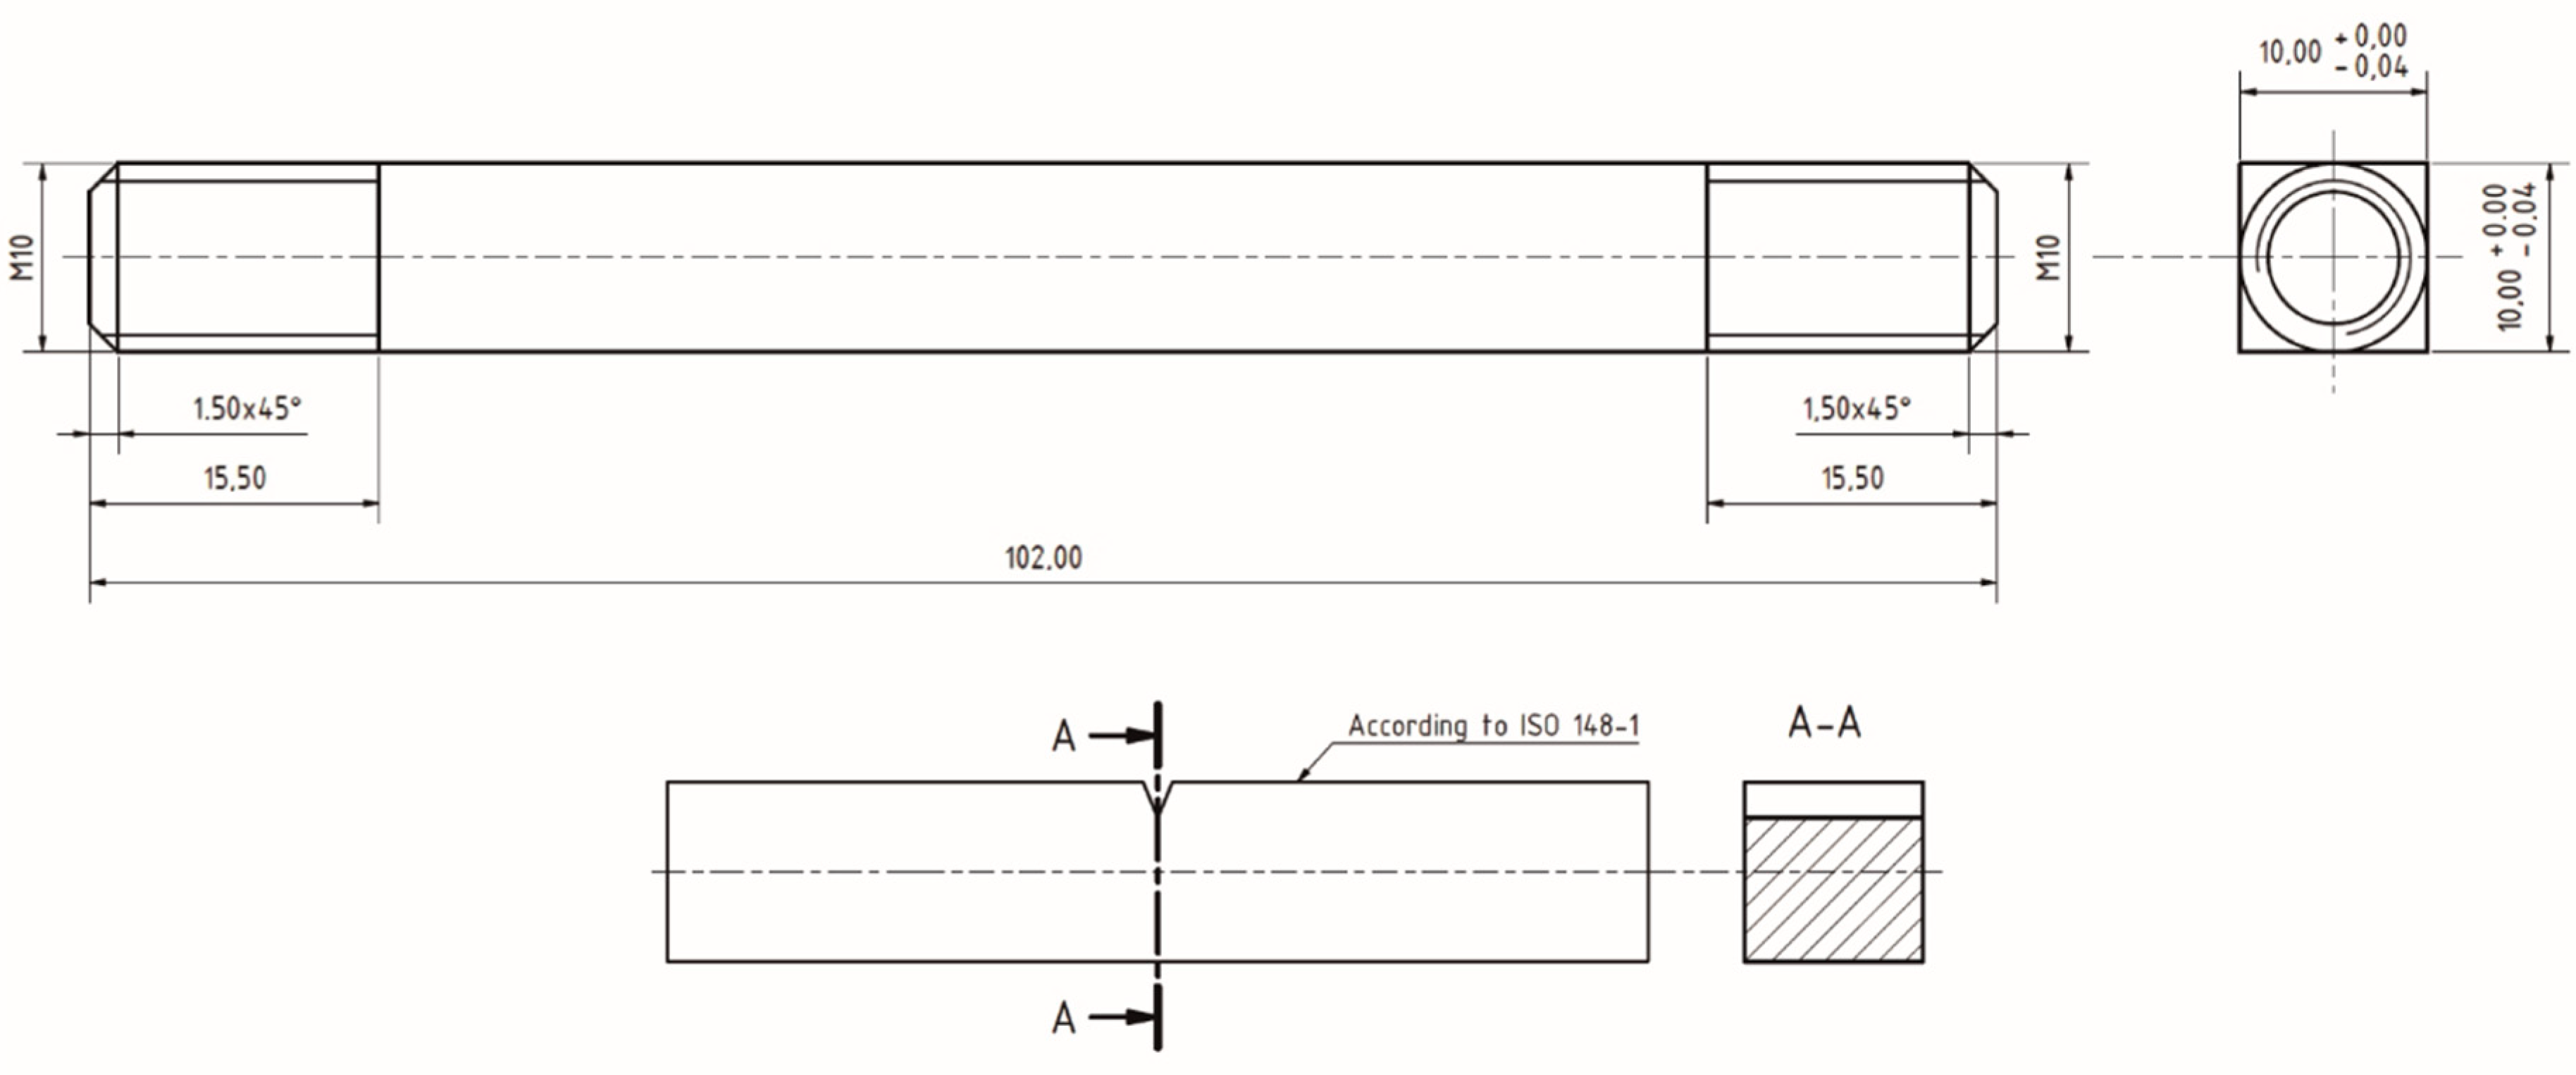
Figure 10.
Samples used to measure the Charpy impact test after applying a temperature cycle in the Gleeble 3500 (unit: mm).
Other test specimens were designed and manufactured is such way that it was (in the Gleeble 3500 thermomechanical simulator, Dynamic Systems Inc., Poestenkill, NY, USA) possible to apply them for the experimentally measured temperature cycle with a maximum temperature of 1383 °C. This was a sample for a static tensile test (Figure 9) and a Charpy impact test (Figure 10).
Two methods of applying temperature cycles can be performed on testing samples (Figure 9; Figure 10). The first method rests in the application a temperature cycle in a force-control mode where force is equal to 0. This means that the clamping jaws move during heating and cooling according to the direction of sample dilatation so that no tension is created in the specimen, which could cause plastic deformation. The second method utilizes the application of a temperature cycle in an extensometer-control mode (L-gauge control mode) without dilatation or, more precisely, where dilatation is equal to 0. This method simulates the rigid clamping of the sample or the rigidity of the weldment itself. Increasing stress in the sample is firstl compensated by elastic and then by plastic deformation.
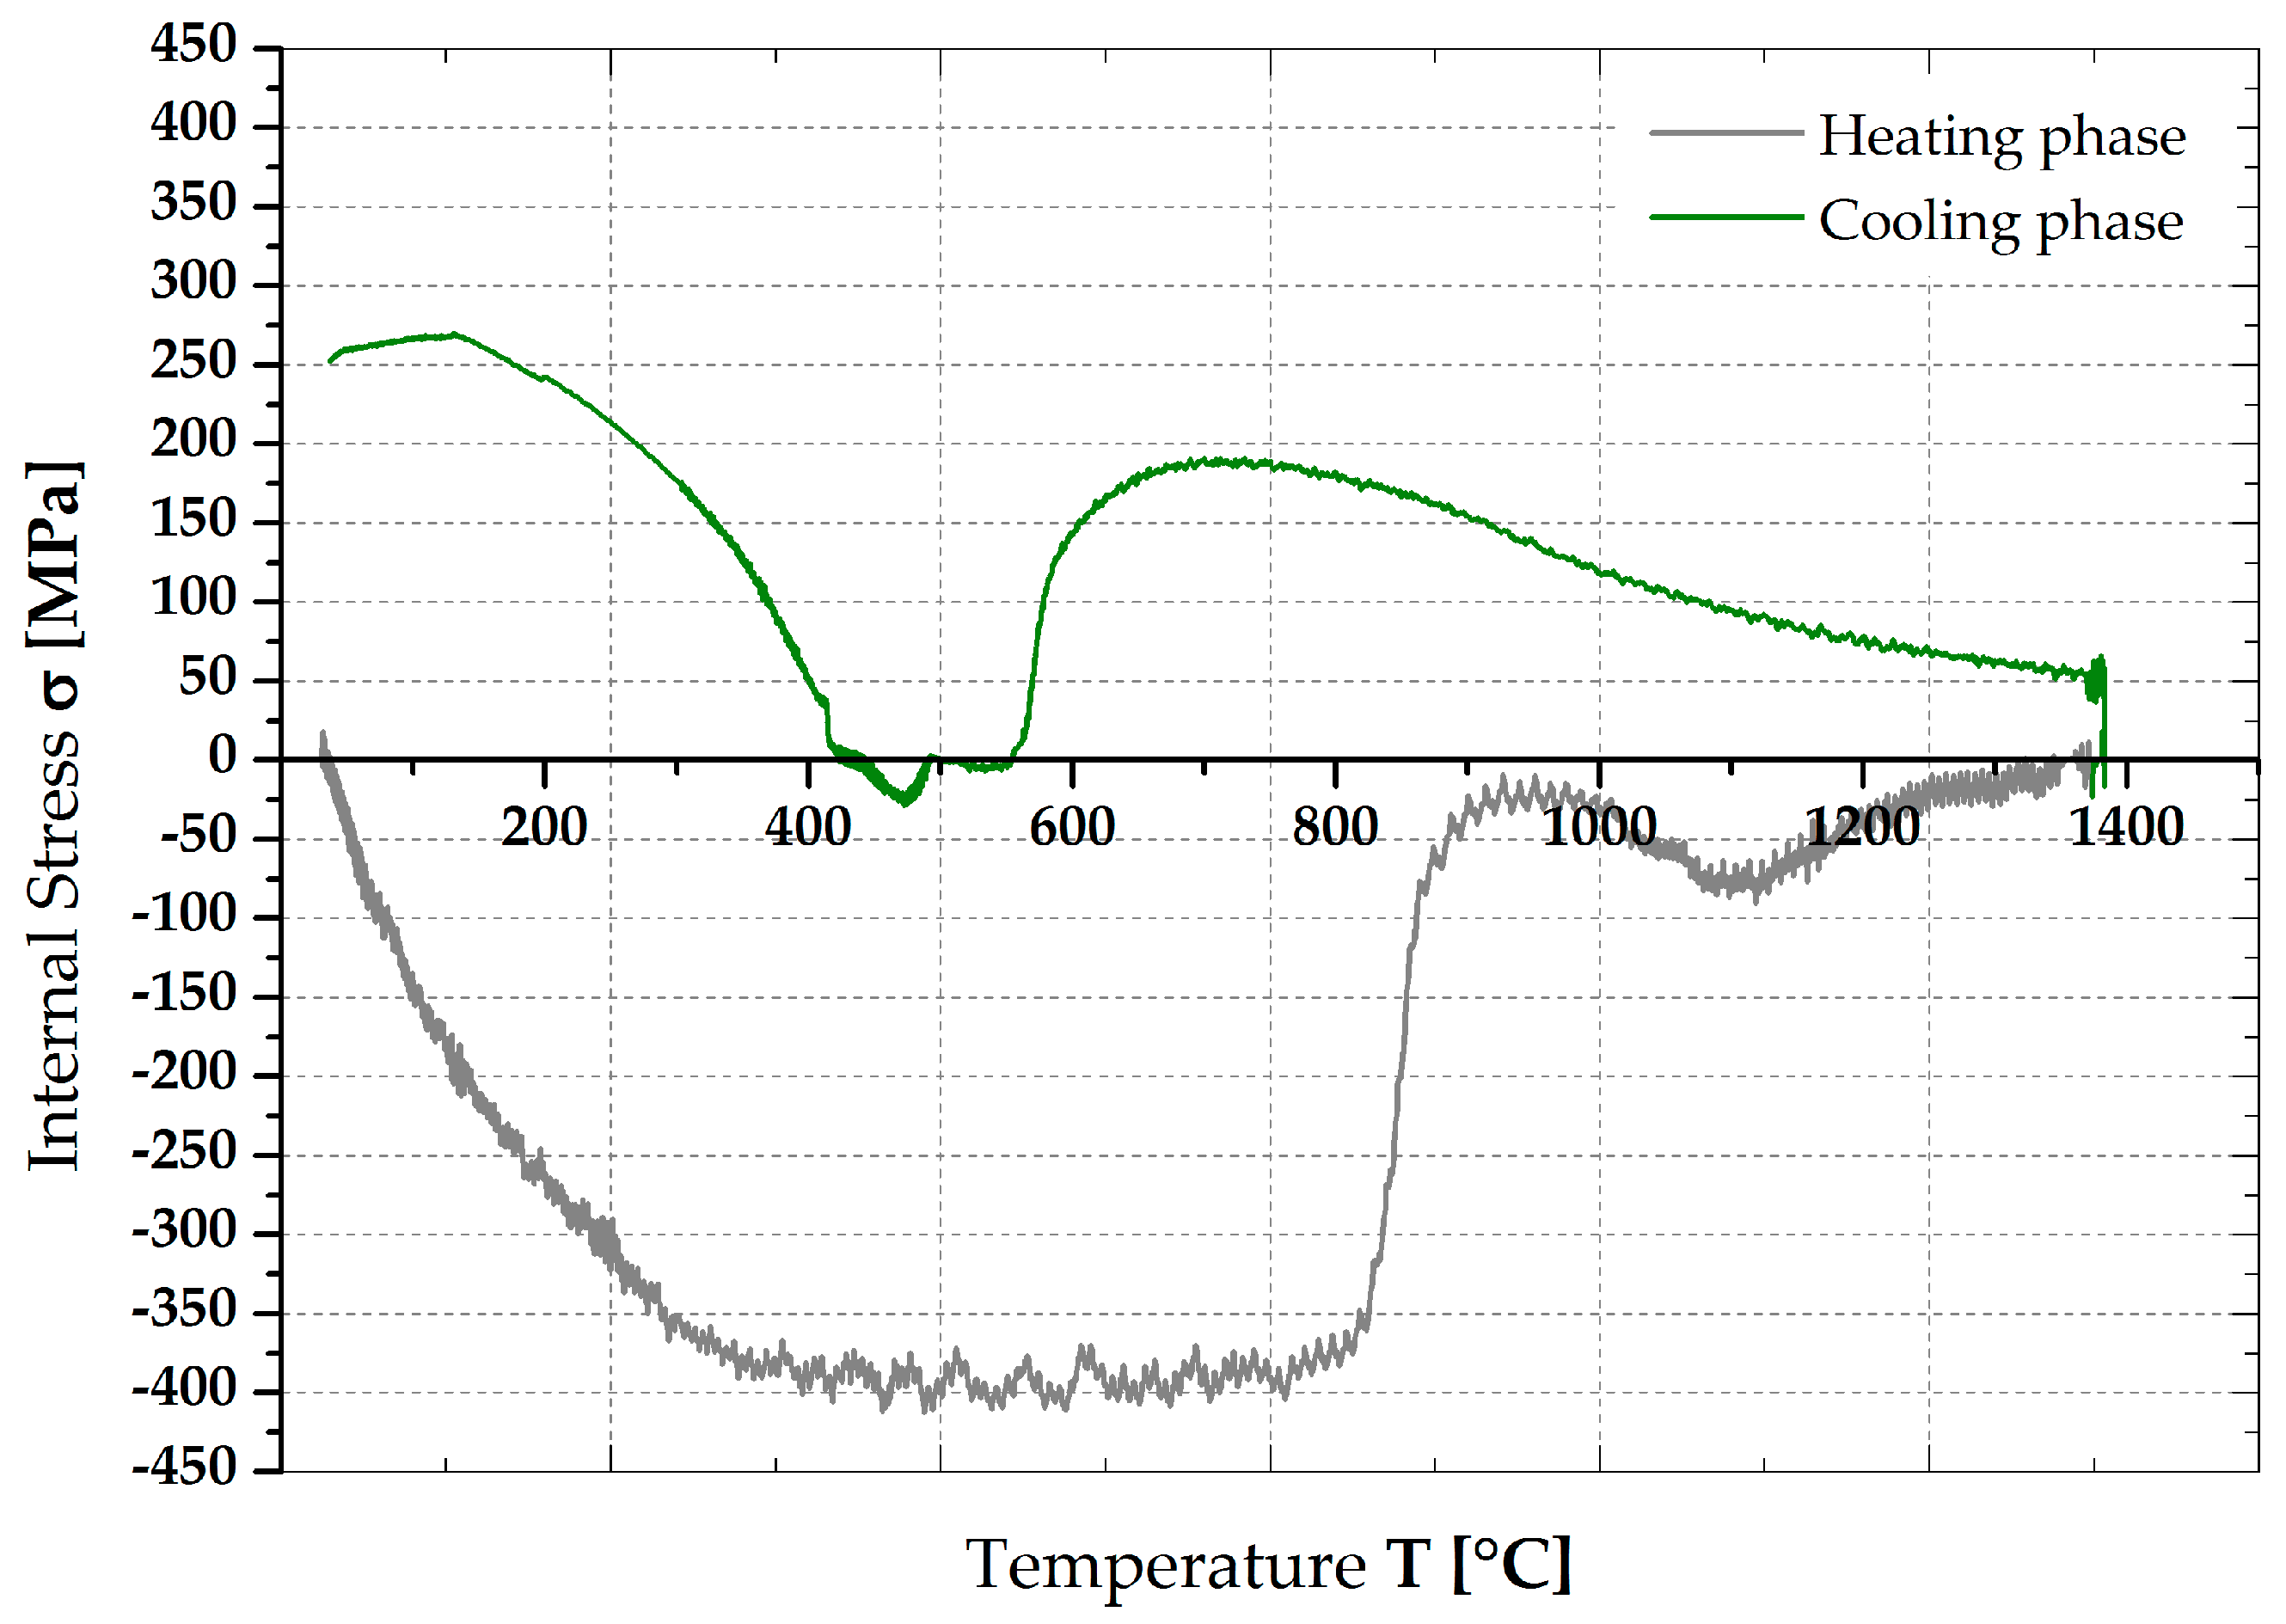
The temperature vs. stress course for the zero dilation sample designed for the static tensile test is shown in Figure 11. It is evident that, from a temperature of about 300 °C, the sample was already deformed plastically. Then, in the temperature range of 750–900 °C, the internal stress in the sample was significantly reduced due to decrease of yield strength, as well as phase transformation. The thermal expansion of the sample was here accompanied by further plastic deformation. When the maximum temperature of 1383 °C was reached and the cooling of the sample began, the compressive stresses were transferred to the tensile ones. During cooling of the sample, one significant drop in the sample stresses appeared in the temperature range corresponding to the phase transformation. This was already visible from the course of real temperature cycle.
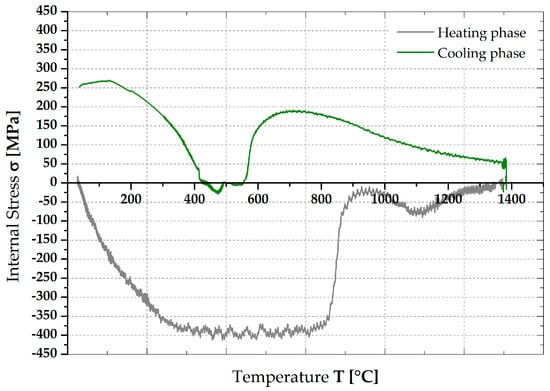
Figure 11.
Graph of the dependence of the stresses in the sample on the temperature when applying a temperature cycle with zero dilatation, with a recording frequency of 500 Hz.
The overall setting of the sample in the Gleeble 3500 before the application of the temperature cycle is shown in Figure 12. The detail of the programmed (black dashed line) and real (red line) applied temperature cycle is shown In Figure 13. From Figure 13, is clear that the real temperature curve had a slight delay behind the program in the heating section. At the beginning of the cooling phase, the real sample temperature copied the program up to 600 °C, when, due to the latent heat release during the austenite transformation, it was not possible to cool the sample sufficiently enough with just Cu high temperature jaws. At a temperature of 400 °C, the cooling rate continued to follow the programmed temperature cycle.
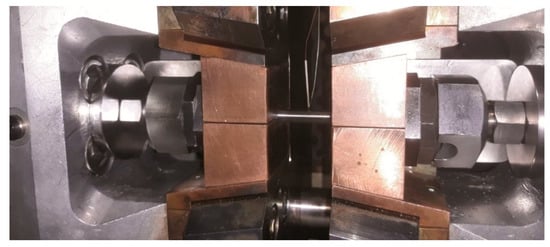
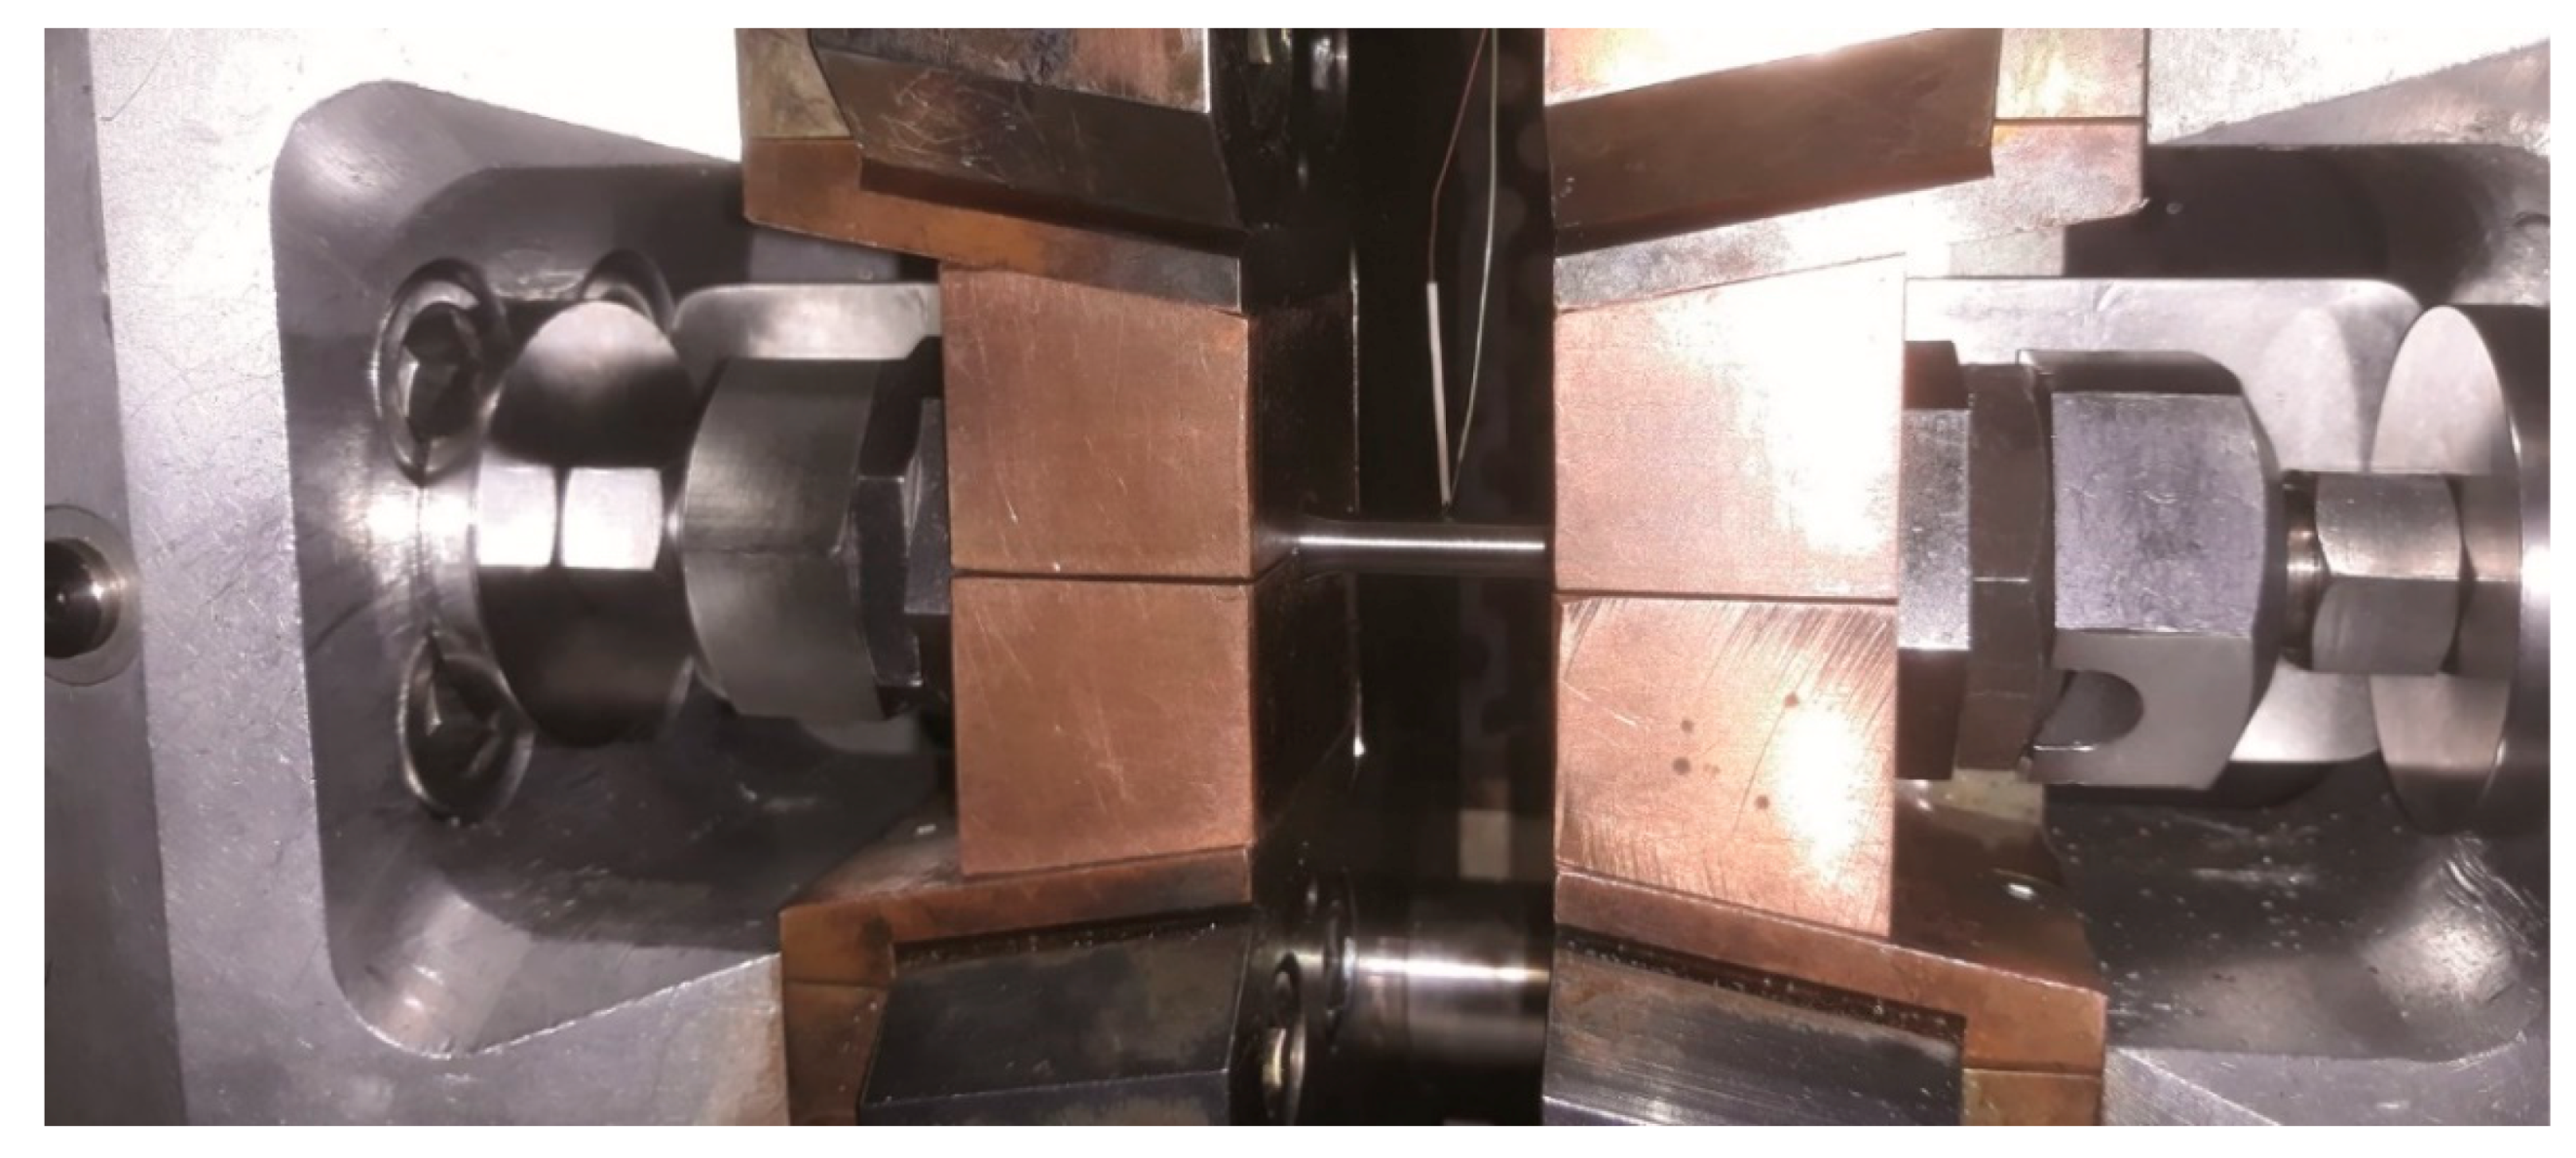
Figure 12.
Position of sample in the Gleeble 3500 device before the temperature cycle application.
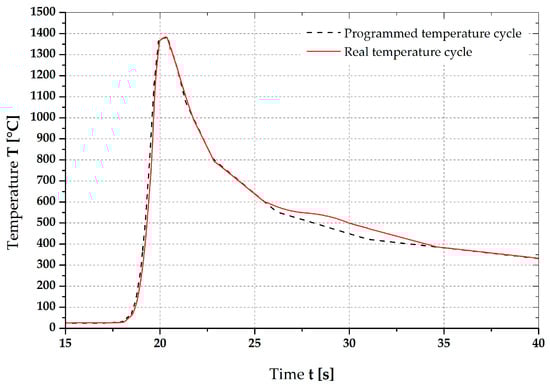
Figure 13.
Comparison of the programmed (black dashed line) and the real (red line) applied temperature cycle.
3. Results
3.1. Evaluation of Welding Experiments and Comparison with Prediction Using the Proportionality Constant K
The first step was to compare the HAZ grain coarsening found in the welding experiments with the grain size predicted numerically based on the temperature dependence of the proportionality constant K and the temperature cycle measured by TC2 (Figure 5) at welding the fillet weld. The grain coarsening in the HAZ (Figure 7) of the weld was evaluated in three different, partially overlapping, areas. Thus, mean grain sizes of d1 = 13.24 µm, d2 = 13.09 µm, and d3 = 13.28 µm were obtained. The average mean grain size in the high-temperature HAZ area was d = 13.21 µm.
The grain size prediction was performed in the Sysweld simulation program for the given temperature cycle. As input data, the temperature dependence of the proportionality constant K, the real measured temperature cycle (Tmax = 1383 °C), and the exponential coefficient m = 2.42 were used [4,5,15]. The simulation was based on Equations (1), (2) and (4).
The predicted mean grain size obtained by the simulation was dstr = 12.04 µm, which is lower by about 9% compared to the real one. However, it should be noted that the prediction was made for one specific temperature cycle with a maximum temperature of 1383 °C, while visible grain coarsening in a HAZ area occurs during welding in a temperature range of 1250–1500 °C. Therefore, the grain growth simulation in the given temperature range was performed, and the predicted value of the mean grain size was dst = 12.54 µm, which differs from the real one by 5.5%.
3.2. Evaluation of Welding Influence on Mechanical Properties and Impact Value in a HAZ Area
To assess the effect of welding on the change of properties in the HAZ area, a temperature cycle corresponding to that of Figure 13 was applied to the samples in Gleeble 3500. Multiple test variants were performed, and these differed only in boundary conditions. First, the temperature cycle was applied to the static tensile test specimens in a controlled force mode, allowing for the free dilatation of sample without plastic deformation. Samples were designated as GT-FD-0X. In the second phase, the samples were controlled by an L-gauge with zero dilatation during the application of the temperature cycle. Samples that were internally compensated by plastic deformation were designated as GT-D0-0X. The static tensile test results are shown in Table 5 (Re is yield strength, Rm is ultimate tensile strength, Ag is uniform ductility, and A20 is total ductility).
Table 5.
Mechanical properties for temperature cycles (temperature 23 °C, strain rate 10−2 s−1).
For an easier assessment of the welding cycle influence on the HAZ, the tensile test results of the parent material (BMT-0X samples) are also in Table 5. The last phase of the experiment used specimens where grain coarsening was achieved over the entire sample volume by the exposure to temperature of 1100 °C for 418 min. The mean grain size obtained from these samples was 13.39 µm. These ones were designated as VFT-FD-0X. Samples labeled as GT had a shape identical to Figure 9, and the samples labeled as BMT and VFT had the shapes shown in Figure 8. Samples were also prepared in the same manner for the Charpy pendulum impact test. The samples were geometry identical to Figure 10, and there was an applied temperature cycle in the Gleeble 3500 device by means of a force-control mode (thus with free dilation of sample). These were designated as GCH-FD-0X. The L-gauge controlled samples (which had zero dilatation during the application of the temperature cycle) where the internal stress was compensated by plastic deformation, were designated as GCH-D0-0X. Samples from the parent material that were produced in accordance with ISO 148-1 were designated as BMCH-0X. Samples for the Charpy impact test (prepared in the vacuum furnace) revealed a mean grain size of 13.43 µm and were designated as VFCH-FD-0X. The results of the Charpy impact test are shown in Table 6 (evaluated according to ISO 14556). All tests were performed on the 450 J Charpy impact machine with an instrumented impact edge and, in addition to KCV2 and KV2, the maximum achieved force Fmax and the real impact velocity vr were evaluated. Moreover, the percentage ratio of the ductile fracture from the photos of fracture surfaces was also evaluated by using an image analysis in NIS Elements 3.2. AR.
Table 6.
Results of the Charpy impact test for the parent material and samples affected by the temperature cycle under different conditions (a temperature of 23 °C).
4. Discussion
In general, the welding process has a considerable influence on the changes of entire joint properties. While changes in the weld metal properties can be partially compensated for by an appropriate choice of filler material, the properties in the HAZ can be influenced only by the welding process parameters. This paper was focused on the changes that occur in a high-temperature HAZ area. This area is characterized by intense grain growth, which has a significant impact on the changes of strength properties. This phenomenon is particularly significant in the case of fine-grained steels, and that is why it is highly-recommended to weld these materials with limited heat input.
4.1. Verification of the Grain Size Determination Method Applicability for Welding Cycles
It is very difficult to carry out HAZ grain size prediction based on data obtained from highly-dynamic temperature cycles due to a high measurement error. Real welding thermal cycles achieve a temperature range above Ac3 for just a single (or, maximally tens of) second. Within such a time interval, the change in grain size at temperatures up to 1200 °C is very small (see Table 2). Above the indicated temperature, it can be tough to determine the time dependence of grain size within such a short time interval. Therefore, much longer exposure times at temperatures not exceeding 1200 °C are used to determine grain growth intensity [4,5]. As mentioned in Section 3.1, by obtaining the temperature dependence of the proportionality constant K (Table 4) and on the basis of known temperature cycles, it is possible to predict the grain size in a high-temperature HAZ area with sufficient accuracy. Most of the calculations and simulation programs are based on grain size prediction via Equation (1), and this equation can be modified based on, in the given predicted location and at the given temperature, the amount of austenite increases, decreases, or remains constant; see Equations (4) and (5).
From the prediction accuracy point of view, the appropriate exponential coefficient m should be selected. According to [4,5], this coefficient should be in the range of 2–5. According to work of Hu et al. [15], which was devoted to predicting the grain growth of S700MC steel by using tests on samples heated in a quenching dilatometer, the coefficient m should move within the interval of 2–3.3. For S700MC steel (described in Section 2.1) which was welded by the method described in Section 2.4, optimized results were obtained with an exponential coefficient of m = 2.42.
Due to the values mentioned above (K, m), a grain size of 12.047 µm was predicted in the simulation for a real temperature cycle with a maximum temperature of 1383 °C, which was lower by about 9% compared to the grain size of the HAZ found in real welding. By including a temperature range of 1250–1500 °C, even better results were obtained, and the deviation in grain size was less than 6%. The same proportional constant values K and the exponential coefficient m were also used to determine the soaking time at an exposure temperature of 1100 °C to obtain samples with a defined grain size throughout whole volume. In this case, the difference between measured grain size on the samples was less than 2%. From the results mentioned above, is clear that the experimentally determined temperature dependence of the proportionality constant K can be used with sufficient precision, not only to predict grain at long-term exposures at chosen temperatures but also for rapid processes that occur during welding.
4.2. Discussion of the Influence of Welding on Mechanical Properties and Impact Value of a HAZ Area
Information about changing the mechanical properties and impact value in a HAZ is very important in terms of changing the properties of a welded joint. Especially for fillet welds, it is impossible to measure KV2 values in a HAZ, and measuring mechanical properties using the static tensile testing also has its limits. Therefore, for testing fillet welds, a breaking test is prescribed. However, this can be realized only with the one-sided fillet welds. Another possibility is to measure the hardness values in a HAZ and in weld metals. Changes that occur in a HAZ and, especially, the coarsening of the grain are very important for the properties of welded joints, mainly in the case of fine-grained steels.
The methodology described in Section 2.4 provides the possibility to prepare samples where both the values of the mechanical and impact properties in a HAZ can be determined. Various authors applied temperature cycles to [9,10,11,12,13,14,15,16] fine-grained test specimens, but different limits appeared in their works. As a first, there is the Tmax of the temperature cycle. The authors of [15,18] used temperature cycles with a maximum temperature generally not exceeding Tmax = 1000 °C and 1200 °C, respectively. In his work, Gorka [9,10,11,12,13] used a temperature cycle with maximum temperatures of 1250 °C and 1299 °C. Only Spanos et al. [19] applied a Tmax of 1400 °C in the dilatometer temperature cycle; however they used very low cooling rate that corresponded to the time t8/5 = 60 s. All of these temperature cycles will undoubtedly have an impact on the structural changes in the material and, thus, on the changes of mechanical properties. However, as is shown in Table 2 and Figure 2, for short times and temperatures up to 1200 °C, grain size change was very small. This is confirmed by the temperature dependence of the proportionality constant K, from which it is evident that intense grain growth occurs only at temperatures above 1300 °C. The second limit of testing is the possibility of including the influence of the rigidity of the welded clamping part and, eventually, the rigidity of the weldment itself. When comparing the GT_FD_0X temperature cycle samples that could freely dilate with GT_D0_0X, where the temperature cycle was applied and which had zero dilatation, differences in yield strength Re and in the uniform ductility Ag are evident (see Table 5). The difference is even more pronounced when comparing KV2 values. When applying the same temperature cycle to the freely dilated samples of GCH_FD_0X and samples that couldn’t freely dilate, as with GCH_F0_0X, the difference in the value of KV2 was 66 J; see Table 6.
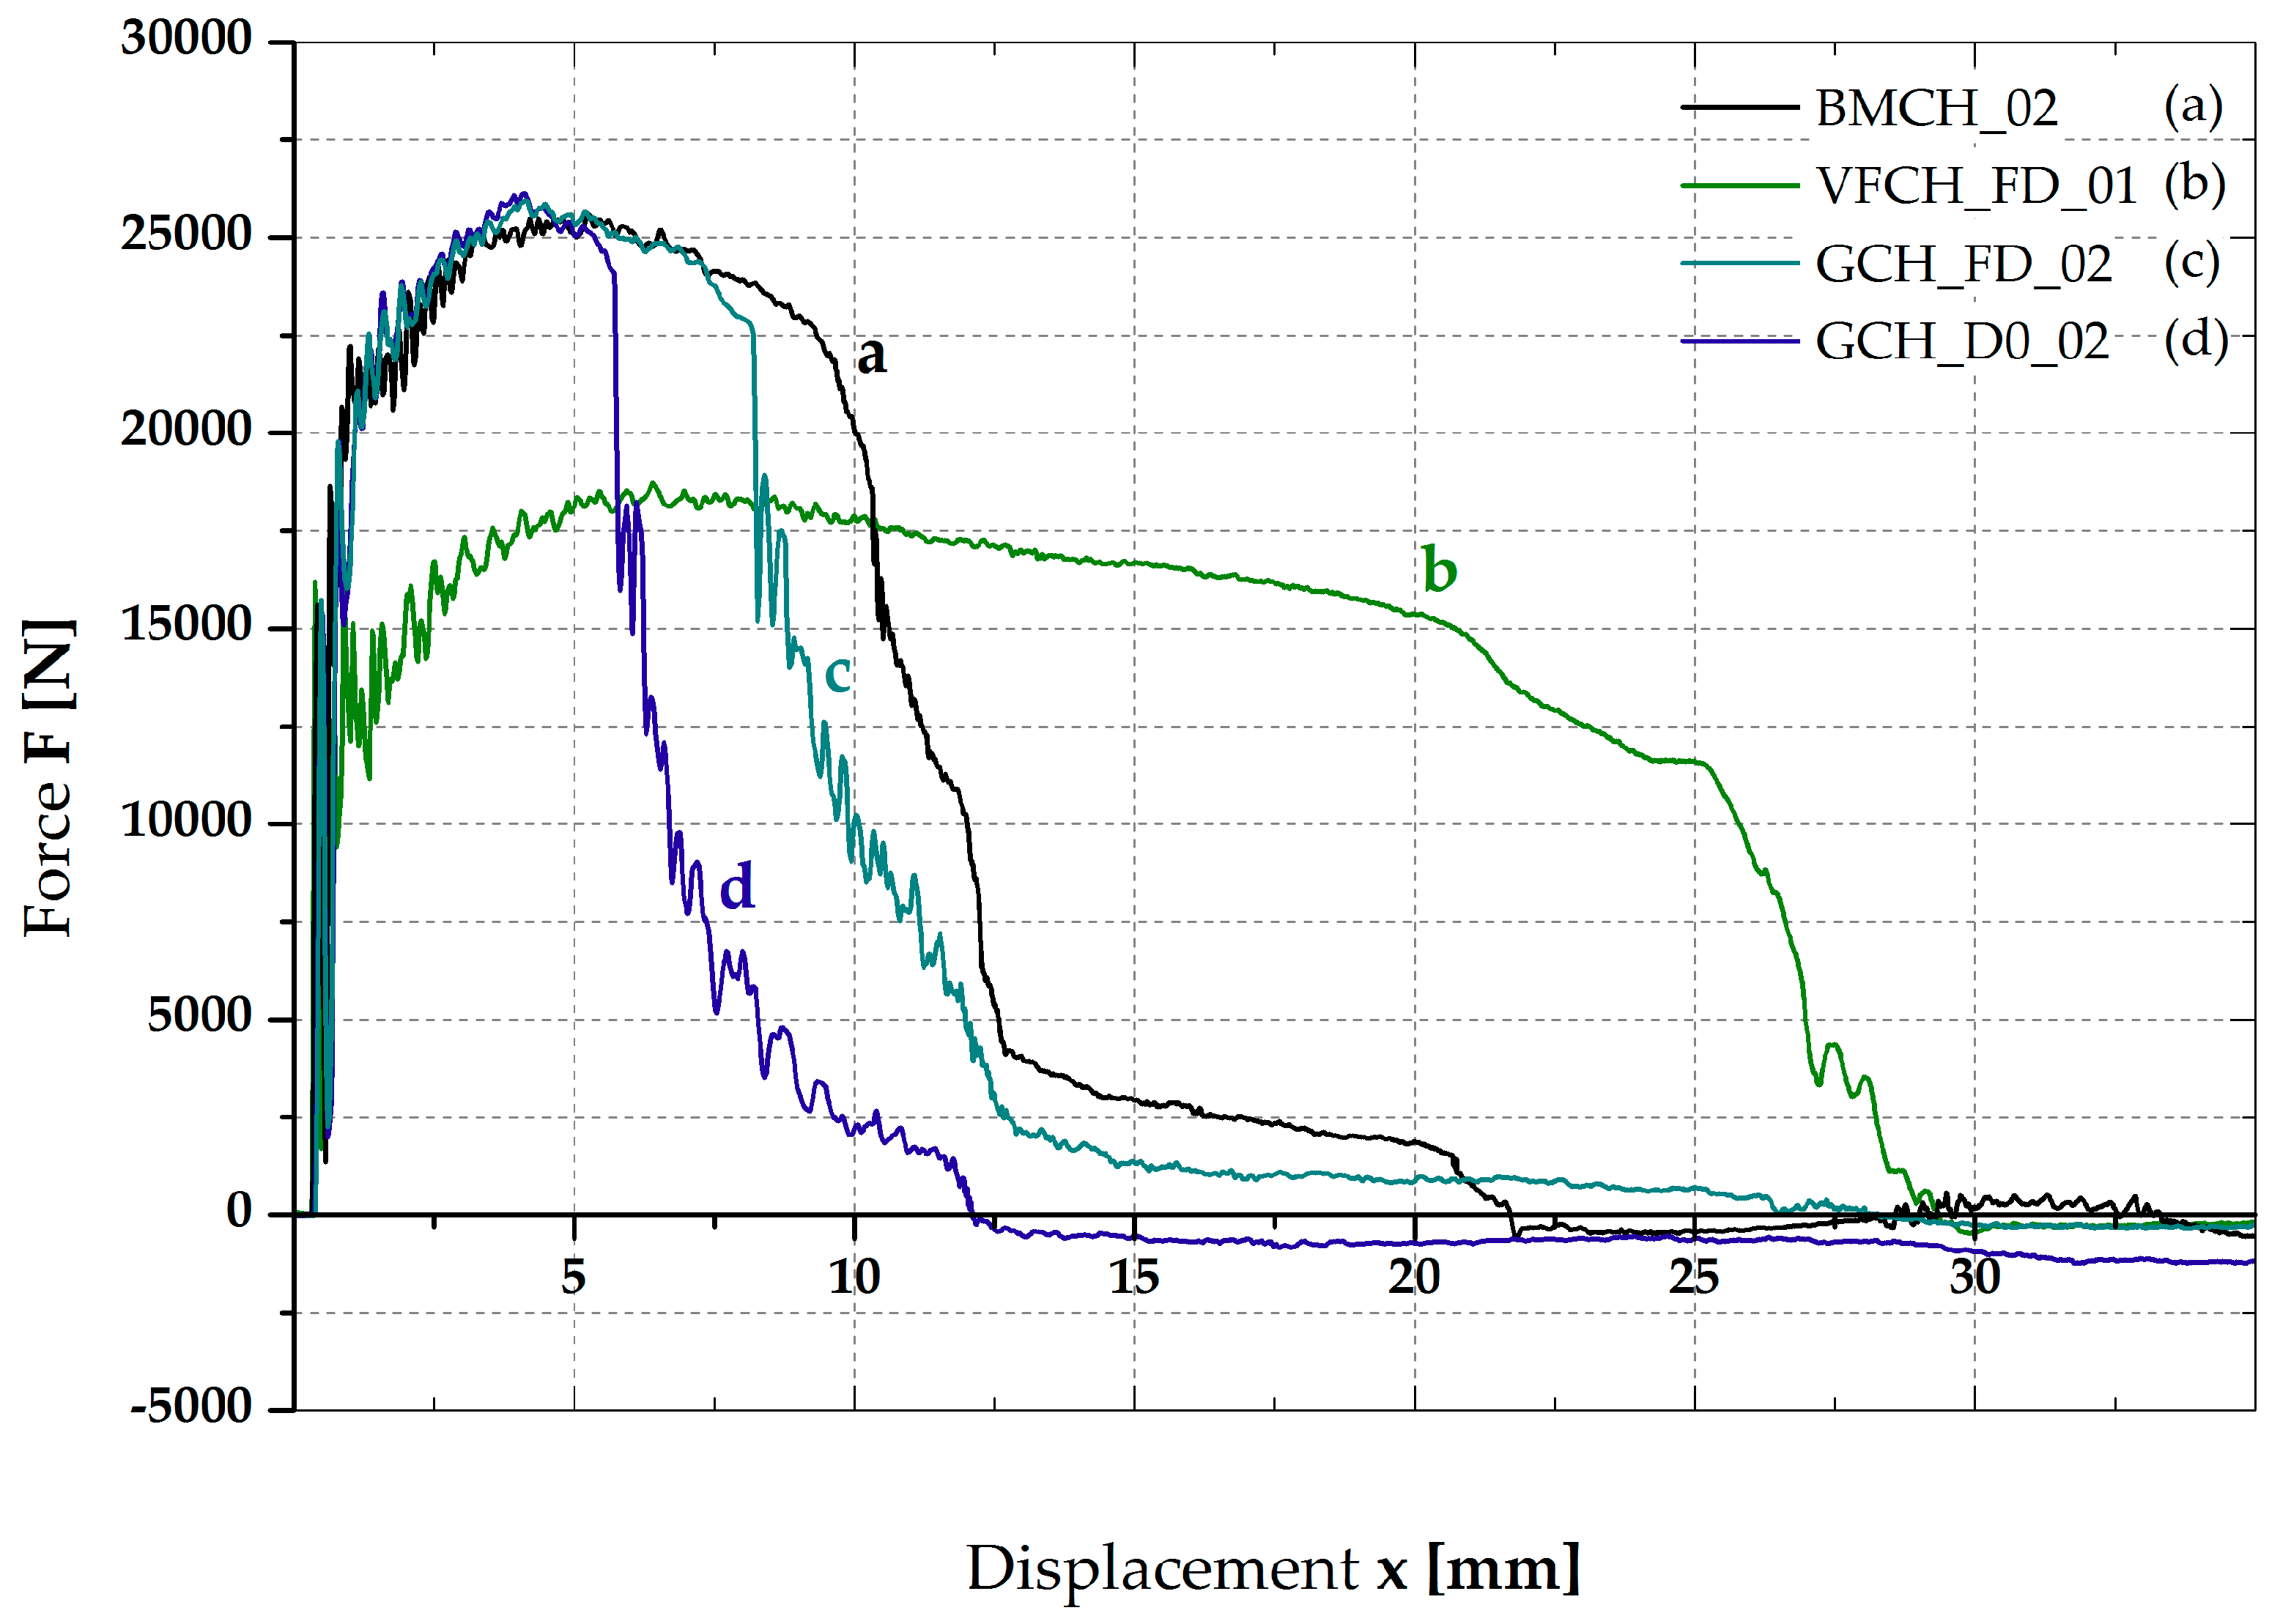
The discussed problem is also evident from the dependence of the force on the displacement during the Charpy impact test (Figure 14) and the corresponding types of fracture surfaces. Figure 15 shows these fracture surfaces of relevant samples.
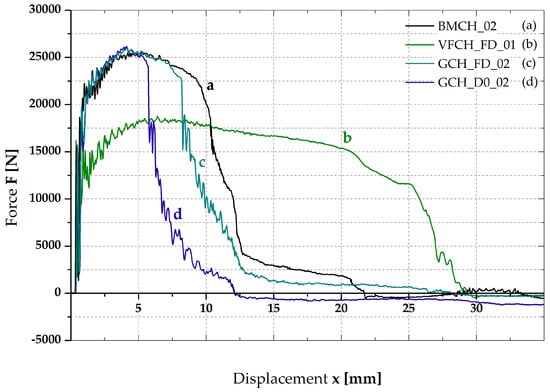
Figure 14.
Force vs. displacement for the Charpy impact test for following samples (a) BMCH_02; (b) VFCH_FD_01; (c) GCH_FD_02; and (d) GCH_D0_02.
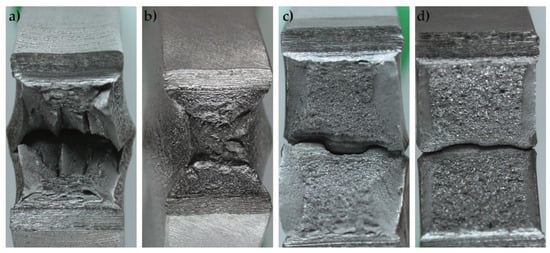
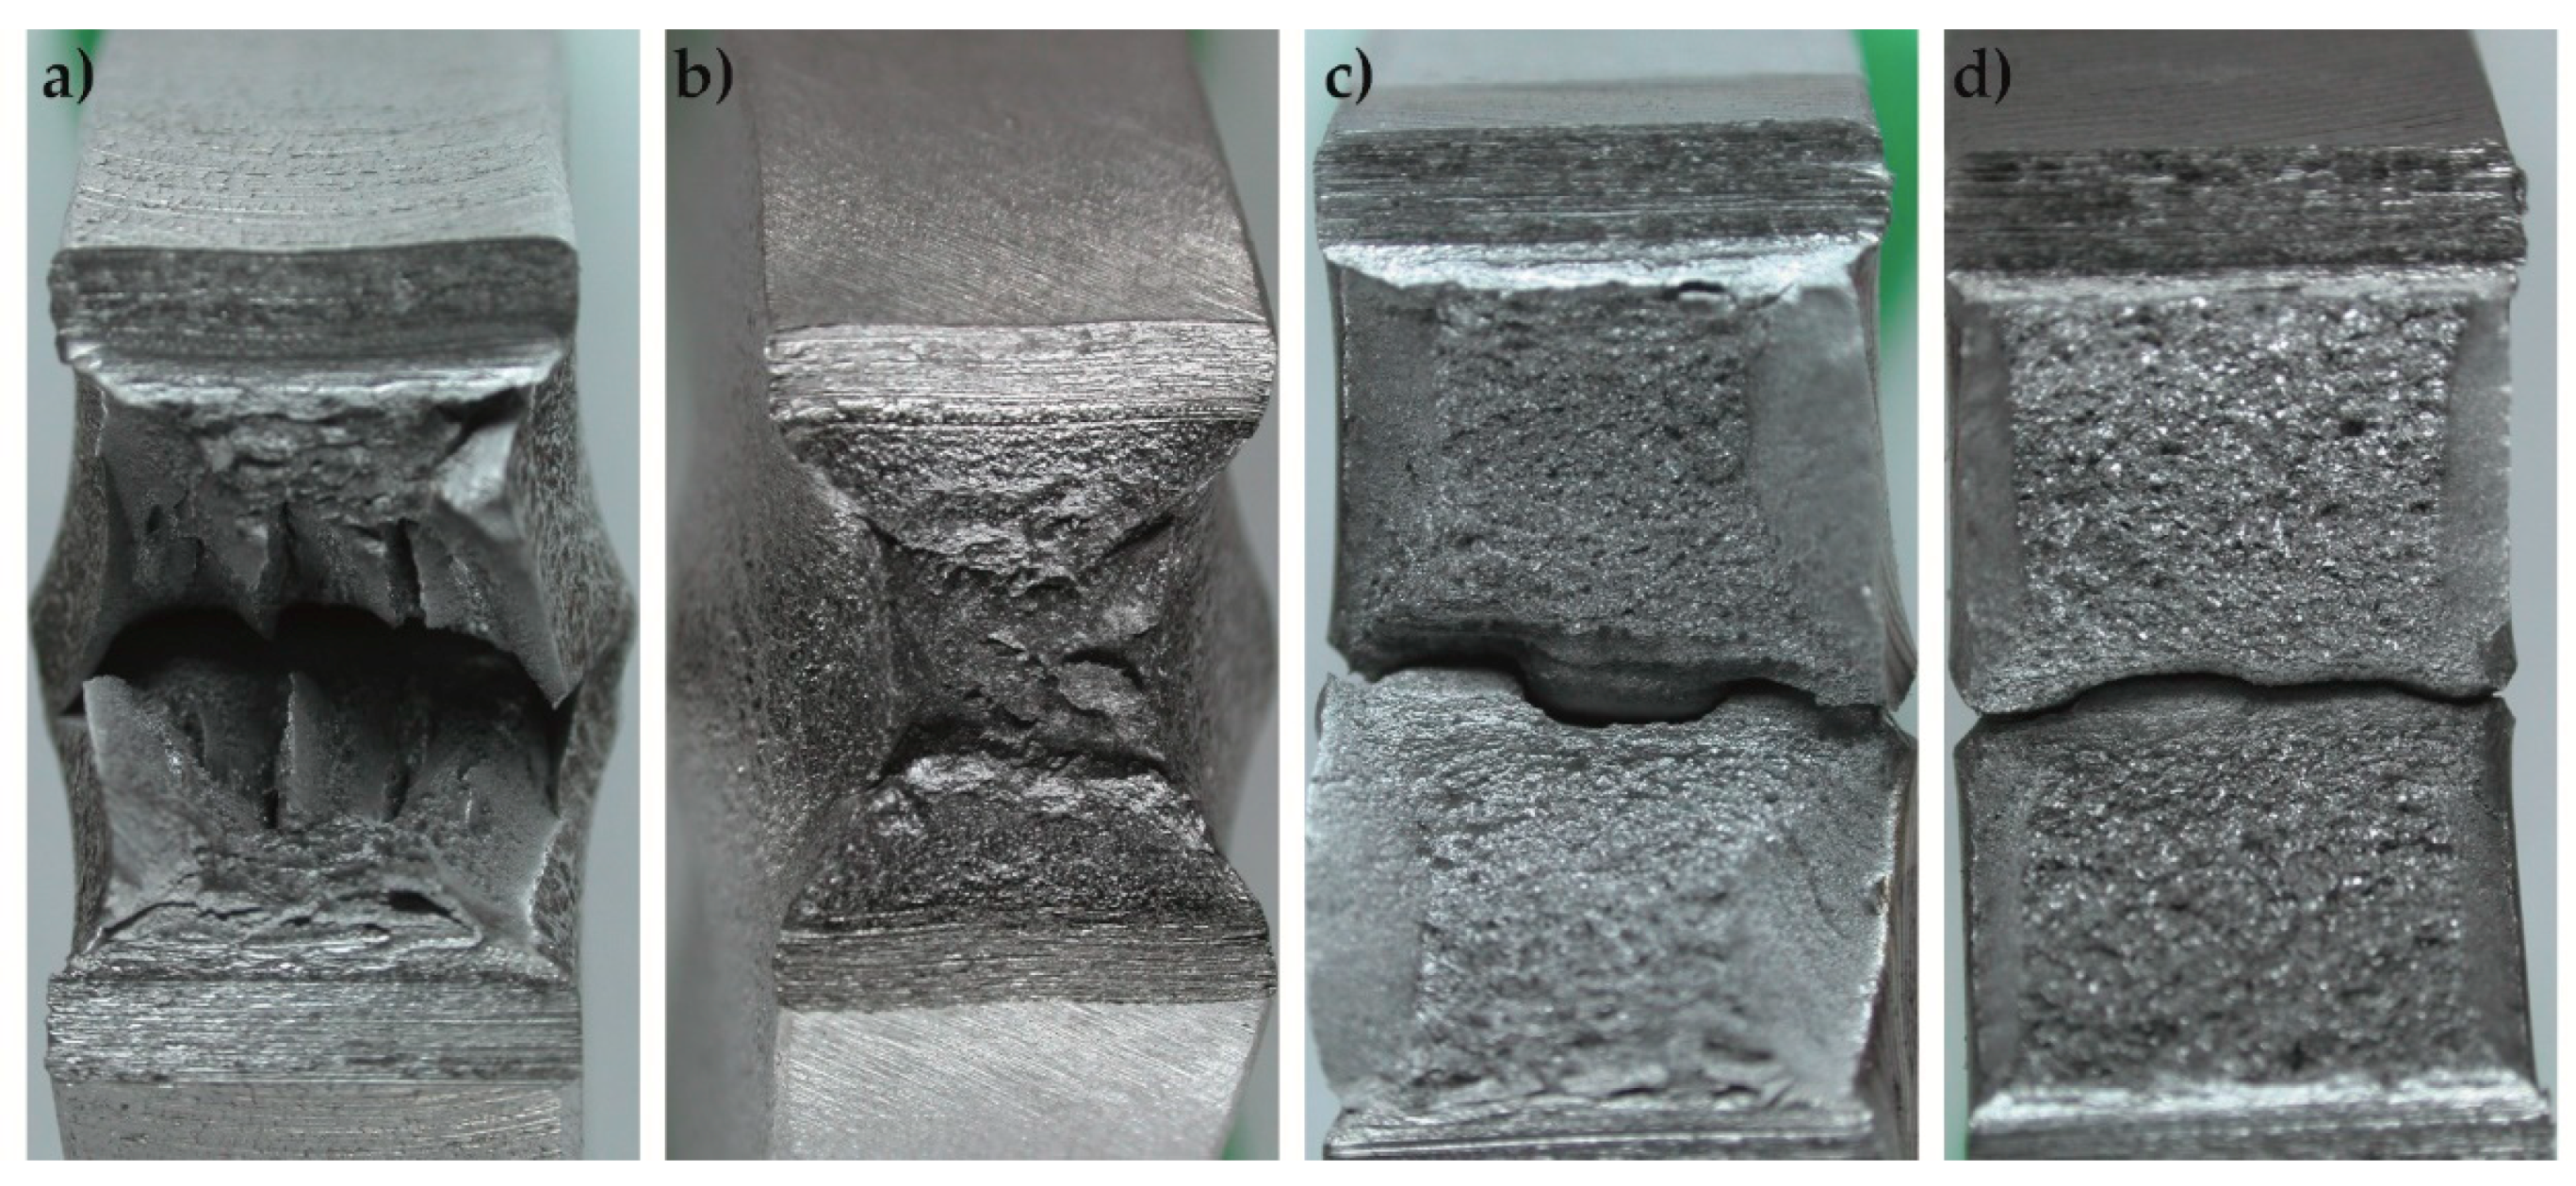
Figure 15.
Fracture surfaces of samples after the Charpy impact test for following samples: (a) BMCH_02; (b) VFCH_FD_01; (c) GCH_FD_02; and (d) GCH_D0_02.
The results obtained for samples VFT_FD_0X and VFCH_FD_0X are then completely outside from the expected values both for mechanical properties and impact values. The aim of the experiments with these samples was to assess the situation where the grain size intensity would be the same in the entire sample volume to avoid the effect of heterogeneity. However, the long-term temperature exposure resulted not only in a grain growth to the desired size but also the removal of hardening after thermomechanical processing by the restoration mechanism. This caused a half-reduction in the mechanical properties and an increase in the KV2 by 105 J. As a solution of this problem, there could be a shape inductor capable of rapidly heating the test sample throughout its whole cross-section area.
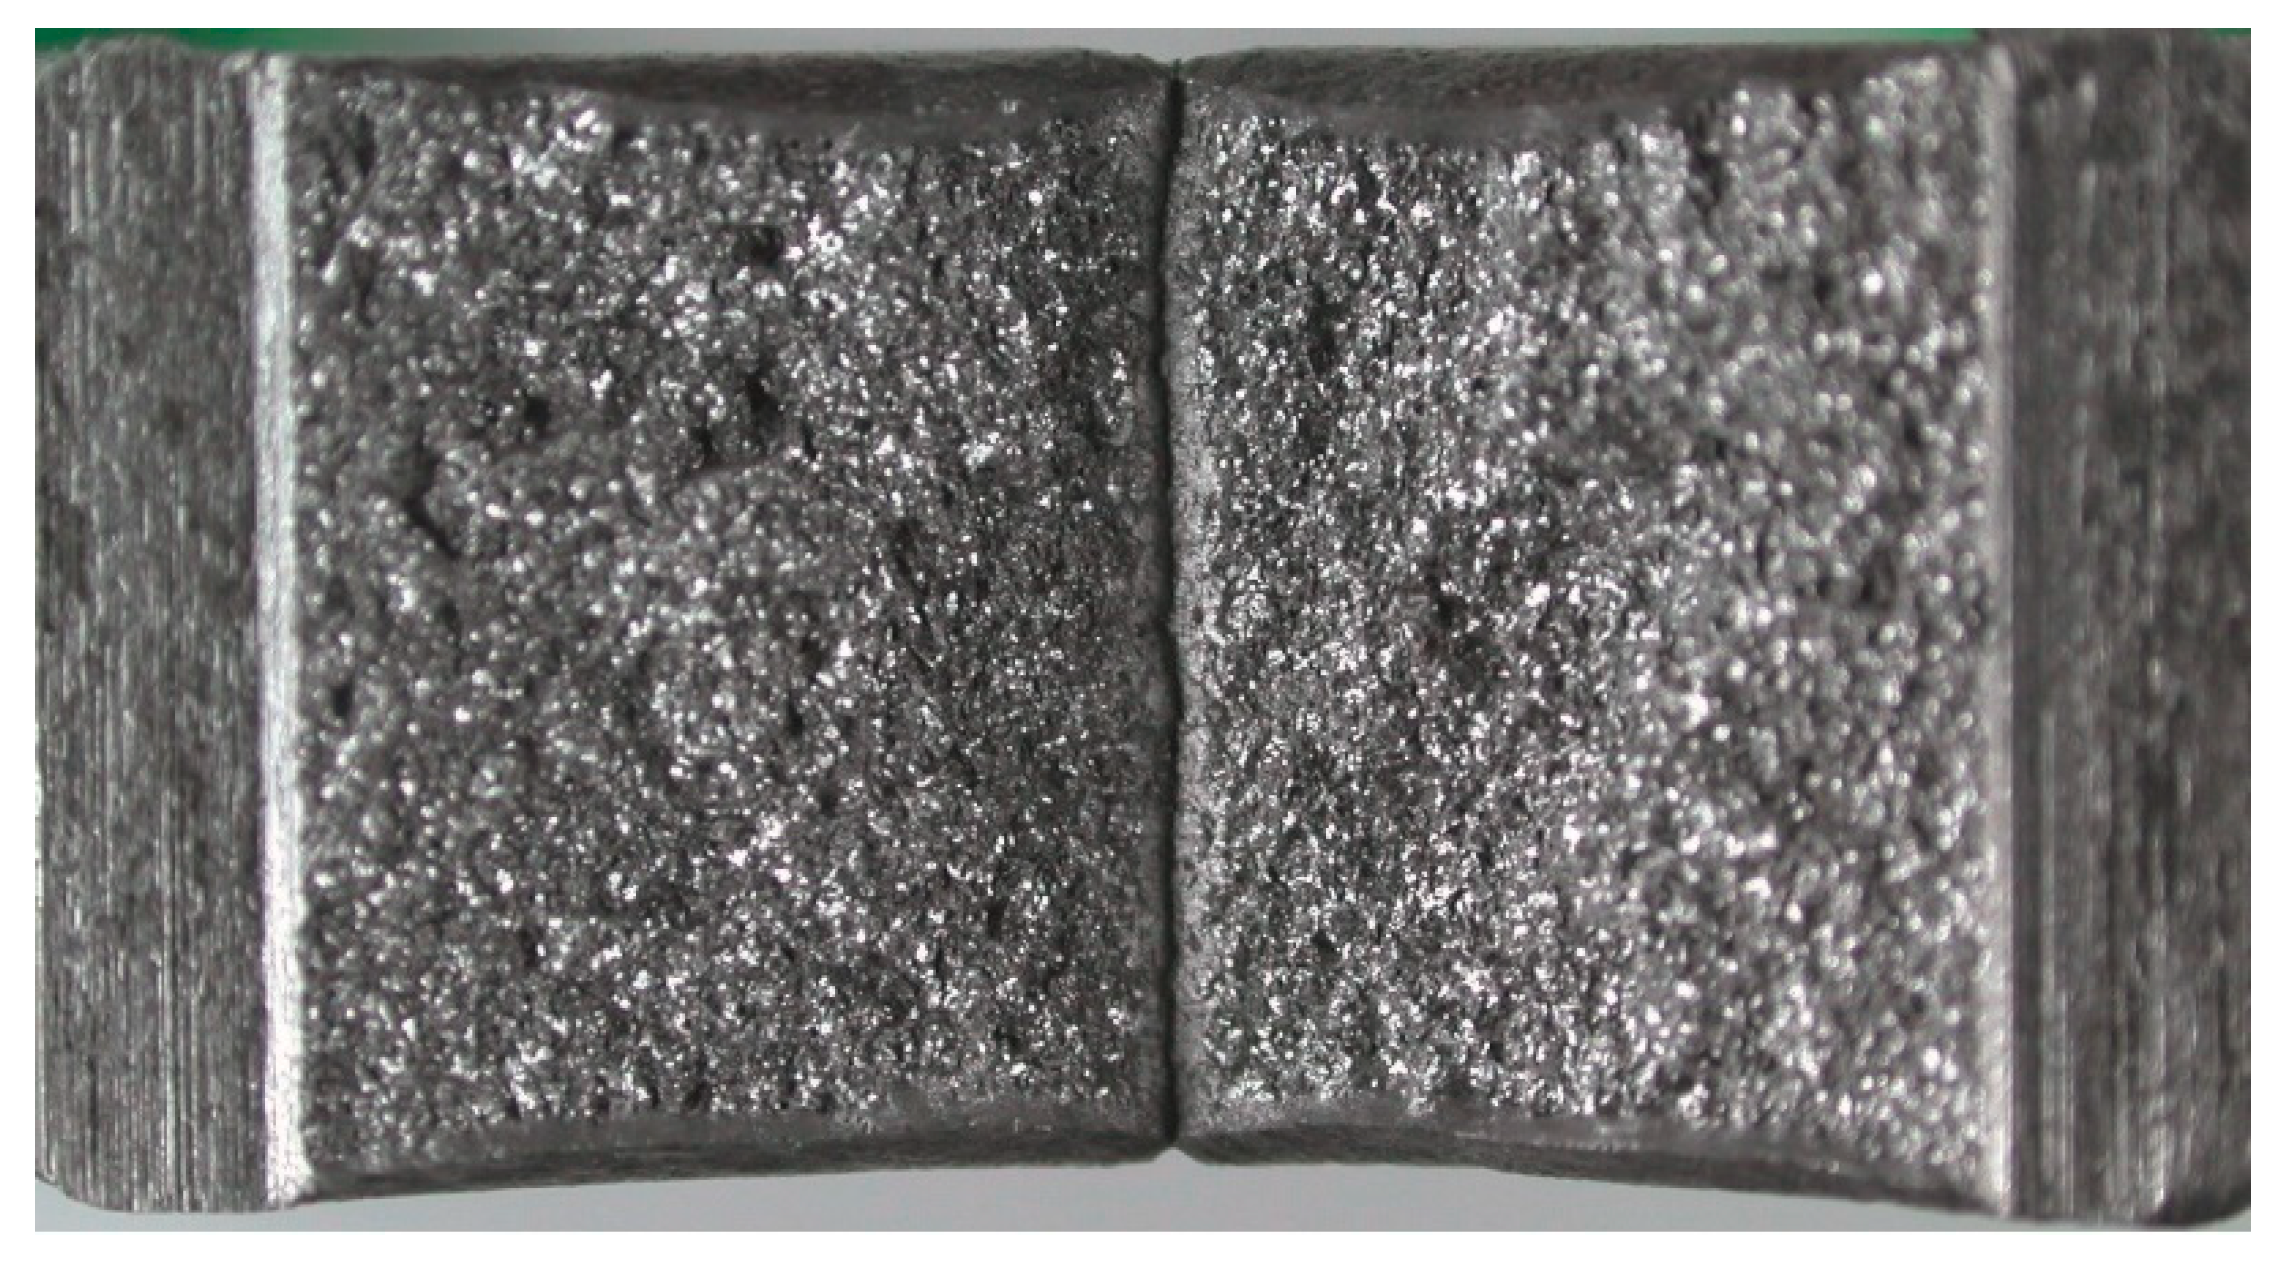
The last thing that should be mentioned is the influence of the heating and cooling rate that generally defines the time of the temperature cycle in the area above Ac3. Based on the real temperature cycles for the given process parameters and the welding method, the instruments used for applying this cycle to the sample were able to maintain the required heating and cooling rates; the results will correspond to the weld joint behavior. The producer [20] set for the S700MC steel recommended a range t8/5 from 1 to 20 s. The real temperature cycle (Figure 13) used in this work had a cooling time of t8/5 = 7.2 s, and the total cycle time at 500 °C was t500 = 10.8 s. When using a temperature cycle with half this heating rate and twice this cooling rate (t8/5 = 14.4 s, the total cycle time at 500 °C was t500 = 21.6 s), the KV2 values and mechanical properties will be significantly affected. In addition, a double-long temperature cycle was applied to samples with zero dilation for GT_D0_0X and GCH_D0_0X. The measurement was always performed on three samples under an ambient temperature of 23 °C. The average values obtained from the three measurements are as follows: KV2 = 37 J, Re = 586 MPa, Rm = 712 MPa, Ag = 5.88%, and A20 = 23.38%. The two-fold prolongation of the temperature cycle resulted mainly in the reduction of KV2 by 103 J. The fracture was evaluated as the brittle one and is shown in Figure 16.
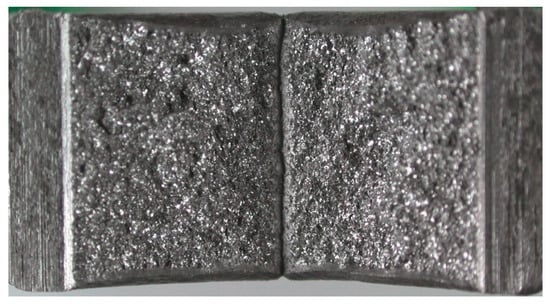
Figure 16.
Fracture surfaces of GCH_D0_01_after the Charpy impact test (with a twice as long temperature cycle).
5. Conclusions
The influence of the welding process on the changes in a HAZ for fine-grained welded joints is a topical issue, and, thus, many researchers are dedicated to it. These works are most often included in the field of assessment of the welding influence on the structural changes in a HAZ and the associated changes of mechanical and brittle-fracture properties. Another large group is focused on grain size prediction—but mainly from the perspective of mathematical solutions. The presented work is focused on assessing the effect of grain coarsening in a high-temperature HAZ on the changes of mechanical properties and KV2. Grain coarsening is an important material parameter, and sufficient attention should be given to it, especially in the case of thermomechanically processed steels that are hardened by grain boundary strengthening. From the measured values, it is clear that the concept of validation experiments should be based on the methodological procedures shown in Section 2 under precisely defined boundary conditions. Otherwise, results with considerable errors can be obtained. Therefore, the following recommendations should be taken into account when conducting verification experiments:
- Before the verification experiment, the type of welded joint, the possibilities of its expansion during welding, the method of its clamping, and the rigidity of the parts to be joined should all be defined.
- Consider the Tmax for the temperature cycle applied to the test specimen, especially when it is a thermomechanically fine-grained steel. The effect of grain coarsening is more pronounced in welding cycles at temperatures higher than 1300 °C.
- Consider the shape of temperature cycles used for samples and simulating the welding process. Essentially start from the real measured temperature cycles characteristic of the used welding method and eventually move to temperature cycles predicted by means of experimentally verified numerical simulations.
- Design the shape and size of the test specimens so that the testing machine applying the temperature cycle to the sample is able to reach the desired Tmax, heating, and cooling rates.
By following these recommendations, it is possible to summarize the results of the high-temperature HAZ achieved by the welding the S700MC steel as following:
- The values of the temperature dependence of the proportionality constant K, which defines the grain growth kinetics and is obtained experimentally by the isothermal method, can be used with the sufficient precision to predict the grain size both for long-term soaking times at exposure temperatures and for dynamic welding temperature cycles that are characteristic of welding
- While welding parts that are rigidly clamped or have higher rigidity, the thermal expansion of the part is compensated by plastic deformation. In this case, the yield strength Re was reduced by 12%, and the KV2 value was reduced by 32% compared to parts that can dilate freely.
- The value of specific heat introduced into the weld should be limited. In this case, when the cooling time is double extended in the interval Tmax-500 °C (i.e., also for temperature t8/5), the yield strength Re was reduced by 6%, and, above all, the KV2 value decreased by more than 70% compared to the same samples clamped in the same manner.
Author Contributions
Conceptualization, J.M. and I.N.; methodology, J.M.; investigation, J.M., I.N., J.S. and H.N.; resources, J.M. and H.N.; data curation, J.M., I.N. and J.S.; writing—original draft preparation, J.M. and I.N.; visualization, J.M. and J.S.
Funding
This research was supported by the Ministry of Industry and Trade of the Czech Republic as grant project MPO FV 10709, as well as by the institutional funding of science and research at the Technical University of Liberec TUL 117/2200.
Acknowledgments
The authors would like to thank to Ing. Tomasz Kik and Ing. Martin Svec for technical support during evaluation of experiments.
Conflicts of Interest
The authors declare no conflict of interest.
References
- Burke, J.E.; Turnbull, D. Recrystallization and grain growth. Prog. Met. Phys. 1952, 3, 220–292. [Google Scholar] [CrossRef]
- Zöllner, D.; Streitenberger, P. Three-dimensional Normal Grain Growth: Monte Carlo Potts Model Simulation and Analytical Mean Field Theory. Scr. Mater. 2006, 54, 1697–1702. [Google Scholar] [CrossRef]
- Zöllner, D.; Streitenberger, P. Monte Carlo Potts Model Simulation and Mean-Field Theory of Normal Grain Growth; Shaker Verlag GmbH: Herzogenrath, Germany, 2006; p. 144. [Google Scholar]
- Abbaschian, R.; Abbaschian, L.; Reed-Hill, R.E. Physical Metallurgy Principles; Cengage Learning: Stamford, CT, USA, 2009. [Google Scholar]
- Giumelli, A. Austenite Grain Growth Kinetics and the Grain Size Distribution. Ph.D. Thesis, University of British Columbia, Vancouver, BC, Canada, 1995. [Google Scholar]
- Moravec, J. Metodické postupy využitelné kzískání vstupních veličin numerických simulací svařování a tepelného zpracování. Habilitation Thesis, Technical University of Liberec, Liberec, Czech Republic, 2017. [Google Scholar]
- Priadi, D.; Mapitupulu, R.A.M.; Siradj, E.S. Austenite Grain Growth Calculation of 0.028% Nb steel. J. Min. Metall. 2011, 47, 199–209. [Google Scholar] [CrossRef]
- Manohar, P.A.; Dunne, D.P.; Chandra, T.; Killmore, C.R. Grain Growth Predictions in Microalloyed Steels. ISIJ Int. 1995, 36, 194–200. [Google Scholar] [CrossRef]
- Górka, J. Microstrukture and Properties of the High-Temperature (HAZ) of Thermo-Mechanically Treated S700MC High-Yield-Strength Steells. Mater. Technol. 2016, 50, 617–621. [Google Scholar]
- Górka, J. Influence of the maximum temperature of the thermal cycle on the properties and structure of the HAZ of steel S700MC. IOSR J. Eng. 2013, 3, 22–28. [Google Scholar] [CrossRef]
- Górka, J. An Influence of Welding Thermal Cycles on Properties and HAZ Structure of S 700MC Steel Treated Using Thermomechanical Method. In Proceedings of the Scientific Proceedings IX. International Congress “Machines, Technologies, Materials”, Varna, Bulgaria, 19–21 September 2012; Volume 3, pp. 41–44. [Google Scholar]
- Górka, J.; Stano, S. Microstructure and Properties of Hybrid Laser Arc Welded Joints (Laser Beam-MAG) in Thermo-Mechanical Control Processed S700MC Steel. Metals 2018, 8, 132. [Google Scholar] [CrossRef]
- Górka, J. Assessment of Steel Subjected to the Thermomechanical Control Process with Respect to Weldability. Metals 2018, 8, 169. [Google Scholar] [CrossRef]
- Lahtinen, T.; Vilaça, P.; Peura, P.; Mehtonen, S. MAG Welding Tests of Modern High Strenght Steels with Minimum Yeild Stenght of 700 MPa. Appl. Sci. 2019, 9, 1031. [Google Scholar] [CrossRef]
- Rahman, M.; Albu, M.; Enzinger, N. On the Modelling of Austenite Grain Growth in Micro-Alloyed Steel S700MC. In Proceedings of the 10th International Seminar on Numerical Analysis of Weldability, Mathematical Modelling of Weld Phenomena, Schloss Seggau, Germany, 24–26 September 2012; Volume 9, pp. 623–636. [Google Scholar]
- Kik, T.; Górka, J. Numerical Simulations of Laser and Hybrid S700MC T-Joint Welding. Materials 2019, 12, 516. [Google Scholar] [CrossRef] [PubMed]
- ESI Group. Reference Manual Sysweld 2019; ESI Group: Paris, France, 2019; p. 366. [Google Scholar]
- Schmidová, E.; Bozkurt, F.; Culek, B.; Kumar, S.; Kuchariková, L.; Uhríčik, M. Influence of Welding on Dynamic Fracture Toughness of Strenx 700MC Steel. Metals 2019, 9, 494. [Google Scholar] [CrossRef]
- Spanos, G.; Fonda, R.W.; Vandermeer, R.A.; Matuszeski, A. Microstructural changes in HSLA-100 steel thermally cycled to simulate the heat-affected zone during welding. Metall. Mater. Trans. A 1995, 26, 3277–3293. [Google Scholar] [CrossRef]
- Welding of Strenx. Available online: https://ssabwebsitecdn.azureedge.net/-/media/files/en/strenx/ssab-strenx-welding-brochure-2018.pdf (accessed on 29 May 2019).

© 2019 by the authors. Licensee MDPI, Basel, Switzerland. This article is an open access article distributed under the terms and conditions of the Creative Commons Attribution (CC BY) license (http://creativecommons.org/licenses/by/4.0/).