Abstract
A method of conventional roasting pretreatment combined with ultrasonic enhanced leaching with ammonium acetate was proposed to solve the difficult problem of lead in electrolytic manganese anode mud. The effects of concentration, liquid–solid ratio, temperature, leaching time and rotating speed on the leaching process under conventional and ultrasonic conditions were studied, and the lead leaching rate can be as high as 93.09% under optimized process parameters. A leaching kinetic model under conventional and ultrasonic conditions was established to explore the restrictive links of the leaching process. The results show that the leaching process under both conventional and ultrasonic conditions is controlled by diffusion, and the activation energies are 29.40 kJ/mol and 26.95 kJ/mol for the conventional and ultrasound enhance leaching processes, respectively.
1. Introduction
Manganese and lead are important industrial raw materials that are widely used in our daily lives [1]. In the process of producing manganese, the method of carbothermal reduction smelting of electric arc furnaces is mainly used. Manganese with impurities continues to be refined by electrolytic refining [2]. However, in the electrolytic refining process, a large amount of electrolytic manganese anode mud is produced with a lead content of about 7%. During the return smelting process of electrolytic manganese anode mud, the lead evaporates first and causes the purity of manganese to decrease [3,4]. Therefore, the removal of lead from electrolytic manganese anode mud becomes the key and difficult point of utilization of electrolytic manganese anode mud. Studying the characteristics of electrolytic manganese anode mud and its resource utilization are of great significance for reducing environmental pollution and the sustainable development of the electrolytic manganese industry.
In recent years, a large amount of research has been conducted on the comprehensive utilization of electrolytic manganese anode mud. Tang et al. [5] analyzed the mineralogical characteristics of anode mud and the form of impurities in anode mud, and a method involving high-temperature volatilization is proposed to remove impurities such as Pb, Sn, and S in the anode mud. Although this method has a certain impurity removal effect, it consumes a lot of energy and pollutes the environment. Tao et al. [6] proposed the use of a mixture of dilute sulfuric acid and a small amount of NaCl (wt = 5%) to activate the anode mud and then use hydrometallurgical leaching to remove lead. Although the cost is low and the process is environmentally friendly, the efficiency is relatively low and the lead cannot be removed from the anode mud to a great extent. Hydrometallurgy is the most widely used method in extraction of non-ferrous metals. Compared with pyrometallurgy, more complex, lower grade minerals can be handled [7,8]. Moreover, there is no production of soot, which fundamentally eliminates the pollution of lead and sulfur dioxide to the surrounding environment in the hydrometallurgical recovery process. In addition, this treatment method has good development prospects due to high leaching rate and low energy consumption [9,10]. It was proved that hydrometallurgy is feasible, but more stringent experimental conditions such as high temperature and high concentration were needed. Therefore, the ultrasonic waves introduced in this paper attempt to enhance the leaching process and make the experimental conditions milder [11].
Ultrasonic waves are sound waves with special frequency [12]. The wide applications of ultrasonic waves in the field of hydrometallurgy are attributed to the cavitation effect generated from their use [13]. Shen et al. successfully improved the leaching rate of indium by employing a high temperature–ultrasonic acid leaching method, and the leaching time was decreased when there was ultrasound assistance [14]. Sayan et al. [15] found that the content of TiO2 increased by about 20% by ultrasonic leaching compared with the conventional method. Brunelli and Dabalà [16] found that the zinc leaching rate increased significantly after ultrasonic treatment in the process of zinc-containing 31.34% arc furnace soot. However, the leaching of low-grade raw materials consumes a large amount of solvent and the leaching time is too long; therefore, the introduction of ultrasound into the leaching process has important practical significance for hydrometallurgy.
In this work, roasting pretreatment combined with ultrasonic enhanced leaching of lead from electrolytic manganese anode mud was proposed to solve the difficult problem of the presence of lead in electrolytic manganese anode mud. A kinetic model was established to analyze the restrictive steps of the leaching process of lead. Studying the characteristics of electrolytic manganese anode mud and its resource utilization is of great significance for reducing environmental pollution and promoting its sustainable development.
2. Materials and Methods
2.1. Materials
The electrolytic manganese anode mud was provided by Zhongxindameng of Guangxi province Ltd. of China. Which were washed several times with an appropriate amount of sodium dodecylbenzenesulfonate. After drying at 373 K for 2 h, the raw material was transferred to an abrasive machine for 30 min, and then sieved through a 200-mesh sieve for use.
The brief chemical composition of the electrolytic manganese anode mud is shown in Table 1. As shown in Table 1, the main elemental components in the electrolytic manganese anode mud were Pb, Mn, Ca, O, S, and Fe, and the Pb content is 6.06%. X-ray diffraction (XRD, X’Pert3 powder, Sichuan, China) and scanning electron microscopy (SEM, Phenom pro.X, Sichuan, China) analysis of the raw materials are shown in Figure 1 and Figure 2, respectively. The XRD pattern of the electrolytic manganese anode mud, as shown in Figure 1, shows that the matching (mainly determined according to the peak position) contains a large number of phases, which may contain MnO2, PbSO4, CaSO4 or Fe2Mn8O16. After the corresponding peaks of different angles are matched with the standard card, the MnO2 in the electrolytic manganese anode mud should be a mixed crystal form composed of α-MnO2, β-MnO2, γ-MnO2 and δ-MnO2. In addition, its XRD pattern is turbulent, the peak shape is wide, and the crystallinity of the anode mud is not high, which indicates that the MnO2 diffraction analysis of the anode mud is based on the characteristics of the amorphous phase. It can be seen that α-MnO2, δ-MnO2, and γ-MnO2 with a space tunnel structure were adsorbed to accommodate Pb and K plasma, and formed a typical colloidal system. Figure 2 shows the surface scanning distribution of seven elements in the electrolytic manganese anode mud: Mn, S, Pb, O, Ca, and Fe. By comparing the surface scanning maps of Pb, O and S, some locally overlapping regions in the electrolytic manganese anode mud were found, indicating PbSO4 is present in the electrolytic manganese anode mud. At the same time, for Mn and O, large areas overlap, indicating many manganese oxides. Comparing the surface scanning patterns of Ca, S and O in Figure 2, similar distribution characteristics have found, indicating that CaSO4 also exists in the electrolytic manganese anode mud.

Table 1.
Elemental composition of the electrolytic manganese anode mud (wt. %).
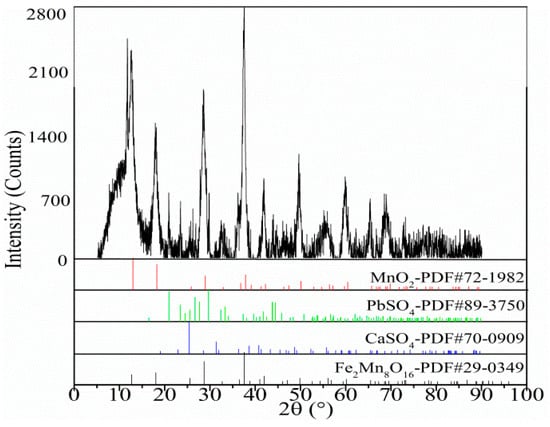
Figure 1.
X-ray diffraction (XRD) pattern of the electrolytic manganese anode mud.
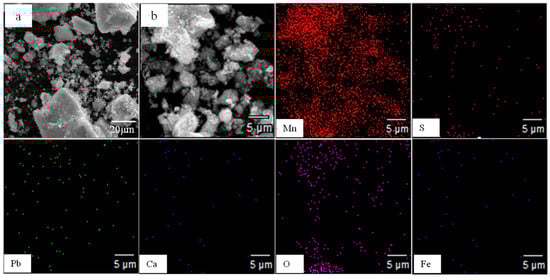
Figure 2.
Scanning electron microscopy (SEM) and element distribution map of the electrolytic manganese anode mud. (a): SEM at low magnification under conventional conditions; (b): a partial enlarged view of (a).
2.2. Experimental Procedure and Instrument
All raw materials were pretreated by conventional roasting which was carried out in a laboratory atmosphere tubular resistance furnace (SK-G06123K, Tianjin Zhonghuan Laboratory Furnace Co., Ltd., Tianjin, China). A schematic diagram of the conventional heating tubular electric furnace and the corresponding exhaust gas treatment device is shown in Figure 3.
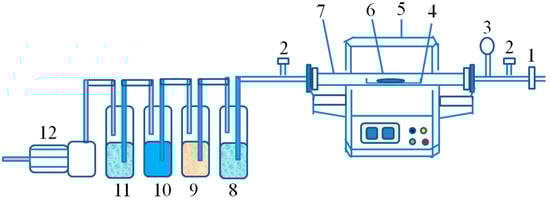
Figure 3.
Conventional roasting device (1 = intake valve; 2 = flow meter; 3 = pressure gauge; 4 = crucible; 5 = furnace; 6 = sample; 7 = quartz tube; 8 = water; 9 = ammonia solution; 10 = dilute NaOH solution; 11 = water; 12 = small vacuum pump).
The pretreated electrolytic manganese anode mud was subjected to a leaching experiment in a 250 mL beaker at a constant rate of 300 rpm in a water bath. Ultrasonic waves were introduced for enhanced leaching. The ultrasonic equipment (SKTC-500, Nanjing Ningkai Instrument Co., Ltd., Nanjing, China) was selected from the domestic SKTC-500 model and the frequency was 19 kHz to 20.5 kHz. The 15 g of pretreated electrolytic manganese anode mud and the ammonium acetate leaching solution having a concentration of 1–3 mol/L, and are added to the container at a liquid to solid ratio of 7:1–11:1. When the magnetic stirring begins, the leaching experiment begins. The other instruments used in the experiment were a 78HW-3 thermostatic magnetic stirrer (Yuhua Instrument Co., Ltd., Gongyi, China) with a temperature of 298–353 K, a vacuum drying oven (101A-3, Chongming Experimental Instrument Factory, Shanghai, China) and a SHZ-3 water circulation vacuum pump (Yuhua Instrument Co., Ltd., Gongyi, China). Figure 4 shows the connection diagram of the ultrasonic experimental device.
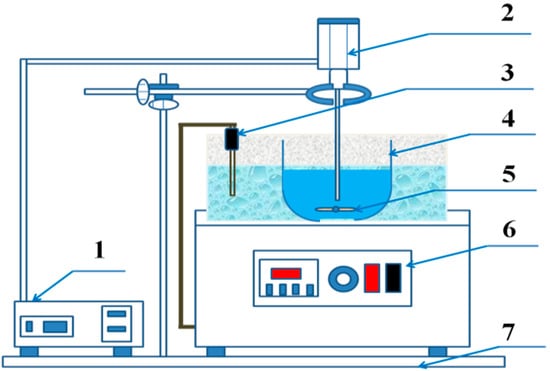
Figure 4.
Connection diagram of experimental device (1 = ultrasonic generator console; 2 = ultrasonic radiation rod; 3 = thermocouple; 4 = beaker; 5 = magnetic rotor; 6 = water bath control panel; 7 = support frame).
2.3. Calculation of Lead Leaching Rate
The electrolytic manganese anode mud was filtered after leaching to obtain filter residues, the filter residues were analyzed to obtain lead content, and the lead leaching rate was calculated as follows:
where w1 is lead content in electrolytic manganese anode mud, wt. %; w2 is lead content in the filter residue, wt. %; m1 is the mass of the electrolytic manganese anode mud, g; m2 is the mass of the filter residues after drying; and ηpb is the leaching rate of lead.
3. Results and Discussion
3.1. Roasting Pretreatment Experienment
The pretreatment of electrolytic manganese anode mud by roasting at different temperatures in a tubular resistance furnace was studied. Nitrogen gas was introduced into the tubular resistance furnace at a rate of 100 L/h, feeding 500 g each time, and the heating rate was controlled at 288 K/min, and maintained at the specified temperature for 30 min. Under the conditions of leaching temperature at 333 K, ammonium acetate concentration at 2 mol/L, liquid–solid ratio fixed at 10:1, and rotating speed at 300 rpm, the leaching experiments were carried out. The results (Figure 5) show that the leaching rate of lead in electrolytic manganese anode mud pretreated by roasting is obviously higher than that in a non-roasting process. The lead leaching rate was only 25.98% in 100 min under unroasted conditions, while the leaching rate of manganese anode mud was increased to 88.87% when the electrolytic manganese anode mud was pretreated by 1123 K roasting. It can be seen that roasting significantly promotes the process of lead leaching in electrolytic manganese anode mud. This is mainly because the electrolytic manganese anode mud is heated to promote the thermal stress between the useful mineral and the gangue, causing cracks in the mineral particles. The dissociation effect that is difficult to achieve by the conventional calcination method is achieved, the reaction area of the useful mineral interface is increased, and the reaction contact area with the leaching solvent is increased [17,18]. Considering the relationship between leaching rate and economy, the subsequent leaching experiments were carried out under the premise of 1123 K high temperature roasting pretreatment.
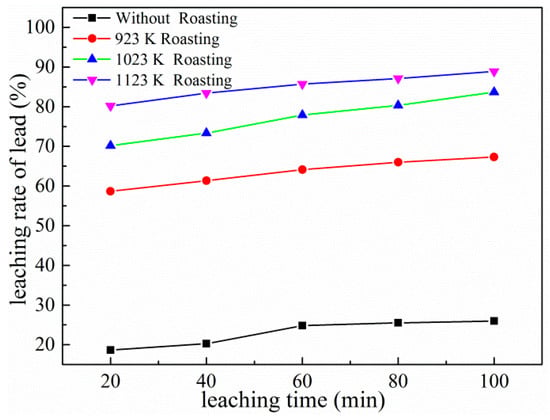
Figure 5.
Effects of roasting pretreatment on leaching of lead.
3.2. Characterization of Roasted Electrolytic Manganese Anode Mud
X-ray diffraction (XRD) and Scanning Electron Microscope Energy with Dispersive Spectrometer (SEM-EDS) analysis of the electrolytic manganese anode mud after roasting were carried out to investigate the effect of roasting pretreatment on the leaching process. Figure 6 shows the XRD spectra of the 1123 K roasted electrolytic manganese anode mud. It can be seen from Figure 6 that the characteristic peaks of MnO2 are missing, and characteristic peaks of Mn2O3 and Mn3O4 appear, indicating that a phase transformation of the electrolytic manganese anode mud occurs after 1123 K high temperature roasting. Figure 7 shows the morphologies of the 1123 K roasting electrolytic manganese anode mud. In addition, the element distribution of Mn, Pb, S, O, Fe and Ca in the corresponding regions is determined by element mapping. As shown in Figure 7, the dense structure, in which the materials exist in the mineral phase, is destroyed. Moreover, compared with the multi-block results of the raw materials, the electrolytic manganese anode mud exhibits a loose agglomeration phenomenon after the roasting pretreatment. It can be seen that the Pb, S and O elements have similar distribution characteristics, which can be considered as PbSO4. Mn, Fe and O elements have the same distribution characteristics in the local region, which means that MnFeO2 exists in the locally distributed region. Ca, S, O elements shows good distribution characteristics, indicating the presence of a small amount of CaSO4 in the electrolytic manganese anode mud.
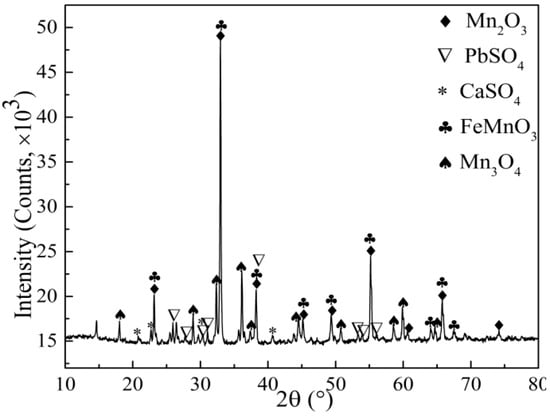
Figure 6.
XRD of 1123 K roasted electrolytic manganese anode mud.
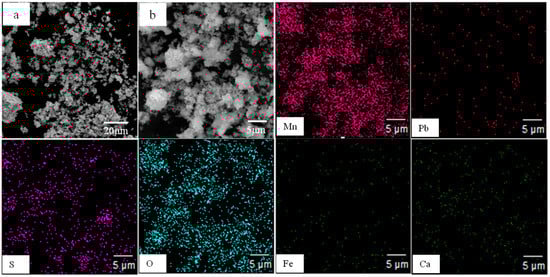
Figure 7.
SEM and element distribution map of 1123 K roasted electrolytic manganese anode mud. (a): SEM at low magnification under conventional conditions; (b): a partial enlarged view of (a).
It is concluded that the main reasons for poor lead removal following the leaching process of unroasted anode mud are as follows: (1) there is space resistance between Ac− and anode mud in solution, which causes Ac− and the impurities encapsulated in anode mud (Pb2+, Pb4+) to not fully complex, affecting the leaching effect of lead [19]; (2) lead in the anode mud participates in the lattice composition of manganese oxide, and its bond energy is greater than the binding force of Pb and Ac−. Lead was released from the crystal lattice of the mud following pretreatment with 1123 K roasting, and the main impurity element is taken from the anode. At the same time, MnO2 is transformed into the finer Mn2O3 and Mn3O4, which promote lead leaching [20].
3.3. Effects of Ammonium Acetate Concentration
The concentration of the leaching reagent is an important factor affecting the leaching rate during the leaching process [21]. The higher the initial concentration, the greater the leaching speed. Figure 8 shows the effect of different ammonium acetate concentrations on the leaching rate of lead under conventional and ultrasonic conditions. The leaching process conditions are as follows: the reaction temperature of 353 K, the reaction time is 60 min, the rotating speed is 300 rpm, ultrasonic power is fixed at 450 W and the liquid–solid ratio is fixed at 8:1. It can be seen from Figure 8 that the lead leaching rate increases significantly with the increase of ammonium acetate concentration under both conventional and ultrasonic conditions. When the ammonium acetate concentration is 2 mol/L, the lead leaching rate reaches a large value of 78.62%, which is 27.68% higher than the ammonium acetate concentration of 1 mol/L in 60 min under conventional conditions. Moreover, the leaching rate is 10% higher than the conventional conditions under ultrasonic conditions on average. This is because the cavitation effect of the ultrasonic waves breaks up the solid particles of the reactants, increases the specific surface area of the reaction, and increases the mass transfer rate, which is beneficial to the leaching reaction and improves the leaching rate [22]. Considering the relationship between the cost of ammonium acetate and the leaching rate, the ammonium acetate concentration was selected as 2 mol/L as a parameter for subsequent experiments.
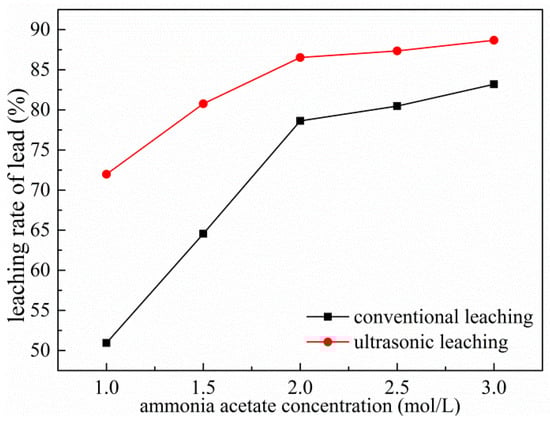
Figure 8.
Effects of ammonium acetate concentration on leaching of Pb.
3.4. Effects of Liquid to Solid Ratio
The liquid–solid ratio of the leaching pulp affects both the leaching reagent consumption and the viscosity of the slurry, thereby affecting the leaching efficiency and subsequent treatment [23]. The viscosity of the minerals can be reduced by increasing the liquid–solid ratio, which is beneficial to slurry mixing, transportation, and solid–liquid separation. Under the conditions of ammonium acetate concentration 2 mol/L, leaching temperature 353 K, leaching time 60 min, rotating speed 300 rpm, and ultrasonic power fixed at 450 W, the effects of different liquid–solid ratios on lead leaching were investigated. The results are shown in Figure 9. It can be seen from Figure 9 that the lead leaching rate increases with the increase of the liquid–solid ratio. The lead leaching rate increases from 72.14% to 87.94% under conventional conditions, while it increases from 80.13% to 94.98% under ultrasonic conditions when the liquid–solid ratio increases from 7:1 to 10:1. Under same leaching conditions, ultrasonic leaching performed better than conventional leaching in terms of leaching effect: when the liquid–solid ratio is 10:1, the leaching rate of Pb under ultrasonic conditions is 94.98% which is 7% higher than that of conventional conditions, and even more higher than the conventional leaching of liquid–solid ratio of 11:1 (89.61%). It indicates that the introduction of ultrasonic waves can improve the leaching rate while reducing the liquid–solid ratio of the leaching process. A high liquid–solid ratio in the leaching process required more sophisticated apparatus [24]. Therefore, 10:1 was chosen as the parameter of the subsequent experiment by considering apparatus requirements and the efficiency of material processing.
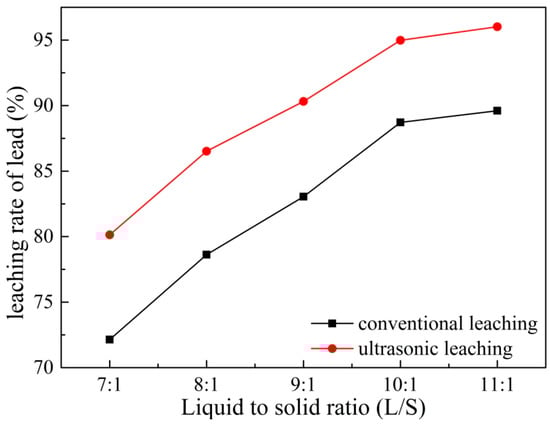
Figure 9.
Effects of liquid to solid ratio on leaching of Pb.
3.5. Effect of Temperature
The effect of different reaction temperatures on lead leaching was investigated under the conditions of ammonium acetate concentration of 2 mol/L, liquid–solid ratio of 10:1, leaching time of 60 min, rotating speed of 300 rpm and ultrasonic power fixed at 450 W. The results are shown in Figure 10. It can be seen from Figure 10 that the leaching rate of Pb reaches 91.23% under the ultrasonic condition of 333 K, even higher than the leaching rate of 353 K for conventional leaching. This is mainly because the ultrasonic cavitation effect enhances the mass transfer effect and the activity of the various substances in the reactants. Therefore, the introduction of ultrasonic waves can increase the leaching rate and lower the reaction temperature. When the temperature increases to 343 K, the lead leaching rate increases slowly, about 1%. The reaction temperature significantly accelerates the diffusion and mass transfer effects, accelerates the progress of the reaction, and maximizes the dissolution of lead in a relatively short period of time, while avoiding the adverse effects of low leaching rate due to rapid evaporation of the leaching agent with increasing temperature [25]. While the other process parameters are optimized, taking the impact of energy consumption and environment into consideration, 343 K is preferred for subsequent leaching.
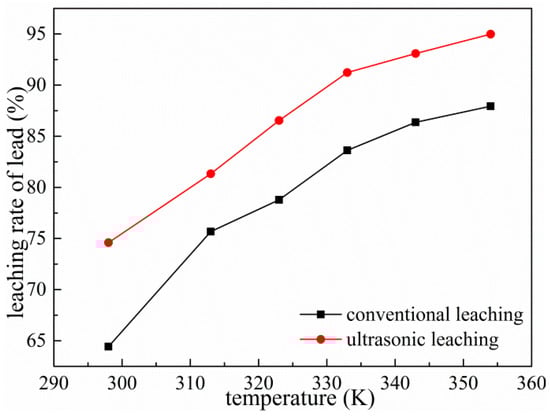
Figure 10.
Effects of temperature on leaching of Pb.
3.6. Effects of Leaching Time
The effect of leaching time on the leaching rate of lead was studied under conventional and ultrasonic conditions with an ammonium acetate concentration of 2 mol/L, a rotating speed of 300 r/min, a leaching temperature of 343 K, a liquid–solid ratio fixed at 10:1 and ultrasonic power fixed at 450 W. The result is shown in Figure 11. The leaching rate of lead increased from 80.34% to 88.05% in the process of increasing the reaction time from 20 min to 100 min under conventional conditions. The leaching rate at 20 min under ultrasonic conditions was 87.03%, which higher than the leaching rate at 60 min under conventional conditions. The lead leaching rate did not increase significantly when the leaching time was extended to 60 min. Considering the extension of the leaching time, the energy consumption is increased, and the conventional leaching time is selected as 60 min.
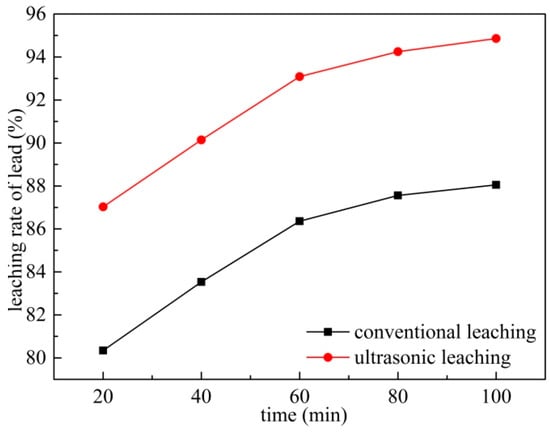
Figure 11.
Effects of leaching time on leaching of Pb.
3.7. Effect of Rotating Speed
Under the experimental conditions of rotation speed (reaction temperature of 343 K, reaction time of 60 min, liquid–solid ratio of 10:1, leaching solution concentration of 2 mol/L, rotating speed is 300 rpm and ultrasonic power fixed at 450 W), the effect of rotor speed was studied. The result shown in Figure 12 reveals that the leaching rate of Pb increased from 43.14% to 78.67% under conventional conditions when the rotational speed increased from 0 rpm to 200 rpm. The leaching rate of Pb under ultrasonic conditions is always higher than that of conventional conditions; even the leaching rate of lead under the ultrasonic condition with rotational speed of 200 rpm is similar to the conventional of 300 rpm. When the rotating speed increases to 300 rpm, the lead leaching rate increases slowly, about 2%. Therefore, 300 rpm was selected to be used in the subsequent experiments.
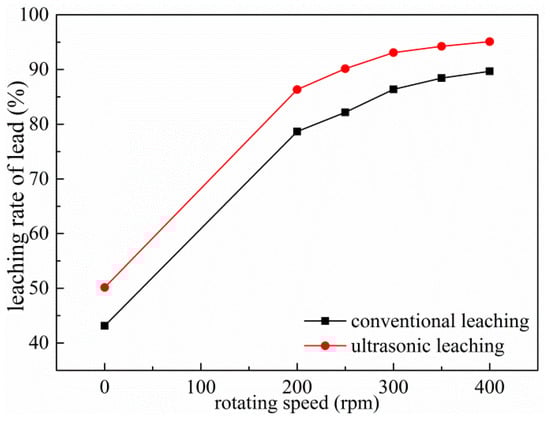
Figure 12.
Effects of rotating speed on leaching of Pb.
3.8. Effect of Ultrasonic Power
Under the conditions of ammonium acetate concentration of 2 mol/L, liquid–solid ratio fixed at 10:1, reaction temperature of 343 K, leaching time of 60 min and rotating speed of 300 rpm, the effects of varying ultrasonic power on the leaching rate of Pb were investigated. As shown in Figure 13, the lead leaching rate increases significantly with the increase of ultrasonic power. Compared with leaching without ultrasonication, the introduction of ultrasonic power is very favorable for the lead leaching rate. The lead leaching rate is 86.36% under conventional optimal conditions, while it can reach 90.13% under ultrasonic conditions when the ultrasonic power is 150 W. As the ultrasonic power increases from 150 W to 450 W, the lead leaching rate increases by about 4%. When the ultrasonic power exceeds 450 W, the increase of ultrasonic power has no effect on the leaching rate of lead. Due to the cavitation effect of the ultrasonic wave, the shock wave generated by the cavitation effect and the mechanical effect of the leaching agent on the mineral surface to generate high-speed jet, micro-jet, impinging flow, etc., cause macroscopic turbulence of the leaching agent and high-speed collision between the solid particles. This is aggravated by the eddy current diffusion and peeling and erosion at the interface of the liquid–solid phase reaction, further rapidly refreshing and activating the interface of the useful reaction minerals and accelerating the dissolution rate of lead [26,27]. On the other hand, the micro-jet and shock waves caused by ultrasound are perturbed in the mineral porous medium so that the leaching agent diffuses into the pores and the efficiency of the useful minerals is intensified, thereby achieving the purpose that conventional stirring struggles to achieve—that the lead leaching rate is increased in a shorter time [28].
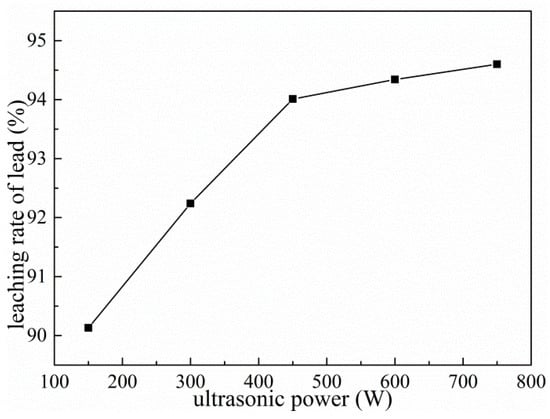
Figure 13.
Effects of ultrasonic power on leaching of Pb.
3.9. Characterization of Leaching Residue
XRD and SEM-EDS analysis were carried out on lead leaching residues under conventional and ultrasonic conditions to further clarify the ultrasonic enhanced leaching effect of lead in electrolytic manganese anode mud. Figure 14 compares the phase structure of leaching residues under the conditions of ammonium acetate concentration of 2 mol/L, liquid–solid ratio fixed at 10:1, reaction temperature of 343 K, leaching time of 60 min, rotating speed of 300 rpm and ultrasonic power fixed at 450 W. It can be found that PbSO4 and CaSO4 have been dissolved, and their characteristic peaks disappeared. The chemical reactions are shown in (2) to (4). Ammonium acetate is a strong electrolyte which is completely ionized in water. Calcium sulfate is a micro-soluble substance. Ammonium sulfate is formed by micro-ionizing SO42− and NH4+ in water. Therefore, it promotes the ionization of calcium sulfate and makes the reaction shown in (4), and the solubility of calcium sulfate increases. Figure 15a,c shows the morphologies of leaching residue after optimized conventional leaching and ultrasonic leaching, respectively. Figure 15c shows that the ultrasonic leaching residue cracks are more obvious after ultrasonic leaching and are also much finer than the leaching residues under conventional conditions. The result indicates that the fine particles can be broken by the action of ultrasonic waves, and the surface of the mineral can be stripped to form a large number of voids, further promoting the rapid diffusion of leaching agent molecules and achieving enhanced leaching of lead [29,30]. At the same time, only Mn, O and Fe are left in the anode mud, and there are no Pb and S elements. It is concluded that the removal effect of lead is remarkable under optimum leaching conditions.
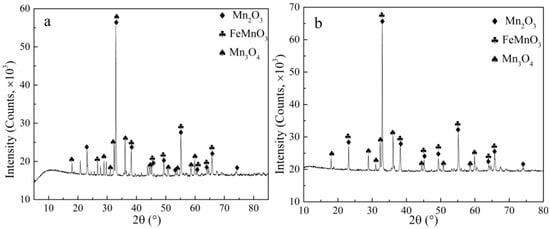
Figure 14.
XRD of leaching residues under conventional and ultrasonic conditions. (a): XRD at conventional conditions; (b): XRD at ultrasonic conditions.
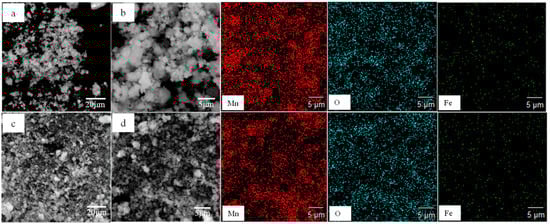
Figure 15.
SEM and element distribution map of leaching residues under conventional and ultrasonic conditions. (a): SEM at low magnification under conventional conditions; (b): a partial enlarged view of (a); (c): SEM at low magnification under ultrasonic conditions; (d): a partial enlarged view of (c).
The results of particle size analysis of lead leaching residues obtained under conventional and ultrasonic leaching conditions are shown in Figure 16. It can be seen that under conventional conditions, the particle size is mainly distributed in the range of 10–100 μm (see Figure 16a), and Figure 16b shows that the particle size distribution is between 10–65 μm under ultrasonic conditions. The average particle diameter volume under conventional conditions was 24.303 μm, and the average particle diameter volume of the lead leaching residue obtained under ultrasonic enhanced leaching conditions was 13.622 μm. The results show that the ultrasonic leaching process can actually refine the grains and facilitate the leaching process.
PbSO4 + 2NH4Ac = Pb(Ac)2 + (NH4)2SO4
CH3COONH4 = CH3COO− + NH4+
CaSO4 = Ca2+ + SO42−
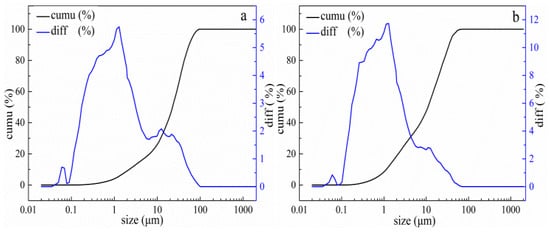
Figure 16.
Size distribution of lead residues under conventional and ultrasonic conditions. (a): under conventional conditions, (b): under ultrasonic conditions. (cumu is the cumulative distribution of granularity; diff is difference distribution of granularity).
3.10. Kinetic Analysis of the Leaching Process
The leaching process of electrolytic manganese anode mud particles belongs to the liquid–solid phase reaction, and the leaching reaction process may be controlled by the following steps: (1) diffusion of the leaching agent reactant or product through the liquid boundary layer; (2) leaching agent reactant or product diffuses through the internal diffusion of the solid product layer; (3) chemical reaction of the leaching agent reactant with the surface of the unreacted nuclear material; (4) mixing of the solid film layer and the interface chemical reaction [31].
Combined with XRD and SEM analysis, the morphology of the electrolytic manganese anode mud particles is irregular, and the particle composition is relatively complicated. There are manganese oxide particles, lead manganese oxide particles, and lead is encapsulated in its crystal lattice in the form of PbSO4. During the leaching process, the leaching agent diffuses into the voids or cracks of the gangue and reacts with the electrolytic manganese anode mud. As the reaction proceeds, the reaction interface continuously shrinks to the center of the lead-containing mineral particles [32,33]. Therefore, an attempt was made to explore the dynamic behavior of lead leaching in electrolytic manganese anode mud using a reduced nuclear model. Figure 17 shows a simulation of the leaching process.
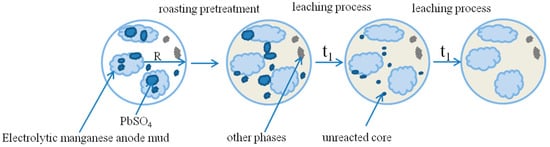
Figure 17.
Sketch of the unreacted shrinking core model. (t1 is reaction time).
According to the shrinkage nucleus model, when the solid–liquid phase reaction is controlled by the interface chemical reaction, the leaching kinetic equation of lead in electrolytic manganese anode mud can be expressed as [34,35]:
where kr is the solid–liquid phase interface chemical reaction rate constant; x is electrolytic manganese anode mud lead leaching rate; t is the leaching time.
kr·t = 1 − (1 − x)1/3
When the solid–liquid phase reaction is controlled by the diffusion reaction, the leaching kinetic equation of lead in electrolytic manganese anode mud can be expressed as [34]:
where kd is the solid–liquid phase reaction diffusion rate constant; x is the lead leaching rate of the electrolytic manganese anode mud; t is the leaching time.
kd·t = 1 − 2/3x − (1 − x) 2/3
In addition, when the solid–liquid phase reaction is simultaneously controlled by the diffusion reaction and the interfacial chemical reaction, the leaching kinetic equation of lead in electrolytic manganese anode mud can be expressed as [36,37]:
where k0 is the reaction rate constant of solid–liquid phase mixing control; x is the lead leaching rate of electrolytic manganese anode mud; t is the leaching time.
k0·t = 1/3ln(1 − x) − [1 − (1 − x)−1/3]
The experimental data of the effects of different reaction temperatures on the lead leaching efficiency of electrolytic manganese anode mud under conventional and ultrasonic conditions are taken into Equations (5)–(7) respectively, and the curves are plotted against time. The results are shown in Figure 18, Figure 19 and Figure 20, which show a graph showing the lead leaching process controlled by interface chemical reaction, diffusion control, and mixing control, respectively.
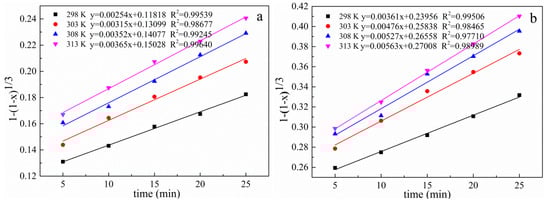
Figure 18.
Plot of 1 − (1 − x)1/3 versus time for different temperatures under conventional and ultrasonic conditions. (a): under conventional conditions; (b): under ultrasonic conditions.
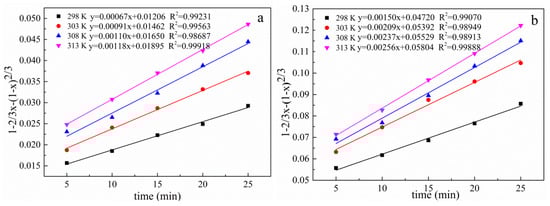
Figure 19.
Plot of 1 − 2/3 x − (1 − x) 2/3 versus time for different temperatures under conventional and ultrasonic conditions. (a): under conventional conditions; (b): under ultrasonic conditions.
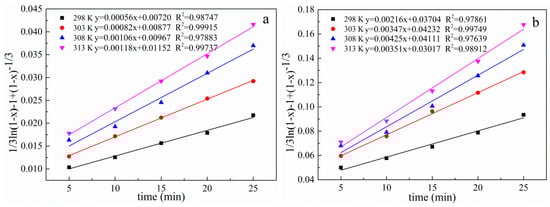
Figure 20.
Plot of 1/3ln(1 − x) − 1 + (1 − x)−1/3 versus time for different temperatures under conventional and ultrasonic conditions. (a): under conventional conditions; (b): under ultrasonic conditions.
The data of lead leaching rate at different temperatures under conventional and ultrasonic conditions are fitted as shown in Table 2 and Table 3 when the lead leaching process is controlled by interface chemical reaction control, diffusion control and mixing control. The correlation coefficient of the diffusion model under conventional and ultrasonic conditions are all greater than 0.98687 and 0.98913, respectively. The comparison shows that the diffusion control model fits the correlation coefficient significantly better than the interface chemical reaction and the hybrid control model, both under conventional and ultrasonic conditions. Therefore, the electrolytic manganese anode mud leaching process is controlled by a diffusion model. Since the leaching is controlled by diffusion, the introduction of the ultrasonic wave can refine the reaction particles on the one hand, and on the other hand, the so-called ultrasonic cavitation effect generate a high temperature of 5000 K or more in a very short time and a very small space around the cavitation bubble, a high pressure about 5 × 10⁷ Pa accompanied by a strong shock wave, and its mechanical effect makes the liquid strongly agitate. These processes are beneficial to the diffusion process, so the introduction of ultrasonic waves can enhance the effect of leaching. Increasing leaching temperature and the liquid to solid ratio are favorable for increasing leaching rate [38].
Table 2.
Correlation coefficient of diffusion control and interface chemical reaction control at different temperatures under conventional conditions.
Table 3.
Correlation coefficient of diffusion control and interface chemical reaction control at different temperatures under ultrasonic conditions.
The direct slopes of the different fits in Figure 21 are the reaction rate constants k at different reaction temperatures, according to the Arrhemus empirical equation [39]:
where Ea is the activation energy of the reaction, kJ/mol; A is the frequency factor, constant; T is the temperature, K; R is the gas constant, 8.314 × 10⁻³ kJ/(mol·K).
k = A·exp(−Ea/RT)
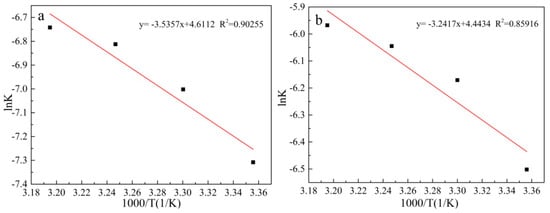
Figure 21.
Arrhenius curve obtained for 1/3ln(1 − x) − 1 − (1 − x)−1/3 model under conventional and ultrasonic conditions. (a): under conventional conditions; (b): under ultrasonic conditions.
We take the logarithm of the two sides of Equation (6) to get the relationship between lnk and 1/T:
lnk is plotted against 1/T, and the result is shown in Figure 21. The initial apparent activation energy of the electrolytic manganese anode mud leaching lead under conventional and ultrasonic conditions are 29.40 kJ/mol and 26.95 kJ/mol, respectively. The results show that although both conventional and ultrasonic leaching conditions are controlled by diffusion, the activation energy required for the leaching process is low when the ultrasonic wave is introduced, and the reaction speed is fast.
lnk = lnA − Ea/RT
4. Conclusions
In this paper, roasting combined with ultrasonication enhanced the extraction of lead from electrolytic manganese anode mud, and the conclusions are as follows:
(1) The high temperature roasting of electrolytic manganese anode mud has a significant effect on the subsequent lead leaching process. Its dense structure is destroyed, which provides a convenient channel for the leaching and migration of lead ions, and the leaching rate is increased by nearly 65%.
(2) The leaching rate is 86.36% under the optimal conventional conditions as follows: ammonium acetate concentration of 2 mol/L, leaching temperature of 343 K, leaching time of 60 min and the liquid–solid ratio fixed at 10:1. The introduction of ultrasonic waves effectively strengthens the lead leaching process, the leaching rate of Pb was 93.09% which was about 7% higher than that under the optimal conventional conditions when the ultrasonic experiment has the same parameters.
(3) The leaching process of lead in ammonia acetate and the electrolytic manganese anode mud is a liquid–solid two-phase chemical reaction, and the leaching process is carried out by diffusion control. The activation energies are 29.40 kJ/mol and 26.95 kJ/mol for the conventional and ultrasound enhanced leaching processes, respectively. Increasing leaching temperature and the liquid to solid ratio are favorable for increasing leaching rate. The apparent activation energy of the nuclear kinetic model is 26.95 kJ/mol.
(4) The experimental results in this paper provide a more efficient and comprehensive approach for the leaching of lead from electrolytic manganese anode mud, which is expected to promote the resource utilization of electrolytic manganese anode mud.
Author Contributions
Conceptualization, H.X. and S.L.; methodology, H.X.; software, H.X.; validation, H.X. and S.L.; formal analysis, H.X.; investigation, H.X.; resources, H.X.; data curation, H.X.; writing—original draft preparation, H.X.; writing—review and editing, Y.W. and H.L.; visualization, H.X.; supervision, S.L.; project administration, S.L.; funding acquisition, L.Z.
Funding
This research was funded by National Natural Science Foundation of China, grant number 51604135.
Conflicts of Interest
The authors declare no conflict of interest.
References
- Duan, N.; Dan, Z.; Wang, F. Electrolytic manganese metal industry experience based China’s new model for cleaner production promotion. J. Clean. Prod. 2011, 19, 2082–2087. [Google Scholar] [CrossRef]
- Lee, W.; Lee, J.W. Concurrent production of carbon monoxide and manganese (II) oxide through the reaction of carbon dioxide with manganese. ACS Sustain. Chem. Eng. 2014, 2, 1503–1509. [Google Scholar] [CrossRef]
- Du, B.; Zhou, C.; Dan, Z. Preparation and characteristics of steam-autoclaved bricks produced from electrolytic manganese solid waste. Constr. Build. Mater. 2014, 50, 291–299. [Google Scholar] [CrossRef]
- Arnott, J.B.; Williams, R.P.; Pandolfo, A.G. Microporosity of heat-treated manganese dioxide. J. Clean. Prod. 2007, 165, 581–590. [Google Scholar] [CrossRef]
- Tang, J.G.; He, Z.C. Investigation on process mineralogy of manganese anode slime and impurity removal. Min. Metall. 2005, 4, 75–78. [Google Scholar]
- Tao, C.Y.; Li, D.H.; Liu, Z.H. Activation and purification of electrolytic-manganese anode slime and its application. Battery Bimon. 2011, 41, 121–124. [Google Scholar]
- Ye, L.G.; Tang, C.B.; Chen, Y. One-step extraction of antimony from low-grade stibnite in Sodium Carbonate-Sodium Chloride binary molten salt. J. Clean. Prod. 2015, 93, 134–139. [Google Scholar] [CrossRef]
- Fleming, C.A. Hydrometallurgy of precious metals recovery. Hydrometallurgy 1992, 30, 127–162. [Google Scholar] [CrossRef]
- Duan, C.X.; Li, F.; Yang, M.H.; Zhang, H. Rapid Synthesis of hierarchically structured multifunctional Metal-Organic zeolites with enhanced volatile organic compounds adsorption capacity. Ind. Eng. Chem. Res. 2018, 57, 15385–15394. [Google Scholar] [CrossRef]
- Leclerc, N.; Meux, E.; Lecuire, J.M. Hydrometallurgical extraction of zinc from zinc ferrites. Hydrometallurgy 2003, 70, 175–183. [Google Scholar] [CrossRef]
- Li, L.; Zhai, L.; Zhang, X. Recovery of valuable metals from spent lithium-ion batteries by ultrasonic-assisted leaching process. J. Power Sources 2014, 262, 380–385. [Google Scholar] [CrossRef]
- Cravotto, G.; Gaudino, E.C.; Cintas, P. On the mechanochemical activation by ultrasound. Chem. Soc. Rev. 2013, 42, 7521–7534. [Google Scholar] [CrossRef] [PubMed]
- Zhang, R.L.; Zhang, X.F.; Tang, S.Z. Ultrasound-assisted HCl-NaCl leaching of lead-rich and antimony-rich oxidizing slag. Ultrason. Sonochem. 2015, 27, 187–191. [Google Scholar] [CrossRef] [PubMed]
- Shen, X.; Li, L.; Wu, Z. Ultrasonic-Assisted Acid Leaching of Indium from Blast Furnace Sludge. Metal. Mater. Trans. B 2013, 44, 1324–1328. [Google Scholar] [CrossRef]
- Şayan, E.; Bayramoğlu, M. Statistical modeling and optimization of ultrasound-assisted sulfuric acid leaching of TiO2, from red mud. Hydrometallurgy 2004, 71, 397–401. [Google Scholar]
- Brunelli, K.; Dabalà, M. Ultrasound effects on zinc recovery from EAF dust by sulfuric acid leaching. Int. J. Min. Met. Mater. 2015, 22, 353–362. [Google Scholar] [CrossRef]
- Yang, C.; Li, J.; Tan, Q. Green Process of Metal Recycling Coprocessing Waste Printed Circuit Boards and Spent Tin Stripping Solution. ACS Sustain. Chem. Eng. 2017, 5, 3524–3534. [Google Scholar] [CrossRef]
- Dai, Y.; Li, J.H.; Peng, Y. Supporting Information: Effects of MnO2 Crystal Structure and Surface Property on the NH3-SCR Reaction at Low Temperature. Acta Phys.-Chim. Sin. 2012, 28, 1–2. [Google Scholar]
- Rao, K.S.; Narayana, K.L.; Swamy, K.M. Influence of ultrasound in ammoniacal leaching of a copper oxide ore. Metal. Mater. Trans. B 1997, 8, 721–723. [Google Scholar] [CrossRef]
- Xi, X. Crystal structure preparation and discharge performancefor manganese dioxides and related manganese oxides (I). Battery Bimon. 2004, 34, 411–414. [Google Scholar]
- Wang, Z.; Chen, D. Thermodynamic Analysis of Common Regularities for Gold Chlorination Leaching Systems. Chin. J. Rare Met. 2006, 30, 703–706. [Google Scholar]
- Li, H.Y.; Li, S.W.; Peng, J.H. Ultrasound Augmented leaching of nickel sulfate in sulfuric acid and hydrogen peroxide media. Ultrason. Sonochem. 2017, 40, 1021–1030. [Google Scholar] [CrossRef] [PubMed]
- Nizamani, S.; Kazi, T.G.; Afridi, H.I. Ultrasonic-energy enhance the ionic liquid-based dual microextraction to preconcentrate the lead in ground and stored rain water samples as compared to conventional shaking method. Ultrason. Sonochem. 2018, 40, 265–270. [Google Scholar] [CrossRef]
- Zhang, L.; Guo, W.; Peng, J. Comparison of ultrasonic-assisted and regular leaching of germanium from by-product of zinc metallurgy. Ultrason. Sonochem. 2016, 31, 143–149. [Google Scholar] [CrossRef]
- Salim, O.M.; Mahir, I.; Mahmut, B. Leaching of silver from solid waste using ultrasound assisted thiourea method. Ultrason. Sonochem. 2005, 12, 237–242. [Google Scholar]
- Akçay, M.; Elik, A.; Savaşcı, Ş. Effect of ultrasonication on extraction rate and on recovery of strontium from river sediment using flame atomic absorption spectrometry. Analyst 1989, 114, 1079–1082. [Google Scholar] [CrossRef]
- Chang, J.; Zhang, E.D.; Zhang, L.B. A comparison of ultrasound-augmented and conventional leaching of silver from sintering dust using acidic thiourea. Ultrason. Sonochem. 2017, 34, 222–231. [Google Scholar] [CrossRef]
- Capelo, J.L.; Lavilla, I.; Bendicho, C. Ultrasonic extraction followed by sonolysis-ozonolysis as a sample pretreatment method for determination of reactive arsenic toward sodium tetrahydroborate by flow injection-hydride generation AAS. Anal. Chem. 2001, 73, 3732–3736. [Google Scholar] [CrossRef] [PubMed]
- Huang, C.C.; Ger, M.D.; Chen, S.I. Study on Thermal Decomposition of Pentolites by modified vacuum stability apparatus and differential scanning calorimetry. Propell. Explos. Pyrot. 1992, 17, 254–259. [Google Scholar] [CrossRef]
- He, S.; Wang, J.; Yan, J. Pressure leaching of high silica Pb–Zn oxide ore in sulfuric acid medium. Hydrometallurgy 2010, 104, 235–240. [Google Scholar] [CrossRef]
- Salinas-Rodríguez, E.; Hernández-Ávila, J.; Rivera-Landero, I. Leaching of silver contained in mining tailings, using sodium thiosulfate: A kinetic study. Hydrometallurgy 2016, 160, 6–11. [Google Scholar] [CrossRef]
- Wei, Y.S.; Li, X.H.; Chen, M.A. Kinetics comparison of oxidizing acid leading and conventional acid leading of indium sulfide. Met. Mine 2014, 43, 165–170. [Google Scholar]
- Liu, W.; Tang, M.T. Dissolution kinetics of low grade complex copper ore in ammonia-ammonium chloride solution. Trans. Nonferrous Met. Soc. China 2010, 20, 910–917. [Google Scholar] [CrossRef]
- Yang, S.H.; Hao, L.I.; Sun, Y.W. Leaching kinetics of zinc silicate in ammonium chloride solution. Trans. Nonferrous Met. Soc. China 2016, 26, 1688–1695. [Google Scholar] [CrossRef]
- Dickinson, C.F.; Heal, G.R. Solid-liquid diffusion controlled rate equations. Thermochim. Acta 1999, 340, 89–103. [Google Scholar] [CrossRef]
- Ding, Z.Y.; Yin, Z.L.; Hu, H.P. kinetics of zinc silicate (hemimorphite) in ammoniacal solution. Hydrometallurgy 2010, 104, 201–206. [Google Scholar] [CrossRef]
- Rao, S.; Yang, T.Z.; Zhang, D.C. Leaching of low grade zinc oxide ores in NH4Cl-NH3, solutions with nitrilotriacetic acid as complexing agents. Hydrometallurgy 2015, 158, 101–106. [Google Scholar] [CrossRef]
- Kim, E.; Horckmans, L.; Spooren, J. Selective leaching of Pb, Cu, Ni and Zn from secondary lead smelting residues. Hydrometallurgy 2017, 169, 372–381. [Google Scholar] [CrossRef]
- Popescu, I.A.; Varga, T.; Egedy, A. Kinetic models based on analysis of the dissolution of copper, zinc and brass from WEEE in a sodium persulfate environment. Comput. Chem. Eng. 2015, 83, 214–220. [Google Scholar] [CrossRef]
© 2019 by the authors. Licensee MDPI, Basel, Switzerland. This article is an open access article distributed under the terms and conditions of the Creative Commons Attribution (CC BY) license (http://creativecommons.org/licenses/by/4.0/).