Abstract
When the weldability of high strength steels is analyzed, it is the softening in the heat-affected zone (HAZ) that is mostly investigated, and the reduction of toughness properties is generally less considered. The outstanding toughness properties of quenched and tempered high strength steels cannot be adequately preserved during the welding due to the unfavorable microstructural changes in the HAZ. Relevant technological variants (t8/5 = 2.5–100 s) for arc welding technologies were applied during the HAZ simulation of S960QL steel (EN 10025-6) in a Gleeble 3500 physical simulator, and the effect of cooling time on the critical HAZ areas of single and multipass welded joints was analyzed. Thermal cycles were determined according to the Rykalin 3D model. The properties of the selected coarse-grained (CGHAZ), intercritical (ICHAZ) and intercritically reheated coarse-grained (ICCGHAZ) zones were investigated by scanning electron microscope, macro and micro hardness tests and instrumented Charpy V-notch pendulum impact tests. The examined HAZ subzones indicated higher sensitivity to the welding heat input compared to conventional structural steels. Due to the observed brittle behavior of all subzones in the whole t8/5 range, the possible lowest welding heat input should be applied in order to minimize the volume of HAZ that does not put fulfillment of the allowed maximal (450 HV10) hardness at risk and does not lead to the formation of cold cracks.
1. Introduction
High strength steels have an increasingly important role in engineering applications, especially in the vehicle and transportation industry, where the producers are faced with the challenges of strict requirements for lower CO2 emission, and there is customer demand for lower operational costs. By the combination of alloying elements, rolling and heat-treating processes, various high strength steel grades were developed in the past few decades, and therefore, nowadays high strength steels are also available in thin sheets and thicker plates. Besides increasing the strength and toughness properties, the development of weldability characteristics also plays an important role in steel producers. However, the determination of the right welding technology, including the optimal process window, may still cause difficulties for welding engineers [1,2,3,4,5,6].
Quenched and tempered (Q + T) steels are considered the highest strength structural steels [2,5]. Due to their outstanding mechanical properties, especially strength, significant weight reduction can be achieved by their application. Besides their high yield strength, they have also good toughness properties thanks to the fine-grained tempered martensitic and bainitic microstructure [7]. In the present paper, the weldability of S960QL according to EN 10025-6 is investigated in the aspect of microstructural changes in the heat-affected zone (HAZ). Due to water cooling during quenching and to the application of high temperature tempering (HTT), this grade generally has a non-equilibrium tempered martensitic microstructure. For improved hardenability properties in the whole plate thickness, alloying elements (chromium (Cr), molybdenum (Mo)) are added to the steel, which moves the continuous cooling transformation (CCT) diagram to the right. Microalloying components (niobium (Nb), vanadium (V) and titanium (Ti)) are often used in order to ensure a fine grain microstructure and to prevent grain coarsening. High strength steels are generally more sensitive to the impurity level and inclusions; therefore, strict limitations are set for phosphorus (P) and sulphur (S) content [8]. The excellent strength of Q + T high strength steels originates primarily from the fine tempered lath-like martensitic microstructure and the dislocation density. The effect of the dissolved carbon is generally lower [9].
During the welding of quenched and tempered high strength steels, the biggest weldability problems can be caused by the unfavorable changes of the original fine-grained microstructure. In the HAZ, both hardened and softened areas can be found [10,11]. Cold cracking in weld and HAZ can be simply identified by non-destructive materials tests, but the reduction of strength and toughness cannot be examined on the welded structure. Quality expectations and the continuous training of the welders are indispensable to guarantee the required mechanical properties of the welded joint. As the yield strength grows, the area of the optimal welding lobe generally decreases. According to welding experiments, mechanical requirements can be fulfilled with the application of low welding heat input, although the risk of cold cracking increases. Since mobile structures welded from high strength steels often operate at low temperature when occasionally even overload may occur, the fulfillment of the guaranteed minimum impact energy is critical in terms of safe operation. Consequently, the influence of welding parameters on HAZ characteristics is examined, and sufficient toughness should be guaranteed across the whole welded joint. Welding parameters are often described by the t85/5 cooling time in order to be able to compare the different technological variants (heat input, preheating/interpass temperature) and welding processes. Within the weldability challenges, the effect of the limited filler metal choice and the mismatch effect on the static and dynamic behavior of the welded joint cannot be neglected. Due to the higher crack sensitivity of the weld and HAZ microstructure and the possible cyclic loading conditions in mobile structures, fracture mechanics approach is recommended to be used during the structural and technological design [12,13].
When the HAZ of structural steels is examined, a coarse-grained zone is considered as the most critical one in terms of the toughness properties. In the case of quenched and tempered high-strength steels, the intercritical zone can be also similarly disadvantageous due to the higher carbon equivalent. In multipass welded joints, the unfavorable microstructural changes of both abovementioned zones (grain growth and brittle microstructure at grain boundaries) can occur in the intercritically reheated coarse-grained zone, which is supposed to be the region of the whole welded joint with the lowest toughness [14,15].
The aims of the present research are to provide a detailed characterization (microstructure, hardness, toughness) of the HAZ of S960QL high strength steel and to analyze the effect of welding parameters during the application of the most common arc welding technologies. The present study raises also the question whether the requirements of the governing standards are sufficient to guarantee the avoidance of brittle fracture in the HAZ. The properties of HAZ subzones are investigated as a function of t8/5 cooling time for the applicable arc welding technologies by the application of physical simulation.
2. Materials and Methods
2.1. The Investigated Base Material
The chemical composition of the investigated S960QL base material according to the material certificate is summarized in Table 1. Based on the chemical composition the carbon equivalents according to EN 1011-2 were determined: CEV = 0.54%, CET = 0.36%. The required and the measured mechanical properties of the examined S960QL steel according to the material certification are summarized in Table 2. The examined steel has a guaranteed 27 J Charpy-V energy (CVN) at −40 °C thanks to its fine-grained microstructure (approx. 10 µm grain size) and low impurity level (minimized S and P content).

Table 1.
Chemical composition and carbon equivalents of the investigated S960QL steel in wt. %.
Table 2.
Mechanical characteristics of the investigated S960QL steel.
2.2. Physical Simulation of Critical HAZ Areas
Physical simulation provides unique opportunities for HAZ characterization in metals during different kind of fusion welding technologies (from high energy density processes such as laser beam welding to the medium or low energy density processes as gas metal arc welding). In the present paper, HAZ tests were performed by a Gleeble 3500 thermomechanical physical simulator (Dynamic Systems Inc., Poestenkill, NY, USA), installed in. With the HAZ test, the desired part of the HAZ can be precisely and homogeneously created in a volume sufficient for the further material tests, e.g., the Charpy V-notch pendulum impact test [15,16].
The time and temperature points in the heating and cooling part of HAZ thermal cycles were determined based on the Rykalin 3D model, and the GSL programs were manually written [17]. This model describes the temperature field generated by a moving point-like heat source on the surface of a semi infinity body. In this case, 3D thermal conductivity is dominant while surface heat transfer (convection) is negligible. This model was selected since the investigated S960QL is generally used in medium and heavy plate thickness (>15 mm), where a 3D model may give more precise results. Furthermore, this equation is independent from the plate thickness; consequently, a reduced number of variables need to be considered during the evaluation.
Thermophysical properties were determined for the whole relevant temperature range (between 20 and 1400 °C) by the application of JMatPro software (v7.0, Sente Software Ltd., Guildford, UK), and then, their average values were used in the Rykalin equation (λ = 37.8 W/(m °C), cp = 690.2 J/(kg °C), ρ = 7614.7 kg/m3). Preheating and interpass temperatures (T0) were set to 150 °C based on previous welding experiments [18].
The aim was to simulate the CGHAZ, ICHAZ and ICCGHAZ of the investigated S960QL for a t8/5 cooling range, typical for the arc welding processes: 2.5–30 s. In the case of CGHAZ, t8/5 = 100 s was also examined, since in the 2.5–30 s interval basically martensitic transformation was expected, and the presence of a bainite microstructure was only expected after 60 s (based on the performed JMatPro calculations 27% bainite was prognosed at 100 s). Considering the selection of peak temperatures, the motivation was to generate the most critical parts of the selected HAZ areas, those having the lowest toughness. Hence, for CGHAZ the peak temperature of 1350 °C was selected in order to produce the occurring largest grains. This value is safely below than the nil-strength temperature of the investigated steel (NST = 1408 °C) [19].
Determination of the peak temperature for ICHAZ was based on the literature [7,9,20] and preliminary experiments. Three simulations were performed with 760, 780, 815 and 850 °C peak temperatures at t8/5 = 5 s. Then Charpy V-notch impact tests were performed. The lowest energy values were measured in case of 760 °C and 780 °C peak temperatures. Finally, 775 °C was selected for the further simulation by ensuring the required transformation ratio in the examined t8/5 interval. For the simulation of ICCGHAZ the two peak temperatures (1350 and 775 °C) were applied together. Specimens with a 10 mm × 10 mm square cross section and 70 mm length were machined from a s = 15 mm plate, and they were applied in the t8/5 = 5–100 s interval with a 10 mm free span. For achieving the 2.5 s cooling time a special, previously tested drilled specimen was applied with a 7.5 mm free span and external air cooling [21].
The applied HAZ cycles for the different cooling time values (indicating the effect of welding heat input and preheating) between 2.5 and 30 s are illustrated in Figure 1, Figure 2 and Figure 3. The thermal cycle for the t8/5 = 100 s is not shown in Figure 1 due to its wide extent. For the simulation of ICCGHAZ, due to practical reasons, a forced cooling (10 °C/s) was applied after 200 °C, which was followed by a 5 s holding time before the second thermal cycle started.
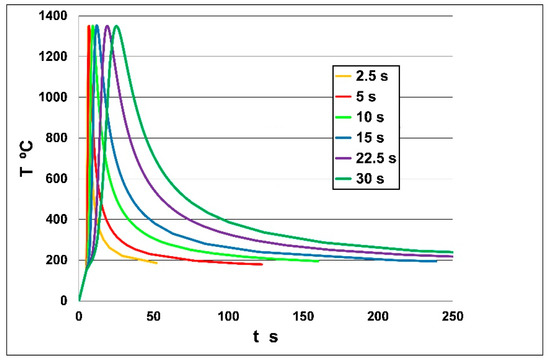
Figure 1.
Coarse-grained heat-affected zone (CGHAZ) thermal cycles.
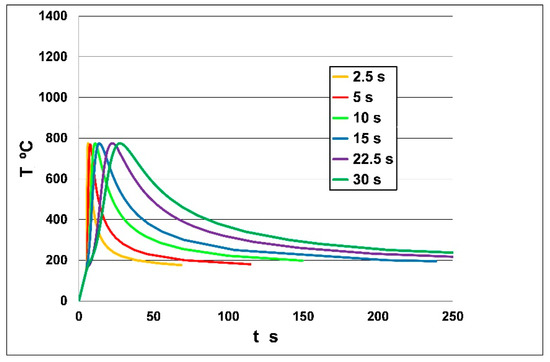
Figure 2.
Intercritical heat-affected zone (ICHAZ) thermal cycles.
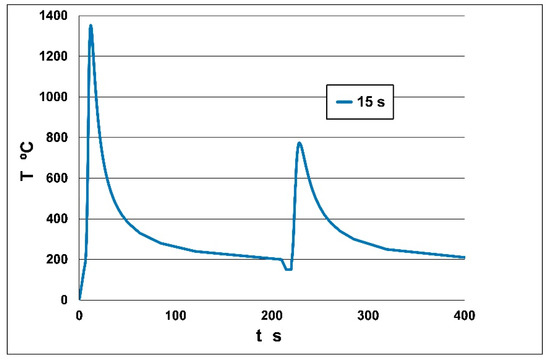
Figure 3.
Intercritically reheated coarse-grained heat-affected zone (ICCGHAZ) thermal cycle (t8/5 = 15 s).
3. Results and Discussion
After the simulations the HAZ subzones and the effect of welding parameters were examined by scanning electron microscopic (SEM), macro and micro hardness tests and instrumented Charpy V-notch pendulum impact tests.
3.1. SEM Tests
A ZEISS EVO MA10 (Carl Zeiss AG, Oberkochen, Germany) scanning electron microscope was applied for the examination illustrated in Figure 4, Figure 5, Figure 6 and Figure 7. Samples were covered with a golden layer for improved picture quality. The tempered martensitic microstructure of the base material is presented in Figure 4, where the formation of carbides refers to the tempering after quenching [2].
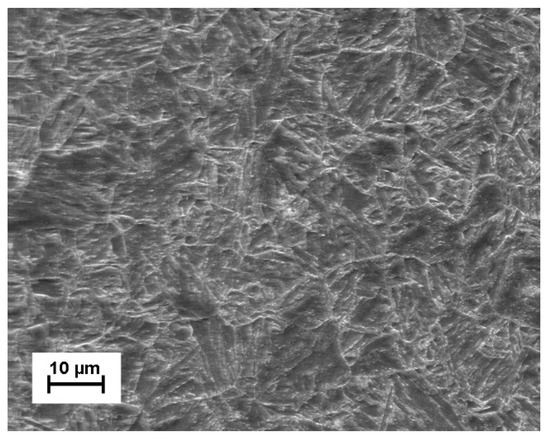
Figure 4.
Tempered martensitic microstructure of the base material (M = 1000×, 2% HNO3).
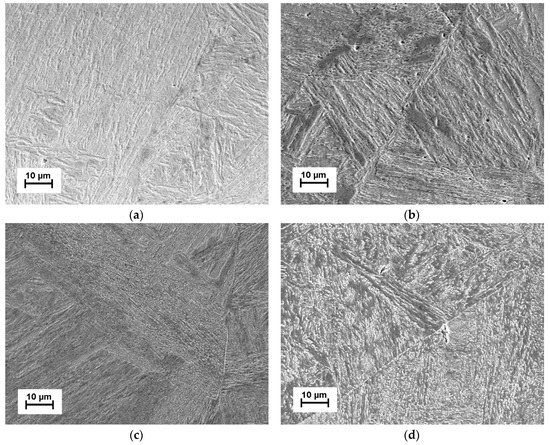
Figure 5.
CGHAZ microstructure: (a) t8/5 = 2.5 s; (b) t8/5 = 15 s; (c) self-tempering of martensite at t8/5 = 30 s; (d) upper bainitic microstructure at t8/5 = 100 s (M = 1000×, 2% HNO3).
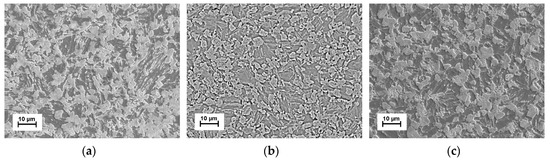
Figure 6.
ICHAZ microstructure: (a) t8/5 = 2.5 s; (b) t8/5 = 15 s; (c) t8/5 = 30 s (M = 1000×, 2% HNO3).
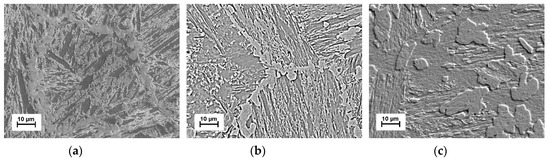
Figure 7.
ICCGHAZ microstructure: (a) t8/5 = 2.5 s; (b) t8/5 = 15 s; (c) t8/5 = 30 s (M = 1000×, 2% HNO3).
Based on the microscopic tests the HAZ subzones were adequately simulated in all cases for the arc welding of S960QL grade, and the results were correlated with the JMatPro calculations. In CGHAZ martensitic microstructure with large (>100 µm), prior austenite grain size (Figure 5) was observed in the 2.5–30 s interval. Occasionally the measured grain size was even as large as 200 µm, although in physical simulations the grain size of CGHAZ is generally larger than in the real welded joints [16]. Furthermore, at this high (1200–1400 °C) temperature range the nature of grain growth is unstable, and unexpected large grains may appear [7,9]. The type of microstructure did not change significantly between t8/5 = 2.5 and 30 s; however, the self-tempering of martensite was identified at longer cooling times (Figure 5b). The reduced toughness properties can be explained by the large grains, the presence of unstable blocky austenite and the relatively high carbon equivalent. The presence of upper bainite was observed only at t8/5 = 100 s (Figure 5d). The upper-bainitic microstructure may increase the risk of the formation of elongated martensite-austenite (M-A) constituents, which can cause the further reduction of impact energy values. In CGHAZ the M-A constituents generally appear between the ferrite laths of bainite and has a long and thin morphology, different than in ICHAZ or in ICCGHAZ [15]. The cold cracking sensitivity of CGHAZ should be emphasized, since hydrogen can diffuse from the fusion zone to this brittle microstructure [2,7,22].
The microstructures of ICHAZ and ICCGHAZ are presented in Figure 6 and Figure 7. The SEM images in Figure 6b and Figure 7b were prepared in backscatter mode for a more complex evaluation of the transformed parts. In ICHAZ, transformed parts at the boundaries of original grains generally have a higher carbon content, since austenite has a higher carbon solubility in this temperature range. In the case of high heat input, when this area stays in this intercritical range for a long period, the carbon content of austenitized parts further increases. Then, in the cooling part, these austenitic parts transform to a brittle, generally martensitic or bainitic microstructure as a function of cooling speed and the strength category. The transformed parts may have higher hardness than CGHAZ, while the original parts are tempered; furthermore, their carbon content reduces, and they soften. Retained austenite can be often noticed near the brittle martensitic islands; therefore, these areas are called together as M-A constituents. In terms of the simulated ICHAZ, fine M-A islands formed as the result of partial austenitic transformation, while the middle of the original grains became tempered. By the increase of cooling time, the transformed parts are less homogeneous and less brittle (Figure 6c) compared to this zone at t8/5 = 2.5 s (Figure 6a). In ICCGHAZ similar microstructural changes can be identified with grains essentially ten times larger than in ICHAZ. In many cases, this local zone has the lowest toughness in the welded joint, since the disadvantageous properties of CGHAZ and ICHAZ meet here. The toughness of ICCGHAZ is determined by the tempered coarse-grained martensite and the amount, distribution, type and hardness of the austenitized parts. The properties of M-A constituents are basically influenced by the peak temperature and cooling time. In the case of short cooling times, the quantity of M-A parts has an increased role on impact energy, while the hardness difference between the original (but tempered) coarse grains and the M-A parts is more relevant in long cooling times. In real welded joints, the abovementioned unfavorable properties of ICCGHAZ are less harmful, since this zone just forms locally while ICHAZ can be found in the whole plate thickness [14,15].
3.2. Hardness Tests
A Reicherter UH250 universal macro-hardness (BUEHLER Worldwide Headquarters, Lake Bluff, IL, USA) and a Mitutoyo micro-hardness tester (Mitutoyo Hungária Ltd., Budapest, Hungary) were used for the investigations. Evaluation was performed according to the EN 15614-1 standard, which permits HVmax = 450 HV10 for the non-heat-treated welded joints (including HAZ) of quenched and tempered high strength steels belonging to the 3rd group of CR ISO 15608. Specimens were perpendicularly cut to their longitudinal size at the thermocouples. Five measurements were done on the cut surface. The average macro hardness values of the simulated subzones are presented in Figure 8.
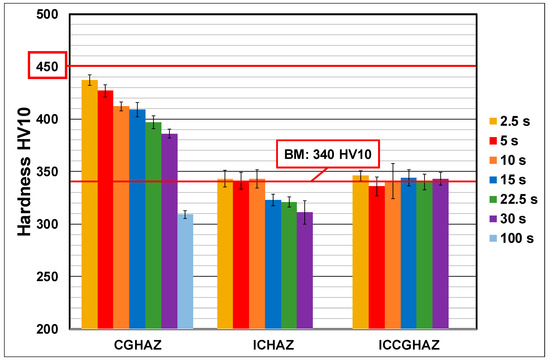
Figure 8.
Macro hardness test results in HAZ subzones.
All HAZ subzones at each cooling time fulfilled the requirements of the governing standard. This was true even given the fact that in the case of high energy density processes (e.g., electron beam welding) the maximum hardness may even exceed 500 HV in the HAZ of S960QL. Furthermore, even in the same steel category, the difference in the type and the number of alloying elements can have an effect on HAZ hardenability. By considering all subzones 437 HV10, maximum hardness was measured in CGHAZ when t8/5 = 2.5 s was simulated. With the increase in cooling time, the hardness proportionately decreased in this zone, but it was still above the base material hardness between 2.5 and 30 s. Although the hardness limit of the standard was fulfilled in this zone, the hardness of the fine-grained zone (FGHAZ) can occasionally become even higher [10]. Compared to the base material, softening was only noticed at t8/5 = 100 s. As can be seen in Figure 8, the ICHAZ tends to soften the most in the investigated cooling time interval, where the lowest hardness was 311 HV10 at t8/5 = 30 s. Regarding the effect of a softened zone on the behavior of the whole welded joint, it is important to note that HAZ softening depends mainly on the relative extension of the soft zone and has only a small effect on the transverse tensile strength of the joint [11].
In terms of ICCGHAZ, the average hardness was similar to that of the base material, and the cooling time did not influence the macro hardness. The hardness of the coarse grains of the first thermal cycle significantly decreased due to the tempering effect of the intercritical (second) thermal cycle. The hardness of primer coarse grains did not have any effect on the final hardness of ICCGHAZ.
Microhardness tests were also performed for the more-in-depth examination of ICHAZ and ICCGHAZ. The possible lowest mechanical load (HVM0.1) was set on the equipment due to the limited area of the transformed islands. The highest local hardness values (often much above 450 HVM0.1) were measured in the M-A parts of ICCGHAZ. Generally, lower microhardness was noticed in ICHAZ, although all values were above the hardness of the original microstructure. The effect of welding parameters could be clearly seen in the hardness of grain centers due to the tempering effect of the second heat cycle. In ICHAZ, the average microhardness decreased to 265 HVM0.1 at t8/5 = 30 s. A similar tendency was observed in ICCGHAZ, where the minimum hardness was 311 in the middle of the grains at this cooling time.
In Table 3, the hardness values of gas metal arc (GMA) welded joints from the investigated S960QL material are presented as a function of the cooling time in order to provide a connection between the simulation and the real welding experiments [18]. The plates were 15 mm thick and V-groove welds were prepared. During these previously performed welding experiments, the welds were manually welded; therefore, in most cases, an interval is given for the cooling time, which was calculated and measured at each welding pass. In general, based on the hardness results a correlation can be found between the physical simulation and the real welding experiments. At shorter cooling times, higher values than 400 HV10 can be measured, and the increasing heat input reduced the maximal hardness in the HAZ. During the hardness tests of real welded joints, five measurements of each HAZ were performed. The correlation might be improved by a more detailed hardness distribution of the real HAZ.
Table 3.
Measured maximal hardness values of gas metal arc (GMA) welded joints from S960QL steel.
3.3. Instrumented Charpy V-Notch Pendulum Impact Tests
Five specimens from each thermal cycle were used for the Charpy V-notch pendulum impact tests performed with PSD 300/150 instrumented equipment (WPM Werkstoffprüfsysteme GmbH, Markkleeberg, Germany). According to EN 10025-6 the required minimum impact energy is 27 J at −40 °C for S960QL steel. According to the material certificate, the investigated steel plate has 75 J CVN, although 167 J was measured during the performed impact test on the base material. The average CVN of the specimens of the performed impact tests is given in Figure 9.
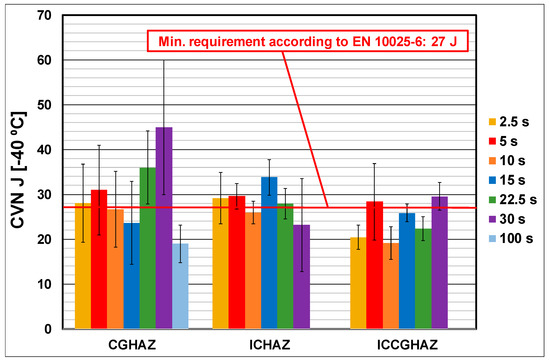
Figure 9.
Charpy V-notch pendulum impact tests on HAZ subzones.
All of the investigated subzones in the examined t8/5 cooling time interval had significantly lower toughness than the base material. The cooling time does not affect equally the different HAZ areas. The minimum and the maximum impact energy values of the given subzones did not appear at the same cooling time. Cooling times had the largest effect on the toughness of CGHAZ, although the highest scatter was noticed here. By considering the relatively high standard deviations of the measured values, the results were statistically evaluated by the ANOVA method. According to the calculations, there is a statistically significant difference among the measured CVN values in CGHAZ at the different cooling times (F = 4.65 > Fcrit = 2.29, p = 0.000834). Then, post hoc tests were performed in order to determine which results are different from each other. Based on the calculations (Dunnett’s T3) only the CVN values of t8/5 = 22.5 s and 100 s are statistically different (p = 0.009). However, the increase of sample size may also indicate statistical difference between other values. Therefore, it can be recommended to test more samples in CGHAZ for similar physical simulation investigations. The occasionally measured higher impact energy values in CGHAZ might be explained by the observed self-tempering effect (Figure 5c) [21]. When upper bainitic microstructure appeared at t8/5 = 100 s in CGHAZ (Figure 5d), the toughness significantly reduced. In the examined S960QL steel, ICHAZ has similar impact energy to CGHAZ between 2.5–10 s, and significantly lower in the 22.5–30 s interval. In terms of the toughness properties ICCGHAZ seems to be the most critical part, where more values, including the standard deviations, were under the required value.
In Table 4 the CVN values of the real GMA welded joints from the investigated S960QL material are presented in terms of the calculated and measured cooling time values, similarly to the evaluation of the hardness results [18].
Table 4.
Measured CVN values of GMA welded joints from S960QL steel.
In the examined t8/5 cooling time range, higher CVN values were measured in the weld than in the HAZ. Therefore, HAZ can be considered as the most critical part concerning the toughness distribution in the welded joint. The low CVN values at the different cooling time range indicate the brittle behavior of the HAZ, in accordance with the physical simulation results. In some cases, the higher impact energy values can be connected with the uncertain notch location and crack propagation due to the limited extension of critical HAZ areas. With the increasing cooling time, lower CVN values were measured, which might be connected with the wider HAZ and the lower number of welding passes (5 instead of 9).
Comparing to the conventional Charpy V-notch impact test where the whole energy absorbed during the fracture is determined, the instrumented impact testing can provide more detailed information about the fracture process and the ductile/brittle behavior of the material. Using strain gauge measurement technology, the load-time diagram can be determined, and the characteristic points of the fracture process can be identified (the start of the plastic strain, maximal force, start of the unstable crack propagation, end of the unstable crack propagation). In the registered diagram, the unstable crack propagation stage is correlated with the amount of brittle fracture on the fracture surface. From the load-time diagram, the force-displacement diagram can be calculated. Assuming that the crack initiation occurs at the maximal force, the registered diagram can be divided into two parts according to the maximal force. Until the maximum force, the area under the curve is considered as the absorbed energy for crack initiation (Wi), while the remaining area is for crack propagation (Wp). As the ratio of the absorbed energy for the crack initiation increases, the toughness of the examined material reduces [23]. The detailed method of the instrumented Charpy V-notch pendulum impact test is described in EN ISO 14556.
During the instrumented Charpy V-notch impact tests force-displacement diagrams were determined for the base material and the HAZ areas (Figure 10). It can be seen that characteristics of the diagrams drastically changed compared to the base material. Although only minor unstable crack initiation was noticed in the base material, the behavior of the investigated subzones was totally brittle, almost independently from the set t8/5 cooling time.
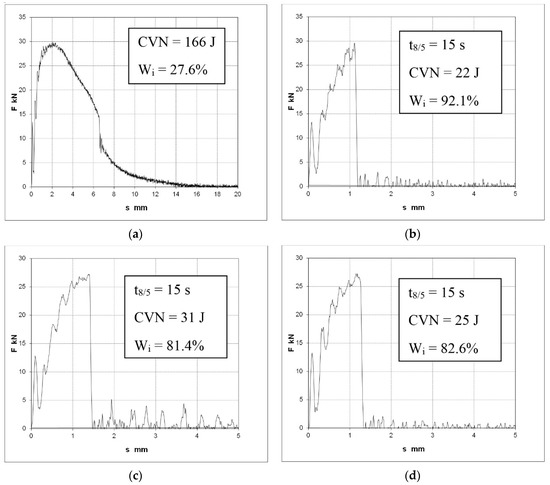
Figure 10.
Registered force-displacement diagrams: (a) base material, (b) CGHAZ, (c) ICHAZ, (d) ICCGHAZ.
In Table 5 the ratio of the absorbed energy for the crack initiation is summarized for the base material and the HAZ. The values indicate the brittle behavior of CGHAZ, ICHAZ and ICCGHAZ where mostly unstable crack propagation can be seen in all diagrams. According to the values in Table 5, CGHAZ seems more brittle than ICHAZ, although the difference is minimal. The t8/5 cooling time did not affect significantly the ratio of Wi in the examined interval (similarly to CVN). It is important to mention that the behavior of the investigated zones was brittle even though in some cases they met the 27 J requirement at −40 °C. On the basis of the presented instrumented Charpy V-notch impact tests, it can be concluded that the critical, local toughness reduction in the HAZ of the investigated S960QL cannot be avoided, and its extension cannot be significantly influenced by the t8/5 cooling time. The effect of cooling time primarily appears in the variation of the width of the critical HAZ areas.
Table 5.
Percentage of the absorbed energy for crack initiation compared to CVN.
The presented considerations were supplemented by the fractographic analysis of the fracture surfaces. The backscatter SEM images about the fracture surfaces of the ductile base material and the brittle HAZ subzones, at t8/5 = 15 s, are presented in Figure 11. The sharp edges indicate cleavage cracking in all subzones, and the difference of the grain size can be also observed. However, in HAZ the qualitative improvement of fracture surfaces, with the presence of micro-voids separated by plastic areas, can be obtained by post-weld treatment in high strength steels [24].
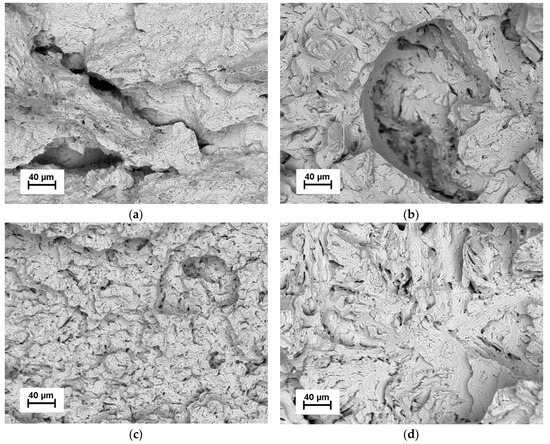
Figure 11.
Fracture surface of the impact test specimens: (a) base material; (b) CGHAZ at t8/5 = 15 s; (c) ICHAZ at t8/5 = 15 s; (d) ICCGHAZ at t8/5 = 15 s (M = 250×).
4. Conclusions
The toughness properties of the HAZ in the welded joint of the investigated S960QL steel in the critical subzones (CGHAZ, ICHAZ and ICCGHAZ) were investigated by the Gleeble 3500 physical simulator for a t8/5 = 2.5–30 s cooling time interval (in case of CGHAZ t8/5 = 100 s was also simulated).
The HAZ indicated higher sensitivity to the welding heat input compared to conventional structural steels. While in low or medium strength steels the HAZ toughness and hardness can be significantly affected by the t8/5 cooling time, in S960QL significant hardening and toughness reduction was observed in the whole cooling time range of the most common arc welding processes t8/5 = 2.5–30 s. In case of t8/5 = 100 s softening and extremely low CVN values were identified in CGHAZ.
The reduction of CVN was significant compared to the base material in all HAZ areas in the investigated cooling time interval. In most cases, the required 27 J at −40 °C was in the deviation interval of the CVN values of the subzones. Whenever the requirement was fulfilled, basically a brittle fracture was detected in the registered force-displacement diagrams, since the absorbed energy mostly consisted of the crack initiation energy. The fact that the toughness requirement is fulfilled may be connected to the higher strength of the material, despite the observed brittle behavior in HAZ. Besides CGHAZ, the ICHAZ should be similarly considered when the ductile-brittle behavior of the HAZ in Q + T steels is investigated. In multipass welded joints, ICCGHAZ seems to be the most critical part of the HAZ, with mostly lower CVN than the required value.
The critical, local toughness reduction in the HAZ of the investigated S960QL cannot be avoided by the modification of the welding parameters in the examined t8/5 cooling time range; however, the application of post weld heat treatment (PWHT) can be an opportunity for the improvement of toughness properties. The effect of cooling time primarily appears in the variation of the width of HAZ areas. Therefore, the possible lowest welding heat input that does not risk the fulfillment of the allowed maximal (450 HV10) hardness and the formation of cold cracks should be applied in order to minimize the volume of HAZ.
Funding
This research was supported by the European Union and the Hungarian State, co-financed by the European Regional Development Fund in the framework of the GINOP-2.3.4-15-2016-00004 project, aimed to promote the cooperation between the higher education and the industry.
Acknowledgments
The author is grateful to the Institute of Physical Metallurgy, Metalforming and Nanotechnology at the University of Miskolc for ensuring the scanning electron microscope during the evaluation of HAZ tests. The author is also grateful for the opportunity to use JMatPro software at the University of Oulu during his internship. He also thanks the Department of Business Statistics and Economic Forecasting at the University of Miskolc for providing the SPSS software used during the statistical calculations.
Conflicts of Interest
The author declares no conflict of interest.
References
- Branco, R.; Berto, F. Mechanical Behavior of High-Strength, Low-Alloy Steels. Metals 2018, 8, 610. [Google Scholar] [CrossRef]
- Węglowski, M.S. High Strength Quenched and Tempered Steels: Weldability and Welding. In High-Strength Steels: New Trends in Production and Applications; Branco, R., Ed.; Nova Science Publishers: New York, NY, USA, 2018; pp. 143–224. [Google Scholar]
- Bayock, F.N.; Kah, P.; Layus, P.; Karhin, V. Numerical and experimental investigation of the heat input effect on the mechanical properties and microstructure of dissimilar weld joints of 690-MPa QT and TMCP steel. Metals 2019, 9, 355. [Google Scholar] [CrossRef]
- Spena, P.R.; Rossi, S.; Wurzer, R. Effects of Welding parameters on strength and corrosion behavior of dissimilar galvanized Q&P and TRIP spot welds. Metals 2017, 7, 1–14. [Google Scholar]
- Kurc-Lisiecka, A.; Piwnik, J.; Lisiecki, A. Laser welding of new grade of advanced high strength steel STRENX 1100 MC. Arch. Metal. Mater. 2017, 62, 1651–1657. [Google Scholar] [CrossRef]
- Varbai, B.; Sommer, C.; Szabó, M.; Tóth, T.; Májlinger, K. Shear tension strength of resistant spot welded ultra high strength steels. Thin-Walled Struct. 2019, 142, 64–73. [Google Scholar] [CrossRef]
- Bhadesia, H.K.D.H.; Honeycombe, R.W.K. Steels: Microstructure and Properties, 3rd ed.; Elsevier: Oxford, UK, 2006; pp. 95–258. [Google Scholar]
- Tervo, H.; Kaijalainen, A.; Pikkarainen, T.; Mehtonen, S.; Porter, D. Effect of impurity level and inclusions on the ductility and toughness of an ultra-high-strength steel. Mater. Sci. Eng. A 2017, 697, 184–193. [Google Scholar] [CrossRef]
- Porter, D.A.; Easterling, K.E. Phase Transformations in Metals and Alloys, 2nd ed.; Chapman and Hall: London, UK, 1996; pp. 387–441. [Google Scholar]
- Dunne, D.P.; Pang, W. Displaced hardness peak phenomenon in heat-affected zone of welded quenched and tempered EM812 steel. Weld. World 2017, 61, 57–67. [Google Scholar] [CrossRef][Green Version]
- Hochauser, F.; Ernst, W.; Rauch, R.; Vallant, R.; Enzinger, N. Influence of the soft zone on the strength of welded modern HSLA steels. Weld. World 2012, 56, 77–85. [Google Scholar] [CrossRef]
- Lukács, J.; Dobosy, Á. Matching effect on fatigue crack growth behaviour of high-strength steels GMA welded joints. Weld. World. 2019, 63, 1315–1327. [Google Scholar] [CrossRef]
- Hassanifard, S.; Mohtadi-Bonab, M.A.; Jabbari, Gh. Investigation of fatigue crack propagation in spot-welded joints based on fracture mechanics approach. J. Mater. Eng. Perform. 2013, 22, 245–250. [Google Scholar] [CrossRef]
- Leroy Olscon, D.; Siewert, T.A.; Liu, S.; Edwards, G.R. ASM Handbook: Welding Brazing and Soldering; ASM International: Novelty, OH, USA, 1995; pp. 191–212. [Google Scholar]
- Nevasmaa, P. Evaluation of HAZ Toughness Properties in Modern Low Carbon Low Impurity 420, 550 and 700 MPa Yield Strength Thermomechanically Processed Steels with Emphasis on Local Brittle Zones; Lisensiaatintyö, University of Oulu: Oulu, Finland, 1996. [Google Scholar]
- Adony, Y. Heat-affected zone characterization by physical simulations. Weld. J. 2006, 85, 42–47. [Google Scholar]
- Rykalin, N.N.; Nikolaev, A.V. Welding arc heat flow. Weld. World 1971, 9, 112–133. [Google Scholar]
- Gáspár, M.; Balogh, A. GMAW experiments for advanced (Q + T) high strength steels. Prod. Proc. Syst. 2013, 6, 9–24. [Google Scholar]
- Kuzsella, L.; Lukács, J.; Szűcs, K. Nil-strength temperature and hot tensile tests on S960QL high-strength low-alloy steel. Prod. Proc. Syst. 2013, 6, 67–78. [Google Scholar]
- Laitinen, R.; Porter, D.A.; Karjalainen, L.P.; Leiviskä, P.; Kömi, J. Physical simulation for evaluating heat-affected zone toughness of high and ultra-high strength steels. Mater. Sci. For. 2013, 762, 711–716. [Google Scholar] [CrossRef]
- Gáspár, M.; Balogh, A.; Lukács, J. Toughness examination of physically simulated S960QL HAZ by a special drilled specimen. In Vehicle and Automotive Engineering; Springer: Berlin, Germany, 2017; pp. 469–481. [Google Scholar]
- Mohtadi-Bonab, M.A.; Ghesmati-Kucheki, H. Important factors on the failure of pipeline steels with focus on hydrogen induced cracks and improvement of their resistance: Review paper. Met. Mater. Int. 2019, 25, 1109–1134. [Google Scholar] [CrossRef]
- Lenkeyné, B.Gy.; Winkler, S.; Tóth, L.; Blauel, J.G. Investigations on the brittle to ductile fracture behaviour of base metal, weld metal and HAZ material by instrumented impact testing. In Proceedings of the 1st International Conference on Welding Technology, Materials and Material Testing, Fracture Mechanics and Quality Management, Wien, Austria, 22–24 September 1997; pp. 423–432. [Google Scholar]
- Konat, L. Structural aspects of execution and thermal treatment of welded joints of hardox extreme steel. Metals 2019, 9, 915. [Google Scholar] [CrossRef]
© 2019 by the author. Licensee MDPI, Basel, Switzerland. This article is an open access article distributed under the terms and conditions of the Creative Commons Attribution (CC BY) license (http://creativecommons.org/licenses/by/4.0/).