Abstract
Shrinkage porosities and non-metallic inclusions are common manufacturing process based defects that are present within cast materials. Conventional fatigue design recommendations, such as the FKM guideline (“Forschungskuratorium Maschinenbau”), therefore propose general safety factors for the fatigue assessment of cast structures. In fact, these factors mostly lead to oversized components and do not facilitate a lightweight design process. In this work, the effect of shrinkage porosities on the fatigue strength of defect-afflicted large-scale specimens manufactured from the cast steel G21Mn5 is studied by means of a notch stress intensity factor-based (NSIF-based) generalized Kitagawa diagram. Additionally, the mean stress sensitivity of the material is taken into account and establishes a load stress ratio enhanced diagram. Thereby, the fatigue assessment approach is performed by utilizing the defects sizes taken either from the fracture surface of the tested specimens or from non-destructive X-ray investigations. Additionally, a numerical algorithm invoking cellular automata, which enables the generation of artificial defects, is presented. Conclusively, a comparison to the results of the experimental investigations reveals a sound agreement to the generated spatial pore geometries. To sum up, the generalized Kitagawa diagram, as well as a concept utilizing artificially generated defects, is capable of assessing the local fatigue limit of cast steel G21Mn5 components and features the mapping of imperfection grades to their corresponding fatigue strength limit.
1. Introduction
Cast steel components are commonly utilized in modern manufacturing processes for complexly shaped structures and demands towards higher strengths. Despite elaborated efforts in terms of numerical process simulations during component design, casting defects, such as sand inclusions, hot tears and shrinkage porosities, are manufacturing based intrinsic material properties [1]. This is caused by the material’s high shrinkage during cooling and solidification. Therefore, the fatigue assessment of cast steel defects is of utmost importance referring to an operationally endurable design.
Despite the use of radiograph standards [2,3,4] for quality assurance, which allow casting defects to be classified according to their accumulation and sizes, into defect and severity grades, it is difficult to attain a conservative estimation of the local strength properties in cast steel components. A fundamental relation between casting defects, including surface and near-surface discontinuities, on the fatigue strength and the impact behaviour of cast steels has been the topic of various preliminary studies [5,6,7,8]. Furthermore, the influence of shrinkage porosity on the elastic monotonic and fatigue life by computed tomography and X-ray scanning has been studied in depth by Hardin et al. [9,10,11,12,13,14], whereas finite-element simulations were utilized for a proper localized fatigue assessment. Next, Collini et al. [15] studied the influence of casting defects on the fatigue crack initiation of ductile cast iron concluding a significant drop in fatigue strength due to defects within the material.
In addition to these simulation-based fatigue assessment approaches, fracture mechanical concepts, like Murakami’s concept [16], are frequently used for the assessment of casting defects, especially in aluminium alloys, which exhibit shrinkage and gas porosities with sizes up to approximately 700 m [17]. Recent works also depicted the applicability of Murakami’s concept for non-metallic inclusion in cast steel materials, which are presented in [18,19,20]. Thereby it should be noted, that according to the literature [16], the application of the fracture mechanics-based concept provides confident results only for defect sizes with 1000 m.
As presented by Hardin and Beckermann [21], shrinkage porosity can feature sizes up to several millimetres, which exceed the application limit of Murakami’s and therefore leads to an unsatisfying design result. On the other hand, as published in recent works [22,23], the generalized Kitagawa-Takahashi diagram, which can be considered as an extended form of the linear-elastic fracture mechanical design [24], enables an auspicious assessment of shrinkage porosity afflicted large-scale cast steel specimens. Early works by Williams, Gross and Mendelson [25,26] contributed to the development of the notch stress intensity factor (NSIF) concept in terms of an analytical solution of the angle-dependent Williams eigenvalue at sharp V-notches, as defined in Equation (1).
Thereby, represents the V-notch opening angle and q the relative complementarity angle. As the NSIF concept can be understood as a generalization of the fracture mechanical approach, the notch stress intensity factor at a V-notch under mode I loading can be formulated as given in Equation (2), by considering a gross-section stress as uniaxial load condition. Whereat represents the opening-angle dependent stress singularity at the notch root and is determined as given in . In addition, the effective fatigue notch depth is defined by the factor , which is composed of the actual notch depth a and the geometry dependent factor [27,28,29].
In case of a V-notch with an opening-angle equal to , the Williams eigenvalue results in a value of and therefore leads to the fracture mechanical base equation [30,31].
The Kitagawa–Takahashi diagram (KTD) is basically specified by two material threshold parameters: the fatigue limit range , and the long crack stress intensity factor threshold range . The KTD features two different areas that can be subdivided into a region of non-propagating cracks and, on the contrary, into a region of flaws, which exhibits a size larger than the materials intrinsic crack length . Thereon, the intrinsic crack grows under cyclic loading if the applied stress exceeds the materials threshold value, which is often ended by structural failure [24,32].
Concerning the generalized Kitagawa diagram (GKD), the corresponding values, including the long crack notch stress intensity factor threshold range and the intrinsic El-Haddad length for V-notches , have to be derived from the crack-related parameters and , respectively. According to Atzori et al. [28], can be determined by means of by Equation (3) under consideration of the opening angle dependent stress singularity .
Relating to the determination of the intrinsic El-Haddad length for V-notches , the Equations (2) and (3) can be utilized, where is substituted by the fatigue limit . By re-arranging the resulting formula, Equation (4) is easily obtained.
Representing an enhancement of the KTD, the generalized Kitagawa diagram additionally takes the opening-angle, in terms of the stress singularity, into account. Considering a V-notch in a double infinite plate exhibiting an opening angle greater than zero and a size of , the local fatigue strength increases with an increase of the opening-angle, despite keeping a constant size, as it is illustrated in Figure 1. According to Atzori et al. [33,34,35], the Kitagawa–Takahashi can be separated into the regions of non-propagating short cracks, crack closure-afflicted long cracks and the notch mechanics.
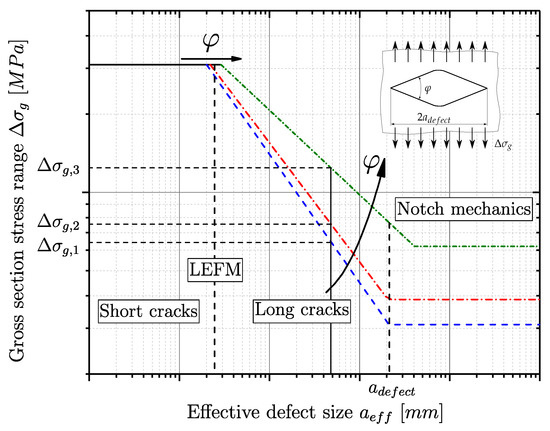
Figure 1.
Schematic structure of a generalized Kitagawa diagram.
Additionally to the geometrical influences of the notch, the consideration of the mean stress sensitivity is of utmost importance for service design. Thereby it is necessary to distinguish between the mean stress effect concerning the fracture mechanical behaviour and the fatigue strength of the material. Relating to the fracture mechanical literature, several methodologies, such as the approach from Elber [36] and the corresponding adaptions by Schijve [37] and Walker [38] are known to take the load stress ratio (R-ratio) into account. Mann illustrates a comparison of the referred models, which can be found in [39]. Further approaches in regard to the mean stress influence on the crack growth are given in [40,41,42].
An analytical estimation of the crack opening function, see Equation (5), was proposed by Newman [43] based on finite-element simulations and subsequently correlated between the R-ratio and the long crack threshold value [44].
In accordance with Newman, the long crack threshold diminishes continuously as the R-ratio increases due to the steadily growing separation of the crack flanks in the contact field until the effective short crack threshold is attained. Relating to elevated load ratios, from approximately , crack closure will not occur [43,45,46].
Thereby, represents the long crack stress intensity factor threshold range at a tumescent load ratio of . The factor is the crack opening function, is the Newman coefficient and is a material constant. The applicability of Newman’s approach, concerning the characterization of load ratio dependent crack growth thresholds, is illustrated in [44].
Referring to the influence of the mean stress on the fatigue strength, several approaches, such as by Goodman [47], Gerber [48], and Soderberg [49] have been proposed in preliminary studies. Figure 2 illustrates these commonly applied mean stress models, as well as the FKM guideline approach [50], which introduces a mean stress dependent sensitivity factor .
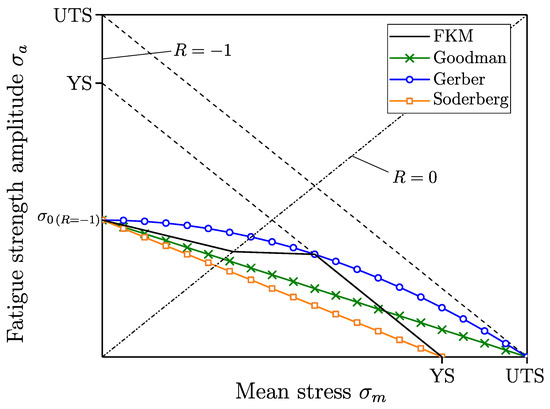
Figure 2.
A Haigh diagram exhibiting commonly utilized mean stress models. FKM (“Forschungskuratorium Maschinenbau”).
An overview of these and further state-of-the-art common mean stress models can be found in [51]. The FKM approach features a reduced sensitivity at high load stress ratios and is therefore characterized by a bilinear formulation. Accordingly, the R-dependent fatigue strength amplitude can be determined by Equation (6).
where the mean stress sensitivity is directly related to the material’s ultimate tensile strength by the material dependent parameters and , depicted in Equation (7).
A basic differentiation of mean stress models can be conducted based on the model’s dependency. Since the approaches according to Goodman, Gerber, and Soderberg are related to the material’s yield strength or rather the ultimate tensile strength , the fatigue strength amplitude at a given mean stress can be determined with diminishing experimental effort. On the contrary, further state-of-the-art models [16,38,52,53] exhibit an additional material dependent parameter, which leads to a sound consistency between model and material behaviour, but they also require more extensive material testing.
The majority of casting defects are caused by the disturbance of the local feeding condition and therefore facilitate the formation of local shrinkage porosity, which can be considered as internal notches, leading to a significantly diminished fatigue strength. Furthermore, the influence of the mean stress on the long crack threshold and the material’s fatigue strength in correspondence with macroscopic casting defects has to be taken into account. Since various models highlight the effect of the mean stress on homogeneous materials, the impairment of casting flaws has to be studied comprehensively. Hence, this work aims for the accessibility of mean stress exposed macroscopic shrinkage porosities and the corresponding estimation of the local fatigue limits based on computed tomography and X-ray investigations. Furthermore, focus is laid on the comparison between real casting defects and geometrically similar, artificially generated macroscopic pores.
Hence this paper scientifically contributes to the following topics:
- Evaluation of the mean stress sensitivity of both homogeneous and defect afflicted cast steel material.
- Fatigue strength assessment of large-scale cast steel specimens exhibiting macroscopic shrinkage porosities based on the NSIF approach applying the generalized Kitagawa diagram.
- Calculation of the fatigue strength on the basis of X-ray examinations of cast specimens.
- Numerical analysis of artificially generated macroscopic defects as basis for a probabilistic fatigue assessment of imperfections with varying, but cast steel process related, geometry.
2. Material and Fatigue Testing
The investigated macroscopic near-defect-free specimens are manufactured from the cast steel G21Mn5, which possesses a normalizing heat treatment. The chemical composition of the analysed samples is determined by a optical emission spectroscopy and tabulated in Table 1.

Table 1.
Chemical composition of the investigated material in weight percent.
In order to evaluate the grain size of the investigated material, five individual sections are metallographically prepared and chemically etched. A subsequent optical analysis of the microstructure obtained a grain size range of 30 to 40 m. To apply the FKM mean stress sensitivity approach, quasi-static tensile tests are conducted in order to obtain the material’s ultimate tensile strength. Figure 3 illustrates the utilized specimen geometry.

Figure 3.
Geometry of the tensile test specimen.
The tensile tests are performed at a constant strain rate of s at room temperature, which is measured with an applied extensometer. The results, which are illustrated in Figure 4, depict a pronounced average yield strength of MPa and a mean ultimate tensile strength of MPa at a uniform elongation of about .
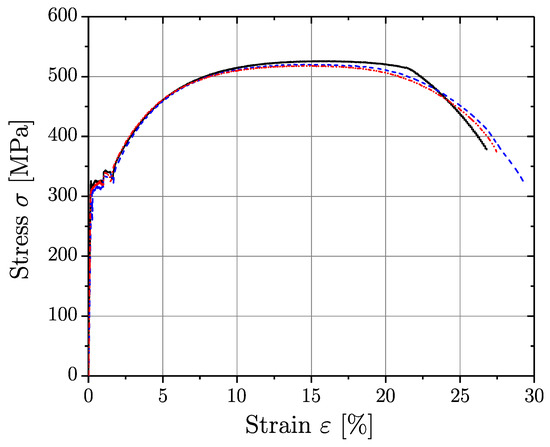
Figure 4.
Quasi-static tensile test results.
2.1. Fatigue Test Results
Aiming for the assessment of the materials near-defect-free long life fatigue strength, high-cycle fatigue tests under axial loading with constant amplitudes are conducted. In order to cover the material’s mean stress sensitivity, the load stress ratios , , and are selected. The fatigue tests are performed at a resonance test rig Power Swing MAG150kN (SincoTec, Clausthal-Zellerfeld, Germany) with a testing frequency of about 90 Hz at room temperature. The experiments are executed until either ten million load cycles are achieved or a specimen burst failure occurs. Figure 5 illustrates the utilized specimen geometry for the base material fatigue tests.
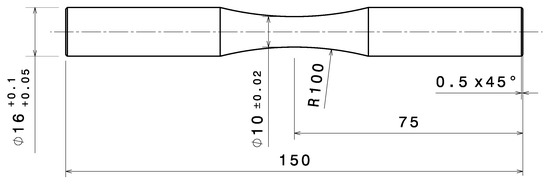
Figure 5.
Illustration of the high-cycle fatigue specimen geometry.
In terms of the fatigue strength assessment, the statistical evaluation in the finite-life region is conducted by application of the common procedure ASTM-E739 [54]. Moreover, the endurance limit region is evaluated by means of the arcsin methodology [55]. Further, the second slope is set to a value of 45 as suggested in [56,57]. Table 2 exhibits the stress ranges , normalized to the fully-reversed long life fatigue value , at a probability of survival of 50%, the evaluated finite-life slopes , the number of load cycles at the transition points and the corresponding scatter band indices 1: of the endurance limit region.
Table 2.
Results of the high-cycle fatigue tests.
Furthermore, the results are illustrated in Figure 6, Figure 7 and Figure 8 by means of evaluated S-N curves, which show a decrease in the long life fatigue strength due to the elevated mean stress state. For the purpose of unity, the presented fatigue limits are normalized in regard to the fatigue limit at a load stress ratio of . The load stress ratio exhibits a reduction of the fatigue strength of about 21% compared to the fully-reversed fatigue limit. Accordingly, the curve depicts a more significant drop of the fatigue limit by approximately 42% due to the enhanced predominant tensile mean stress state compared to the value at .
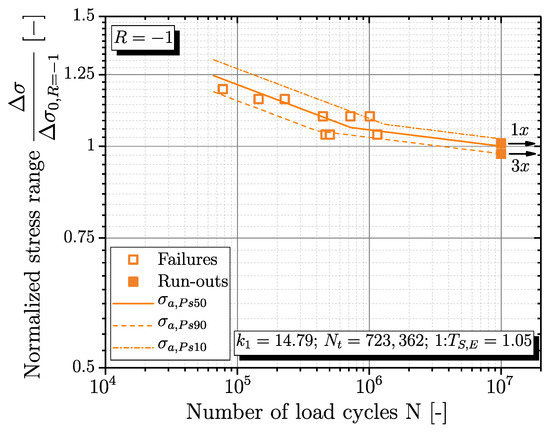
Figure 6.
Evaluated S-N curve at .
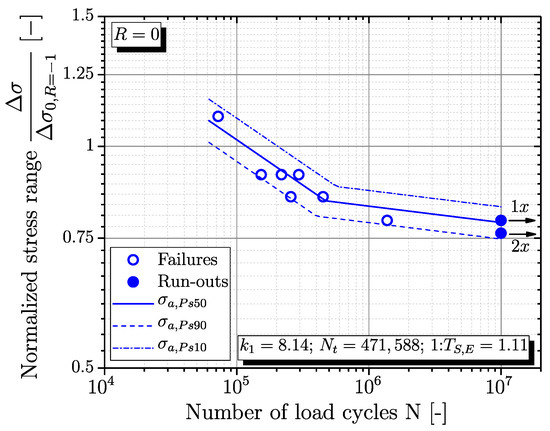
Figure 7.
Evaluated S-N curve at .
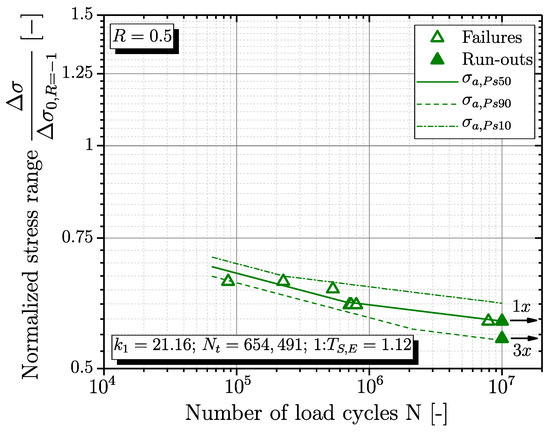
Figure 8.
Evaluated S-N curve at .
The results of the experimental tests are subsequently compared to the estimated values of the mean stress approaches in terms of a Haigh diagram, see Figure 9. Additionally, Table 3 lists the resulting deviations of the fatigue strength at . The comparison exhibits, that Soderberg’s concept underestimates the empirical data by nearly 24%. Contrarily, Gerber’s method leads to an non-conservative estimation of the fatigue strength. As shown in Table 3, the mean stress approach of the common engineering FKM guideline provides an applicable estimation of the material’s fatigue strength at with a quite small deviation of 4%. Therefore, the assessment of the material’s mean stress sensitivity can be conducted by means of the procedure provided in [50]. It should be noted that the applied FKM-guideline mean stress model is rather conservative for high tensile mean stresses as the measured yield to tensile strength ratio is quite low. Thus, for high stress ratios, Goodman’s approach utilizing a linear relation might be more appropriate.
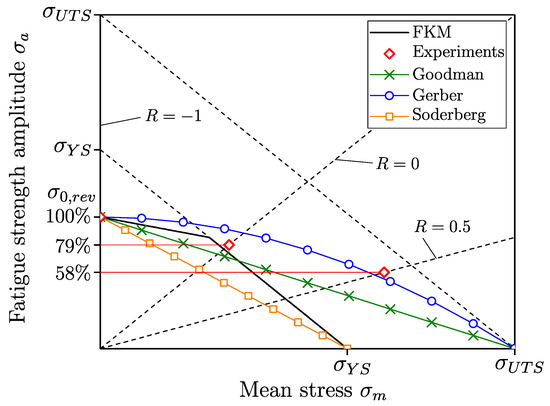
Figure 9.
Haigh diagram depicting the experimental results.
Table 3.
Deviations between the estimated stress ranges by the different mean stress models and the experimentally evaluated data at .
In order to apply the chosen mean stress approach on macroscopic defect afflicted cast steel components, large-scale specimens are developed by means of numerical simulations. Therefore, the casting simulation tool Magma 5© is utilized for the design process of the representative specimen geometry. In the following, a brief summary about the design process is given, for details see [23]. At first, the specimen’s dimensions are set to a diameter of mm and a total length of mm. The location of the intended porosity is in the centre of the specimen and characterized by a larger diameter of 52 mm and constricted by narrow sections on both sides to induce a local undersaturation. This facilitates the formation of macroscopic shrinkage porosities. The moulding geometry is depicted in Figure 10, whereas the final specimen geometry is illustrated by Figure 11.
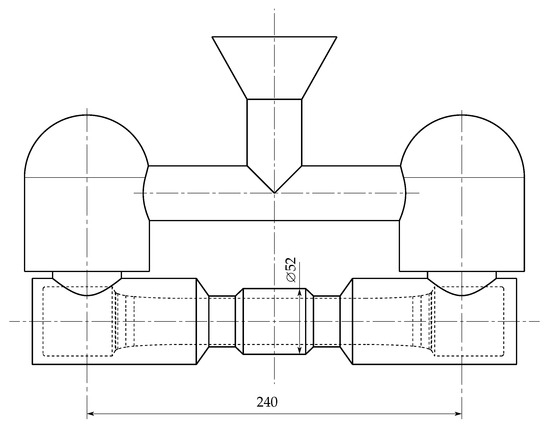
Figure 10.
Model of the mould configuration including the final specimen geometry.
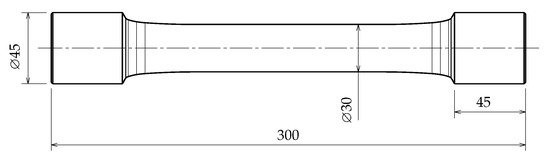
Figure 11.
Final geometry of the large-scale specimen.
Subsequent to the casting of the specimens, a normalizing heat treatment is conducted to ensure a consistent microstructure equivalent to the small-scale specimens. In order to evaluate the mould design and casting process, non-destructive tests on the large-scale specimen are subsequently carried out by means of X-ray and computed tomography (CT) examinations. Figure 12 and Figure 13 illustrate the CT and X-ray examination of a macroscopic defect at centre of specimen #30. The defect exhibits spatial dimensions of 15 mm in length and about 4 mm in diameter. Furthermore, the total lengths of selected defects, both derived from CT and X-ray, are listed in Table 4.
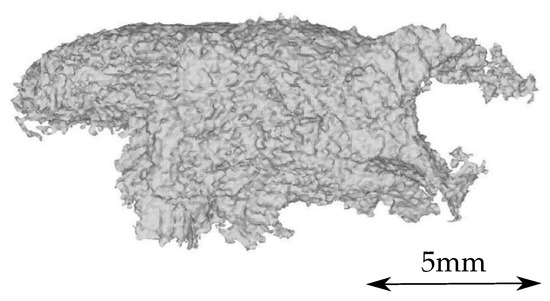
Figure 12.
Computed tomography (CT) scan of large-scale specimen #30.
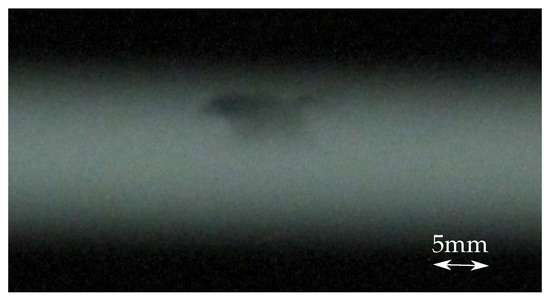
Figure 13.
X-ray examination of large-scale specimen #30.
Table 4.
Total lengths of selected macroscopic shrinkage defects.
Subsequent to the non-destructive tests, the large-scale specimens are fatigue tested with constant amplitudes under varying load stress ratios, and . The experimental test series are carried out on a resonance test rig MOT600kN (SincoTec, Clausthal-Zellerfeld, Germany) with an average test frequency of 80 Hz at room temperature. Thereby, the investigations are executed either until burst failure occurs or ten million load cycles are achieved, identically to the small-scale test settings. Run-out specimens are re-inserted and tested again at a higher load level to provoke a burst failure. Regarding the statistical assessment of the fatigue strength, the standard [54] is applied in the finite-life and the arcsine approach [55] is utilized in the long life fatigue region. The results of the high-cycle fatigue tests considering both load stress ratios are illustrated in Figure 14 and Figure 15 in terms of filled circles and triangles. Furthermore, the re-inserted specimens are depicted by framed circles and triangles, respectively. The stresses are again normalized in regard to the fully-reversed small-scale specimen long life fatigue limit of the plain material . Since the prior conducted non-destructive test exhibited different enclosed defects in terms of their shapes, the fatigue results are differentiated between failure type A (FT#A), for the crack-like imperfections, and failure type B (FT#B) concerning the more globular pores.
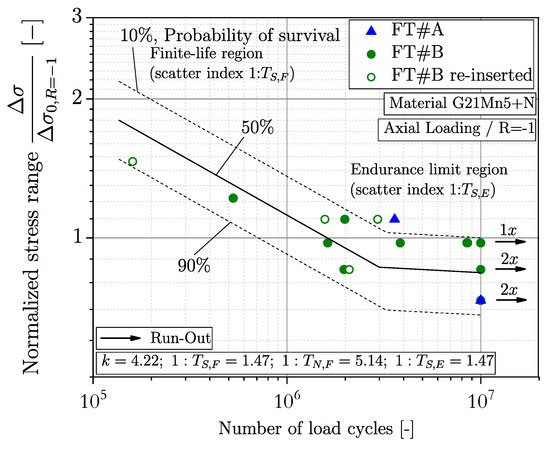
Figure 14.
Evaluated S-N curve of the investigated large-scale specimens at . Failure type A (FT#A), and failure type B (FT#B).
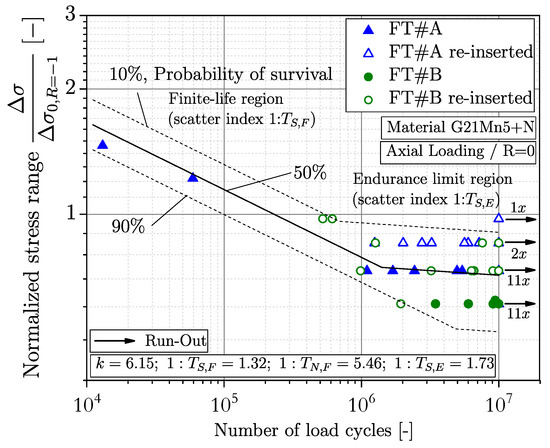
Figure 15.
Evaluated S-N curve of the investigated large-scale specimens at .
Despite numerical simulations and a reproducible execution of the casting process, the observed shape and size of the macroscopic defects vary from one to each other. Accordingly, the fatigue test results exhibit an enhanced scatter band, especially in the endurance limit region. Further on, fracture surface analysis of the investigated specimens are conducted in order to evaluate the sizes and shapes of the failure initiating defects. Thereby, two fundamental different types of flaws can be identified, referred as FT#A and FT#B, which are shown as blue triangles and green circles in Figure 14 and Figure 15. The FT#A defect is characterized by a star-shaped appearance and a rectangular orientation concerning the specimen’s axis. On the contrary, the FT#B specimens exhibit a more globular shaped defect as well as an axis parallel alignment. Both defect types are depicted by representative fracture surfaces in Figure 16. However, concerning the subsequent fatigue assessment, the defect size has to be determined at first. Hence, the area of the flaw is directly measured from the fracture surface of the investigated specimens and subsequently the equivalent circle diameter (ECD), exhibiting an equal defect area, is calculated.
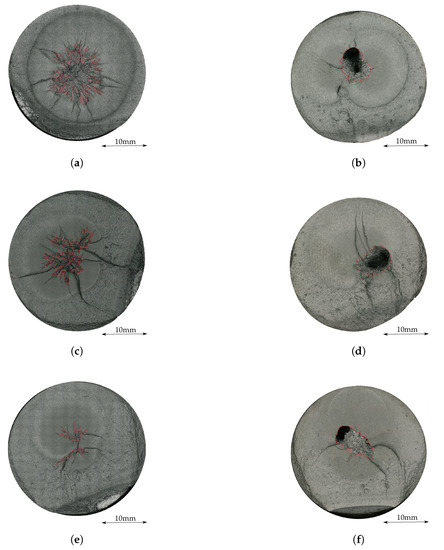
Figure 16.
Fracture surfaces of representative FT#A and FT#B defects. (a) FT#A Specimen #10 (b) FT#B Specimen #29 (c) FT#A Specimen #11 (d) FT#B Specimen #30 (e) FT#A Specimen #13 (f) FT#B Specimen #31.
Moreover, to evaluate the effect of defects on the mean stress sensitivity, the results of both, the small-scale and large-scale specimens, are evaluated in Figure 17. The fully-reversed fatigue limit of the defect-afflicted specimens illustrates a reduction to 42% of the plain material fatigue strength. Considering the results at the ratio, a relative drop from the plain fatigue limit can be determined to be about 45%. Calculation of the mean stress sensitivities based on the experimental results of the small-scale specimens, representing a near-defect-free material, the large-scale defect-afflicted specimens, and the FKM guideline approach [50], utilizing only the ultimate tensile strength as characteristic material parameter, shows severe changes in the observed value. In detail, the engineering guideline provides a slightly reduced mean stress sensitivity compared to the base material; shrinkage pore afflicted large-scale specimens exhibit a significant decrease in mean stress sensitivity, as depicted in Table 5. Hence, it can be concluded that the experimentally determined cast steel mean sensitivity is in line with the guideline, but the mean stress sensitivity ought to be affected by the shrinkage porosities.
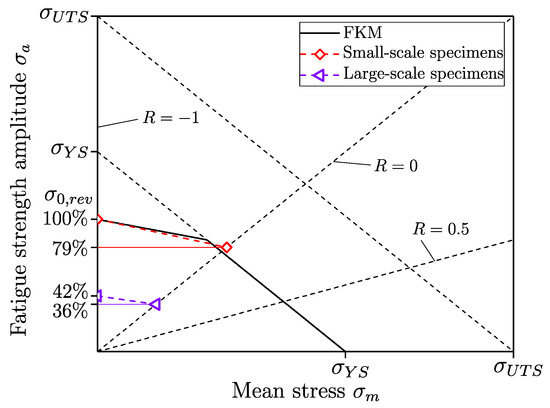
Figure 17.
Haigh diagram representing small- and large-scale specimens results.
Table 5.
Mean stress sensitivities determined by fatigue tests and FKM guideline.
However, a mean stress state also influences the short- and long-crack propagation behaviour of the material and needs to be considered for a latter Kitagawa–Takahashi assessment. Therefore, experimental cyclic crack growth investigations have to be performed to study the material’s fracture mechanical behaviour under varying load stress ratios.
2.2. Fatigue Crack Propagation Testing
In order to assess the material’s fracture mechanical behaviour in terms of short- and long crack growth under different load stress ratios, fatigue crack propagation tests are conducted on the near-defect-free material. Therefore, single edge notched bending specimens (SENB) are manufactured from similar positions as the corresponding small-scale high cycle fatigue specimens. The utilized geometry of the investigated specimens is illustrated in Figure 18. The entire set of fracture mechanical specimens is prepared in accordance to the proposed procedure in [44]. At first, the V-shaped tip of the milled notch is razor blade polished to establish an even sharper notch at the notch root, as recommended in [58,59]. Secondly, the specimens are pre-cracked in terms of a cyclic compression-compression load at a load stress ratio of with a maximum load level of until an incipient crack with a length between 100 and 200 m is determined [60,61]. Consequently, residual tensile stresses are built-up in this plastic zone at the crack tip, provoking an emanating incipient crack exhibiting minimized crack closure effects [45].
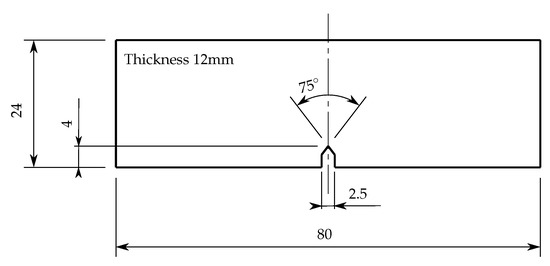
Figure 18.
Single edge notched bending specimens (SENB) specimen geometry.
Subsequent to the specimens preparation, cyclic crack growth tests are performed on the resonance testing machine Cracktronic© (Manufacturer: Russenberger Prüfmaschinen AG, City: Neuhausen am Rheinfall, Country: Switzerland) applying a constant amplitude load [61]. The measurement of the crack propagation is executed by the potential voltage drop methodology, as outlined in [62], in order to assess the emerging stress intensity factor during crack growth [63,64]. The results of the fracture mechanical investigations in terms of crack propagation curves for different load stress ratios are depicted in Figure 19. Further corresponding details are given in [65].
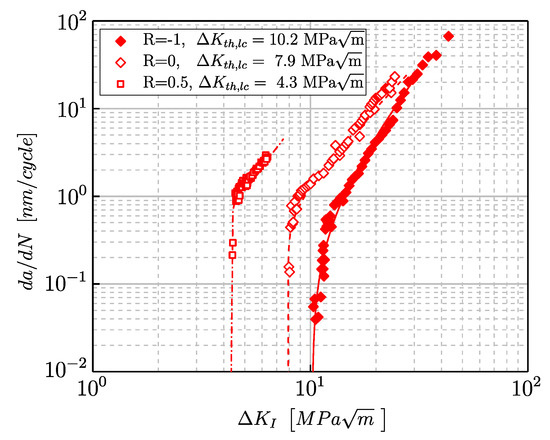
Figure 19.
Resulting cyclic crack propagation data under , and .
The empirical data of the and investigations could be tested up to the stable crack growth region. Contrarily, the data region is truncated due to the upper force limit of the test rig. Nevertheless, the evaluation of the long crack stress intensity factor threshold values could be performed by utilizing the approach by Klesnil and Lukáš [66], see Equation (8).
The results illustrate the influence of the load stress ratio by means of a decreased at elevated R-ratios, which can be attributed to diminishing crack closure effects. In addition, Newman’s approach, utilizing Equation (5), is applied on the experimental data, to evaluate the effect of the load stress ratio on the long crack stress intensity factor threshold values. Since no investigations under R-ratios lower than are conducted, the long crack threshold is limited to the fully-reversed value to establish a conservative limit of the upper boundary. As depicted in Figure 20, the approach exhibits a sound agreement with the empirical data. Furthermore, Newman’s approach estimates the long crack threshold at elevated R-ratios , which equals the effective threshold as . The filled circles in Figure 20 correspond to the experimentally determined long crack thresholds of the crack propagation curves of Figure 19.
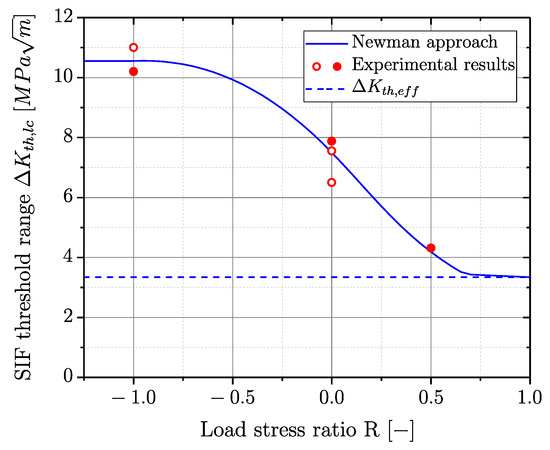
Figure 20.
Experimental fatigue crack growth data compared to Newman’s approach.
Since, the influence of the mean stress on the fatigue limit and on the fracture mechanical threshold is determined for the investigated material, a generalized Kitagawa diagram (GKD) can be set-up to assess the fatigue strength of the porosity afflicted large-scale specimens in a unified approach.
3. Application of the Generalized Kitagawa Diagram
Firstly, in order to set up the GKD, the characteristic values and must be determined utilizing Equations (3) and (4). In order to take the mean stress sensitivity into account, the R-ratio dependencies according to the FKM guideline [50] and Newman’s approach [43] are used.
Secondly, considering the assessment of the macroscopic shrinkage porosities, a relation between the defect size, referring to the equivalent circle diameter (ECD), and the effective defect size has to be established. Defect types, as depicted in Figure 16, are difficult to assess concerning the effect on the local fracture mechanical stress intensity factors due to their partially irregular shapes. The literature offers a wide variety of studied simple geometrical shapes and the corresponding fracture mechanical geometry factor solutions [67,68]. Referring to an engineering-feasible substitutional shape, a correlation between the arbitrarily-shaped defects and a corresponding penny-shaped crack has been studied in [23] by means of numerical crack growth simulations. In the following, the assessment approach is briefly reviewed. Details about the crack propagation rates, corresponding simulations and the results were given in [23].
The numerical analysis aims to link the arbitrary flaw ECD and the initial diameter of the penny-shaped crack in terms of a similar crack propagation lifetime. Therefore, several defect shapes of both defect types, FT#A and FT#B, are imported from the fracture surfaces into three-dimensional finite-element models, whereas the defects are simplified and integrated as two-dimensional cracks, considering an already initiated crack. The applied stresses in the simulation are in correspondence with the applied stresses of the experimental tests. The calculation of the local stress intensity factor ranges is conducted by the finite-element simulation tool Abaqus© (Version: 6.14). The subsequent determination of the local crack propagation rate around the perimeter is executed by means of the modified NASGRO equation [44]. The incremental simulations feature a crack growth of m per step. Furthermore, the self-iterating crack growth model is stopped if the critical stress intensity range is detected at any point of the crack front perimeter.
A subsequent comparison of the numerical results exhibits a similar crack propagation rate between an FT#A defect and an penny-shaped crack. But for the FT#B defects, a penny-shaped crack of size results in a similar lifetime [23].
According to these findings, the defect ECDs, which are derived from the fracture surface analysis, are recalculated to obtain the effective defect sizes. Depending on the shape and orientation of the pores, the values are either determined by the factor or [23]. The results of the fatigue assessment are illustrated in Figure 21 and Figure 22, where the effective defect sizes are obtained by fracture surface analysis. Thereby, the experimental load level of each specimen is plotted over the corresponding effective defect size. The aforementioned defect types are distinct by means of blue and green markers for FT#A and FT#B defects, respectively. Furthermore, tests that resulted in premature burst failure are depicted as ‘×’ and run-outs are illustrated as ‘∘’. The blue and green lines represent the long-life fatigue limits at ten million load cycles for V-notches with and opening-angles and are calculated in accordance with Equation (2). Additionally, it should be noted that the sketched fatigue strength design curves correspond to a probability of survival of 50%.
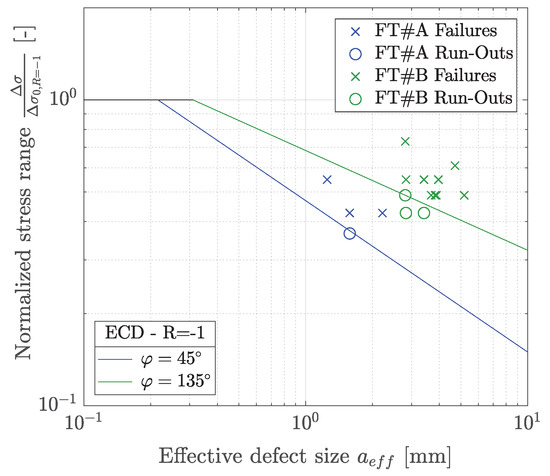
Figure 21.
Generalized Kitagawa diagram (GKD) assessment of afflicted specimens at stress ratio with a cut-off fatigue life of , where the defect size is based on fracture surface analysis.
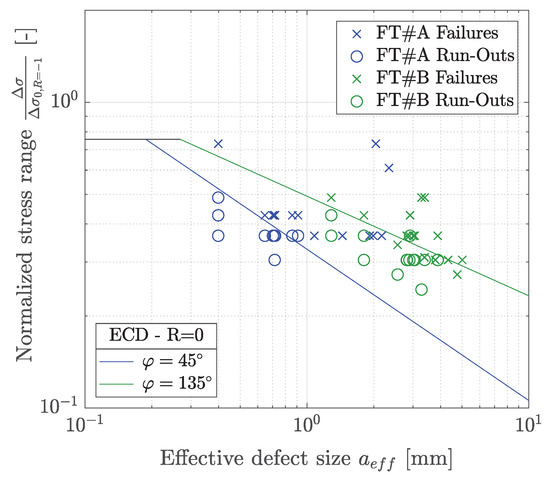
Figure 22.
Generalized Kitagawa diagram at stress ratio with a cut-off fatigue life of , where the defect size is based on fracture surface analysis.
The calculated fracture mechanics results show a sound agreement for both opening angles. Thereby, a valid relation between the FT#A and the line and between FT#B and the line can be detected for both R-ratios. Consequently, a link between the spatial orientation of the defects and the opening-angle dependent GKD design curves is present in this context. The FT#A defects, which are rectangularly aligned regarding the specimen’s axis and additionally exhibit a shallow depth, depict a crack similar geometry. The determined stress singularity of a V-notch results in , calculated by Equation (1). As a comparison, the stress singularity of a crack results in a value of . Hence, the assessment of shrinkage pores, which exhibit a crack like orientation and shape, can be satisfactorily conducted by a NSIF approximation based on these results.
Since a fracture surface based defect assessment is not feasible in an industrial manufacturing environment, the sizes of the defects are additionally non-destructively determined from X-ray results on specimens before cyclic testing. Therefore, the radiographic films from two rectangular directions are utilized for the measurement of the defect size. The average flaw size values are further utilized for the generalized Kitagawa diagram, as illustrated in Figure 23. Compared to Figure 22, which illustrates the GKD where the defect sizes are obtained by fracture surface analysis, a similar distribution concerning FT#A and FT#B failures and run-outs can be determined. Nevertheless, a reduced quantity of data points is depicted in the X-ray based diagram, due to a limited detectability of the porosities during the non-destructive testing. Hence, an X-ray based assessment enables equivalent results compared to a fracture surface based evaluation; however, the probability and reliability of detection represents the key aspects in this concern for engineering applicability.
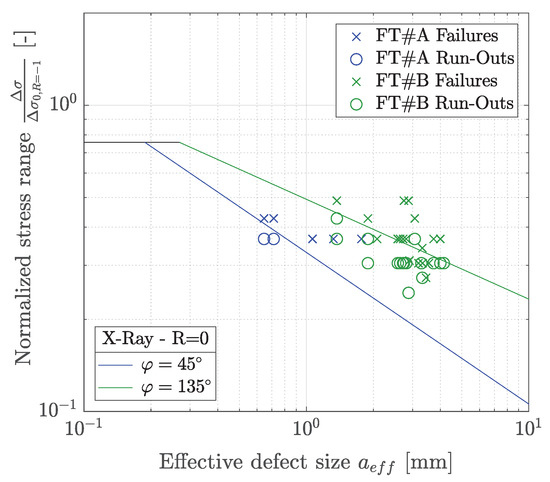
Figure 23.
Generalized Kitagawa diagram at stress ratio based on X-ray imperfection size evaluation results.
Due to the estimations based on Newman’s approach and the fatigue limit model of the FKM guideline, the GKD can be enhanced towards the load stress ratio as the diagram’s third axis. This enables a holistic defect assessment considering the spatial orientation, defect size and the present mean stress, as depicted by Figure 24 and Figure 25.
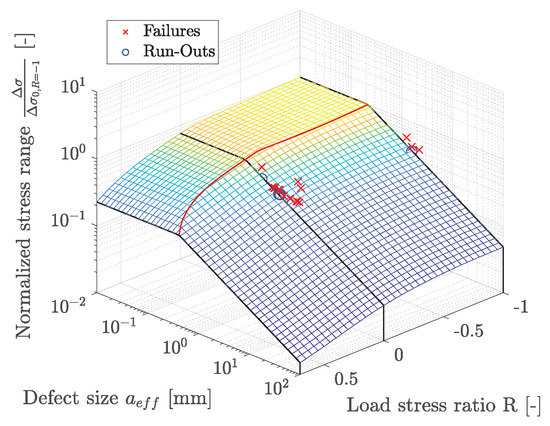
Figure 24.
GKD for FT#A defects enhanced by the mean stress effect.
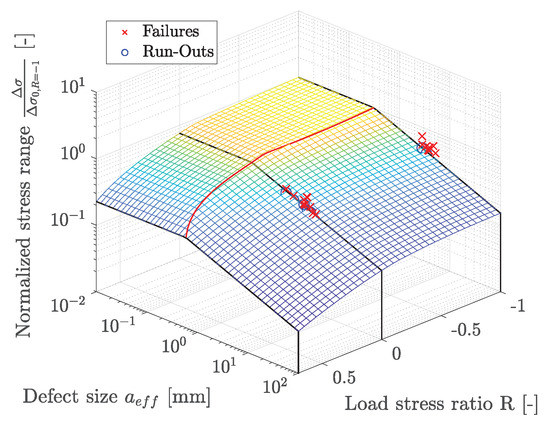
Figure 25.
GKD for FT#B defects enhanced by the mean stress effect.
Based on the overall shape, the derived GKD can be separated into two regions, represented by the red line as a common border. The area exhibiting defect sizes is solely influenced by the Haigh diagram given by the FKM guideline. Contrarily, the area based on notch fracture mechanics, , is additionally affected by Newman’s approach. Therefore, the overall shape of the GKD surface is dependent on the applied load stress ratio, except the slope towards the defect size, which is itself entirely influenced by the stress singularity , hence the notch-opening angle. The red transition line exhibits a slight decrease of the in the range . However, if the load stress ratio exceeds a value of , the transition knee point increases significantly to higher effective defect sizes. Furthermore, a considerable drop of the fatigue limit is obtained at load stress ratios due to elastic yield limitations resulting from the Haigh diagram.
Since the build-up of a probabilistic fatigue database, which consists of a large bulk of defects that exhibit varying shapes and spatial orientations, can substitute a high quantity of experimental effort, a numerical algorithm is further developed in order to generate such artificial porosities. Thereby, it is necessary to partially specify and limit the global shape of the flaws to keep the investigated geometries related to the investigated manufacturing process itself, but to also leave space for randomly artificially generated defects.
4. Assessment of Artificially Generated Defects
In order to establish artificial casting defects numerically, the algorithm of cellular automata (CA) is utilized. As already proposed in recent publications, the application of CA leads to satisfying results concerning the modelling of porosity formation and pore growth [69,70,71]. The presented results within this paper demonstrate the basic applicability of the developed tool, further details are provided in a preceding scientific work [72].
At first, a 50 mm × 50 mm square grid, which acts as the plane basis of the porosity is generated. To construct a third dimension, 50 entities of this grid are equidistantly stacked on top of each other. Each cell of the generated cube can exhibit a state of either zero or one. For an initial set of the generated array, a random distribution of the available states is assigned. Thereby, a limiting hull curve is prescribed to constrain the basic shape of the porosity. Inside of the hull curve, the cells are able to be assigned either zero or one. Contrarily, outside the limiting curve, the individual cells are allocated with zero.
Secondly, the algorithm of the cellular automaton is applied under consideration of the three-dimensional Moore neighbourhood [73]. In order to avoid an excessive smoothing of the surface, the routine is applied in two subsequent runs.
Finally, the resulting array is converted into a point cloud, representing all cells that have the value of one assigned. Thereafter, the surface points are triangulated and smoothed. Figure 26 exemplarily illustrates a generated defect, which represents quite well the observed shrinkage porosity of FT#B within the investigated cast steel large-scale specimens.
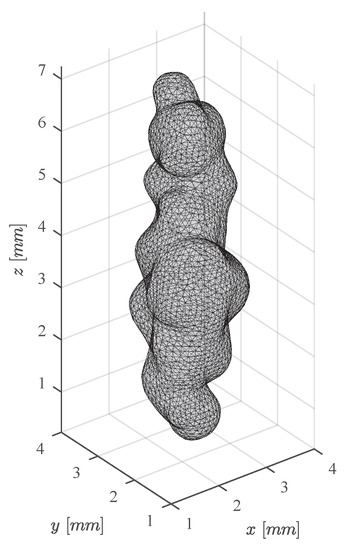
Figure 26.
Numerically generated shrinkage porosity.
Moreover, the triangulated pore is subsequently imported into a finite-element model exhibiting the large-scale specimen’s geometry. The model is meshed by means of quadratic tetrahedral elements and loaded with a uniform tensile stress along the model’s z-axis.
In order to assess the numerically generated pores on the basis of the generalized Kitagawa diagram, the defect’s ECD and an effective notch-opening angle has to be determined. The equivalent circle diameter is determined during the numerical generation of the pore by means of the projected defect area in the x–y plane. Relating to the effective notch-opening angle, an assessment of the vicinity around the maximum stress has to be conducted. Therefore, the nodal maximum principal stress and the corresponding normal surface vector has to obtained for the whole modelled defect surface. Subsequently, the defect is intersected with a plane that is spanned by the normal surface vector and a parallel vector, to the centre axis of the specimen. The obtained intersection curve of the pore, especially the section around the node of the maximum principal stress, is utilized for the assessment of an effective notch-opening angle. Hence, an empirical study of computed tomography measured imperfections fatigue data yielded that the length of the used secants should correspond to a value of for a proper assessment of the equivalent notch-opening angle as depicted in Figure 27. The resulting angle between both secants is subsequently evaluated and further utilized as the equivalent opening angle for the determination of the local NSIF value, applicable both for measured and artificially generated defects. Additionally, it should be mentioned that Neuber’s rule may also be applicable once the defects and notch radii attain a certain size.
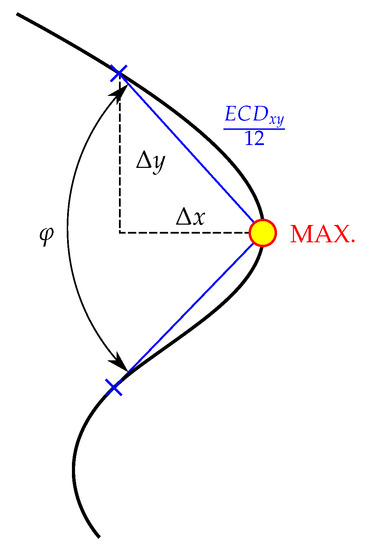
Figure 27.
Determination of the effective notch-opening angle.
In order to examine the sensitivity of the proposed approach, the numerical algorithm is utilized to generate several macro-geometry related porosities for each individually measured defect. Hereby, attention is paid to the occurrence of similar geometrical characteristics, as found at the computed tomography scans of the large-scale specimens. Further on, finite-element simulations, with a unified applied stress, are conducted in order to assess the local NSIF values and the corresponding fatigue limits, according to Equation (9). The resulting data is subsequently averaged and compared to the experimental test data as sensitivity qualifier, see Equation (10).
For illustration, three different porosities from the CT measurements are selected. Correspondingly, artificially numerical pores, which possess a similar overall shape and ECD, are generated. The selected casting defects and a corresponding numerically generated defect are sketched in Figure A1.
The results of the finite-element simulation and the subsequent calculation of the estimated fatigue limits as well as the equivalent circle diameters are summarized in Table 6.
Table 6.
Comparison of computed tomography and numerically generated porosities. Equivalent circle diameter (ECD).
Referring to the results of the specimens #31 and #32, the estimated mean fatigue limits are both below the applied experimental stress ranges. In the case of specimen #31, the applied load was endured for about load cycles, whereby ten million load cycles are regarded as run-out. In terms of specimen #32, the test was aborted due to burst failure at about load cycles. Considering both estimated stress range limits, specimen #31 exhibits a smaller deviation to the applied stress range by 6 MPa than specimen #32 with 23 MPa. Concerning the third illustrated porosity, specimen #34, the experiment resulted in a run-out at MPa, and further, to a burst failure at 175 MPa at about load cycles. The accordingly generated defects and the accompanying fatigue assessment obtained an estimated fatigue stress range of 162 MPa, which is located between both experiments. Summing up, the numerical algorithm and the subsequent fatigue assessment deliver an averaged conservative deviation of 7.8%. Moreover, in [72] an extended study of ten specimens and their corresponding defects is performed, which results an average conservative deviation of 6%.
Furthermore, a mesh sensitivity study is conducted in order to evaluate the fatigue limit dependency on the element size. Therefore, the artificially generated porosity of specimen #31 is numerically evaluated by means of constant boundary conditions and an identical flaw shape, but exhibiting four different mesh sizes, including the average element sizes 500 m, 250 m, 167 m and 125 m as depicted in Figure 28. The results of the subsequent assessment is listed in Table 7.
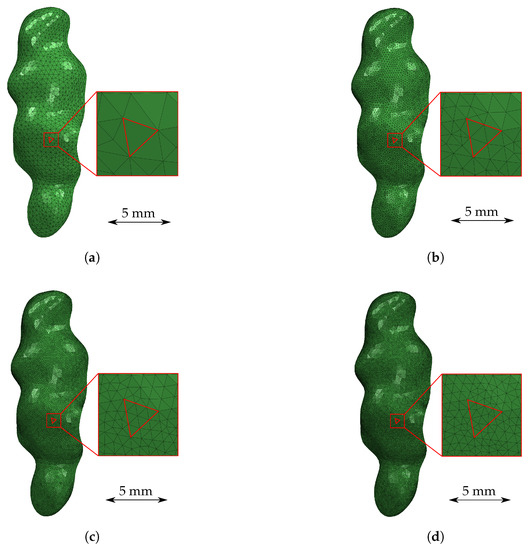
Figure 28.
Mesh sensitivity study of numerically generated porosity specimen #31 (a) Average element size: 500 m (b) Average element size: 250 m (c) Average element size: 167 m (d) Average element size: 125 m.
Table 7.
Results of the mesh sensitivity study of the specimen #31 porosity.
Thereby it can be stated that the node of maximum principal stress is almost unchanged and thus independent from the mesh size. Contrarily, the refined mesh exhibits an increasing stress concentration factor, but the evaluated NSIF-value is only slightly affected. Referring to the evaluated fatigue limits, which are normalized to the result of the 500 m model, the refined mesh study exhibits only small deviations. In detail, models with mesh seed of 250 m, 167 m and 125 m lead to variances of 4%, 3% and 1%, respectively.
Concluding, an increasing mesh refinement results in a more accurate stress concentration factor. Furthermore, the study shows that the estimated fatigue limits are nearly unchanged. Additionally, it should be noted that a mesh refinement of the analysed imperfections lead to a significant increase of up to 400 times in terms of in calculation time.
Considering the results and a comparison of the experiments and numerically generated artificial pores, the NSIF-based approach offers sound applicability as an assessment tool. Furthermore, the utilization of artificially generated porosities provides a basic database for the probabilistic assessment of non-destructively detected casting flaws, which will be statistically covered in more detail in ongoing research work.
5. Conclusions
Based on the conducted investigations and presented results in this paper, the following scientific conclusions can be drawn:
- The mean stress sensitivity approach of the FKM guideline provides a basically matching fatigue assessment relating to the cast G21Mn5 material. Referring to the defect-free base material on small-scale specimens, the guideline assesses a 16% reduced mean stress sensitivity. On the contrary, considering the large-scale defect-afflicted specimens, the FKM guideline estimates a 24% increased mean stress sensitivity.
- The NSIF-based generalized Kitagawa diagram (GKD) represents an engineering feasible tool for the assessment of shrinkage porosities in cast steel for different types of defect shapes and orientations.
- Furthermore, the fatigue assessment of shrinkage defects, by applying the GKD based on defect sizes taken from X-ray measurements, exhibits a satisfying agreement regarding the experimental results. It should be noted that it is essential to ensure the detectability of casting defects at X-ray investigations to facilitate a conservative fatigue design. Hence, it is recommendable to assume a minimum defect size according to the invoked NDT technique for engineering applications.
- The enhancement of the generalized Kitagawa diagram towards the applied load stress ratio facilitates a unified fatigue assessment approach, which takes both the defect parameters and the loading conditions into account.
- The presented numerical cellular automata algorithm, which enables the generation of artificial defects, shows a sound consistency with referenced experimental data leading to a conservative deviation of 7.8% and therefore offers ongoing research the set-up of a comprehensive defect database, consisting of different shapes, orientations, and sizes and even their corresponding estimated fatigue limits.
Author Contributions
Conceptualization, M.S. (Manuel Schuscha) and M.L.; methodology, M.S. (Manuel Schuscha) and M.H.; software, M.S. (Manuel Schuscha) and M.H.; validation, M.S. (Manuel Schuscha), M.H. and M.L.; formal analysis, M.S. (Manuel Schuscha) and M.H.; investigation, M.S. (Manuel Schuscha); resources, M.S. (Michael Stoschka); data curation, M.S. (Manuel Schuscha) and M.H.; writing—original draft preparation, M.S. (Manuel Schuscha); writing—review and editing, M.H., M.L. and M.S. (Michael Stoschka); visualization, M.S. (Manuel Schuscha) and M.H.; supervision, M.L. and M.S. (Michael Stoschka); project administration, M.S. (Michael Stoschka); funding acquisition, M.S. (Michael Stoschka).
Funding
The financial support by the Austrian Federal Ministry for Digital and Economic Affairs and the National Foundation for Research, Technology and Development is gratefully acknowledged.
Conflicts of Interest
The authors declare no conflict of interest. The founding sponsors had no role in the design of the study; in the collection, analyses, or interpretation of data; in the writing of the manuscript, or in the decision to publish the results.
Abbreviations
The following abbreviations are used in this manuscript:
| Plain fatigue limit range under fully-reversed axial loading | |
| Long crack stress intensity factor threshold range | |
| Notch stress intensity factor range | |
| Effective stress intensity factor threshold range | |
| Long crack notch stress intensity factor threshold range | |
| Gross section stress range | |
| Applied stress range during experiment | |
| Estimated fatigue limit stress range | |
| Stress singularity | |
| William’s eigenvalue | |
| Mean stress | |
| Ultimate tensile strength | |
| Yield strength | |
| Notch-opening angle | |
| Material dependent parameters | |
| ASTM | American Society for Testing and Materials |
| E | Young’s Modulus |
| Mean stress sensitivity | |
| CA | Cellular Automata |
| CT | Computed tomography |
| ECD | Equivalent circle diameter |
| FE | Finite element |
| FT#A | Failure type #A |
| FT#B | Failure type #B |
| GKD | Generalized Kitagawa diagram |
| KTD | Kitagawa–Takahashi diagram |
| LEFM | Linear elastic fracture mechanics |
| NASGRO | Crack growth model according to Forman-Mettu |
| NDT | Non-destructive testing |
| NSIF | Notch stress intensity factor |
| R-ratio | Load stress ratio |
Appendix A. Computed Tomography and Corresponding Generated Porosities

Figure A1.
Investigated shrinkage porosities and corresponding artificial defects (a) CT: Specimen #31 (b) Numerically generated porosity: Specimen #31 (c) CT: Specimen #32 (d) Numerically generated porosity: Specimen #32 (e) CT: Specimen #34 (f) Numerically generated porosity: Specimen #34.
References
- Campbell, J. Complete Casting Handbook: Metal Casting Processes, Techniques and Design; Elsevier Butterworth-Heinemann: Oxford, UK, 2011. [Google Scholar]
- E07 Committee. Standard Reference Radiographs for Steel Castings Up to 2 in. (50.8 mm) in Thickness; ASTM International: West Conshohocken, PA, USA, 2015. [Google Scholar] [CrossRef]
- E07 Committee. Standard Reference Radiographs for Heavy-Walled (2 to 412-in. (50.8 to 114-mm)) Steel Castings; ASTM International: West Conshohocken, PA, USA, 2015. [Google Scholar] [CrossRef]
- E07 Committee. Standard Reference Radiographs for Heavy-Walled (412 to 12-in. (114 to 305-mm)) Steel Castings; ASTM International: West Conshohocken, PA, USA, 2015. [Google Scholar] [CrossRef]
- Vishnevsky, C.; Bertolino, N.; Wallace, J. The Effects of Surface Discontinuities on the Fatigue Properties of Cast Steel Sections; Research Project at case Western Reserve University, Steel Foundry Research Foundation; Steel Founders Society of America: Rocky River, OH, USA, 1966; pp. 1–28. [Google Scholar]
- Breznyak, E.; Wallace, J. Impact Porperties of Cast Steel Sections with Surface Discontinuities; Research Project at case Western Reserve University, Steel Foundry Research Foundation; Steel Founders Society of America: Rocky River, OH, USA, 1967; pp. 1–52. [Google Scholar]
- Breznyak, E.; Vishnevsky, C.; Wallace, J. The Effect of Internal Shrinkage Discontinuities on the Fatigue and Impact Properties of Cast Steel Sections; Research Project at case Western Reserve University, Steel Foundry Research Foundation; Steel Founders Society of America: Rocky River, OH, USA, 1969; pp. 1–20. [Google Scholar]
- Heuler, P.; Berger, C.; Motz, J. Fatigue behaviour of steel castings containing near-surface defects. Fatigue Fract. Eng. Mater. Struct. 1993, 16, 115–136. [Google Scholar] [CrossRef]
- Hardin, R.; Beckermann, C. Effect of Shrinkage on Service Performance of Steel Castings. In Proceedings of the 56th SFSA Technical and Operating Conference; Steel Founder’s Society of America: Chicago, IL, USA, 2002. [Google Scholar]
- Sigl, K.; Hardin, R.; Stephens, R.; Beckermann, C. Fatigue of 8630 Cast Steel in the Presence of Shrinkage Porosity. In Proceedings of the 57th SFSA Technical and Operating Conference; Steel Founder’s Society of America: Chicago, IL, USA, 2003. [Google Scholar]
- Hardin, R.; Beckermann, C. Effect of Porosity on Mechanical Properties of 8630 Cast Steel. In Proceedings of the 58th SFSA Technical and Operating Conference; Steel Founder’s Society of America: Chicago, IL, USA, 2004. [Google Scholar]
- Hardin, R.; Beckermann, C. Simulation of the Mechanical Performance of Cast Steel with Porosity: Static Properties. In Proceedings of the 60th SFSA Technical and Operating Conference; Steel Founder’s Society of America: Chicago, IL, USA, 2006. [Google Scholar]
- Hardin, R.A.; Beckermann, C. Effect of Porosity on the Stiffness of Cast Steel. Metall. Mater. Trans. A 2007, 38, 2992–3006. [Google Scholar] [CrossRef]
- Hardin, R.; Beckermann, C. Prediction of Fatigue Life of Cast Steel in the Presence of Porosity. In Proceedings of the 61th SFSA Technical and Operating Conference; Steel Founder’s Society of America: Chicago, IL, USA, 2007. [Google Scholar]
- Collini, L.; Pirondi, A.; Bianchi, R.; Cova, M.; Milella, P.P. Influence of casting defects on fatigue crack initiation and fatigue limit of ductile cast iron. Procedia Eng. 2011, 10, 2898–2903. [Google Scholar] [CrossRef]
- Murakami, Y. (Ed.) Metal Fatigue: Effects of Small Defects and Nonmetallic Inclusions; Elsevier: Amsterdam, The Netherlands, 2002. [Google Scholar]
- Aigner, R.; Leitner, M.; Stoschka, M.; Hannesschläger, C.; Wabro, T.; Ehart, R. Modification of a Defect-Based Fatigue Assessment Model for Al-Si-Cu Cast Alloys. Materials 2018, 11. [Google Scholar] [CrossRef] [PubMed]
- Murakami, Y. Material defects as the basis of fatigue design. Int. J. Fatigue 2012, 41, 2–10. [Google Scholar] [CrossRef]
- Murakami, Y.; Yamashita, Y. Prediction of Life and Scatter of Fatigue Failure Originated at Nonmetallic Inclusions. Procedia Eng. 2014, 74, 6–11. [Google Scholar] [CrossRef]
- Krewerth, D.; Lippmann, T.; Weidner, A.; Biermann, H. Influence of non-metallic inclusions on fatigue life in the very high cycle fatigue regime. Cumulative Fatigue Damage Conference—University of Seville 2003 Cumulative Fatigue Damage Conference. Int. J. Fatigue 2016, 84, 40–52. [Google Scholar] [CrossRef]
- Hardin, R.A.; Beckermann, C. Prediction of the Fatigue Life of Cast Steel Containing Shrinkage Porosity. Metall. Mater. Trans. A 2009, 40, 581–597. [Google Scholar] [CrossRef]
- Schuscha, M.; Leitner, M.; Stoschka, M. Development of a generalized Kitagawa diagram for cast G21Mn5 steel. MATEC Web Conf. 2018, 165, 14010. [Google Scholar] [CrossRef]
- Schuscha, M.; Leitner, M.; Stoschka, M.; Pusterhofer, S.; Meneghetti, G. Numerical crack growth study on porosity afflicted cast steel specimens. Frat. Integrita Strutt. 2019, 13, 58–69. [Google Scholar] [CrossRef]
- Kitagawa, H.; Takahashi, S. Applicability of fracture mechanics to very small cracks or the cracks in the early stage. In Proceedings of the Second International Conference on the Mechanical Behaviour of Materials, Boston, MA, USA, 16–20 August 1976; pp. 627–631. [Google Scholar]
- Williams, M.L. Stress Singularities Resulting From Various Boundary Conditions in Angular Corners of Plates in Extension. J. Appl. Mech. 1952, 19, 526–528. [Google Scholar]
- Gross, B.; Mendelson, A. Plane elastostatic analysis of V-notched plates. Int. J. Fract. 1972, 8, 267–276. [Google Scholar] [CrossRef]
- Atzori, B.; Lazzarin, P.; Meneghetti, G. Fracture mechanics and notch sensitivity. Fatigue Fract. Eng. Mater. Struct. 2003, 26, 257–267. [Google Scholar] [CrossRef]
- Atzori, B.; Lazzarin, P.; Meneghetti, G. A unified treatment of the mode I fatigue limit of components containing notches or defects. Int. J. Fract. 2005, 133, 61–87. [Google Scholar] [CrossRef]
- Atzori, B.; Lazzarin, P.; Meneghetti, G. Estimation of Fatigue Limits of Sharply Notched Components: Oral Reference: FT419. In Proceedings of Fatigue; Elsevier Science Limited: Amsterdam, The Netherlands, 2006. [Google Scholar]
- Savruk, M.P.; Kazberuk, A. Problems of fracture mechanics of solid bodies with V-shaped notches. Mater. Sci. 2009, 45, 162–180. [Google Scholar] [CrossRef]
- Atzori, B.; Lazzarin, P.; Meneghetti, G.; Buffière, J.Y.; Brune, M.; Morel, F.; Nadot, Y. A unifying approach to fatigue design in presence of defects and notches subject to uniaxial loading. MATEC Web Conf. 2014, 12, 9001. [Google Scholar] [CrossRef]
- Lazzarin, P.; Berto, F. From Neuber’s Elementary Volume to Kitagawa and Atzori’s Diagrams: An Interpretation Based on Local Energy. Int. J. Fract. 2005, 135, L33–L38. [Google Scholar] [CrossRef]
- Atzori, B.; Lazzarin, P. Notch Sensitivity and Defect Sensitivity under Fatigue Loading: Two Sides of the Same Medal. Int. J. Fract. 2001, 107, 1–8. [Google Scholar] [CrossRef]
- Atzori, B. Estimation of the fatigue strength of light alloy welds by an equivalent notch stress analysis. Cumulative Fatigue Damage Conference—University of Seville 2003 Cumulative Fatigue Damage Conference. Int. J. Fatigue 2002, 24, 591–599. [Google Scholar] [CrossRef]
- Atzori, B.; Lazzarin, P. A three-dimensional graphical aid to analyze fatigue crack nucleation and propagation phases under fatigue limit conditions. Int. J. Fract. 2002, 118, 271–284. [Google Scholar] [CrossRef]
- Elber, W. The Significance of Fatigue Crack Closure. In Damage Tolerance in Aircraft Structures; ASTM Special Technical Publication 486; Rosenfeld, M.S., Ed.; American Society for Testing and Materials: Philadelphia, PA, USA, 1971; pp. 230–242. [Google Scholar] [CrossRef]
- Schijve, J. Some formulas for the crack opening stress level. Eng. Fract. Mech. 1981, 14, 461–465. [Google Scholar] [CrossRef]
- Walker, K. The Effect of Stress Ratio During Crack Propagation and Fatigue for 2024-T3 and 7075-T6 Aluminum. In Effects of Environment and Complex Load History on Fatigue Life; Rosenfeld, M.S., Ed.; American Society for Testing & Materials: West Conshohocken, PA, USA, 1970; pp. 1–14. [Google Scholar] [CrossRef]
- Mann, T. The influence of mean stress on fatigue crack propagation in aluminium alloys. Cumulative Fatigue Damage Conference—University of Seville 2003 Cumulative Fatigue Damage Conference. Int. J. Fatigue 2007, 29, 1393–1401. [Google Scholar] [CrossRef]
- Kujawski, D. A fatigue crack driving force parameter with load ratio effects. Cumulative Fatigue Damage Conference—University of Seville 2003 Cumulative Fatigue Damage Conference. Int. J. Fatigue 2001, 23, 239–246. [Google Scholar] [CrossRef]
- Zhu, M.L.; Xuan, F.Z.; Tu, S.T. Interpreting load ratio dependence of near-threshold fatigue crack growth by a new crack closure model. Int. J. Press. Vessel. Pip. 2013, 110, 9–13. [Google Scholar] [CrossRef]
- Du, Y.N.; Zhu, M.L.; Xuan, F.Z. Transitional behavior of fatigue crack growth in welded joint of 25Cr2Ni2MoV steel. Eng. Fract. Mech. 2015, 144, 1–15. [Google Scholar] [CrossRef]
- Newman, J.C. A crack opening stress equation for fatigue crack growth. Int. J. Fract. 1984, 24, R131–R135. [Google Scholar] [CrossRef]
- Maierhofer, J.; Pippan, R.; Gänser, H.P. Modified NASGRO equation for physically short cracks. Int. J. Fatigue 2014, 59, 200–207. [Google Scholar] [CrossRef]
- Maierhofer, J.; Kolitsch, S.; Pippan, R.; Gänser, H.P.; Madia, M.; Zerbst, U. The cyclic R-curve—Determination, problems, limitations and application. Eng. Fract. Mech. 2018, 198, 45–64. [Google Scholar] [CrossRef]
- Zerbst, U.; Madia, M.; Vormwald, M.; Beier, H. Fatigue strength and fracture mechanics—A general perspective. Eng. Fract. Mech. 2018, 198, 2–23. [Google Scholar] [CrossRef]
- Goodman, J. Mechanics Applied to Engineering, 8th ed.; Longmans, Green & Co.: London, UK, 1914. [Google Scholar]
- Gerber, H. Bestimmung der zulässigen Spannungen in Eisen-Constructionen; Kgl. Hof- und Universitätsdruckerei Wolf & Sohn: Munich, Germany, 1874. [Google Scholar]
- Soderberg, C.R. Factor of safety and working stress. Trans ASME 1930, 52, 13–28. [Google Scholar]
- Rennert, R.; Kullig, E.; Vormwald, M. Analytical Strength Assessment of Components Made of Steel, Cast Iron and Aluminium Materials in Mechanical Engineering: FKM Guideline, 6th ed.; VDMA-Verl: Frankfurt, Germany, 2012. [Google Scholar]
- Aigner, R.; Leitner, M.; Stoschka, M. On the mean stress sensitivity of cast aluminium considering imperfections. Mater. Sci. Eng. A 2019, 758, 172–184. [Google Scholar] [CrossRef]
- Kwofie, S. An exponential stress function for predicting fatigue strength and life due to mean stresses. Cumulative Fatigue Damage Conference—University of Seville 2003 Cumulative Fatigue Damage Conference. Int. J. Fatigue 2001, 23, 829–836. [Google Scholar] [CrossRef]
- Sekercioglu, T. A new approach to the positive mean stress diagram in mechanical design. Mater. Werkst. 2009, 40, 713–717. [Google Scholar] [CrossRef]
- ASTM. Standard Practice for Statistical Analysis of Linear or Linearized Stress-Life (S-N) and Strain-Life (e-N) Fatigue Data; ASTM E739; ASTM: West Conshohocken, PA, USA, 1991. [Google Scholar]
- Dengel, D.; Karim Khani, M. Arc sine √P transformation—An effective tool for graphical and numerical evaluation of planned Wöhler experiments. Int. J. Fract. 1996, 80, 339–351. [Google Scholar] [CrossRef]
- Sonsino, C. Course of SN-curves especially in the high-cycle fatigue regime with regard to component design and safety. Int. J. Fatigue 2007, 29, 2246–2258. [Google Scholar] [CrossRef]
- DIN. Load Controlled Fatigue Testing—Execution and Evaluation of Cyclic Tests at Constant Amplitudes on Metallic Specimens and Components; DIN 50100; DIN: Berlin, Germany, 2016. [Google Scholar] [CrossRef]
- Tabernig, B.; Pippan, R. Determination of the length dependence of the threshold for fatigue crack propagation. Eng. Fract. Mech. 2002, 69, 899–907. [Google Scholar] [CrossRef]
- Zerbst, U.; Madia, M. Fracture mechanics based assessment of the fatigue strength: Approach for the determination of the initial crack size. Fatigue Fract. Eng. Mater. Struct. 2015, 38, 1066–1075. [Google Scholar] [CrossRef]
- Newman, J., Jr.; Schneider, J.; Daniel, A.; McKnight, D. Compression pre-cracking to generate near threshold fatigue-crack-growth rates in two aluminum alloys. Int. J. Fatigue 2005, 27, 1432–1440. [Google Scholar] [CrossRef]
- Newman, J.C., Jr.; Yamada, Y. Compression precracking methods to generate near-threshold fatigue-crack-growth-rate data. Int. J. Fatigue 2010, 32, 879–885. [Google Scholar] [CrossRef]
- Ritchie, R.O.; Bathe, K.J. On the calibration of the electrical potential technique for monitoring crack growth using finite element methods. Int. J. Fract. 1979, 15, 47–55. [Google Scholar] [CrossRef]
- ASTM. Standard Test Method for Measurement of Fatigue Crack Growth Rates; ASTM E647; ASTM: West Conshohocken, PA, USA, 2000. [Google Scholar]
- ASTM. Standard Test Method for Plane-Strain Fracture Toughness of Metallic Materials; ASTM E399; ASTM: West Conshohocken, PA, USA, 1997. [Google Scholar]
- Schuscha, M.; Aigner, R.; Pomberger, S.; Oberreiter, M.; Leitner, M.; Stoschka, M. On the behaviour of non-propagating cracks in steel and aluminium castings. Eng. Fract. Mech. 2019, 220, 106670. [Google Scholar] [CrossRef]
- Klesnil, M.; Lukáš, P. Influence of strength and stress history on growth and stabilisation of fatigue cracks. Eng. Fract. Mech. 1972, 4, 77–92. [Google Scholar] [CrossRef]
- Murakami, Y. Stress Intensity Factors Handbook; Pergamon Press: Oxford, UK, 1987. [Google Scholar]
- Tada, H.; Paris, P.C.; Irwin, G.R. The Stress Analysis of Cracks Handbook, 3rd ed.; ASME: New York, NY, USA, 2000. [Google Scholar] [CrossRef]
- Zhu, M.; Li, Z.; An, D.; Zhang, Q.; Dai, T. Cellular Automaton Modeling of Microporosity Formation during Solidification of Aluminum Alloys. ISIJ Int. 2014, 54, 384–391. [Google Scholar] [CrossRef]
- Gu, C.; Wei, Y.; Yu, F.; Liu, X.; She, L. Cellular Automaton Study of Hydrogen Porosity Evolution Coupled with Dendrite Growth During Solidification in the Molten Pool of Al-Cu Alloys. Metall. Mater. Trans. A 2017, 48, 4314–4323. [Google Scholar] [CrossRef]
- Hu, Y.; Xie, J.; Liu, Z.; Ding, Q.; Zhu, W.; Zhang, J.; Zhang, W. CA method with machine learning for simulating the grain and pore growth of aluminum alloys. Comput. Mater. Sci. 2018, 142, 244–254. [Google Scholar] [CrossRef]
- Horvath, M. Build-Up of a Numerical Fatigue Assessment Simulation Chain of Imperfected Steel Castings. Master’s Thesis, Montanuniversität Leoben, Leoben, Austria, May 2019. [Google Scholar]
- El Yacoubi, S.; El Jai, A. Cellular automata modelling and spreadability. Math. Comput. Model. 2002, 36, 1059–1074. [Google Scholar] [CrossRef]
© 2019 by the authors. Licensee MDPI, Basel, Switzerland. This article is an open access article distributed under the terms and conditions of the Creative Commons Attribution (CC BY) license (http://creativecommons.org/licenses/by/4.0/).