Article

Assessment of Flow-Line Model in Rolling Texture Simulations

Savaria Institute of Technology, Faculty of Informatics, Eötvös Loránd University (ELTE), Károlyi Gáspár tér 4, 9700 Szombathely, Hungary
Metals 2019, 9(10), 1098; https://doi.org/10.3390/met9101098
Submission received: 26 September 2019 / Revised: 9 October 2019 / Accepted: 10 October 2019 / Published: 12 October 2019

Abstract

:
The nature of the thermomechanical processing of materials can be revealed by means of various numerical approaches. The accuracy of a particular model is linked to the boundary conditions employed. Intensive research activities over the past several decades in the field of finite element modeling (FEM) have enabled the development of various processing chains for particular purposes; however, this technique is computationally expensive, and in many instances, the behavior of materials during a processing step is analyzed by highly efficient analytical models. This contribution focuses on the implementation of a recently developed flow-line model (FLM), which enables the effective texture simulation of cold rolling. The results of numerous calculations, performed for a wide spectrum of roll gap geometries and various friction conditions, revealed that the deformation history predicted by the FLM employed was comparable to FEM calculations. A correlation was defined between the FLM model parameters and the rolling process quantitative indicators, implying that this analytical approach is capable of performing simulations of cold rolling without fitting constraints. It was shown that FLM coupled with a Taylor-type homogenization crystal plasticity model (Alamel) could carry out a texture simulation close to the one performed with deformation history obtained by means of FEM.

1. Introduction

Metals are polycrystalline aggregates composed of numerous grains that can be considered perfect crystals if the materials are fully recrystallized. In order to predict the behavior of polycrystalline materials subjected to macroscopic load, the relationship between microstructures and properties should be known, and therefore, physically based modeling is of key importance. The understanding of microstructural changes is particularly important in setting up the thermomechanical processing (TMP) route. In TMP, the as-cast microstructure is subjected to continuous microstructural transformation. In the case of flat-rolled products, such as Al sheets, this transformation is conditioned by both deformation and recrystallization phenomena, since after casting, the material is subjected to hot rolling, which is followed by cold rolling, and finally the sheet is recrystallized during the final annealing process.
Various modeling approaches that employ diverse length scales (Figure 1) have been developed to reveal the behavior of materials during TMP [1]. It is a common practice to employ phenomenological models for the optimization of properties in groups of metals that do not reveal substantial varieties in chemical composition [1,2]. This strategy likewise works for tailoring a certain metal grade for a particular application. The main disadvantage of phenomenological approximations is that the model parameters need to be recalibrated in the case of a metal grade change or if the TMP quantitative indicators are varied in a wider range of processing windows. In more advanced numerical formulations, such as finite element modeling (FEM), materials are considered as continua, and thus, the mesoscopic phenomena, occurring on the grain levels, are not accounted for in this engineering length scale (Figure 1). Nevertheless, FEM is successfully employed in many fields, especially when there is a need to simulate the response of a system subjected to mechanical load. On the other end of the length-scale spectrum, macroscopic properties are derived from interatomic potentials and by engaging basic principles of molecular thermodynamics, which ensures generic information about the relationships between atomic arrangements and macroscopic properties; however, this formulation is applicable only for ideal systems. The application of atomistic length-scale simulations to metals is restricted due to limitations in computational resources and also because of the fact that polycrystalline structures contain too many crystal defects even in a fully recrystallized state (typically 108 m−2).
Since a 1-mm-thick metallic sheet (A4 size (21 cm × 29.7 cm)) contains approximately 4 billion grains of various crystal orientations, assuming that the average grain size is 25 μm, it becomes clear that neither engineering (continuum) nor atomistic scales are capable of revealing the true nature of mesoscopic transformation involved in TMP. To capture the essence of microstructural changes in industrially produced materials, both mean-field and full-field crystal plasticity (CP) models are employed [1,3,4,5,6,7,8,9]. Either approach implements a certain homogenization scheme insofar as performing calculations for the above-mentioned 4 billion crystals, consisting of even smaller entities, would require enormous computational power. In CP, homogenization implies a characteristic length scale (mesoscopic) represented by grains of polycrystalline aggregate, and these entities are treated as perfect crystals (the in-grain heterogeneities are usually not taken into account). The mesoscopic scale tends to fall between two ends of the characteristic length spectrum, and this level of order is important from a practical perspective, as many of the known properties are controlled by the grain size and crystallographic texture. CP approaches treat the polycrystalline material as a continuum at the level of the crystal because the grain size is order of magnitudes larger compared to the size of molecular domains.
Full-field models [1,3,4] allow for analyzing not only the microscopic and macroscopic responses of material but also account for the evolution of heterogeneities at both levels. Although these methods give rise to a more comprehensive representation of a microstructure and provide detailed information on the deformation flow on meso- and macrolength scales, their practical implementation is limited because of extensive computational time. In contrast, the mean-field models are more computationally efficient, but they have fewer degrees of freedom compared to the full-field methods. For instance, in mean-field approximations [5,6,7,8,9], among other things, each grain interacts with a neighboring one in a way defined by the homogenization scheme, and the misorientation in the grain developed during deformation cannot be captured. Even though some microstructural features are ignored in Taylor-type homogenization CP formulations (such as “visco-plastic self-consistent (VPSC) [7], advanced Lamel (Alamel) [5,6], Cluster V [8], etc.), simulations on a mesoscopic scale are still capable of providing generic knowledge on the relationship between the structure, properties, and performance of a polycrystalline aggregate. Polycrystal models have been successfully employed in simulating the evolution of texture in metals (subjected to diverse strain modes), calculating the plastic strain ratio as well as predicting the cup-earing [5,6,7,8,9,10,11].
Among the many homogenization theories, Alamel [5,6] was employed in this study to simulate the texture evolution in an Al alloy. In this mean-field approach, the grain assembly is subdivided into a number of clusters consisting of two grains, whereas the interaction inside the cluster is governed by the randomly chosen grain boundary orientation. For a given pair of grains, the equilibrium of stresses is accomplished via the strain compatibility. Similarly to the above-listed Taylor-type models [5,6,7,8,9], the grain pair is subjected to a strain mode identical to the macroscopic one. In crystal plasticity formulations (including Alamel), the evolution of texture in face centered cubic (FCC) metals during cold deformation is related to the crystallographic slip on octahedral slip systems, whereas the macroscopic strain mode is approximated by various models. In order to make the application of crystal plasticity modeling practically attainable, the CP should be coupled with the computationally effective approach, which is capable of accurate prediction of deformation flow in a material. When it comes to rolling, the simplest approximation is the plane strain compression, which disregards many aspects of the process. Because of its simplicity, this strain mode is often used in simulations and tends to provide a reasonable estimate of overall (bulk) texture evolution [5,6,8,10]. In FEM, the effect of many technological parameters on the deformation flow can be taken into account, while the displacement history is accurately calculated for various materials at diverse temperatures; however, the model set-up and the calculation procedure are time-consuming. In view of this, deformation is often approximated by analytical solutions [12,13,14,15,16,17,18] such as flow-line models, which are capable of capturing many aspects of the process; however, the practical implementations of these computationally effective approaches are limited by fitting parameters, which have to be derived from the experimental data for each particular case.
Modeling the evolution of deformation texture in Al alloys by combining the basic principles of CP theories and models that are capable of predicting deformation flow is vital, since many crystallographic features evolved in deformation are directly linked to the evolution of recrystallization texture [19,20,21]. The latter determines plastic anisotropy and limits the forming characteristics of a material.
Even though many efforts have been made to model texture development during cold rolling, there are nevertheless many aspects of texture evolution that are still not explained by existing models. The goal of this contribution was to employ computationally efficient and accurate numerical approaches that could ensure quantitatively reasonable texture simulations for the cold rolling process. For this, a well-established CP model (Alamel) [5,6] was coupled with the recently developed FLM [14]. To make the CP simulations practically applicable, a correlation was defined between the FLM model parameters, the roll gap geometry, and the friction coefficient. This implies that combined Alamel–FLM-based modeling can be performed without a fitting procedure, allowing for analyses of the effect of technological quantitative indicators on texture evolution in cold rolling. It is shown that the Alamel–FLM texture simulations revealed both qualitative and quantitative resemblance to the counterparts calculated with the deformation history obtained by means of finite element modeling. The quality of the texture simulations was estimated by comparing the simulated textures to the experimentally measured ones.

2. Materials and Computational Methods

In the current investigation, the evolution of crystallographic texture was studied in an Al–Mg–Si Al alloy from 6016 series. The sheet (1.125 mm thick) was subjected to a 29.6% thickness reduction in a single pass with a roll diameter of 128.9 mm. Prior to cold rolling, the material was annealed at 550 °C to ensure a fully recrystallized microstructure. Both recrystallized (initial) and deformed (rolled) samples were subjected to through-thickness texture measurements by means of the electron backscattering diffraction (EBSD) technique. The orientation data were collected and analyzed by commercial OIM-TSL-8® software (EDAX Inc., Mahwah, NJ, USA).
Sample preparation for orientation imaging microscopy (OIM) was performed according to the standard procedure, which comprises mechanical grinding and polishing as well as electrolytic polishing. The mechanical polishing procedure was finished with DiaDuo-2 Struers®-type 1-μm diamond paste. Electrolytic polishing, as a final step of sample preparation for EBSD, was conducted for ~1 min at a voltage of 18 V with A2 Struers® electrolyte and was cooled to temperatures ranging between −5 and 0 °C.
A Hikari-type EBSD detector was attached to a scanning electron microscope (SEM) FEI®. The OIM data of the investigated material with a fully recrystallized microstructure were collected at an acceleration voltage of 20 kV, whereas in the cold-rolled sample, to avoid overlap of the acquired pattern with ones originating from the deeper layers, the acquisition was performed at a comparatively low acceleration voltage of SEM. An application of 15 kV guaranteed appropriate OIM data acquisition. During OIM measurements, the sample was 70° tilted with respect to the EBSD detector. EBSD mapping was performed on a hexagonal scan grid in the plane perpendicular to the sample transverse direction (TD-plane) extending over the entire thickness of the investigated sample. For accurate texture evaluation, the deformed sample was scanned at a step size of 1.5 μm, while the recrystallized material was investigated at a 5-μm step. In order to ensure a meaningful comparison between the experimentally measured and simulated orientation distribution functions (ODFs), the data were postprocessed with MTM-FHM software [22], and the textures were displayed in φ2 = const. sections.
The evolution of the cold-rolling texture was analyzed by a well-established Taylor-type homogenization approach called Alamel, the comprehensive formulation of which can be found elsewhere [5,6]. The simulations were performed by taking into account {111}<110> octahedral slip systems, which are typically activated in FCC metals during cold-forming processes. Prior to texture simulations, a homogenization of experimentally measured EBSD data, which involves the determination of the representative volume element, had to be performed. In the current case, the measured OIM data were converted to a continuous ODF and afterwards discretized to a set of 8000 equally weighted orientations.
To enable the calculation of texture evolution through the Taylor-type homogenization scheme employed, the deformation history in the form of strain velocity gradients should be provided to the given CP model. Both a two-dimensional finite element method (Deform 2D®) and a recently developed flow-line model (FLM) [14] were employed in the calculation of deformation flow. These approximations are capable of capturing strain heterogeneities across the thickness of a cold-rolled sheet. In the FLM and FEM simulations, the material subjected to rolling is considered to be plastic and isotropic. In FEM, the strain hardening phenomenon is described with a stress–strain curve fitted by piecewise linear segments, whereas the rolls are considered to be fully rigid objects. Contrary to FEM, the FLM employed neglects the strain hardening effect. The following material parameters were used in the FEM simulations for the isotropic aluminum matrix: E = 68.9 GPa (Young’s modulus), ν = 0.33 (Poisson’s ratio), and σy = 80 MPa (yield stress). Since rolling is a symmetric deformation process, the deformation flow was simulated for the following layers: surface, 1/5, 2/5, 3/5, and 4/5 of the half-thickness and midthickness plane. The extracted outputs were used as an input for CP calculations. The results obtained for the FEM-CP and FLM-CP simulations were compared to each other and likewise to their experimentally measured counterparts.

3. Results

3.1. Brief Description of the Flow-Line Modeling Approach

The flow behavior of a material subjected to rolling can be described by various approaches with a diverse degree of accuracy. In many instances, rolling is considered to be the plane strain compression deformation, since this abstraction enables the fast estimation of strain. In this approach, the strain mode is homogeneous across the thickness, while both the strain path changes and the evolution of shear components, caused by friction and roll gap geometry, are neglected. Numerous analytical approaches have been developed for a more accurate description of materials’ behavior in deformation, and the main advantage of these models [12,13,14,15,16,17,18] over other numerical approaches, such as finite element modeling [1], is their efficiency and accuracy. Flow-line models [12,13,14,15,16,17,18] are analytical approaches that are capable of describing the deformation stream under given boundary conditions for a particular process. These formulations have been intensively employed for rolling force and torque calculations and the design of asymmetric and vertical rolling processes [12,13,15,16,17,18]. In the FLM employed, the detailed mathematical description of which is described elsewhere [14], a kinematically admissible displacement velocity field fulfills the following boundary conditions: (a) the entrance and the exit velocities of a rolled sheet are even across the thickness; (b) the incompressibility condition is fulfilled at all points; (c) a material’s flow occurs along the prescribed streamlines; (d) at the surface, the velocity field is conditioned by means of model parameter α, which guarantees a difference between the velocities of the surface and midthickness layers; (e) the variation of the velocity across the thickness is conditioned by the second model parameter n; and (f) the approximation does not allow for any displacement in the transverse direction (TD).
In the FLM employed [14], the material’s flow occurs along the prescribed streamlines, determined by means of Equation (1),
z s = ϕ ( x , z ) = z ς ( x ) = { z 1 e [ 1 + ( s e + ( 1 s e ) ( L d x L d ) 2.1 ) m ] 1 m x L d z 1 e [ 1 + ( s e ) m ] 1 m x > L d
with projected contact length (Ld)
Ld = Rsin(θ)
and
θ = cos−1([R + se]/R),
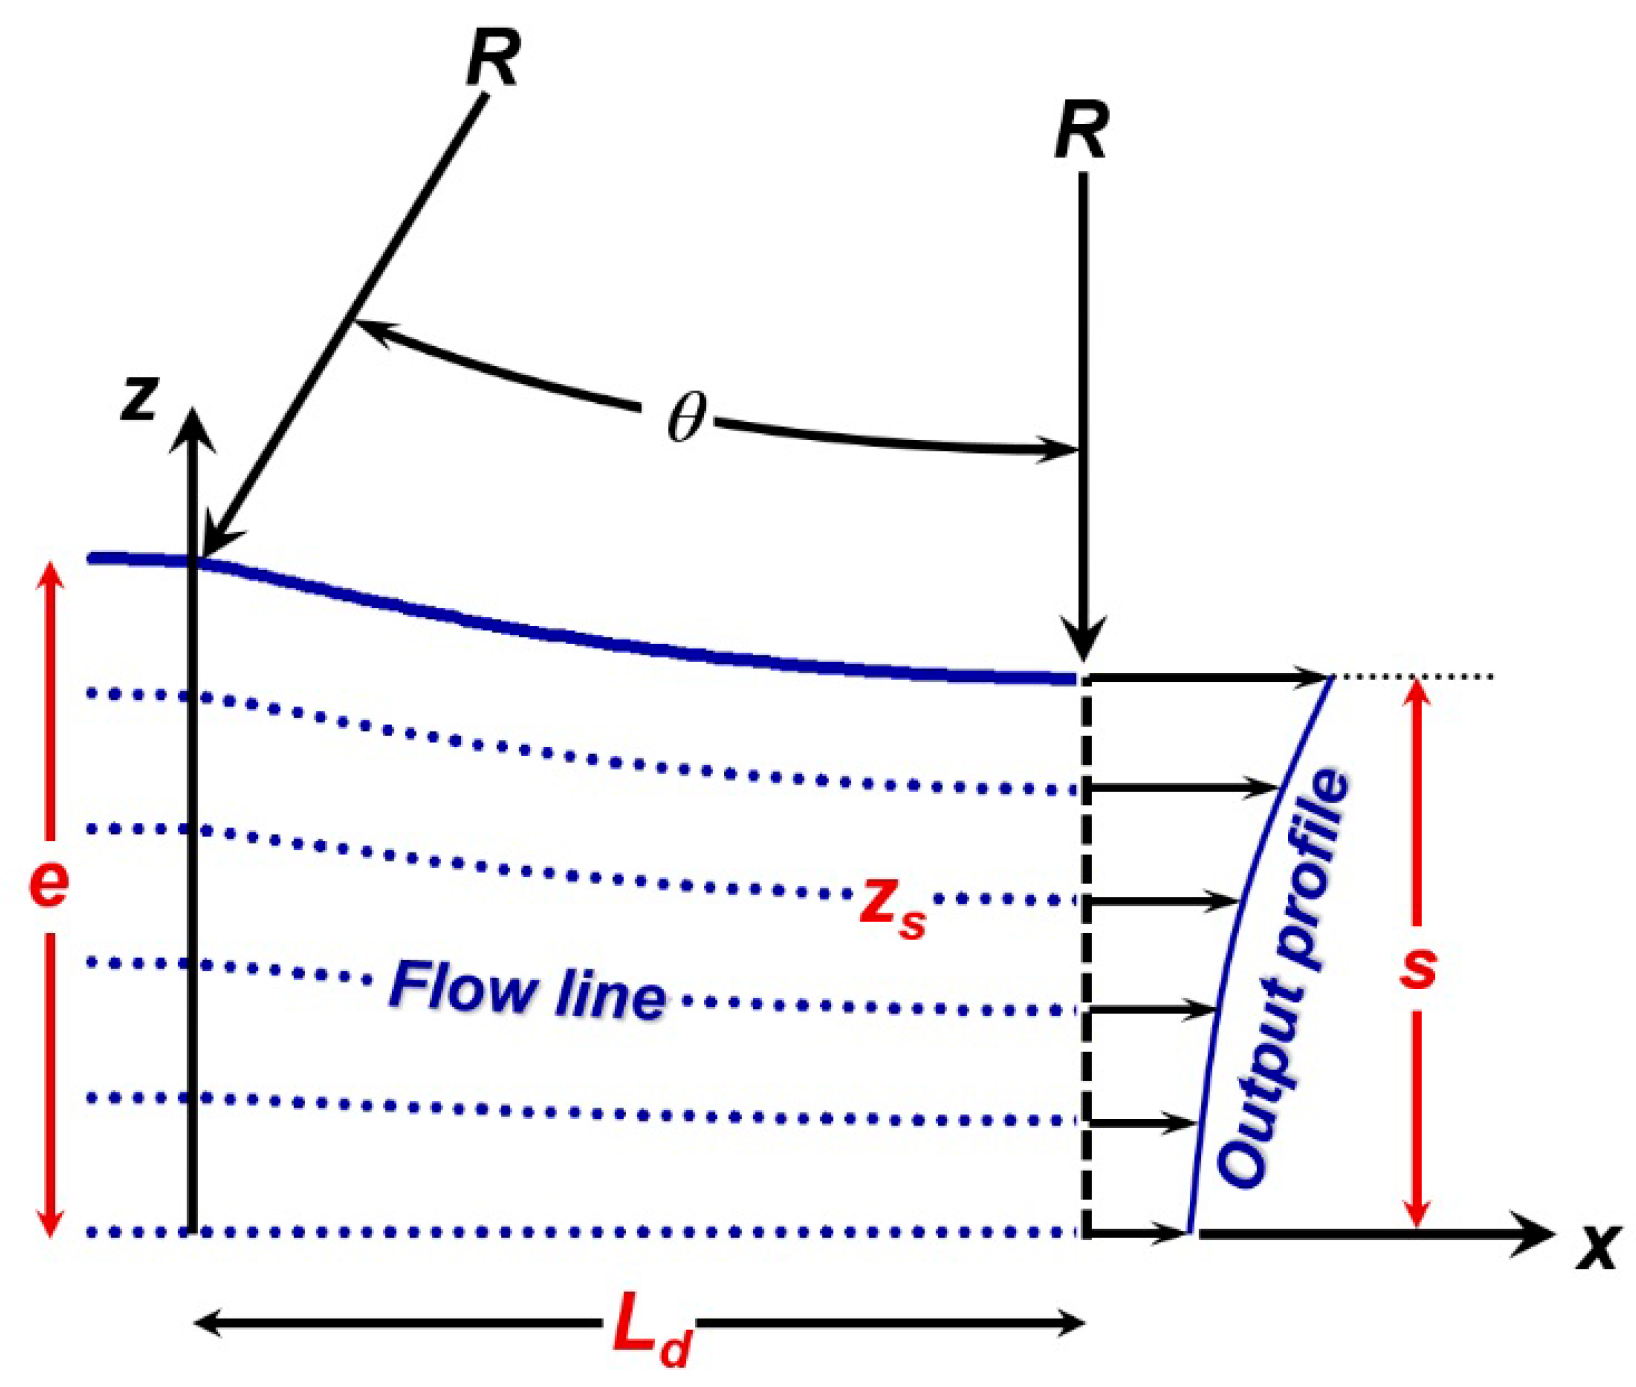
where θ is a bite angle and R is a roll radius; e is the half-thickness of the sheet prior to rolling; s is the half-thickness of the sheet after rolling (see Figure 2 for details); and zs corresponds to the position of the flow-line (0 ≤ zs ≤ 1, zs = 0 for the midthickness and zs = 1 for the surface layer).
In this analytical approach, the value of m was set to 100 with the aim of ensuring a continuous first and second derivate of the ς(x) function in Equation (1) at x = 0. In the model developed by Decroos et al., the exponent of 2.1 (see Equation (1)) guarantees the following: (i) a quasi-parabolic shape of ς(x) in the deformation zone and (ii) continuous first and second derivatives of this function when x = Ld. Both m and the exponent of 2.1 ensures various profiles for streamline zs, depending on the roll gap geometry. If zs = 0, the deformation flow occurs along the straight streamline, while for zs = 1, the flow is conditioned by the roll radius.
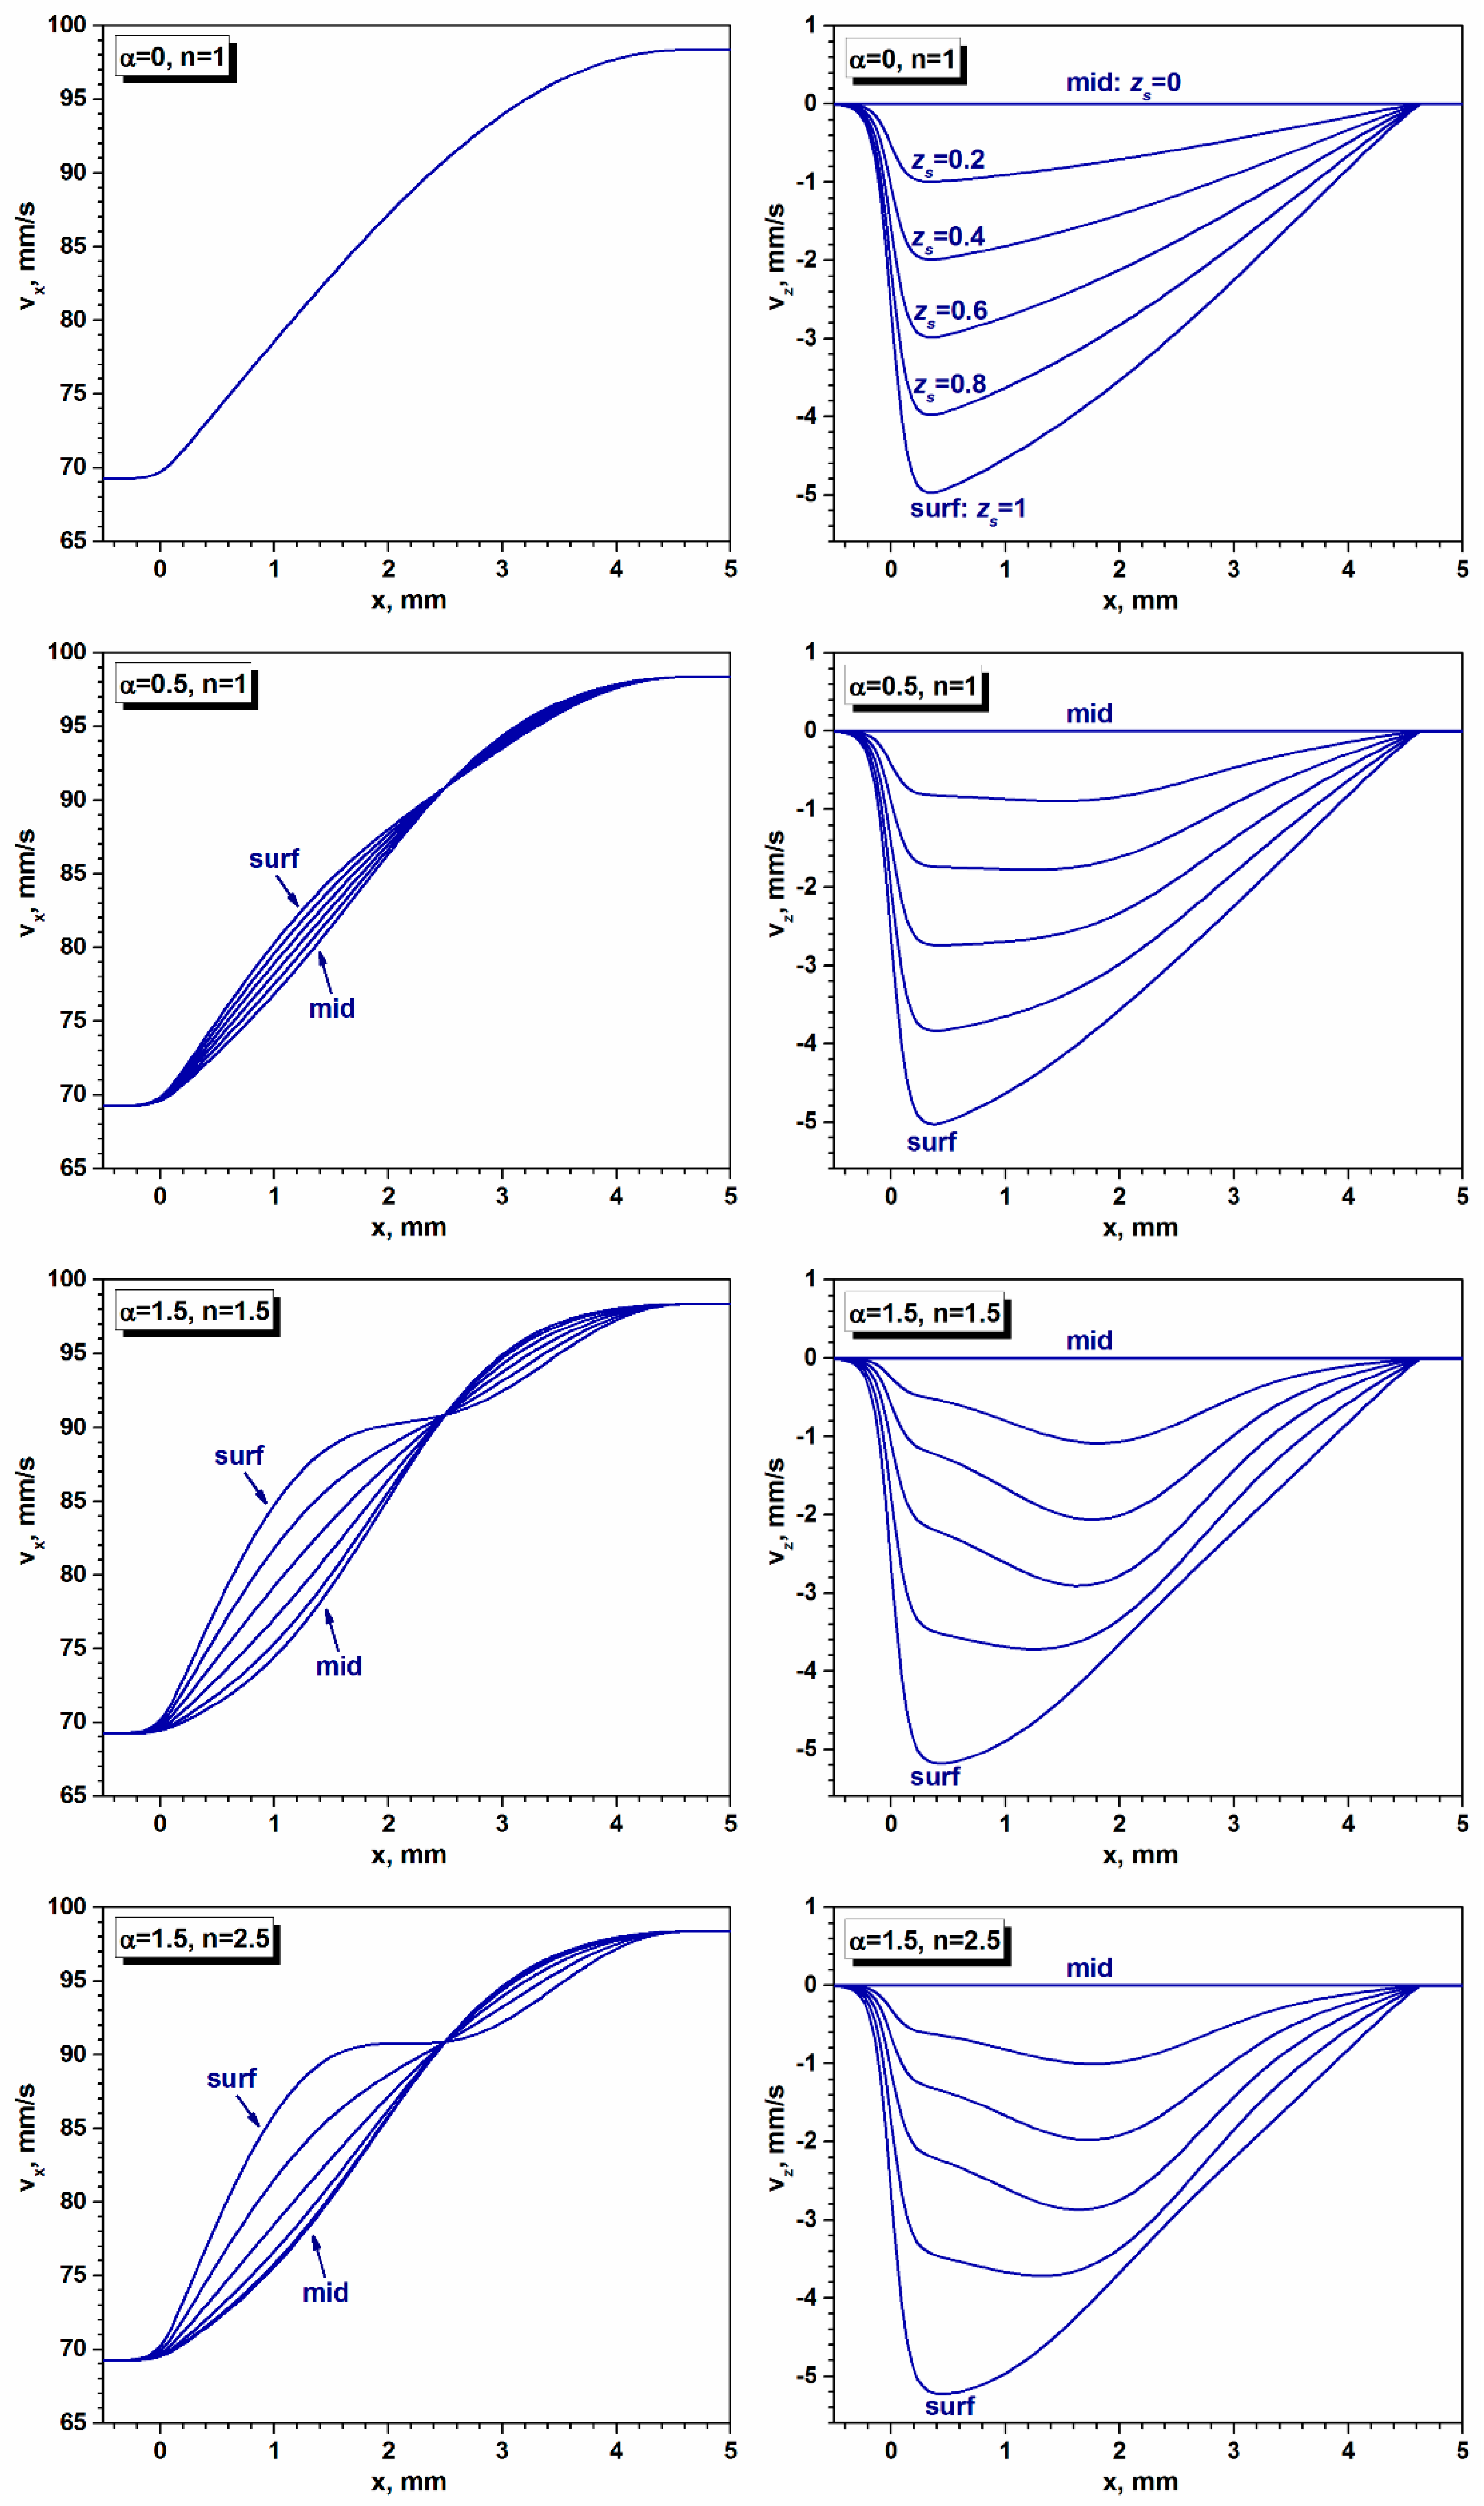
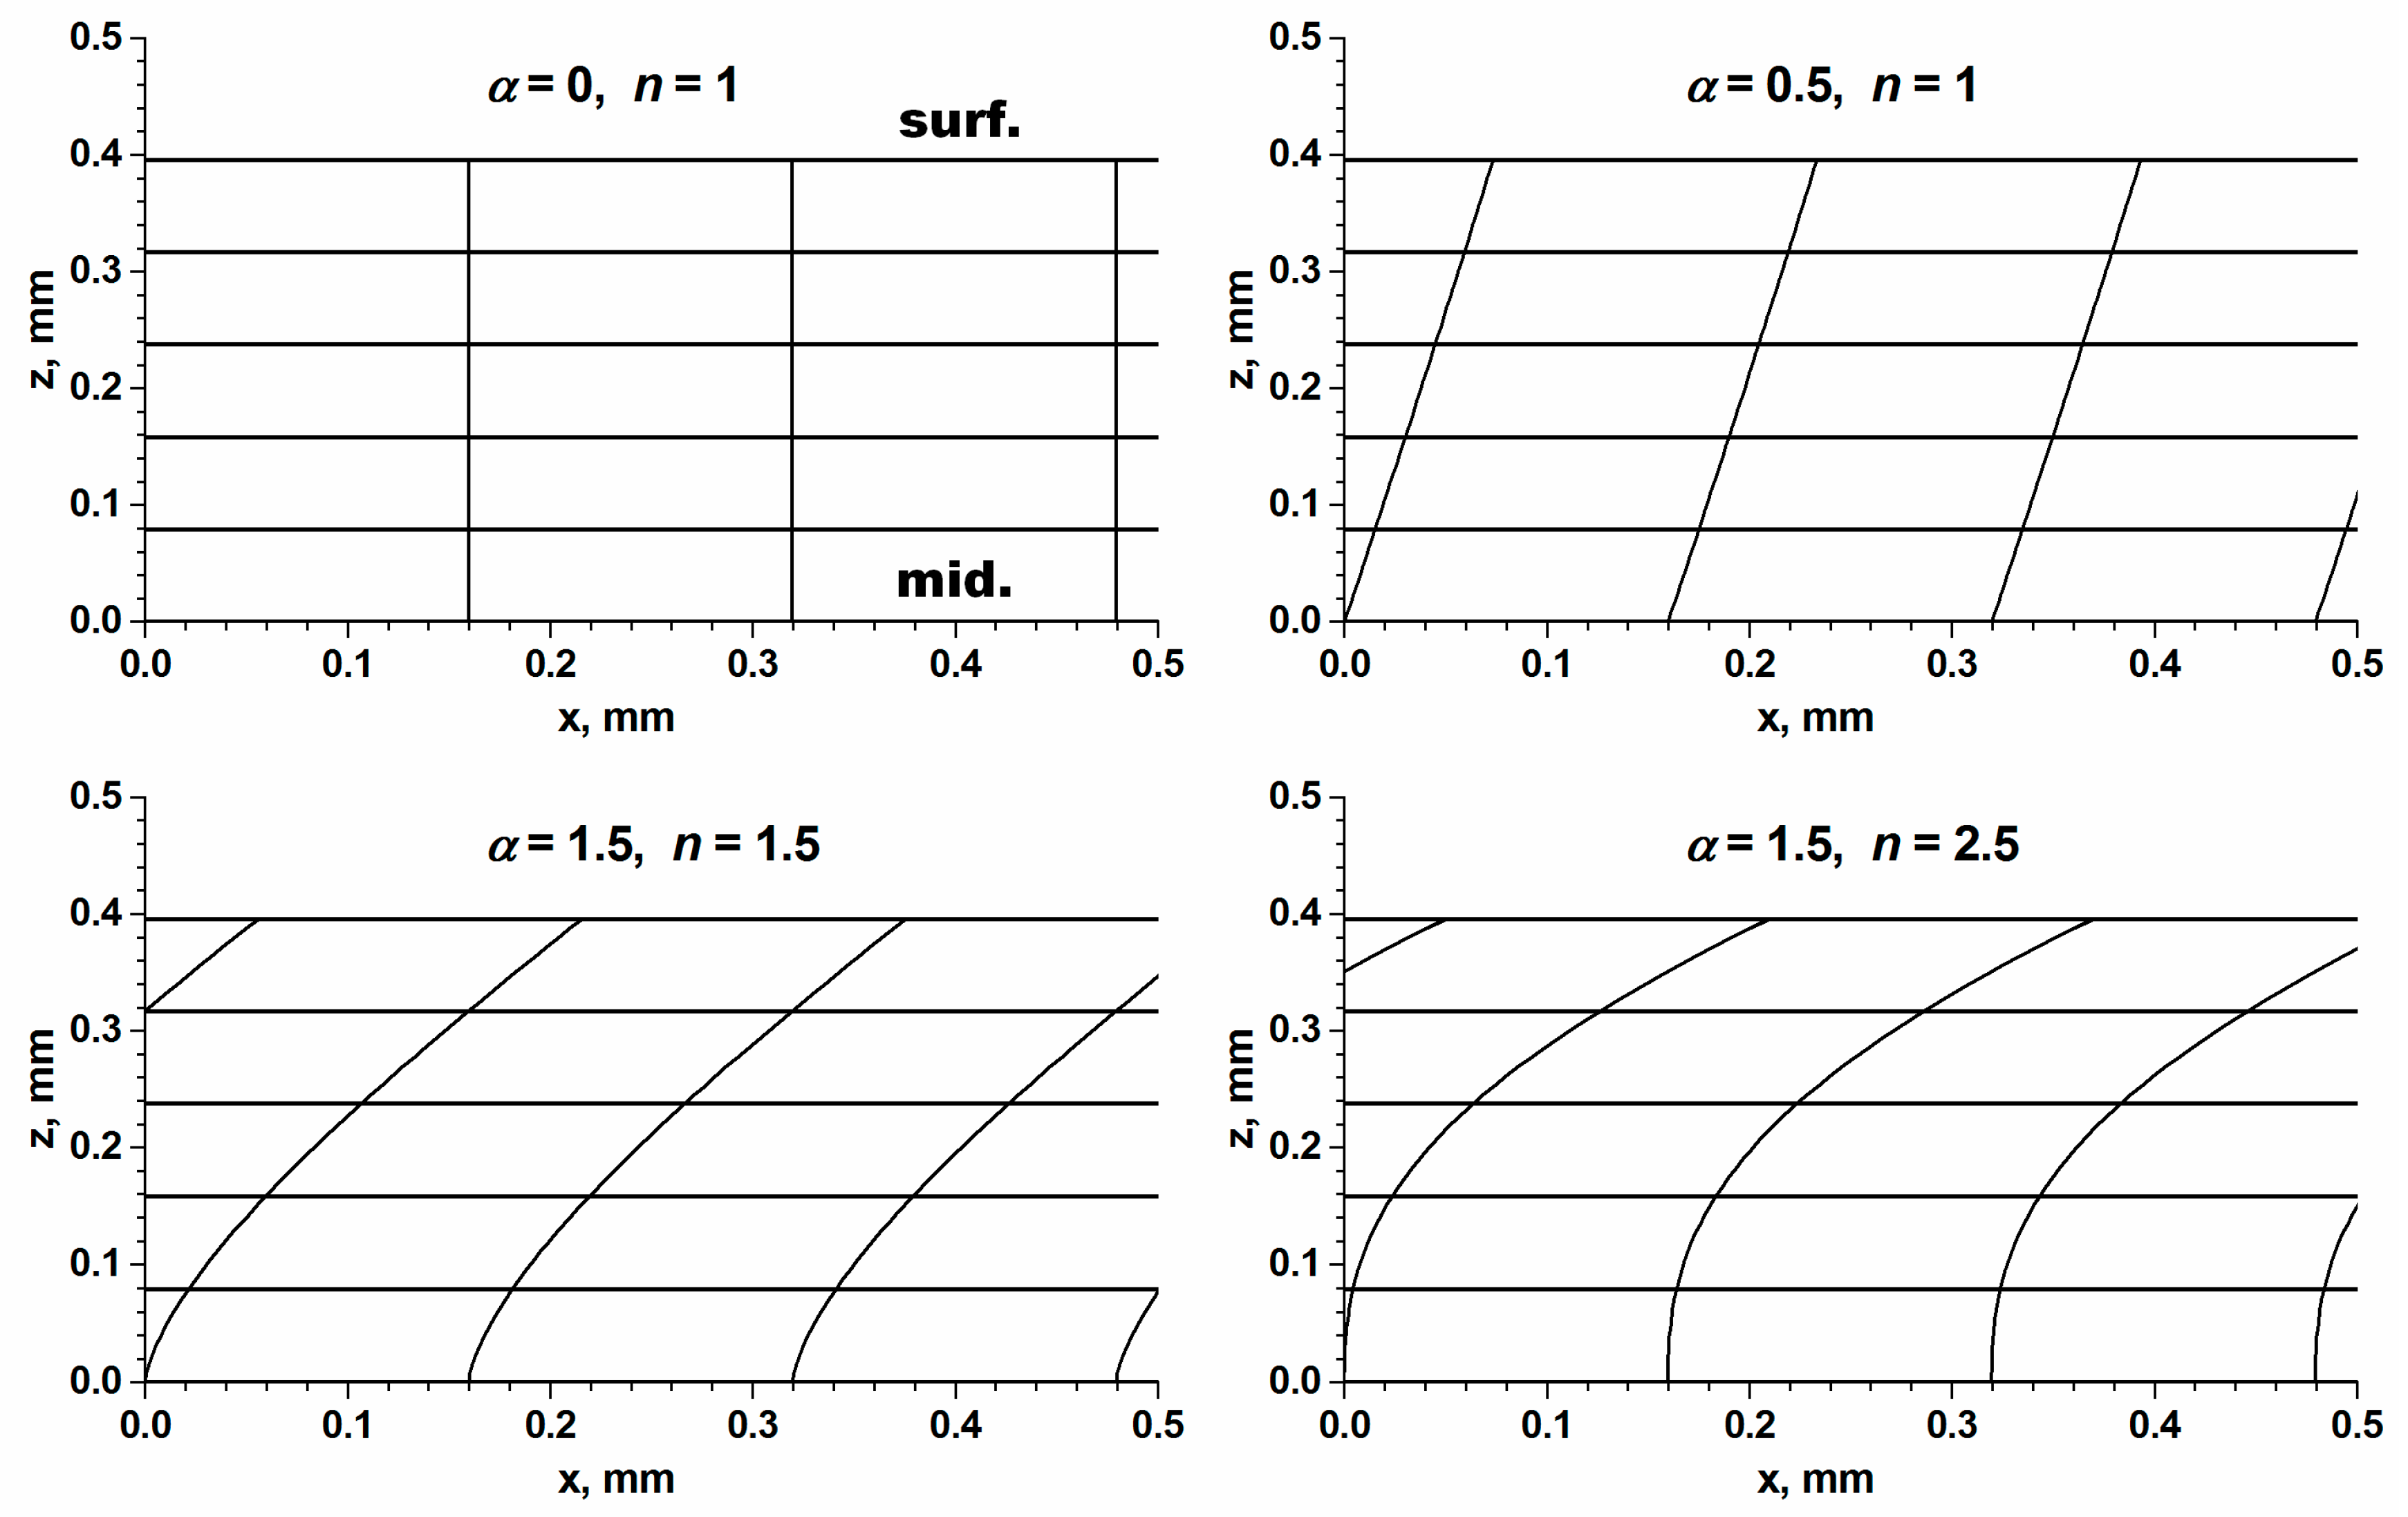
Both the entry and the exit velocities of a rolled sheet are even across the thickness; however, the shape of the output profile (see Figure 2) is controlled by two model parameters (α and n), which are supposed to be positive float numbers. Within a deformation zone, the model parameter α guarantees a difference between the x-component velocity vx of the surface and midthickness layers. The variation in velocity across the thickness (z-component) is conditioned by the second model parameter n. As Figure 3 reveals, for a given value of n, vx is identical for all layers with various zs if α = 0, while the difference between the velocities along the flow-lines tends to rise when α follows an upwards trend. Increasing the value of n in the FLM model while α remains constant tends to significantly enhance the velocity vx of the subsurface layers with respect to the midthickness planes. In the case of α > 0, the vx of all through-thickness layers tends to converge to a single point at x corresponding to a neutral point N. From this point onward, the flow of the midlayer is faster than the top one. The position of the neutral point φn in rolling can be computed by the following equations [2]:
ϕ n = h f R tan ( h f R H n 2 ) ,
H n = 0.5 ( H 0 1 μ ln ( h i h f ) ) ,
H 0 = 2 R h f tan 1 ( h i h f h f ) ,
LdN = LdRϕn,
where μ is a friction coefficient, and LdN is the x component of a neutral point.
Although vx is identical for all zs when α = 0, the z-component of velocity (vz) reveals significant deviations, implying that surface layers experience higher straining levels compared to the midthickness plane (zs = 0). It should be noted that even if α = 0, the strain path of a rolled sheet is different from the plane strain compression due to displacement heterogeneities caused by various vz across the thickness. For a given value of α, the effect of n on vz seems to be negligibly small; however, the same cannot be said about the deformation patterns revealed in Figure 4 (see cases for α = 1.5, n = 1.5; and α = 1.5, n = 2.5). It can be concluded from Figure 3 and Figure 4 that employing diverse α and n parameters allows for reproducing a wide spectrum of deformation patterns obtained under different thermomechanical processing conditions.
This computationally efficient model enables the fast calculation of deformation velocity gradients evolved across the thickness of a rolled sheet. If the correlation between the technological parameters (such as the degree of reduction, the roll diameter, a material’s initial thickness, and the friction coefficient) and the model parameters is determined, this two-dimensional FLM approach can enable the efficient calculation of a velocity gradient history evolved across the thickness of a rolled sheet, which is needed for the successful prediction of texture evolution performed by crystal plasticity models.

3.2. Finite Element Modeling

In order to define a link between the FLM fitting parameters (α and n) and the processing quantitative indicators, a series of finite element simulations were performed. Since the FLM approach does not account for the anisotropy of properties, the behavior of an isotropic material was studied by FEM. In the first instance, the effect of friction on the deformation flow across the thickness of a rolled Al sheet was studied. The minimum value of the friction coefficient necessary for rolling (μmin) was approximated based on roll gap geometry, as rolling of a material is not possible without an appropriate friction condition [23].
Equation (8) is
μ min = 1 2 h f R ln ( h i h f ) + 1 4 h i h f R tan 1 h i h f 1 ,
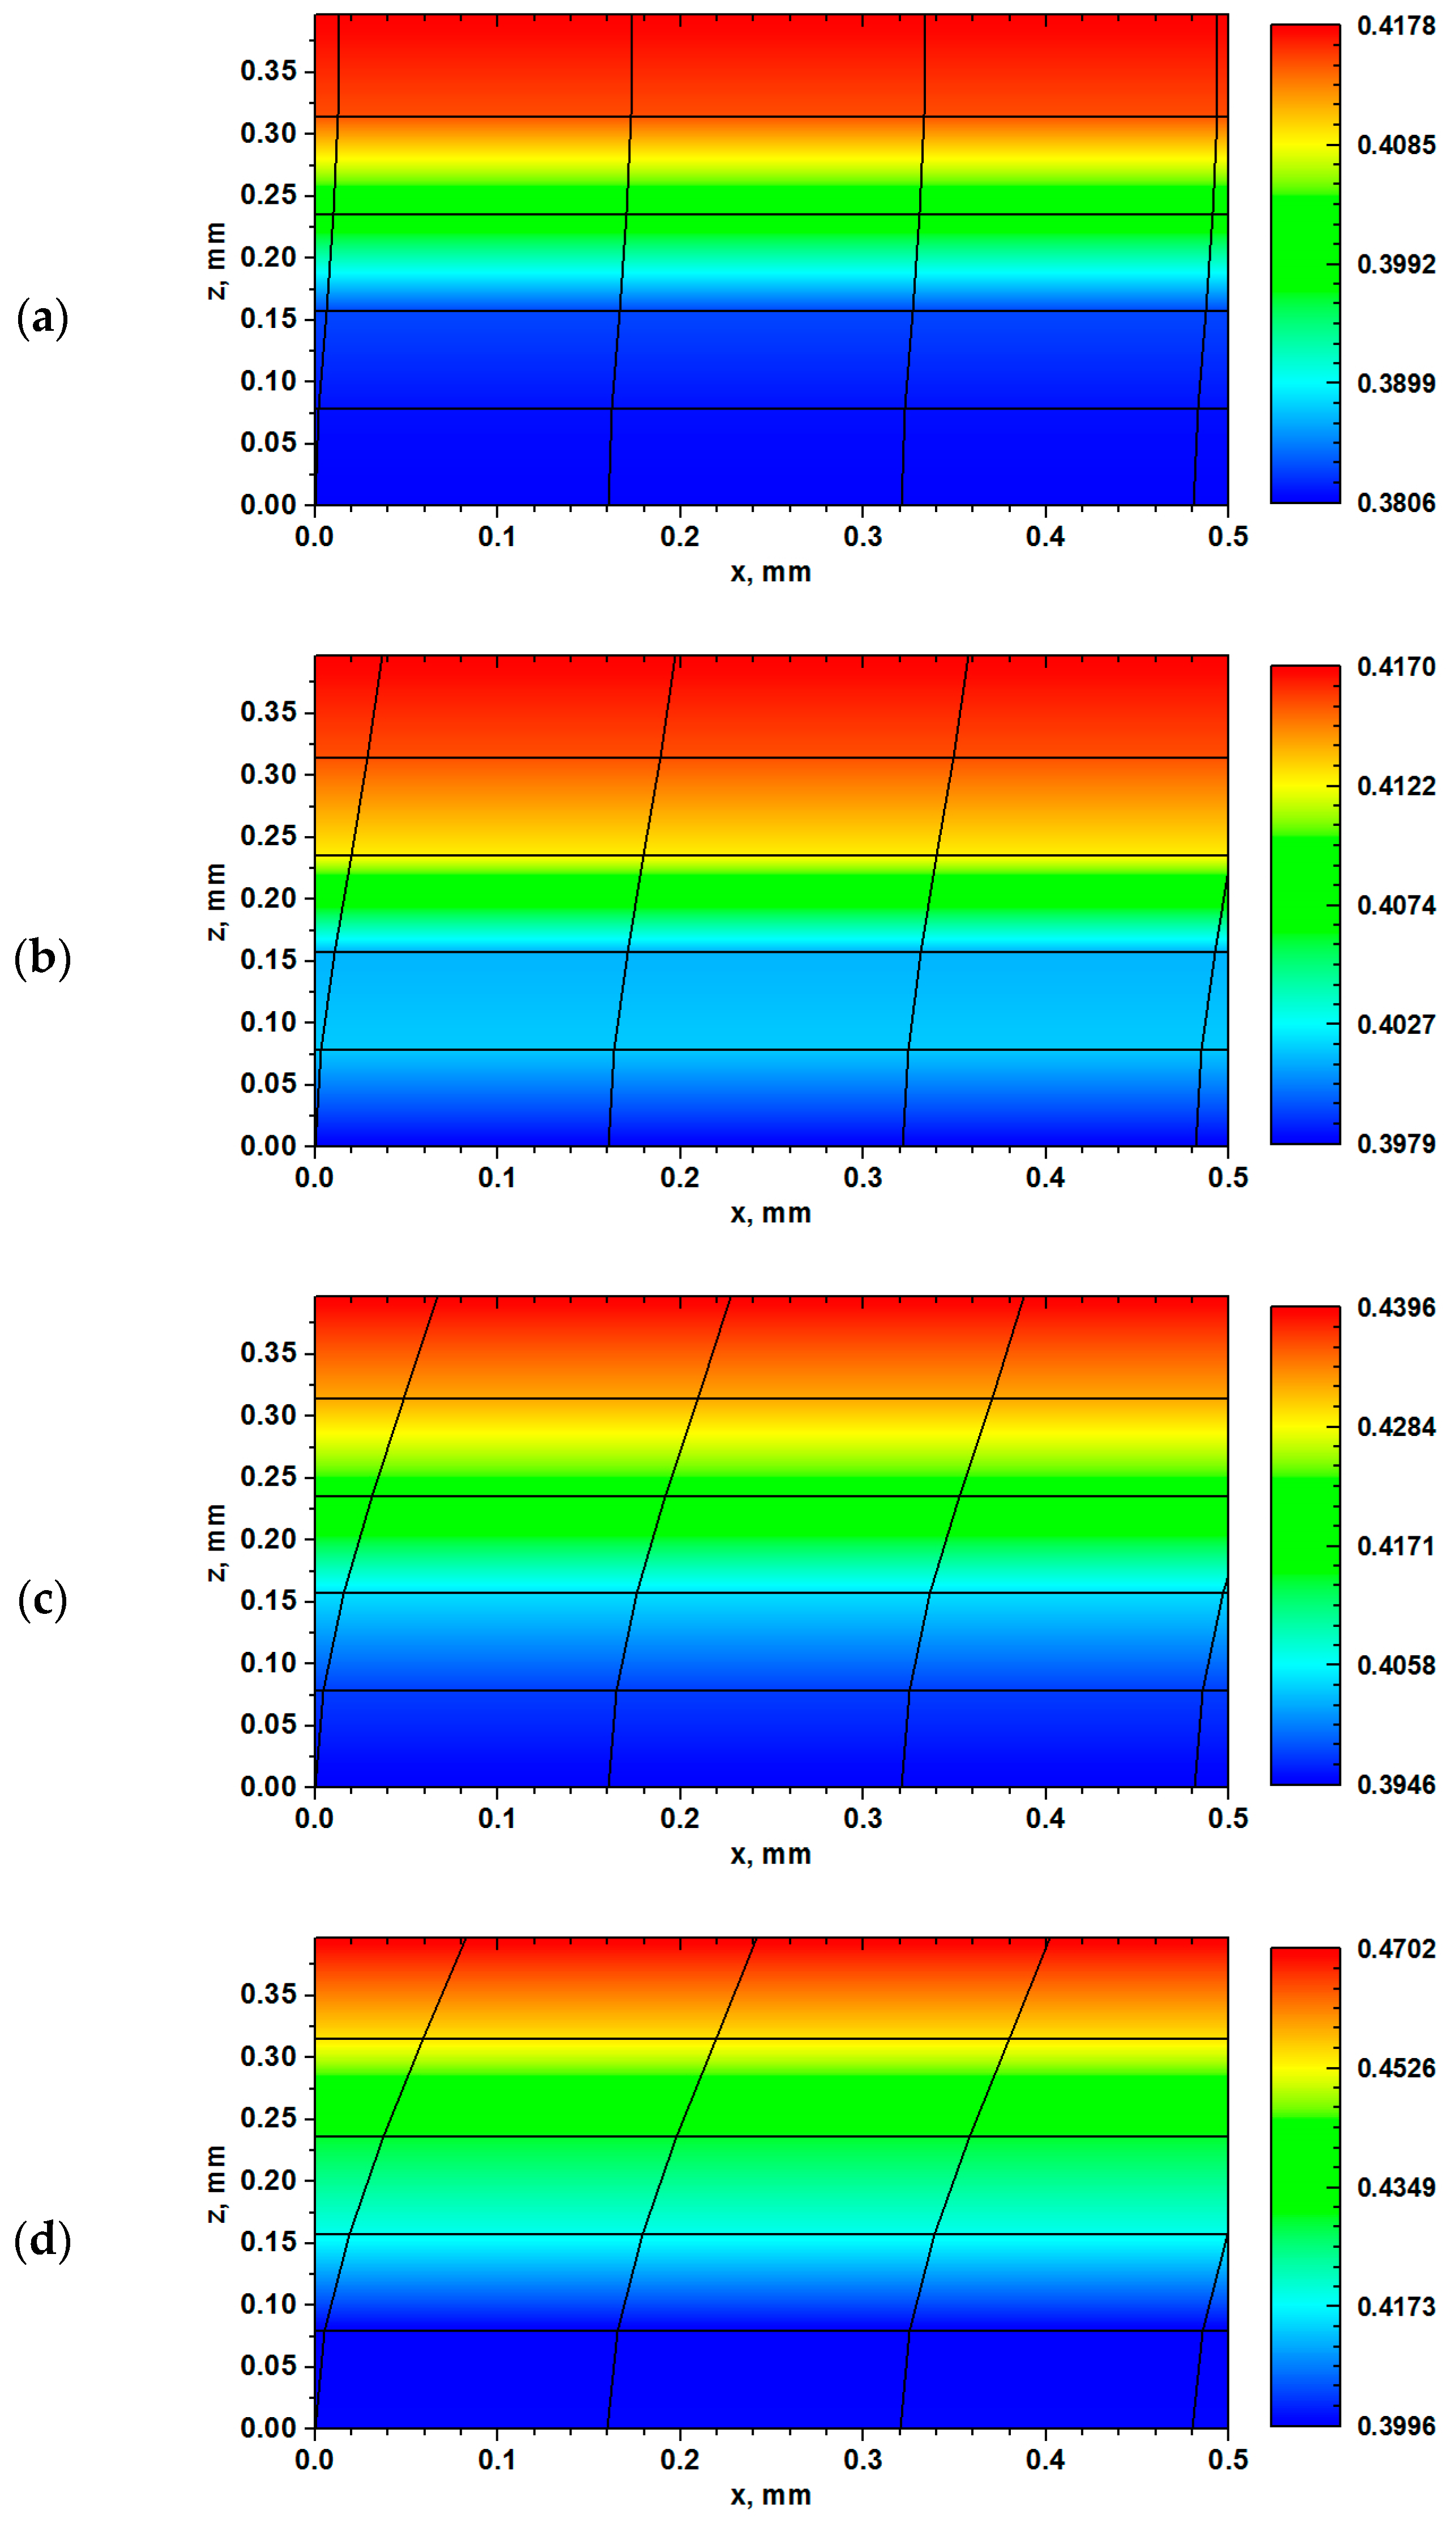
For the FEM, rolling trials were simulated with a constant coulomb friction coefficient μ, which exceeded the value of μmin, in order to avoid both convergence problems and remeshing during the calculation. As Figure 5 reveals, the deformation flow was heterogeneous across the thickness even if the material was isotropic. The deformation patterns that emerged in Figure 5 testify to the fact that distortion of an initially rectangular grid was conditioned by the friction coefficient μ assumed. The distortion of initially orthogonal elements enabled a revealing of the nature of the deformation process across the thickness. Both the surface and subsurface elements (Figure 5a–d) were subjected to more severe shear distortion compared to the midthickness layers. This phenomenon was revealed more explicitly while the distribution of the von Mises strain evM across the thickness was being analyzed. Since the amount of shear was negligible in the midplane, the strain mode was close to plane strain compression, while both a high value of evM (Figure 5a–d) and strongly sheared elements in the subsurface region provided evidence for shear localization within the surface layers. It is also obvious in Figure 5a–d that the amount of shear was localized predominantly in the subsurface region and tended to decline in the direction of the midthickness plane independently of friction assumed, whereas increasing the value of μ tended to enhance the level of accumulated strain in the material.
In total, 53 FEM simulations were performed for various roll gap geometries and diverse friction conditions. These results will be discussed in the following chapters, when both FEM and FLM outputs will be compared. In order to capture the strain gradients in rolling with reasonable accuracy, finite element calculations were performed with a mesh containing 10 elements across the thickness (5 elements for the half-thickness). It is believed that this number of elements is capable of ensuring meaningful simulation precision. Increasing the number of elements might improve accuracy; however, taking into account that a large number of FEM simulations had to be performed within a rational time-bounded frame, the decision was made to work with the fixed number of elements for all roll gap geometries.

3.3. Correlating the Flow-Line Model Parameters with Roll Gap Geometry

A growing body of experimental evidence has clearly shown that TMP parameters have a decisive effect on the deformation behavior of materials [24,25,26,27]. This study had a major focus on the cold rolling process, where the flow of a sheet is conditioned by roll gap geometry, straining levels and friction condition. Figure 5 demonstrates the effect of the friction coefficient on the through-thickness strain heterogeneity, as predicted by FEM. Corresponding calculations (Figure 6) were likewise performed for the identical rolling path with FLM [14], where each combination of the α and n parameters was set so as to resemble the deformation patterns of Figure 5. For a meaningful comparison, first, the strain velocity gradient tensor components (Lij) were calculated by both FEM and FLM [14], and afterward the corresponding strains for the time increment Δt were calculated as Δεij = 0.5 (Lij + Ljit. Since in two-dimensional analysis L22 = L12 = L21 = L23 = L32 = 0 (where indices 1, 2, and 3 refer to rolling (RD), transverse (TD), and normal (ND) directions, respectively), the von Mises strain was calculated by means of the total accumulated strain components ε11 and Δε33:
e v M = 2 3 ε 11 2 + ε 13 2 .
When comparing Figure 5 and Figure 6, it turns out that FLM was capable of reproducing both the corresponding FEM deformation patterns and the strain distribution across the thickness with reasonable accuracy by employing an appropriate pair of model parameters. Figure 5 and Figure 6 reveal meaningful qualitative agreement, whereas the quantitative differences in the von Mises maps might be explained by simplifications made in the FLM model. The types of von Mises strain distribution patterns shown in Figure 5 and Figure 6 are characteristic of the rolling process, where the high evM values are attributed to the concentration of shear strain due to friction between the roll and the surface of a sheet.
It should be underlined here that the main advantage of the FLM-type approach is its efficiency, since the deformation history can be simulated within a fraction of a second, which cannot be done with an FEM approach even if the grid is composed of a limited number of elements. The major drawback to the practical implementation of flow-line computations is the determination of α and n, which have to be fitted for each particular case. Therefore, this contribution attempted to correlate the TMP quantitative indicators with the FLM model parameters by employing FEM results. In the FEM simulations, which were performed for a wide range of processing conditions, the coefficient of friction was varied between μmin (Equation (8)) and 0.3, which corresponded to wet and dry rolling conditions, respectively. The roll radii in the FEM calculations changed from 64.46 mm to 450 mm, which led to a spectrum of projected contact lengths (Ld) ranging between 3.61 mm and 21.91 mm, whereas the initial thickness of the sheet subjected to cold rolling changed from 1 to 6 mm. These boundary conditions covered the rolling trials performed with both intermediate and large draughts, which accounted for a variation in the contact length-to-mean thickness ratio (Ld/h) from 2.88 to 12.77.
After careful analysis of both the FEM and FLM outputs, the following expressions were developed for the determination of α and n:
α = A ψ + B ψ 2 + C ψ 3 + D ψ 4 + E ( h i h f 2 L ) ,
with
ψ = μ f ( h i R ) g ( R h i h f ) k ( R h f ) l ,
where A = 21,332; B = −2.250 × 10²; C = −1.841 × 10²; D = 1.242 × 10⁴; E = 4.833 × 10⁻¹; f = 1.833; g = 7.892 × 10⁻¹; k = 2.293 × 10⁻¹; and l = 2.283 × 10⁻¹. Equation (12) is
n = M μ r ( h i R ) s + N μ t ( L L d N ) u + O μ v ( h i + h f R ) w + P μ x ( L h i + h f ) y + Q ,
where M = 19.369, N = 9.463, O = −18.606, P = −9.086, Q = 3.201 × 10⁻², r = 9.882 × 10⁻², s = 5.120 × 10⁻³, t = −1.869 × 10⁻¹, u = 6.414 × 10⁻², v = −1.045 × 10⁻¹, w = −5.860 × 10⁻³, x = 2.441 × 10⁻¹, and y = −1.620 × 10⁻¹.
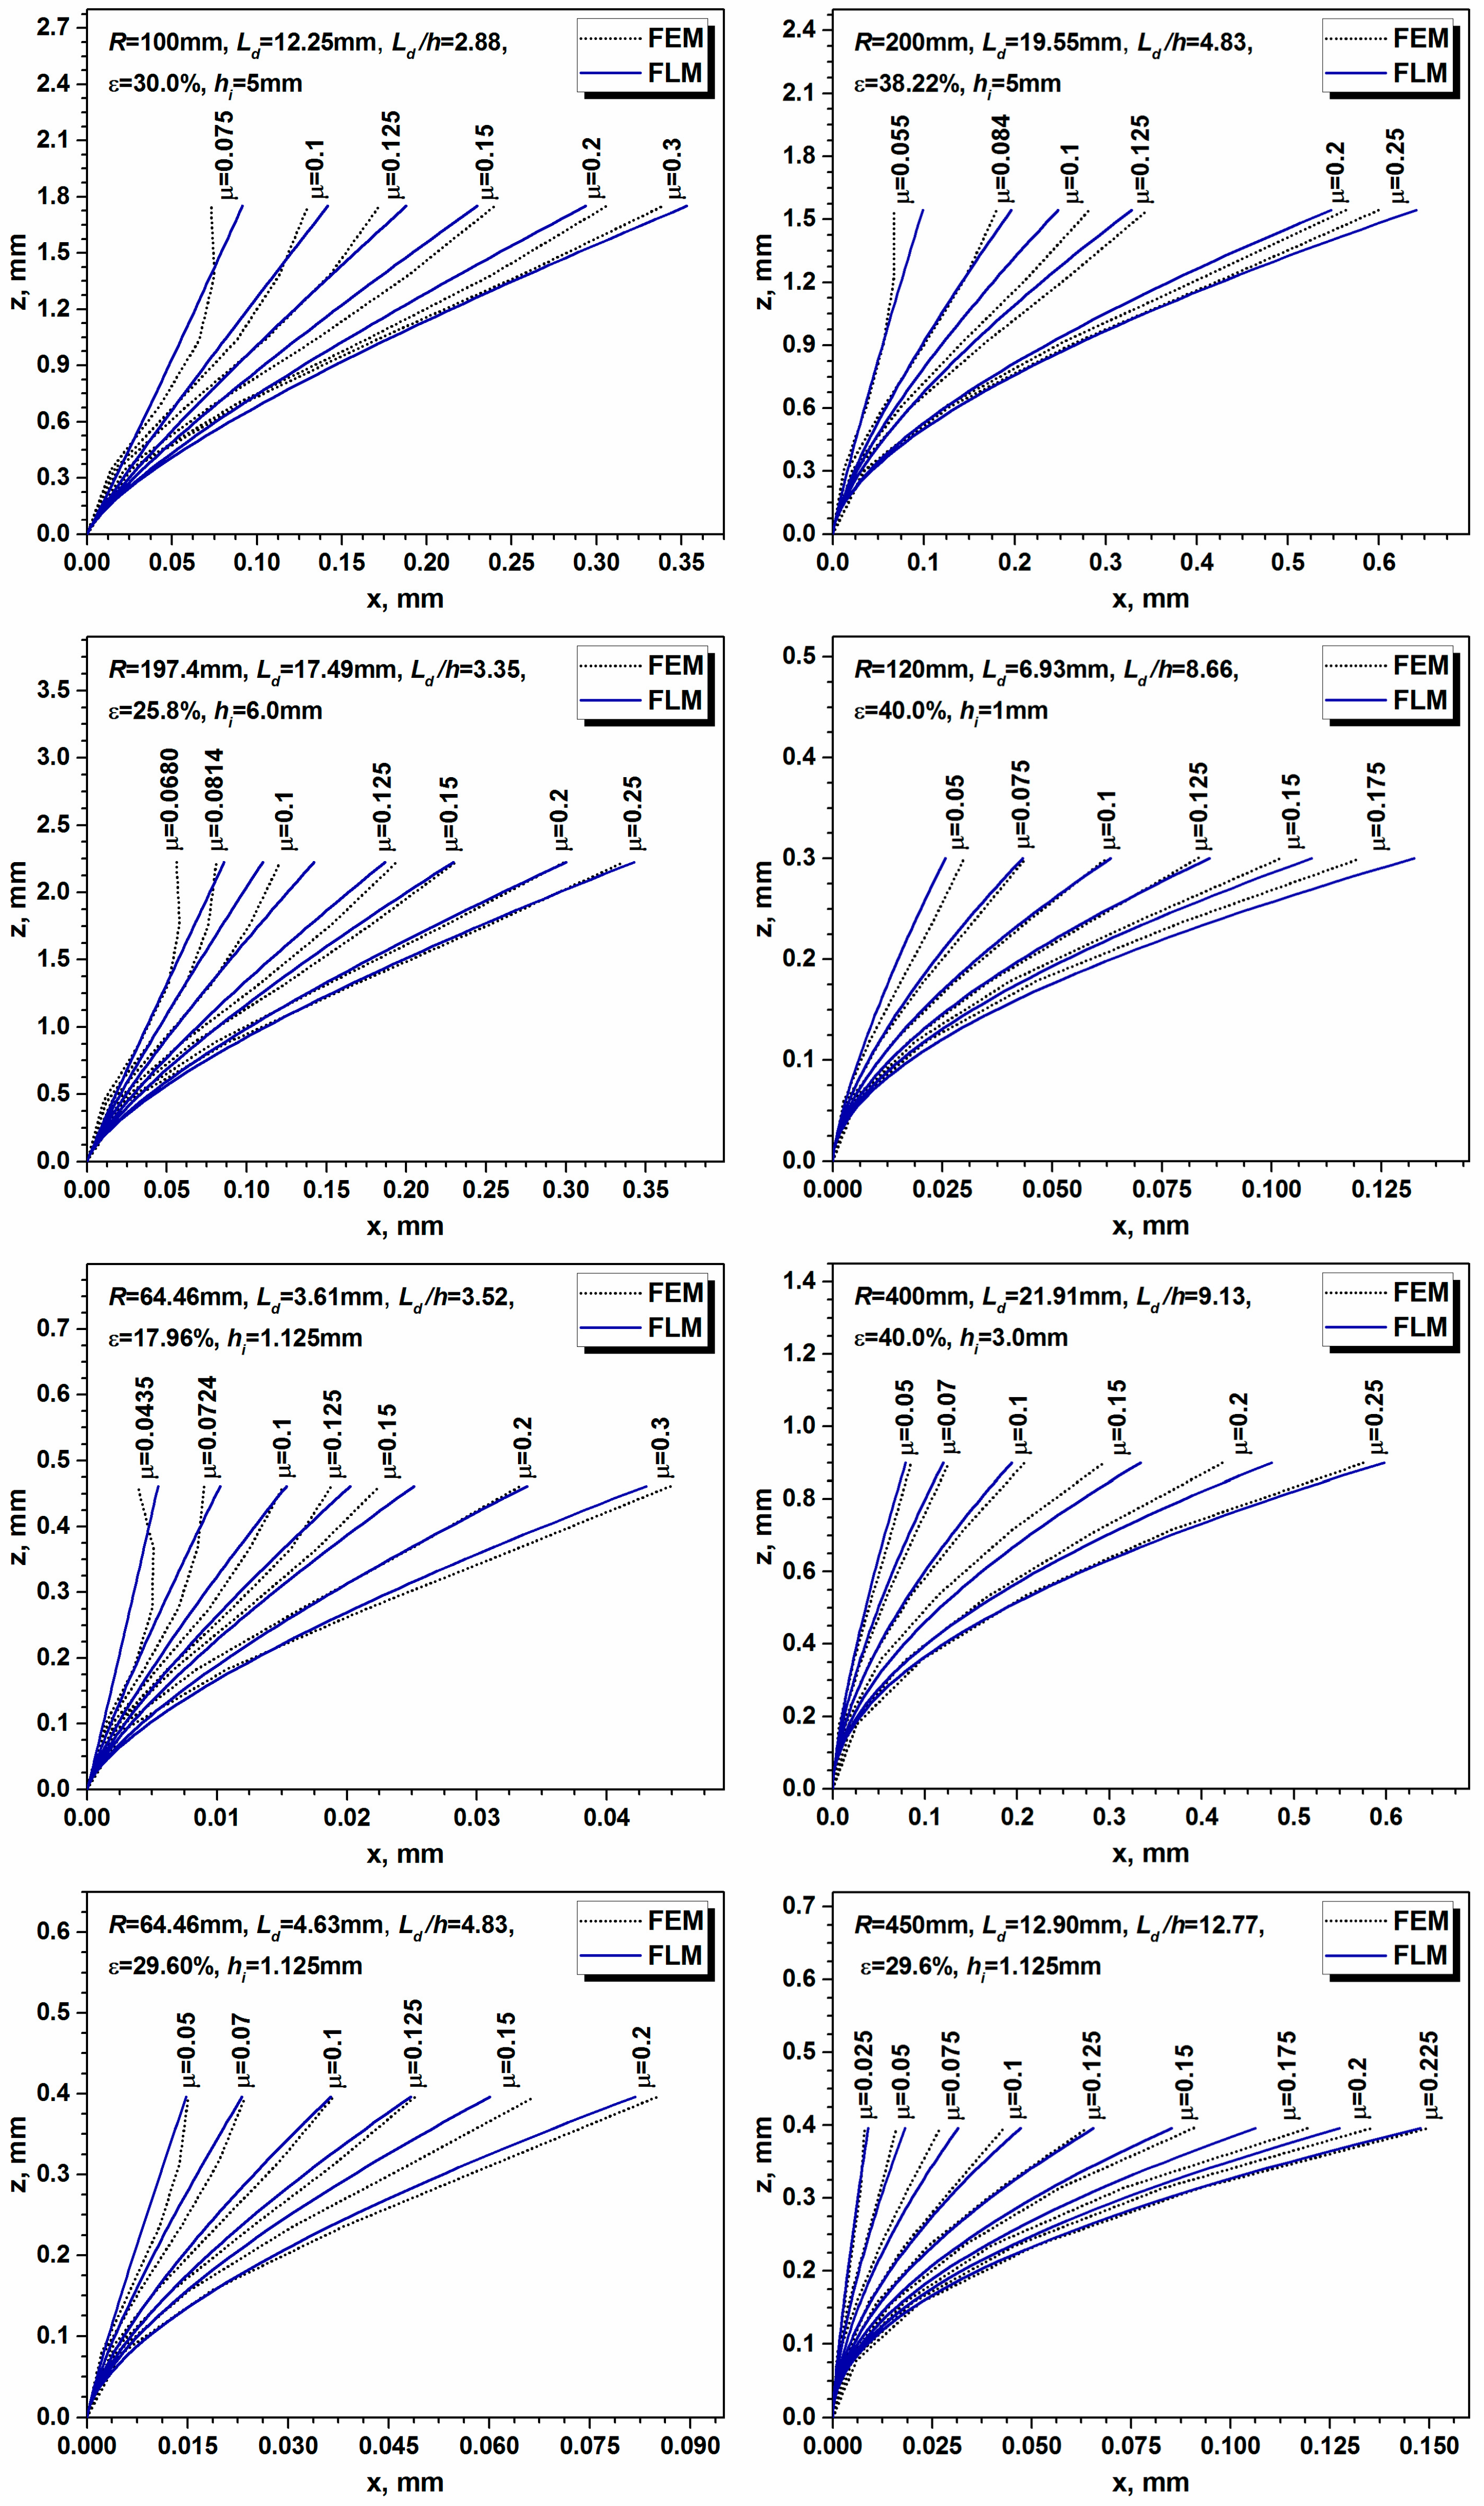
Equations (10)–(12) clearly indicate that both α and n are functions of roll gap geometry and the friction coefficient μ. Figure 7 reveals the distortion of the initially rectangular grid (only the vertical line is shown for each case) predicted for various roll gap geometries by the FEM and FLM employed [14] (with the model parameters calculated by Equations (10)–(12)). Analyzing the results of the simulations presented in Figure 7, it becomes obvious that both models predicted similar distortion patterns for both extremes of the friction coefficient spectrum. By virtue of assumptions made in the FLM employed, this model was capable of reproducing parabolic-type displacement profiles, while the FEM results revealed more complex displacement shapes for certain boundary conditions (see Figure 7). This was particularly true for low values of both Ld/h and μ. For roll gap geometry with Ld/h ≤ 4 and friction coefficients below 0.1, the FLM somewhat overestimated the amount of shear on the surface and slightly underestimated the shear contribution within the subsurface layers; however, these inconsistencies tended to vanish when the value of Ld/h became higher than 4.
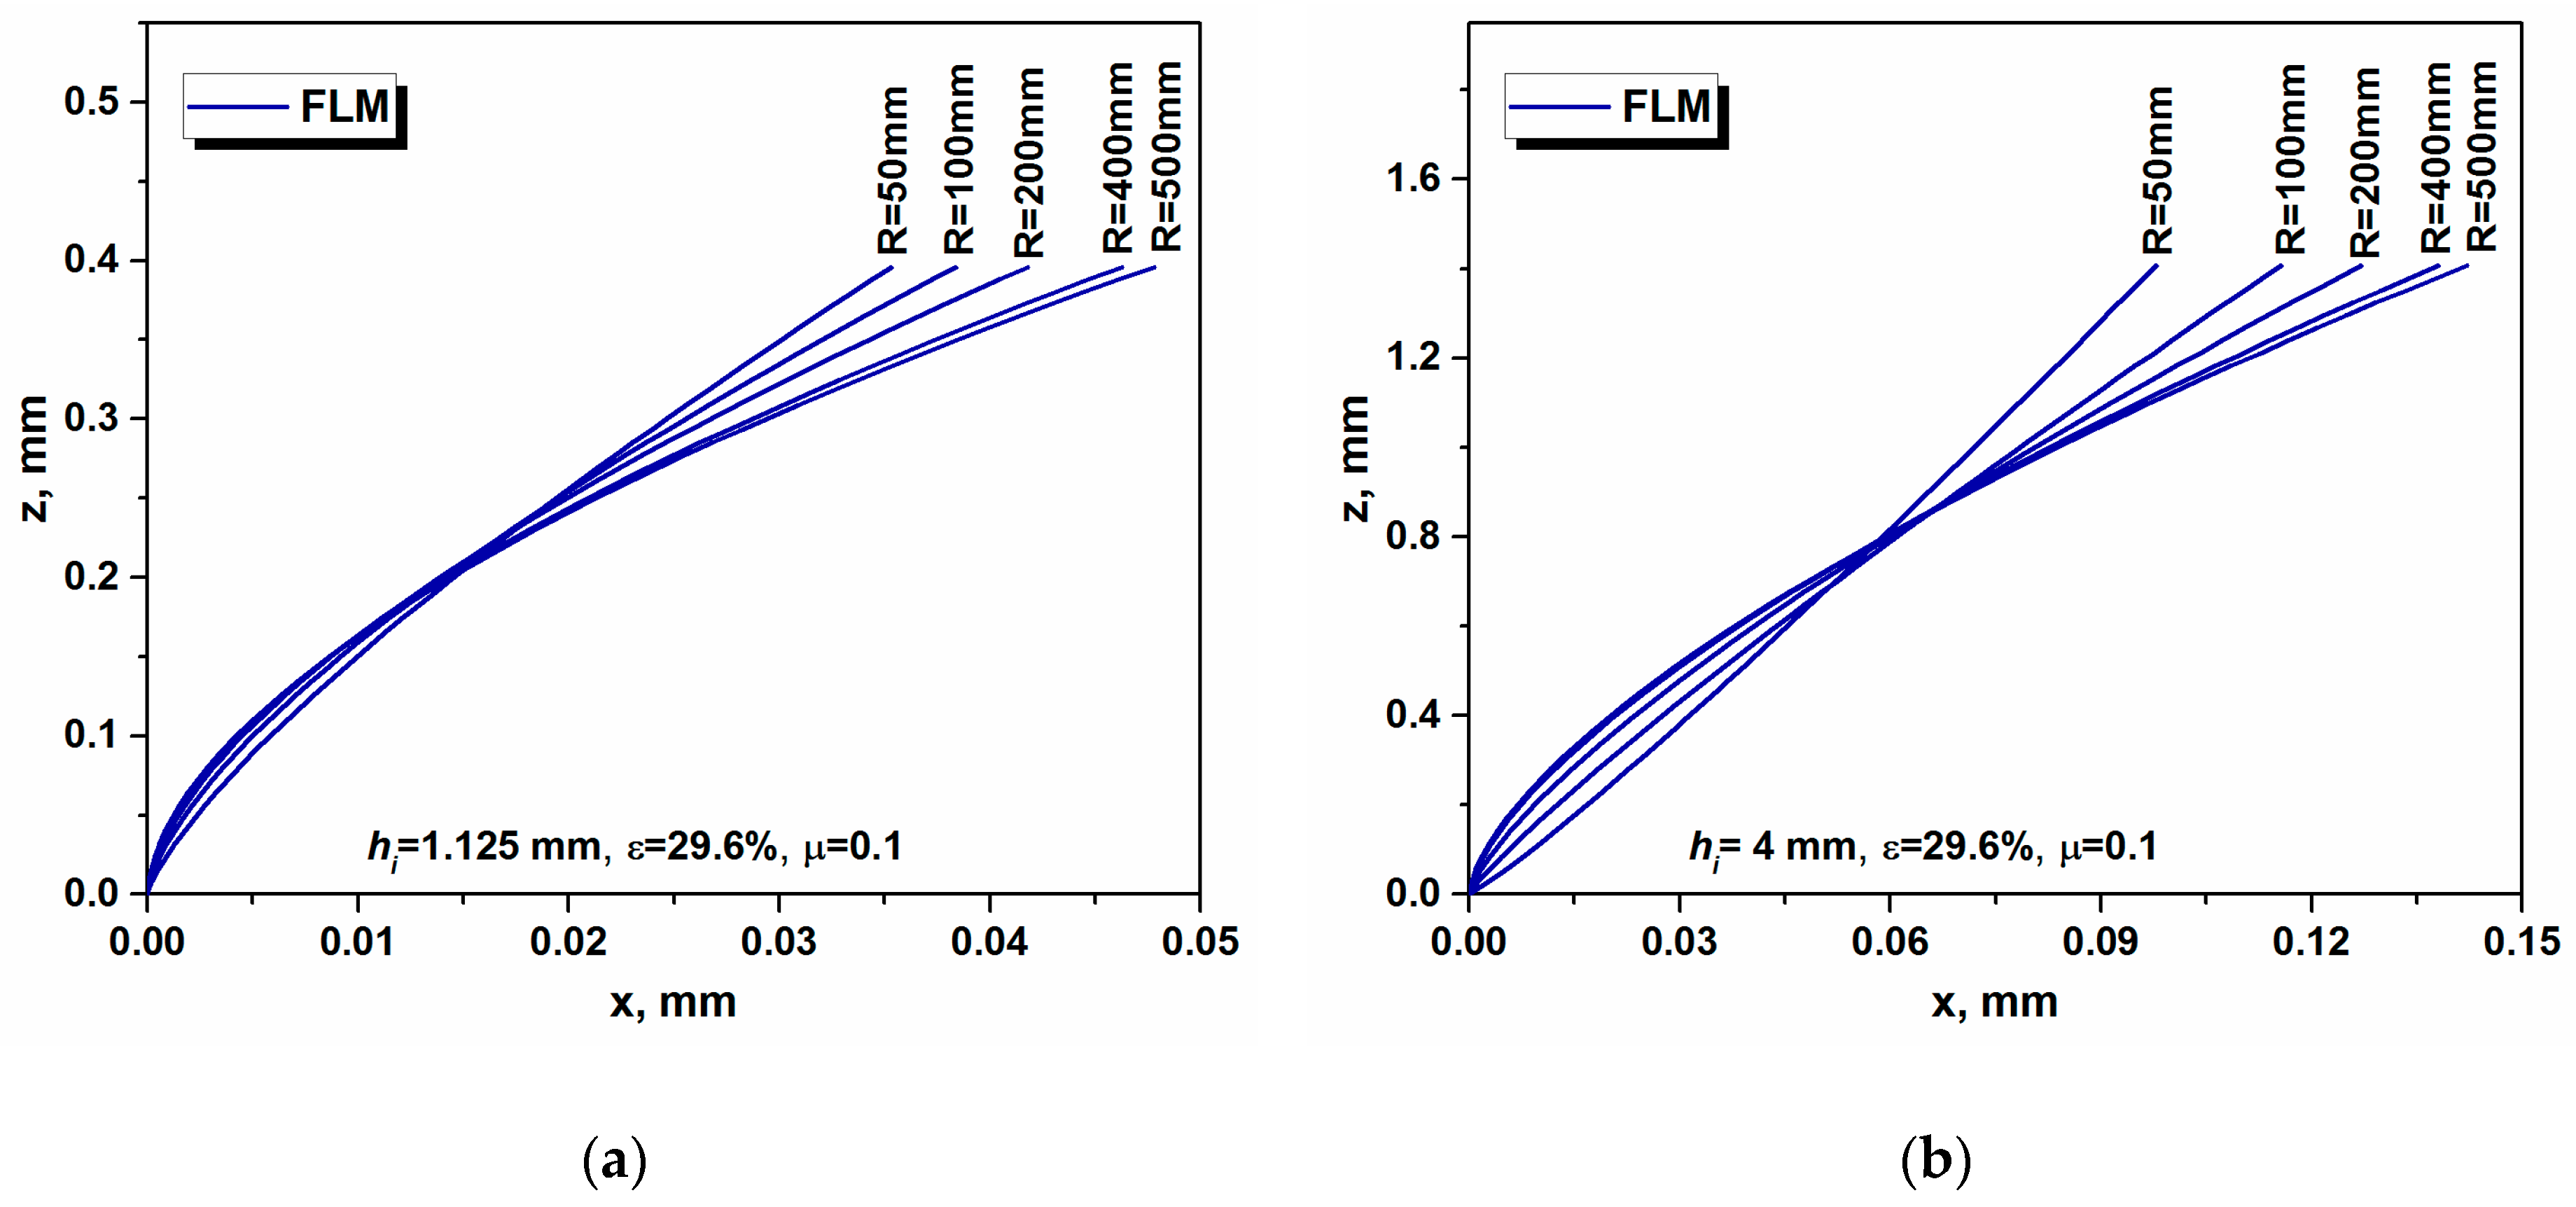
It is clear from Figure 7 that roll gap geometry has a strong impact on the evolution of deformation across the thickness. The effect of rolling conditions on the deformation distribution across the thickness could be analyzed by means of the FLM approach, since the values of the α and n parameters, calculated by Equations (10)–(12), tended to resemble the FEM deformation patterns with reasonable accuracy. In the case of materials (Figure 8a,b) rolled with a thickness reduction of 29.6% and a friction coefficient of 0.1, an increase in the roll radius accounted for more extensive RD–ND displacement, and therefore more severe shear strain evolution evolved in both the surface and subsurface regions.
It should be underlined that the applicability of the FLM approach [14] is not restricted exclusively to cold rolling; however, the correlation (Equations (10)–(12)) between the FLM model parameters and the process quantitative indicators was limited to an analysis of the cold deformation trials of Al alloys. Defining both α and n by Equations (10)–(12) excluded the effect of temperature, which might be a critical issue while simulating the behavior of materials during hot rolling.

4. Application of Deformation History to Texture Simulation

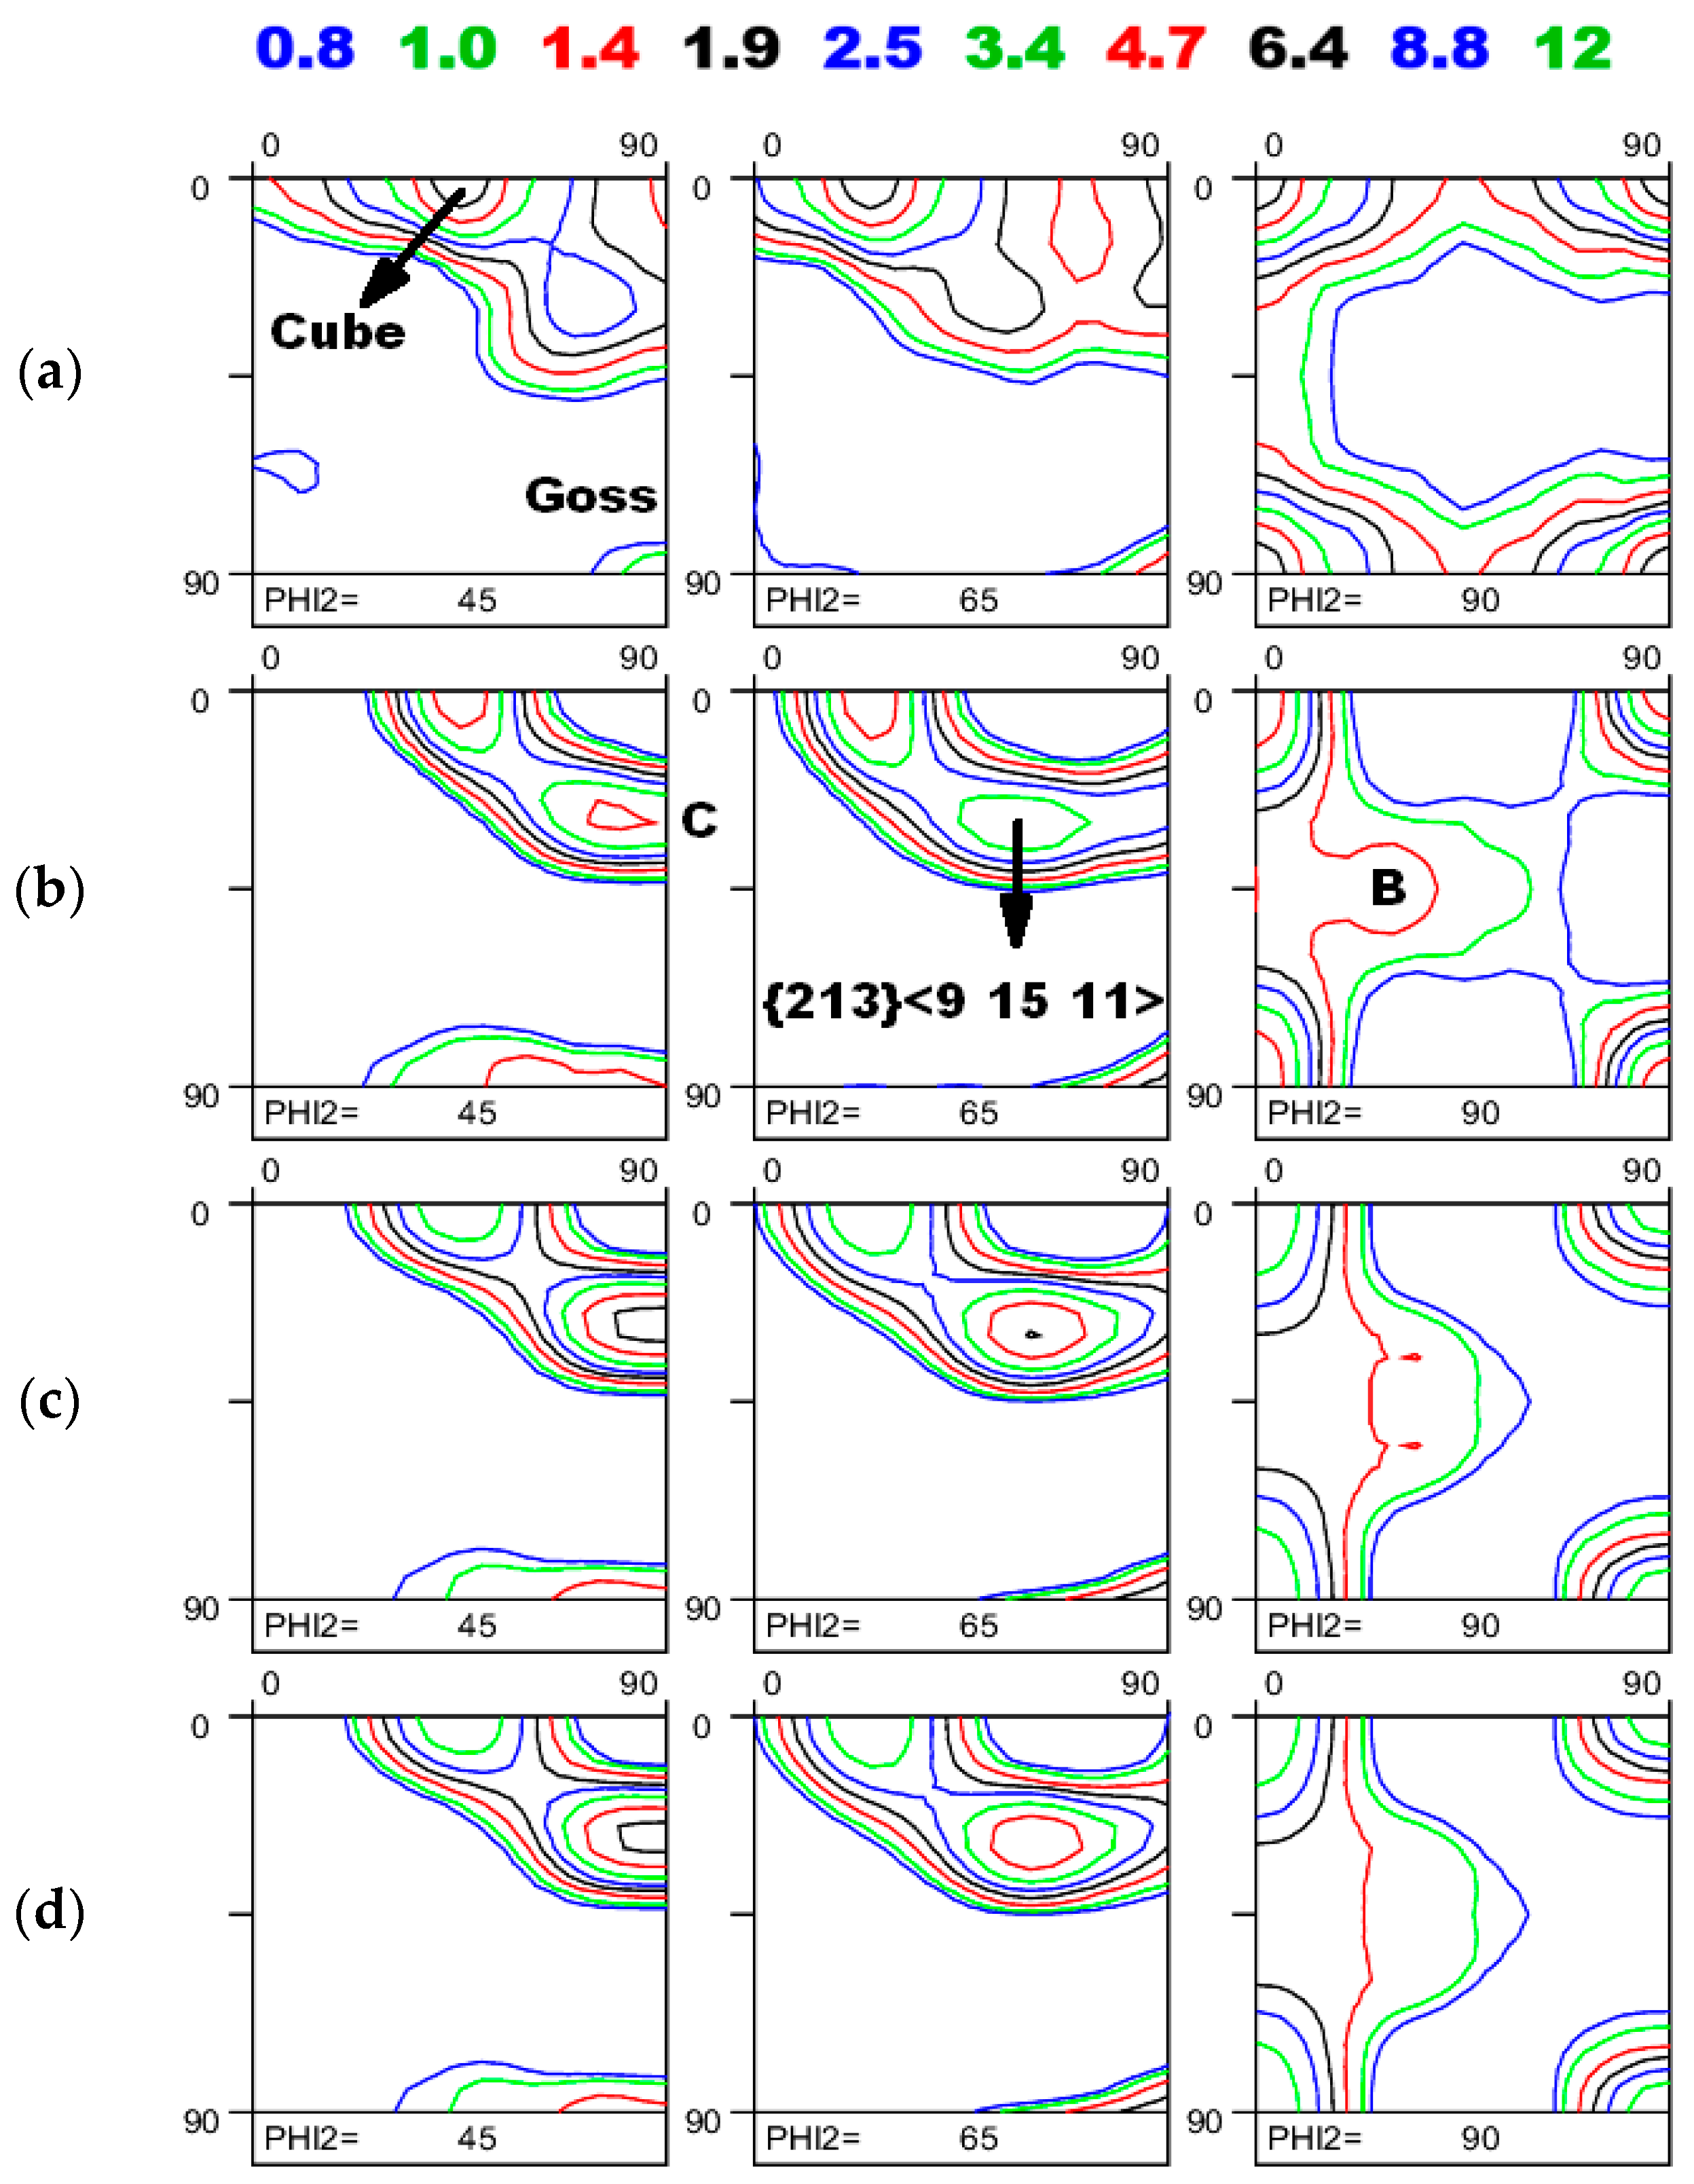
Al alloys are generally cold-rolled with thickness reductions up to ~85% in several passes; however, in some cases, intermediate annealing can be employed to avoid texture banding, which leads to a roping phenomenon [24,27]. In the current case, the material was subjected to a 29.6% reduction along one path. Preceding the rolling, the annealing process ensured a recrystallization texture in the investigated material. The bulk (overall) texture of the sheet (Figure 9a) measured across the thickness was mainly composed of recrystallization texture components such as Cube ({001}〈100〉), Goss ({001}〈100〉), and ~ {113}〈121〉 orientation (φ1 = 75°, Φ = 25°, φ2 = 45°). As revealed in Figure 9b, the deformation process induced qualitative texture transformation, where the recrystallization texture components rotated to both α (〈001〉//ND) and β-fiber orientations, which is analytically described by the following expression:
{ h , 1 , h + 1 } h ( h + 1 ) 3 / 4 h , 2 h ( h + 1 ) 1 / 2 h , h 2 h 3 / 4 + 2 h h 1 / 2 ,
The reference components of the β-fiber calculated by means of Equation (13) enable the tracing of the texture evolution involved in cold rolling. The deformation texture orientations showed an unequal distribution along the β-fiber (Figure 9b). The intensity along this fiber tended to decline with an increase in h (Equation (13)), i.e., the texture intensity followed a downward trend while moving from Copper (h = 1) via {213}〈9 15 11〉 (h = 2) to Brass (h is an infinitely large number). In Figure 9b, a 29.6% rolling reduction did not cause a severe drop in the intensity of the Cube orientation.
Figure 9c,d reveals the evolution of the rolling textures modeled with the Alamel model [5,6] by employing the deformation history in Figure 10. The CP calculations were performed for six equidistant layers (the surface, four subsurface layers, and midthickness plane), and subsequently, the average bulk texture was calculated by merging the individual ODFs. When comparing Figure 9b–d, it becomes apparent that both the experimental and modeled textures followed an identical evolutionary pattern. Similarly to the experimentally measured ODF of Figure 9b, the β-fiber orientations of the modeled counterparts (Figure 9c,d) were well distinguished in the first part of the skeleton line (between {112}〈111〉 and {213}〈9 15 11〉), while toward the tail of the fiber (running from {213}〈9 15 11〉 to {101}〈121〉), the individual components tended to vanish.
Inasmuch as the rolling was performed on well-lubricated surfaces on both the sheet and rolling cylinders, the FEM simulation was performed with the μ slightly exceeding the minimum value necessary for rolling (μ = 1.5μmin), while the corresponding FLM model parameters (α and n) were approximated by Equations (10)–(12). As Figure 9 shows, an approximation of rolling by both the FEM and FLM employed [14] provided a meaningful texture prediction; however, employing various deformation histories accounted for diverse texture development. The quality of the texture simulation was assessed by analyzing qualitative texture indicators (TIDs) such as the ODF maximum value (ODFmax), texture index (TI = ∫[f(g)]2dg), and normalized index difference ID. The ID, observed between the experimental fexp(g) and the simulated fsim(g) textures, tended to rise with an increase in diversity between the compared ODFs:
ID = ∫[fexp(g) − fsim(g)]2dg/∫[fexp(g)]2dg
An examination of the TIDs calculated for Figure 9c,d clearly indicates that the FLM coupled with the CP model was capable of carrying out a texture simulation close to the one performed with the deformation history obtained by means of the finite element model. The employment of both FEM and FLM in the texture simulation led to a slight overestimation of the ODFmax value compared to the experimental counterpart, whereas the calculated TIs revealed a close resemblance to the experimentally measured one. Furthermore, the low ID numbers obtained by FEM and FLM (ID(FEM) = 0.085 and ID(FEM) = 0.076) suggest that the FLM employed can be considered to be a potential approach for the computation of strain history in rolling. Although the time necessary for crystal plasticity simulation is hardly affected by the strain mode, the same cannot be said about the calculation of strain history by FEM and FLM, which gives credit to the practical implementation of the latter. The FLM calculation can be performed within a fraction of a second, while FEM requires hours for computation.
The heterogeneity of texture evolution across the thickness of a rolled sheet was accounted for by considering the heterogeneous nature of the strain path evolution in each individual layer (see Figure 10). The through-thickness strain inhomogeneities tended to evolve due to unequal shear distribution. In cold-rolling trials, the sense of balance between the geometric and friction-induced shear components is governed by friction conditions. As seen in Figure 10, first the resulting shear rate ε ˙ 13 was of a negative sense and after that became positive. This implied that initially ε ˙ 13 was tilted toward the roll gap geometry-induced shear components, while later the friction-induced shear tended to prevail [2]. Apart from the quantitative diversity (Figure 10), the major difference between the strain rate patterns calculated by FEM and FLM was that the flow-line model predicted a more gradual change of ε ˙ i j components with time, while the corresponding counterparts computed by FEM revealed more oscillating behavior.
Figure 11 reveals both an experimentally measured and simulated evolution of texture in various thickness layers. The ODF of the first layer covered the area between the surface and 3/10 of the half-thickness, the second layer extended from the 3/10 to 3/5 of the half-thickness, and the third layer ranged between 3/5 and the midplane of the sheet. The ODFs of these layers, displayed in Figure 11a, reveal a close qualitative resemblance, while some quantitative diversities can be observed between the individual textures. In order to access the degree of texture heterogeneity (IDH) between the two layers (i and j), the index difference was expressed as
IDH = ∫[fi(g) − fj(g)]2dg/∫[f0exp(g)]2dg,
where f0exp(g) refers to experimentally measured overall (bulk) texture.
Prior to cold rolling (Figure 11a), the recrystallization process ensured a minimal degree of heterogeneity in the investigated material (see Table 1 for details). The values of IDH tended to enhance after cold rolling, pointing toward the evolution of texture diversities in various layers (IDH(L1–2) = 6.43 × 10⁻² and IDH(L2–3) = 2.40 × 10⁻²). This evolutionary pattern was likewise captured by the crystal plasticity calculations, which predicted more homogeneous textures for layers 2 and 3, whereas the extent of heterogeneity rose when the IDH values for layers 1 and 2 were computed (FLM-CP: IDH(L1–2) = 4.59 × 10⁻² and IDH(L2–3) = 5.60 × 10⁻³; FEM-CP: IDH(L1–2) = 4.41 × 10⁻² and IDH(L2–3) = 5.33 × 10⁻³).
In the rolled material (Figure 11b), the intensity of the {001}〈100〉 orientation was enhanced from the surface to the midthickness, and this tendency was equally captured by the CP simulations of Figure 11c,d. The same evolutionary trend was observed for the {112}〈111〉 component, while the tail of the β-fiber (particularly the {101}〈121〉 orientation) tended to weaken from the surface to the middle. This phenomenon was also captured by both the FEM-CP and FLM-CP simulations. The quantitative texture indicators, which allowed for comparisons between the experimentally evolved deformation texture patterns (Figure 11b) and the modeled counterparts (Figure 1c,d), are summarized in Table 2. It is obvious that the results of the simulations showed a close resemblance between the calculated and experimentally measured counterparts. Furthermore, a minimal discrepancy was observed between the FLM- and FEM-based CP predictions.
In addition to previously published works [3,4,5,6,7,8,9,10,11,28], this investigation reveals how the quality of the texture simulation is affected by the choice of strain history approximation. Examining the results of the CP computations shown in Figure 9 and Figure 11, it can be noticed that the Taylor-type homogenization model (Alamel) [5,6] provided both a qualitatively and quantitatively reasonable texture prediction upon the condition that the technique employed for the computation of the strain history was capable of capturing the strain heterogeneity across the thickness. As was shown in recent work [28], the application of other homogenization schemes (VPSC [7] or Cluster V [8]) likewise tends to provide meaningful texture evolutionary patterns with quantitative texture characteristics comparable to the Alamel model. Therefore, the FLM employed [14] can be successfully coupled with an arbitrary CP model.
Although FLM neglected the strain hardening phenomena, while the materials experienced hardening during deformation in the FEM, the result of the CP simulations performed with both FEM and FLM outputs revealed minor differences (Figure 9 and Figure 11). This implies that strain hardening parameters have a slight effect on the quality of texture prediction. Furthermore, approximating the rolling process with plane strain compression or geometric models [10,28] equally provides a reasonable estimate of texture evolution. Even though Taylor-type homogenization models employ strain hardening, varying the values of hardening model parameters for metallic systems, in which the deformation is governed by a single mode (such as a slip), has a negligible effect on the quality of texture prediction. It should be pointed out that this scenario is not applicable to polycrystals, which tend to deform in two diverse modes. In metals deformed by sleep and twinning, the deformation occurs by means of the first mechanism up to a certain strain level, whereas exceeding this straining degree induces another mechanism of deformation (twinning). In this case, the choice of correct hardening parameters is of critical importance. It should be likewise stressed here that when materials experience extensive strain hardening or are subjected to severe plastic deformation, the evolution of local phenomena (such as shear bands) cannot be neglected, since they affect texture development. In contrast to homogenization CP theories, crystal plasticity finite element approaches or CP formulations based on fast-Fourier transforms [4] are capable of predicting macroscopic strain heterogeneities such as through-thickness strain gradients and also providing information on local phenomena (such as the strain/stress evolution on grain boundaries or the development of shear bands). These numerical approaches are computationally demanding and are not discussed in the frame of this study.
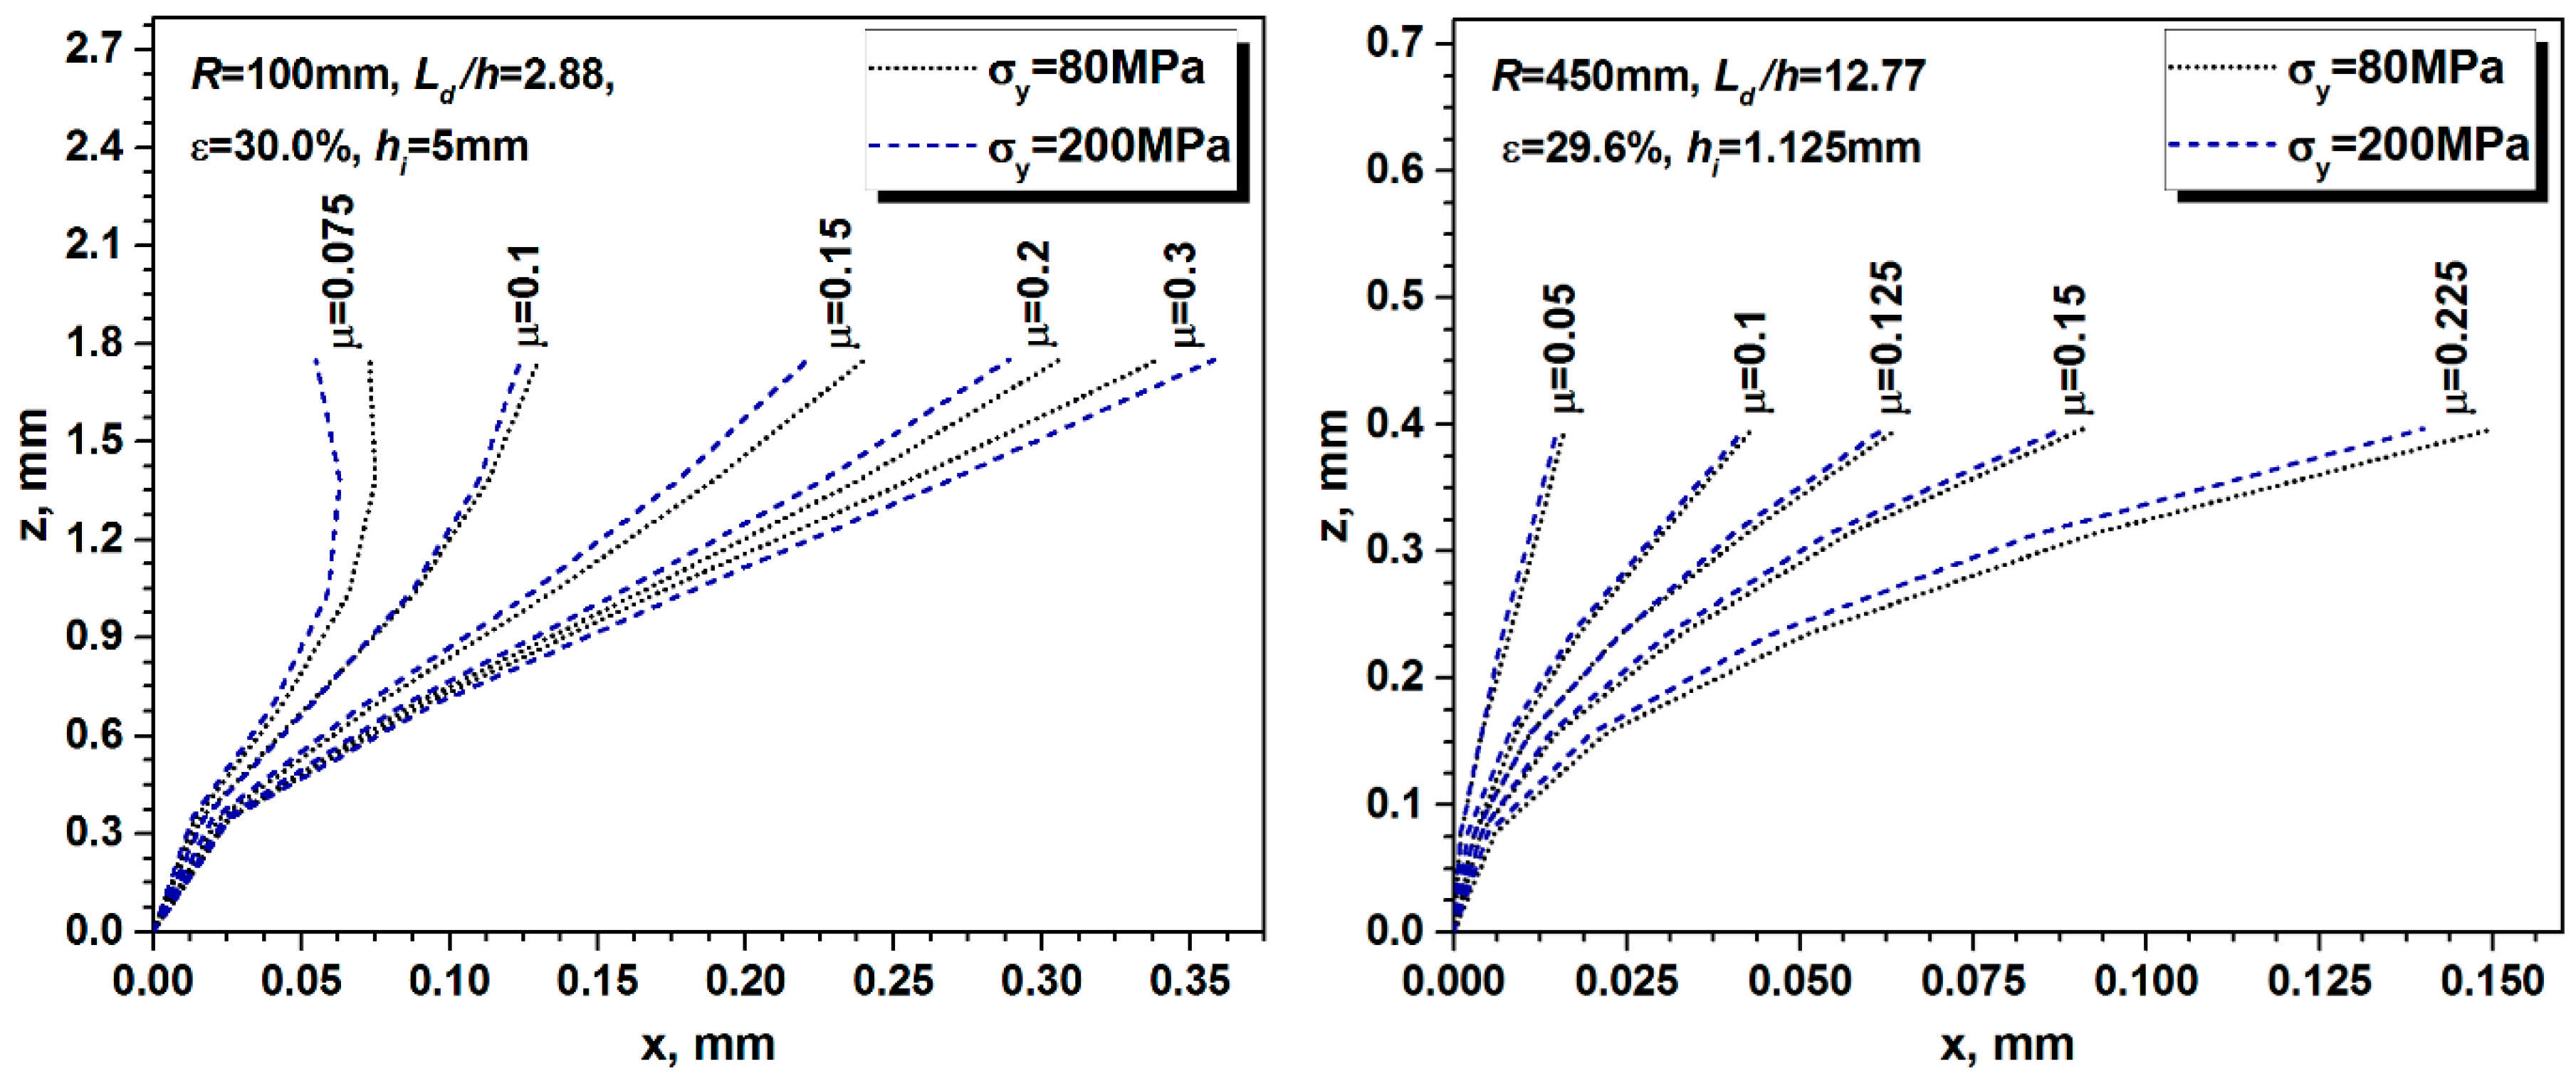
In addition to the above-mentioned issues, there are many pros and cons regarding the implementation of analytical models; however, to make the application of FLM approaches more practically attainable, both the upper and lower bounds of implementation should be determined. This investigation predominantly focused on Al alloys with a yield point comparable to 80 MPa; however, even in the frame of a particular series, the yield stress may vary around ~100 MPa. This change in the flow stress will significantly affect the stress state of materials during rolling, which is not accounted for in FLM [14]. In order to determine the applicability limits of the FLM employed, the deformation flow was analyzed at the two ends of the Ld/h spectrum (Ld/h = 2.88 and Ld/h = 12.77) in materials with σ (σy = 80 MPa and σy = 200 MPa).The results of the FEM simulations presented in Figure 12 suggest that an increase in yield stress from 80 MPa to 200 MPa triggers some variety in the displacement across the thickness at low values of the contact length-to-mean thickness ratio (Ld/h = 2.88), whereas this deviation tends to vanish when rolling is performed with large draughts (Ld/h = 12.77). Analyzing Figure 5, Figure 6 and Figure 7 and 12, it turns out that the deformation flow in materials, as predicted by both the FEM and FLM simulations, was majorly controlled by roll gap geometry and friction conditions, while the hardening phenomena seemed to have a smaller effect on the corresponding displacement profiles. The inconsistencies shown in Figure 12 did not cause significant qualitative and quantitative texture changes, since minor strain path variations do not affect the evolution of texture drastically (see Figure 9 and Figure 11). This implies that FLM [14] can be employed for texture simulations in Al alloys from diverse series; nevertheless, it should be pointed out that if material properties or processing limits significantly deviate from the above-mentioned bounds, the results should be treated with particular care.

5. Conclusions

Careful analysis of both the finite element (FEM) and flow-line (FLM) model outputs led to the conclusion that the FLM model parameters were directly correlated with roll gap geometry and the friction coefficient. Analytical expressions for the determination of α and n were developed in the frame of the contribution, which ensured the implementation of this approach without fitting parameters. The boundary conditions covered the rolling trials with both intermediate and large draughts, which accounted for a variation in the contact length-to-mean thickness ratio between 2.88 and 12.77 and a friction coefficient spectrum changing from 0.025 to 0.3.
The mean-field crystal plasticity (CP) model employed (Alamel), which takes into account short-range grain interaction phenomena, served to produce a through-thickness texture heterogeneity when the strain path was computed either by FEM or FLM. The FLM combined with the CP employed tended to provide a reasonably accurate prediction of bulk texture evolution, and this approach was likewise efficient in capturing the evolution of texture in the individual through-thickness layers. An analysis of quantitative texture indicators clearly demonstrated that the Taylor-type homogenization CP model coupled with the FLM was capable of carrying out a texture simulation close to the one performed with deformation history obtained by means of the finite element model.
The results of the CP modeling point toward the possible practical implementation of FLM approaches, since these computationally efficient methods ensure reasonably accurate texture prediction.

Author Contributions

Conceptualization, J.J.S.; J.J.S; investigation, J.J.S; writing—review and editing, J.J.S; funding acquisition, J.J.S.

Funding

This research was funded by the EFOP-3.6.1-16-2016-00018 project: “improving the role of research + development + innovation in higher education through institutional developments assisting intelligent specialization in Sopron and Szombathely”. The work was performed in the frame of the Széchenyi 2020 program: “innovative processing technologies, applications of energy engineering, and implementation of wide-ranging techniques for microstructure investigation”.

Conflicts of Interest

The author declares no conflict of interest.

References

  1. Raabe, D. Computational Materials Science, 1st ed.; WILEY-VCH: New York, NY, USA, 1998; pp. 111–298. [Google Scholar]
  2. Lenard, J.G.; Pietrzyk, M.; Cser, L. Physical Simulation of The Properties of Hot Rolled Products, 1st ed.; Elsevier: Oxford, UK, 1999; pp. 61–317. [Google Scholar]
  3. Delannay, L.; Jacques, P.J.; Kalidindi, S.R. Finite element modeling of crystal plasticity with grains shaped as truncated octahedrons. Int. J. Plast. 2006, 22, 1879–1898. [Google Scholar] [CrossRef]
  4. Lebensohn, R.A.; Kanjarla, A.K.; Eisenlohr, P. An elasto-viscoplastic formulation based on fast Fourier transforms for the prediction of micromechanical fields in polycrystalline materials. Int. J. Plast. 2012, 32–33, 59–69. [Google Scholar] [CrossRef]
  5. Van Houtte, P.; Li, S.; Seefeldt, M.; Delannay, L. Deformation texture prediction: From the Taylor model to the advanced Lamel model. Int. J. Plast. 2005, 21, 589–624. [Google Scholar] [CrossRef]
  6. Van Houtte, P.; Kanjarla, A.K.; Van Bael, A.; Seefeldt, M.; Delannay, L. Multiscale modeling of the plastic anisotropy and deformation texture of polycrystalline materials. Eur. J. Mech. A/Solids 2006, 25, 634–648. [Google Scholar] [CrossRef]
  7. Lebensohn, R.A.; Tome, C.N. A self-consistent anisotropic approach for the simulation of plastic deformation and texture development of polycrystals: Application to zirconium alloys. Acta Metall. Mater. 1993, 41, 2611–2624. [Google Scholar] [CrossRef]
  8. Xie, Q.; Van Bael, A.; Sidor, J.; Moerman, J.; Van Houtte, P. A new cluster type model for the simulation of textures of polycrystalline metals. Acta Mater. 2014, 69, 175–186. [Google Scholar] [CrossRef]
  9. Mao, W. On the Taylor principles for plastic deformation of polycrystalline metals. Front. Mater. Sci. 2016, 10, 335–345. [Google Scholar] [CrossRef]
  10. Engler, O.; Huh, M.-Y.; Tome, C.N. A study of through-thickness texture gradients in rolled sheets. Metall. Mater. Trans. A 2000, 31, 2299–2315. [Google Scholar] [CrossRef]
  11. Sidor, J.J.; Petrov, R.H.; Xie, Q.; Van Houtte, P.; Kestens, L.A.I. Evaluation of crystallographic changes and plastic strain ratio in Al alloys. Mater. Sci. Technol. 2017, 33, 667–677. [Google Scholar] [CrossRef]
  12. Zhang, S.H.; Zhao, D.W.; Gao, C. The calculation of roll torque and roll separating force for broadside rolling by stream function method. Int. J. Mech. Sci. 2012, 57, 74–78. [Google Scholar] [CrossRef]
  13. Dogruoglu, A.N. On constructing kinematically admissible velocity fields in cold sheet rolling. J. Mater. Process. Technol. 2001, 110, 287–299. [Google Scholar] [CrossRef]
  14. Decroos, K.; Sidor, J.; Seefeldt, M. A new analytical approach for the velocity field in rolling processes and its application in through-thickness texture prediction. Metall. Mater. Trans. A 2014, 45, 948–961. [Google Scholar] [CrossRef]
  15. Beausir, B.; Toth, L.S. Microstructure and Texture in Steels and Other Materials, 1st ed.; Haldar, A., Suwas, S., Bhattacharjee, D., Eds.; Springer: London, UK, 2009; pp. 415–417. [Google Scholar]
  16. Tian, Y.; Guo, Y.-H.; Wang, Z.-D.; Wang, G.-D. Analysis of Rolling Pressure in Asymmetrical Rolling Process by Slab Method. J. Iron Steel Res. Int. 2009, 16, 22–26. [Google Scholar] [CrossRef]
  17. Aboutorabi, A.; Assempour, A.; Afrasiab, H. Analytical approach for calculating the sheet output curvature in asymmetrical rolling: In the case of roll axis displacement as a new asymmetry factor. Int. J. Mech. Sci. 2016, 105, 11–22. [Google Scholar] [CrossRef]
  18. Liu, Y.-M.; Ma, G.-S.; Zhang, D.-H.; Zhao, D.-W. Upper bound analysis of rolling force and dog-bone shape via sine function model in vertical rolling. J. Mater. Process. Technol. 2015, 223, 91–97. [Google Scholar] [CrossRef]
  19. Rajmohan, N.; Szpunar, J.A. A new model for recrystallization of heavily cold-rolled aluminum using orientation-dependent stored energy. Acta Mater. 2000, 48, 3327–3340. [Google Scholar] [CrossRef]
  20. Sidor, J.J.; Decroos, K.; Petrov, R.H.; Kestens, L.A.I. Evolution of recrystallization textures in particle containing Al alloys after various rolling reductions: Experimental study and modeling. Int. J. Plast. 2015, 66, 119–137. [Google Scholar] [CrossRef]
  21. Athreya, C.N.; Mukilventhan, A.; Suwas, S.; Vedantam, S.; Sarma, V.S. Influence of the mode of deformation on recrystallisation behaviour of titanium through experiments, mean field theory and phase field model. Model. Simul. Mater. Sci. Eng. 2018, 26, 035004. [Google Scholar] [CrossRef] [Green Version]
  22. van Houtte, P. MTM-FHM Software, 2nd ed.; MTM-KU Leuven: Leuven, Belgium, 1995; pp. 1–20. [Google Scholar]
  23. Avitzur, B. Friction-aided strip rolling with unlimited reduction. Int. J. Mach. Tool. Des. Res. 1980, 20, 197–210. [Google Scholar] [CrossRef]
  24. Humphreys, J.; Rohrer, G.S.; Rollett, A. Recrystallization and Related Annealing Phenomena, 3rd ed.; Elsevier: Amsterdam, The Netherlands, 2017; pp. 14–135. [Google Scholar]
  25. Schneider, M.; Werner, F.; Langenkämper, D.; Reinhart, C.; Laplanche, G. Effect of Temperature and Texture on Hall–Petch Strengthening by Grain and Annealing Twin Boundaries in the MnFeNi Medium-Entropy Alloy. Metals 2019, 9, 84. [Google Scholar] [CrossRef]
  26. Lei, B.; Chen, G.; Liu, K.; Wang, X.; Jiang, X.; Pan, J.; Shi, Q. Constitutive Analysis on High-Temperature Flow Behavior of 3Cr-1Si-1Ni Ultra-High Strength Steel for Modeling of Flow Stress. Metals 2019, 9, 42. [Google Scholar] [CrossRef]
  27. Bennett, T.; Sidor, J.; Petrov, R.H.; Kestens, L.A.I. The effect of intermediate annealing on texture banding in aluminum alloy 6016. Adv. Eng. Mater. 2010, 12, 1018–1023. [Google Scholar] [CrossRef]
  28. Sidor, J.J. Deformation texture simulation in Al alloys: Continuum mechanics and crystal plasticity aspects. Model. Simul. Mater. Sci. Eng. 2018, 26, 085011. [Google Scholar] [CrossRef]
Figure 1. Variety of length scales involved in modeling the microstructure–properties relationship.
Metals 09 01098 g001
Figure 2. Schematic illustration of sheet geometry in a roll gap with the parameters of the flow-line model employed [14].
Metals 09 01098 g002
Figure 3. Velocity components (vx and vz) calculated by the flow-line modeling (FLM) employed for various model parameters along six flow lines. A sheet of 1.125-mm initial thickness was subjected to a 29.6% reduction with a roll of R = 64.5 mm. The sequence of streamlines was the following: zs = 1 (surface), zs = 0.8 (subsurface 1), zs = 0.6 (subsurface 2), zs = 0.4 (subsurface 3), zs = 0.2 (subsurface 4), and zs = 0 (midplane).
Metals 09 01098 g003
Figure 4. Deformation patterns of the initially rectangular grid (half-thickness) emerged after a 29.6% reduction (initial thickness = 1.125 mm, R = 64.5 mm), as predicted by FLM for various model parameters. The sequence of streamlines was the following: zs = 1 (surface), zs = 0.8 (subsurface 1), zs = 0.6 (subsurface 2), zs = 0.4 (subsurface 3), zs = 0.2 (subsurface 4), and zs = 0 (midplane). In the FLM calculation, the position of a neutral point was identical for all cases, LdN = 2.5 mm.
Metals 09 01098 g004
Figure 5. Deformation patterns and von Mises strain distribution across the thickness of a rolled sheet, subjected to a 29.6% thickness reduction (initial thickness = 1.125 mm, R = 64.5 mm), as predicted by finite element modeling for various friction coefficients: (a) μ = 0.05; (b) μ = 0.1; (c) μ = 0.15; (d) μ = 0.2. The grid was rectangular prior to deformation.
Metals 09 01098 g005
Figure 6. Deformation patterns and von Mises strain distribution across the thickness of a rolled sheet, subjected to a 29.6% thickness reduction (initial thickness = 1.125 mm, R = 64.5 mm), as predicted by the flow-line model employed [14] with the following model parameters: (a) α = 6.12 × 10⁻², n = 1.11; (b) α = 1.55 × 10⁻¹, n = 1.38; (c) α = 2.69 × 10⁻¹, n = 1.52; (d) α = 3.84 × 10⁻¹, n = 1.6. The grid was rectangular prior to deformation. Each set of FLM fitting parameters ensured the best fit for the corresponding finite element modeling (FEM) output (shown in Figure 5a–c).
Metals 09 01098 g006
Figure 7. Grid distortions predicted for various roll gap geometries by the FLM employed and FEM. The FLM model parameters were calculated by Equations (10)–(12).
Metals 09 01098 g007
Figure 8. Deformation patterns predicted for identical rolling reductions and various initial thicknesses by the FLM [14]: (a) initial thickness = 1.125 mm; (b) initial thickness = 4.0 mm.
Metals 09 01098 g008
Figure 9. Experimentally measured and simulated overall textures in the investigated material: (a) the orientation distribution function (ODF) prior to rolling; (b) experimentally measured deformation texture after a 29.6% rolling reduction, where TI = 2.219 and ODFmax = 6.03; (c) the ODF simulated with the Alamel model and the strain history calculated by FEM, where ID = 0.085, TI = 2.533, and ODFmax = 7.57; (d) the ODF simulated with the Alamel model and the strain history predicted by FLM, where ID = 0.076, TI = 2.460, and ODFmax = 7.30. The deformation history used for the texture simulations is shown in Figure 10.
Metals 09 01098 g009
Figure 10. Evolution of strain rate components with time across the thickness of a rolled sheet calculated with both FEM and FLM for a 29.6% reduction (initial thickness = 1.125 mm, R = 64.5 mm). In FEM, the friction coefficient was assumed to be μ = 1.5μmin = 0.053, while the corresponding FLM fitting parameters were calculated by Equations (10)–(12) (α = 0.066, n = 1.139).
Metals 09 01098 g010
Figure 11. Experimentally observed and simulated texture heterogeneities across the thickness: (a) the prerolling texture; (b) the measured deformation texture (after a 29.6% reduction); (c) the ODF simulated with the Alamel model and the strain path predicted by FEM (μ = 0.053); (d) the ODF simulated with the Alamel model and the strain path predicted by the FLM employed (α = 0.066, n = 1.139).
Metals 09 01098 g011
Figure 12. Deformation patterns predicted by FEM for materials with various yield stresses.
Metals 09 01098 g012
Table 1. Heterogeneity quantitative indicators calculated for the textures in Figure 11.
Layers IDH (Experiment)IDH (FEM)IDH (FLM)
Pre-rollingAfter rollingAfter rollingAfter rolling
Layers 1 and 22.94 × 10−36.43 × 10−24.41 × 10−24.59 × 10−2
Layers 2 and 39.09 × 10−32.40 × 10−25.33 × 10−35.60 × 10−3
Table 2. Texture quantitative indicators calculated for the textures in Figure 11.
Layer FEMFLMExperiment
ODFmax, m.r.d.TIIDODFmax, m.r.d.TIIDODFmax, m.r.d.TI
Layer 16.02.1860.0555.732.1080.0475.992.015
Layer 28.022.6450.1007.772.5710.0916.372.353
Layer 38.752.7870.0898.442.7190.0835.933.368