Abstract
The microstructure and wear behavior of a 500 Brinell hardness (HB) grade wear-resistant steel tempered at different temperatures were investigated in this study. The tempering microstructures and wear surface morphologies were studied by scanning electron microscopy (SEM) and transmission electron microscopy (TEM). The relationship between mechanical properties and wear resistance was analyzed. The microstructure of the steel mainly consisted of tempered martensite and ferrite. Tempered troosite was obtained when the tempering temperature was over 280 °C. The hardness decreased constantly with the increase of tempering temperature. The same hardness was obtained when tempered at 260 °C and 300 °C, due to the interaction of Fe3C carbides and dislocations. The impact toughness increased first and reached a peak value when tempered at 260 °C. As the tempering temperature was over 260 °C, carbide precipitation would occur along the grain boundaries, which led to temper embrittlement. The best wear resistance was obtained when tempered at 200 °C. At the initiation of the wear test, surface hardness was considered to be the dominant influencing factor on wear resistance. The effect of surface hardness improvement on wear resistance was far greater than the impact toughness. With the wear time extending, the crushed quartz sand particles and the cut-down burs would be new abrasive particles which would cause further wear. Otherwise, the increasing contact temperature would soften the matrix and the adhesive wear turned out to be the dominant wear mechanism, which would result in severe wear.
1. Introduction
Wear is one of the main damage forms in the material field. The total cost of abrasive wear is estimated to be up to 4% of the gross national product in the industrialized countries [1]. In this context, the improvement in wear resistance of the wear-resistant steels is of great significance.
Heat treatment is a significant process for steels to obtain the optimal microstructure component which has a significant influence on the mechanical properties of the steels, especially on the hardness and impact toughness [2]. A combination of sufficient hardness and high impact toughness can provide considerable abrasive wear resistance, and also enhance the capability of absorbing impact energy by the microstructure [3,4]. There were few studies on the effect of tempering behavior on abrasive wear resistance of a specific grade steel. Cao et al. [5] studied the tempering behavior of lath martensitic wear-resistant steels with a hardness lower than 450 HB. They found the addition of Mo and Ni had no significant effects on the carbides morphologies when the tempering temperature was below 350 °C. Ojala et al. [6] studied the relationship between microstructure characteristics, mechanical properties, and wear behavior of 15 commercially available 400 HB grade quenched wear-resistant steels from all over the world. Those steels were tested with granite gravel in a stable 235 N nominal crushing force condition. Rendón and Olsson [7] studied the abrasive wear resistance of the steels and pointed that a combination of high hardness and toughness is of importance in order to obtain a high wear resistance. Luo et al. [8] reported the amount of retained austenite decreased and the martensite/austenite islands decomposed with the increase of tempering temperature. They also found the distribution of carbides along prior austenite grains brought about the temper embrittlement. Abdollah-Zadeh et al. [9] reported that increasing the tempering temperature decreases the yield and ultimate tensile strengths, but increases the ductility. However, the tensile strength decreases at a higher rate compared with that of yield strength, indicating a lower rate of work hardening with increased tempering temperature. In addition, Qin et al. [10] analyzed the relationship between the mechanical properties and pitting corrosion.
Studies of different hardness categories lower than 500 HB have been widely published [6,7,8]. Also, the effects of quenching methods on microstructure and mechanical properties have been published [11]. Fu et al. [12] also investigated the effect of heat treatment on the hardenability, mechanical performances, and wear resistance of a high carbon low alloy steel. However, there are few published studies related to the systematical research on a 500 HB grade high strength low alloy wear-resistant steel. In this work, the effect of tempering temperature on microstructure, wear behavior, and the relationship between mechanical properties and wear resistance of a 500 HB grade wear-resistant steel were researched systematically.
2. Materials and Methods
2.1. Material and Heat Treatment
Steel ingots, weighing 10 kg, were prepared using vacuum induction melting. The chemical composition of the steel is given in Table 1. Then, the ingots were hot-rolled down to 12 mm thick plates. The martensite starting temperature (Ms), and the start (Ac1) and finish (Ac3) temperatures of austenite formation were 340.0, 738.1, and 817.8 °C, respectively, which were determined from a thermal expansion experiment using a DIL805A thermal dilatometer (BÄHR-Thermoanalyse, GmbH, Germany). The subsequent heat treatment was performed in a SX-G07102 chamber type electric resistance furnace (Shanghai Yaoshi Instrument Equipment Factory, Shanghai, China). The samples were heated at 880 °C for 30 min, followed by water quenching, then tempered at different temperature of 180, 200, 220, 240, 260, 280, 300, 350, or 400 °C for 30 min followed by air cooling.

Table 1.
Chemical composition of the test steel (wt %).
2.2. Mechanical Properties and Impact Wear Resistance Tests
All specimens for mechanical properties test were machined perpendicularly to the rolling direction. The tensile specimens were machined to 6 mm in diameter and 43 mm in length according to the ASTM E 8 subsize. Tensile tests were carried out at the room temperature using a CMT-4105 (Jinan Liangong Testing Technology Co., Ltd., Shandong, China) with a strain rate of 10−3 s−1. Charpy impact toughness (10 mm × 10 mm × 55 mm with a 45° V notch at the center) were measured using ZBC2452-B Charpy impact tester (MTS Industrial Systems (China) Co., Ltd., Shanghai, China). According to the standard GB/T 24186-2009 requirements, the impact performance test temperature was set to −20 °C. Three repeated tests for each condition were conducted and the average recorded values were considered as the tensile properties and impact toughness. Surface hardness of the specimens was measured using UH930 universal hardness tester (Amkii instruments (Shanghai) Co.,Ltd., Shanghai, China) and the average number of five hardness readings was considered as the hardness value.
Samples quenched and tempered at 200, 240, 260, 300, and 400 °C were selected for impact wear resistance tests. The impact wear resistance of the upper specimens (10 mm × 10 mm × 30 mm) were measured using MLD-10 dynamic load wear resistance test equipment (Zhangjiakou City Chengxin Test Equipment Manufacturing Co., Ltd., Hebei, China) and AISI 1045 steel was chosen to be the lower specimens. The hardness of the lower specimens is 49.7 HRC (469 HB). Figure 1 shows the schematic illustration of MLD-10 wear test equipment. The impact energy was chosen to be 2 J to meet the actual working conditions. The wear experiment details were given in Table 2. The wear resistance will be evaluated by Equation (1). The average particle size of quartz particles is about 300 μm and the sand flow rate is 40 kg/h.
where ε(s/g)—the wear resistance; ω(g/s)—the weight loss per second.
ε = 1/ω,
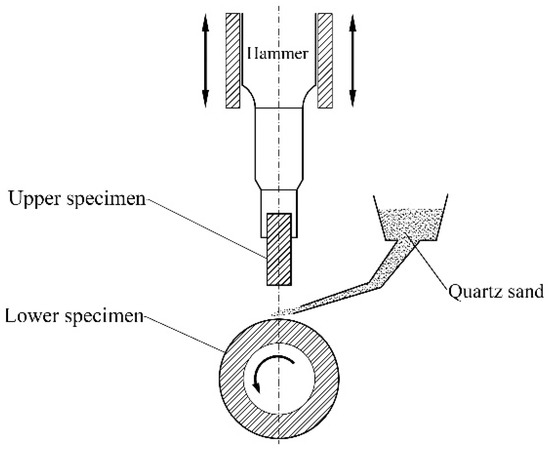
Figure 1.
Schematic illustration of MLD-10 impact wear resistance test equipment.
Table 2.
Experimental program of impact wear resistance tests.
2.3. Microstructure, Fracture, and Wear Morphology Observation
Heat-treated specimens and sections of the subsurface worn specimens were polished and etched by 4% Nital. Impact fractures and wear surfaces were cleaned by acetone in ultrasonic for 3 min and then by alcohol in ultrasonic for 3 min. The microstructures, impact fracture morphologies, wear surfaces, and wear subsurface layers were characterized using a FEI QUANTA FEG 450 Scanning Electron Microscope (FEI, Hillsboro, OR, USA). The fine structures of the as-quenched steel and steels tempered at 240 °C, 400 °C were observed using a JEM-2100 (HR) Transmission Electron Microscope (JEOL USA, Inc., Peabody, MA, USA).
3. Results
3.1. Microstructure Morphologies
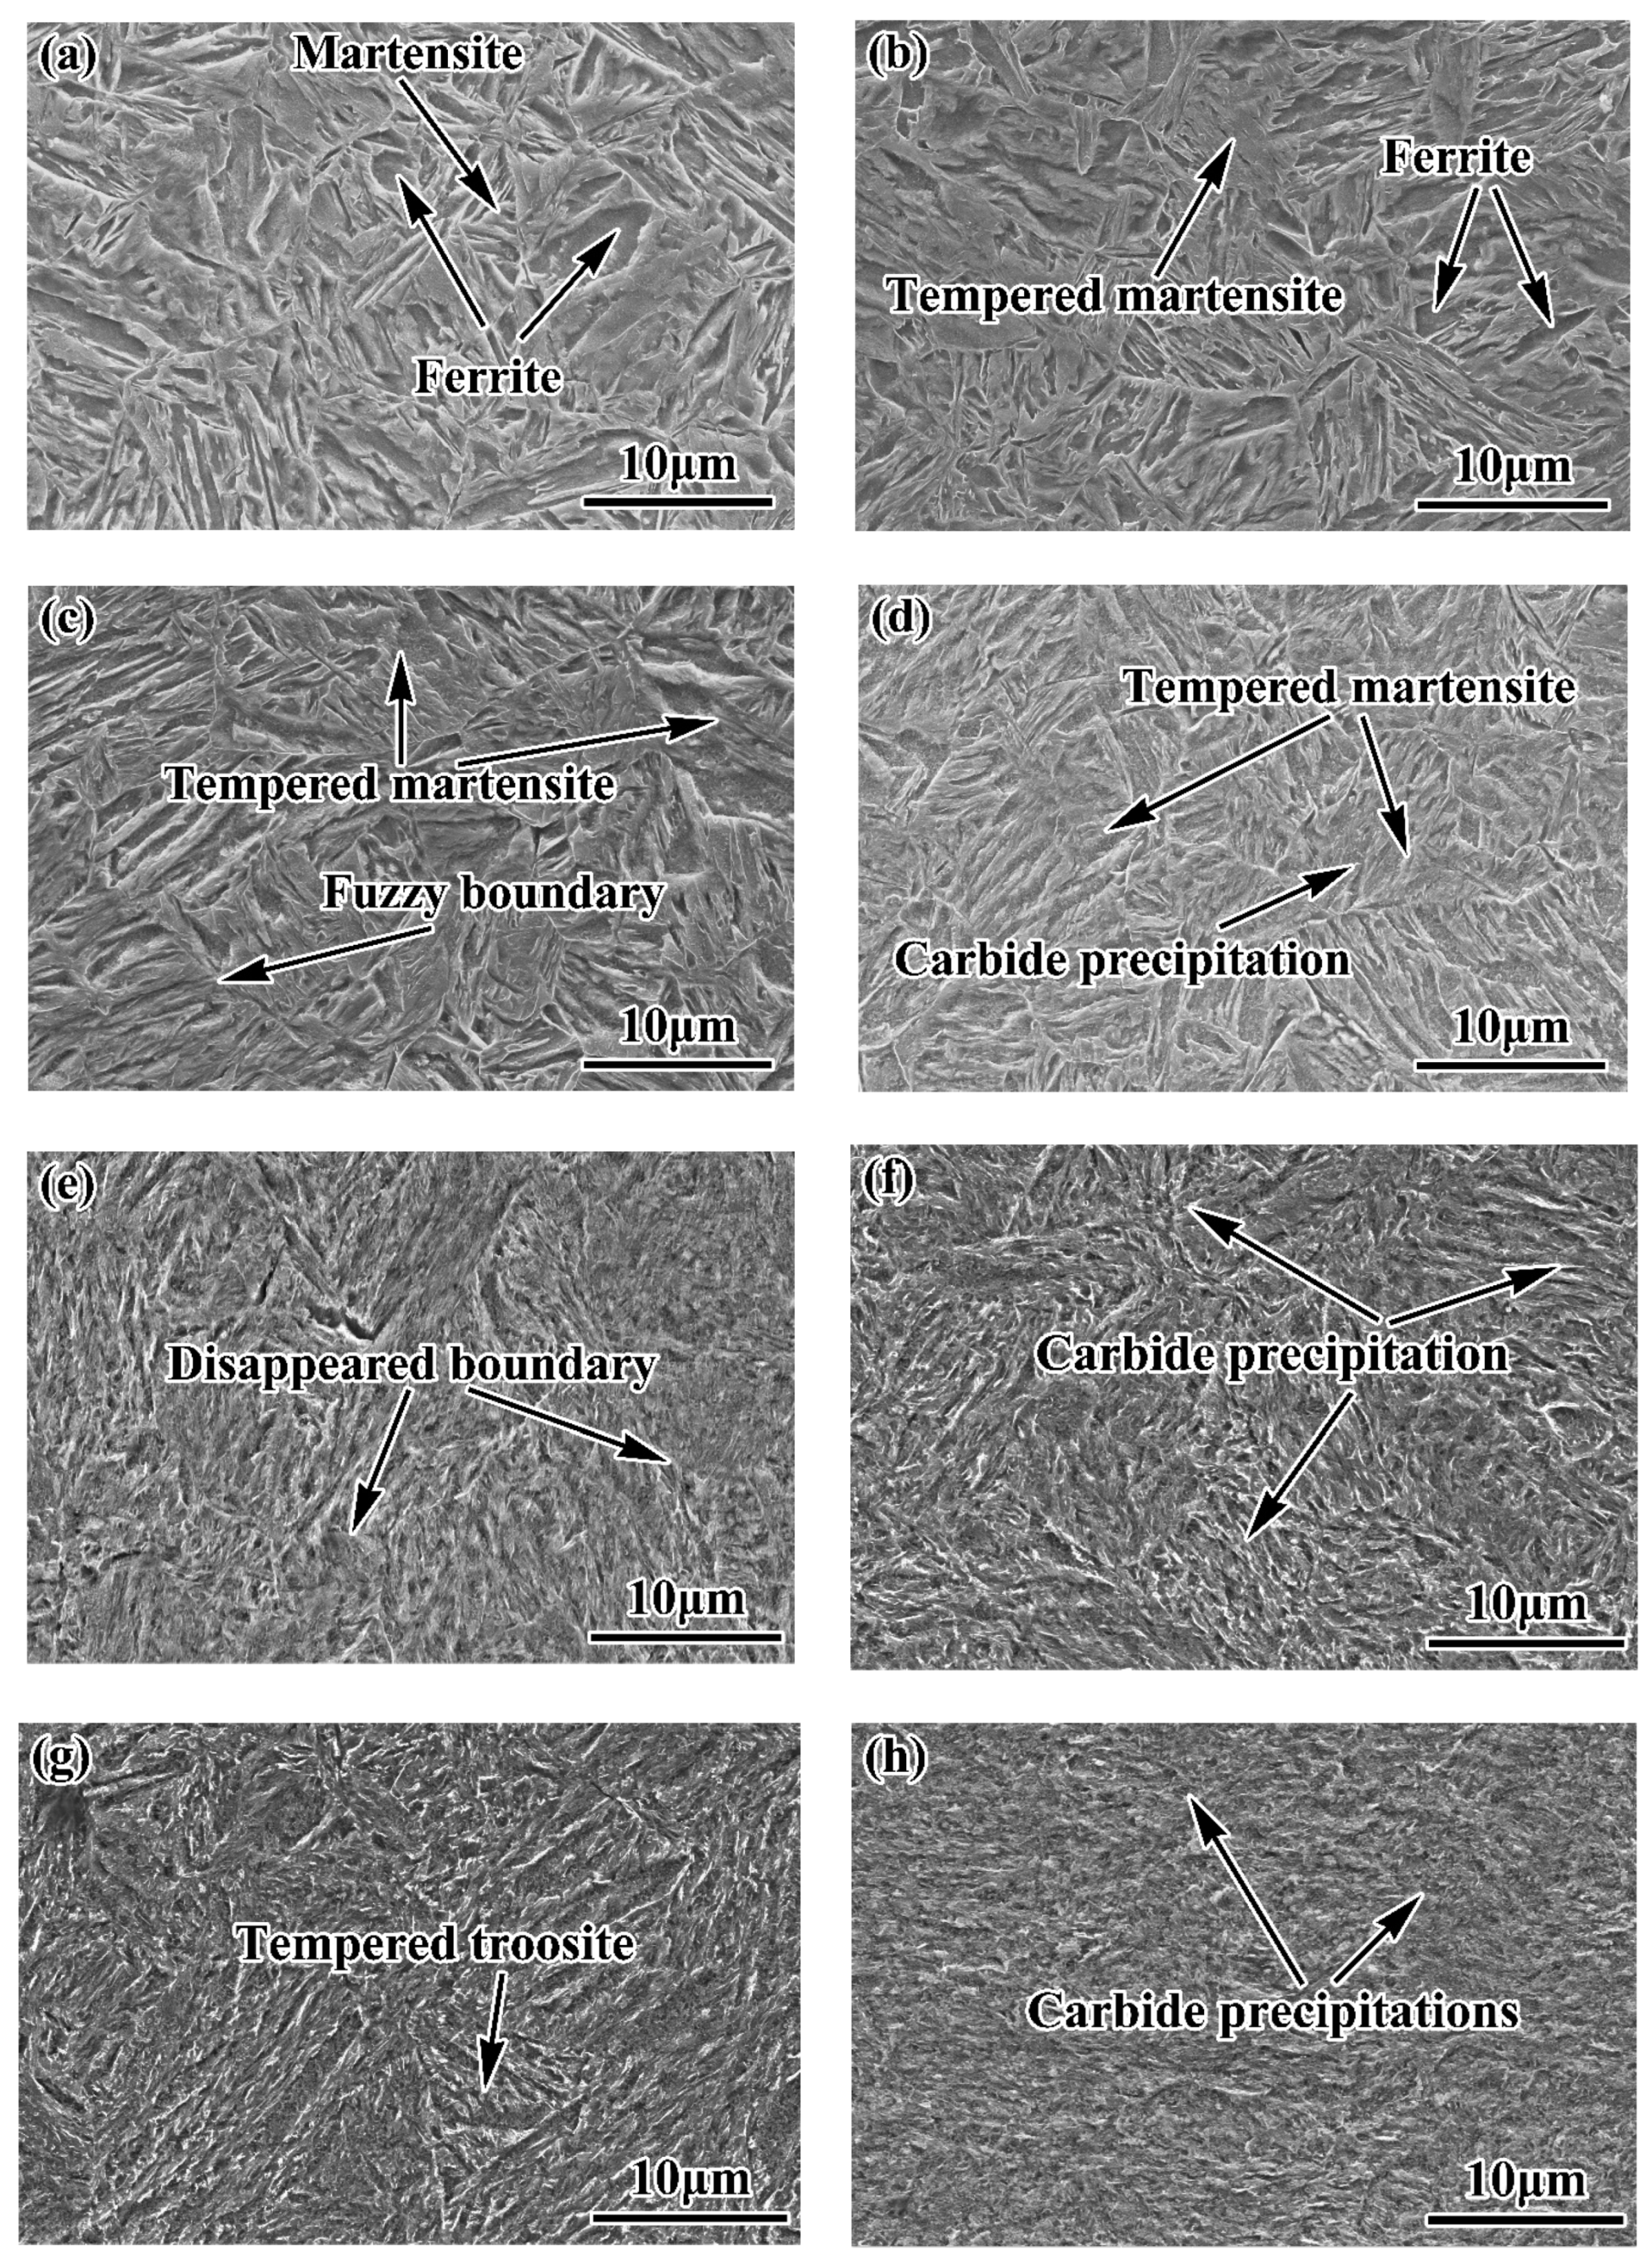
SEM images of the as-quenched steel and steels tempered at different temperatures were shown in Figure 2. The as-quenched steel mainly consisted of martensite and ferrite, as shown in Figure 2a. When the tempering temperature was below 260 °C, the martensite laths blurred, and the grain boundaries became fuzzy gradually (Figure 2c) as the tempering temperature increased. When the temperature increased up to 260 °C, the carbides started to precipitate (Figure 2d). When the tempering temperature was over 280 °C, the grain boundaries disappeared (seen in Figure 2e) and the carbide precipitations could be seen clearly (Figure 2f). As the temperature was over 350 °C, a composition of tempered troosite (Figure 2g) and carbide precipitations (Figure 2f) was obtained.
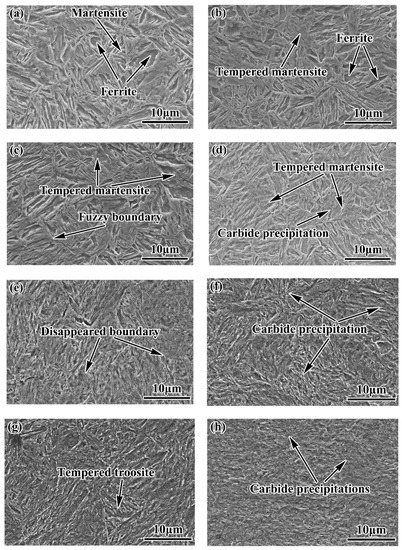
Figure 2.
SEM images of the test steels tempered at different temperatures: (a) as-quenched; (b) 200 °C; (c) 240 °C; (d) 260 °C; (e) 280 °C; (f) 300 °C; (g) 350 °C; (h) 400 °C.
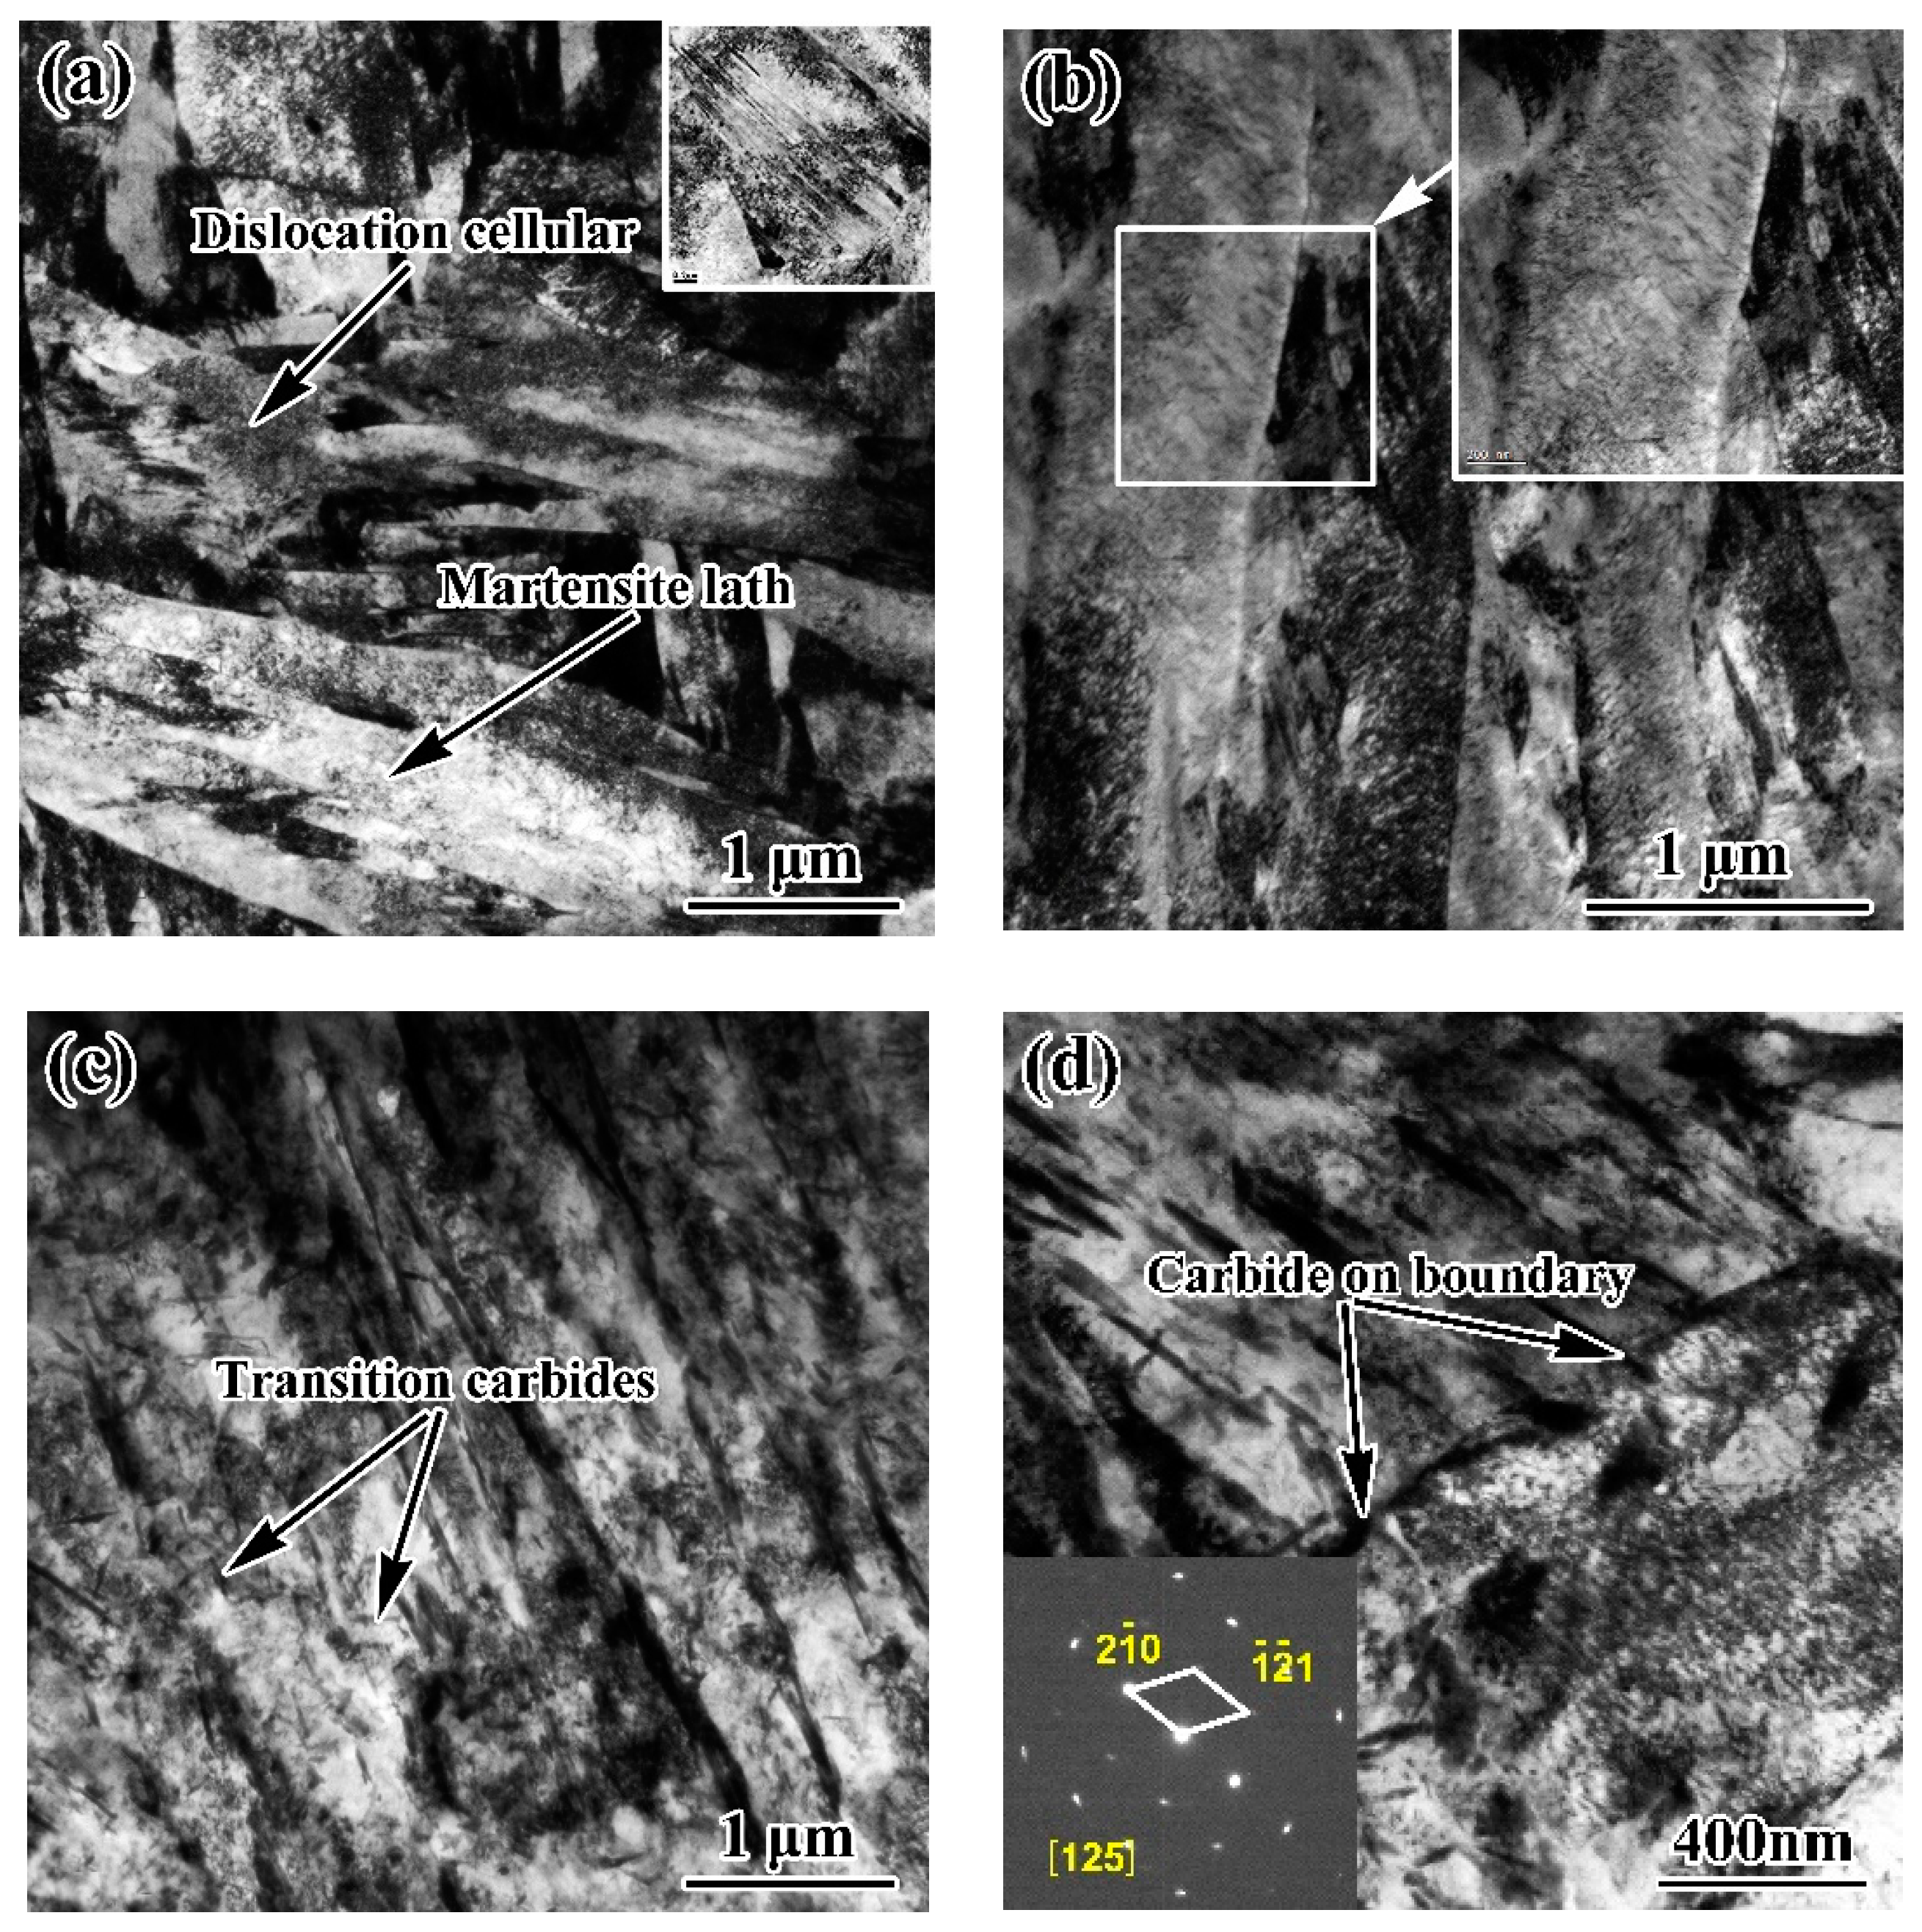
TEM images (Figure 3) of the quenched wear-resistant steel and steels tempered at 240 °C, 400 °C were obtained to explain the microstructure evolution more clearly. As shown in Figure 3a, the martensite laths of the as-quenched steel were fairly straight and parallel to each other. High dislocation density existed in the martensite laths and snarled into cellular microstructure. The twin crystal martensite formed after quenching because of the significant enrichment of carbon in austenite [10], which can be seen at the top right corner of Figure 3a. As the size of carbides formed in quenched steel were fairly small, no carbide precipitations were found in Figure 3a.

Figure 3.
TEM images of the test steels tempered at different temperatures: (a) as-quenched; (b) tempered at 240 °C; (c,d) tempered at 400 °C.
With the tempering temperature increasing, the dislocation density decreased and the carbide nucleus which formed at higher quenching temperature conditions. As shown in Figure 3b, the image at top right corner was the amplification of the region where the arrow points to, the parallel fine acicular carbides dispersed in the martensite laths, and the size was small with the tempering time of 30 min. As shown in Figure 3c,d, the carbides separated mainly in the martensite laths and some carbides separated along the grain boundaries. Otherwise, the size of the rod-like carbides shown in Figure 3d were about 220 nm in length and 10 nm in width. The carbides were confirmed to be Fe3C carbides by the selected area diffraction (SAD) pattern, which is shown at the bottom right corner of Figure 3d.
3.2. Mechanical Properties
The tensile strength (Rm), the yield strength (Rp0.2), total elongation, impact toughness, and hardness of the as-quenched samples were 1850 MPa, 1238 MPa, 8.8%, 25 J/cm2, and 543 HB, respectively. The effect of tempering temperature on mechanical properties is shown in Figure 4. As shown in Figure 4a, with the tempering temperature increasing up to 240 °C, the tensile strength decreased slightly and mainly stayed over 1700 MPa, while the yield strength increased sharply and reached a peak value at 1411 MPa. When the temperature was over 240 °C, the tensile strength and yield strength decreased gradually with the increase of temperature. The effect of tempering temperature on elongation was shown in Figure 4b. With the tempering temperature increasing, the elongation increased when the temperature was below 240 °C, then decreased when the temperature was over 240 °C. As the elongation changed slightly, the tempering process had a slight effect on it. The effect of tempering temperature on impact toughness (−20 °C) was shown in Figure 4c. As the tempering temperature increased up to 220 °C, the impact toughness increased dramatically, then increased slightly when the temperature increased from 220 °C to 260 °C. As the temperature increased from 260 °C to 350 °C, the impact toughness decreased sharply from 45.3 J/cm2 to 19.7 J/cm2. The impact toughness increased again when the tempering temperature was over 350 °C. Figure 4d shows the effect of tempering process on Brinell hardness. With the tempering temperature increase, the Brinell hardness decreased slightly when the temperature was below 240 °C, and decreased sharply when the temperature increased up to 280 °C. As the temperature increased from 280 °C to 300 °C, a slight increase was detected. When the temperature was over 300 °C, the hardness decreased constantly with the tempering temperature increasing.
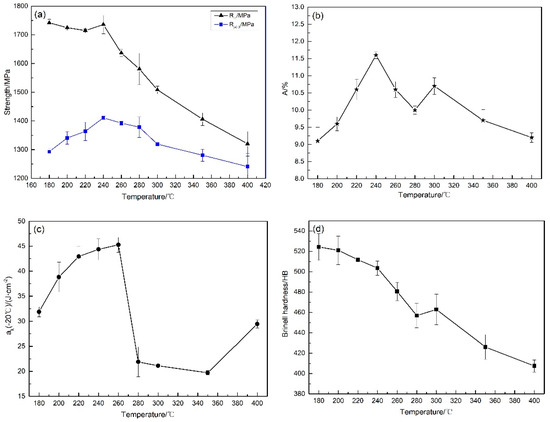
Figure 4.
Mechanical properties of the test steels tempered at different temperatures: (a) tensile strength (Rm) and yield strength (Rp0.2); (b) elongation (A); (c) impact toughness (−20 °C); (d) Brinell hardness.
Figure 5 presents the fracture morphologies of the steels tempered at 200, 260, 300, and 400 °C. As shown in Figure 5a, the dimples distributed uniformly on the fracture and some tear ridges can be seen clearly. With tempering temperature increasing, the fraction of dimples decreased, and the quasi-cleavage fracture morphologies were observed (seen in Figure 5b). As the temperature increased up to 300 °C, the dimples almost disappeared and were replaced by facets, microvoids and tear ridges (seen in Figure 5c). When the temperature was over 400 °C, the ratio of dimples increased, again, with the temperature increase.
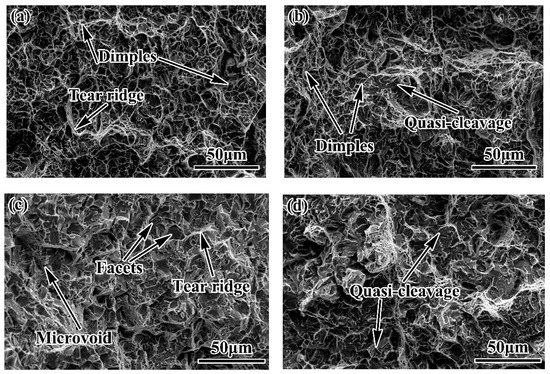
Figure 5.
Fracture morphologies of the test steels tempered at different temperatures: (a) 200 °C; (b) 260 °C; (c) 300 °C; (d) 400 °C.
3.3. Wear Resistance
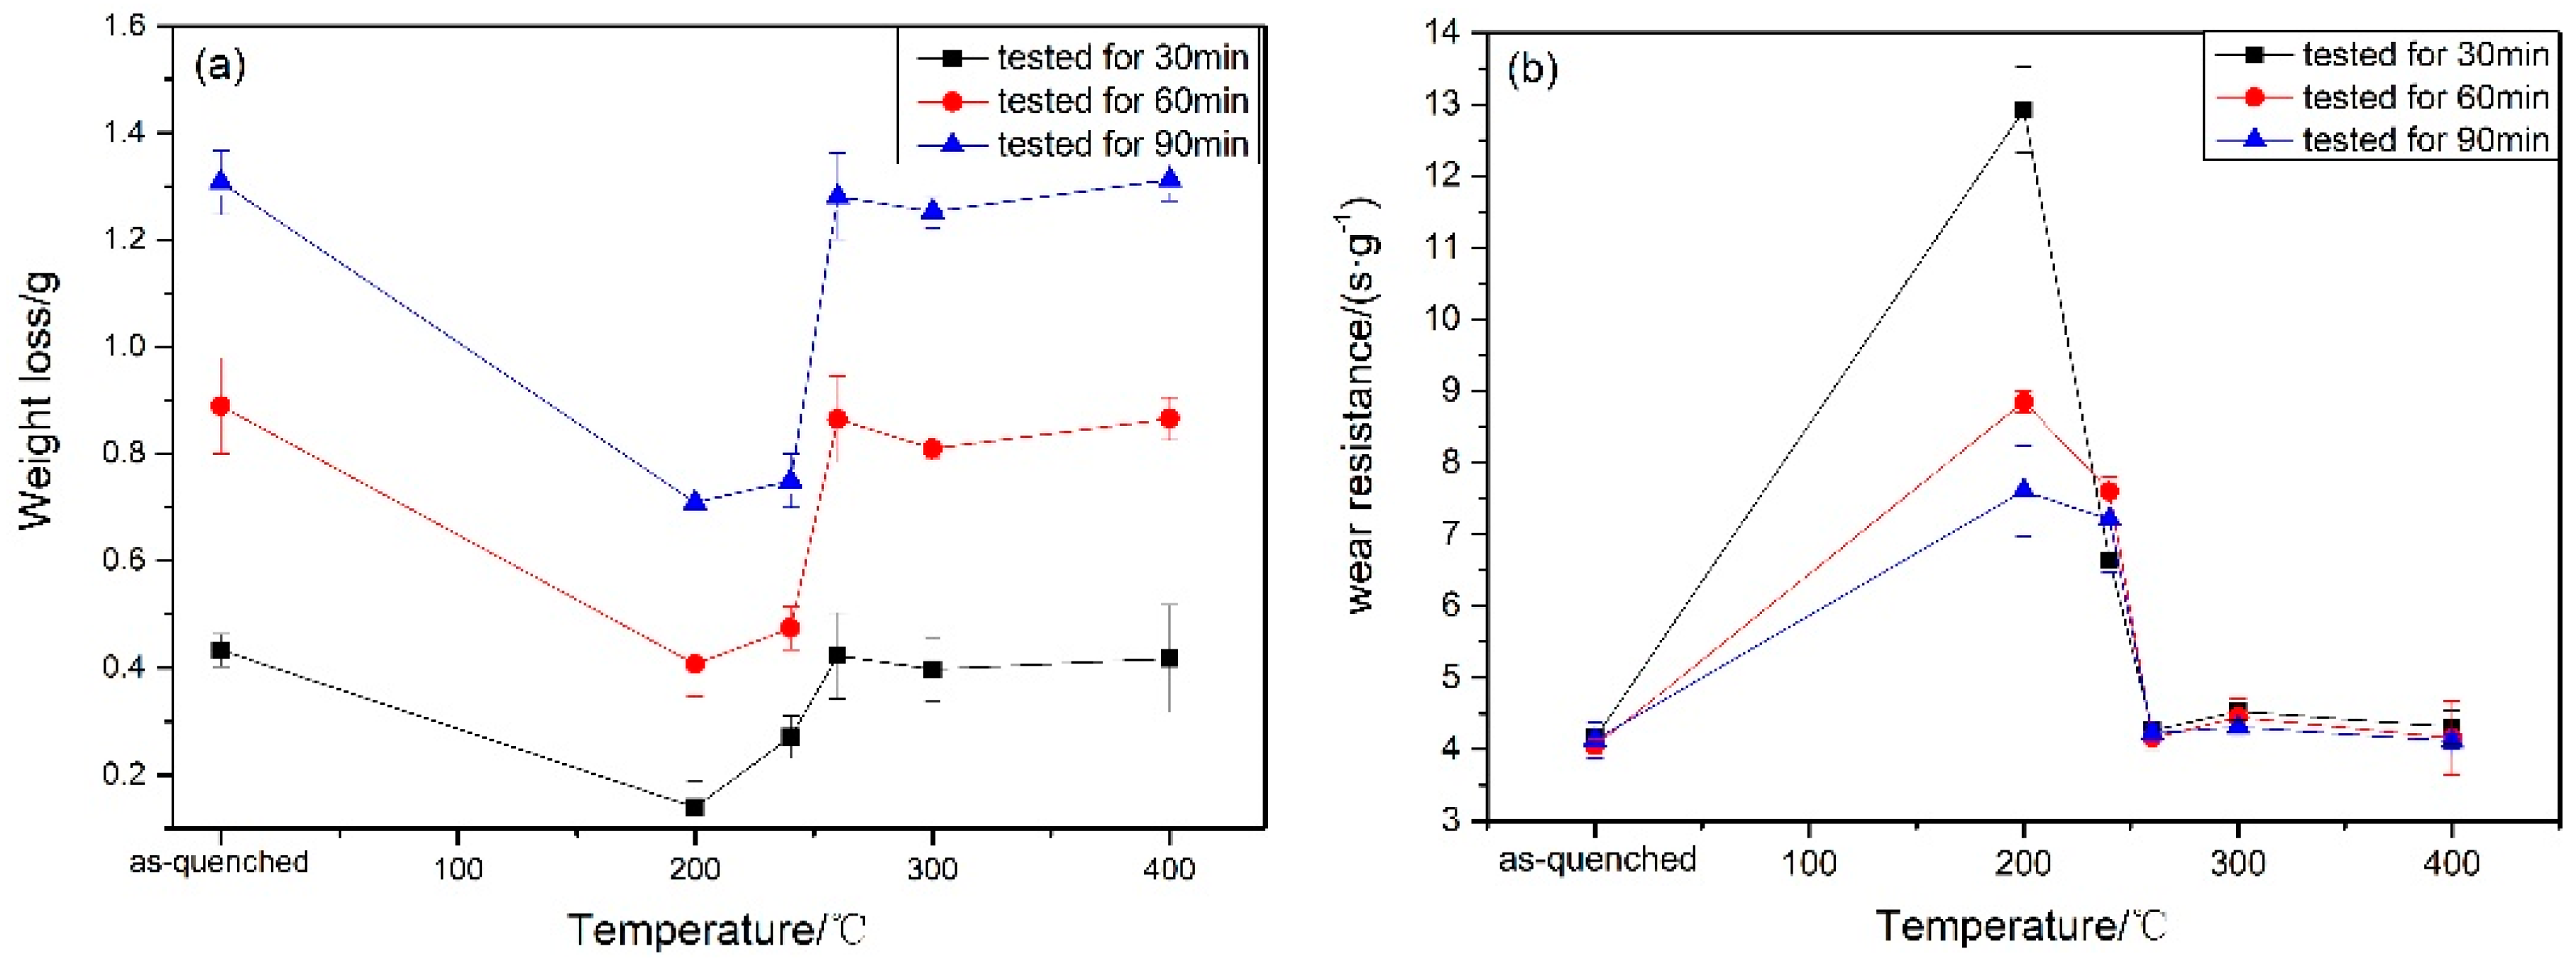
The weight loss and wear resistance of the steels tempered at different temperatures is shown in Figure 6. As presented in Figure 6a, the as-quenched steel lost the most mass in all the tested conditions. The weight loss increased with the increasing of tempering temperature from 200 °C to 260 °C. When the tempering temperature was over 260 °C, the weight loss remained stable. In all tested conditions, the weight loss showed a similar tendency and the least weight loss was obtained when the sample was tempered at 200 °C.
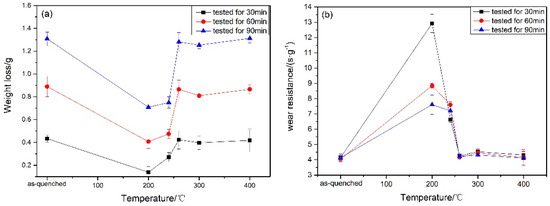
Figure 6.
Wear resistance of the test steels tempered at different temperatures: (a) weight loss; (b) wear resistance.
The wear resistance of the quenched steel and steels tempered at different temperatures is shown in Figure 6b. The best wear resistance was obtained when tempered at 200 °C for 30 min. The as-quenched steel possessed the worst wear resistance. The wear resistance increased sharply because of the tempering behavior. When the tempering temperature was over 200 °C, the wear resistance decreased dramatically, then changed slightly when the temperature was over 260 °C. As presented in Figure 6b, the wear resistance obtained a similar value at different wear times, except for the steels tempered at 200 °C and 240 °C. For the steel tempered at 200 °C, the best wear resistance was obtained when tested for 30 min. The wear resistance would decrease significantly with the wear time extending. However, a different tendency was obtained when tempered at 240 °C. The best wear resistance was obtained when tested for 60 min. The wear resistance increased first when the wear test lasted less than 60 min, and then decreased as the wear time was extended.
3.4. Wear Surfaces
Figure 7 shows the wear surfaces of the quenched steel and steels tempered at different temperatures. Similar wear surfaces consisting of scratches, embedded quartz sand particles, microcracks, delamination, and adhesive pits were obtained. However, small differences can be still observed between the wear-resistant steels. The reason for this could be the same wear test conditions and the similar chemical composition. As presented in Figure 7a,b, the scratches of random orientation were long, and the dispersedly distributed adhesive pits can be seen clearly and are encircled by white lines. The embedded quartz sand particles and some small delamination were also observed. With the tempering temperature increasing up to 240 °C, the ratio of adhesive pits increased. Meanwhile, the short and shallow scratches were distributed dispersedly (seen in Figure 7c). When the temperature increased from 240 °C to 260 °C, the depth of the scratches increased (seen in Figure 7d). As the tempering temperature was over 300 °C, the matrix hardness decreased significantly, which resulted in the formation of delamination, and the increase of adhesive pits is shown in Figure 7e. As the temperature increased up to 400 °C, the scratches were very short and the microcracks can be seen clearly in Figure 7f. Otherwise, the delamination can be easily seen on the wear surface.
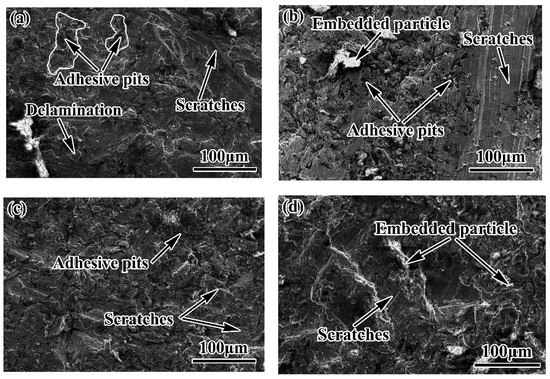
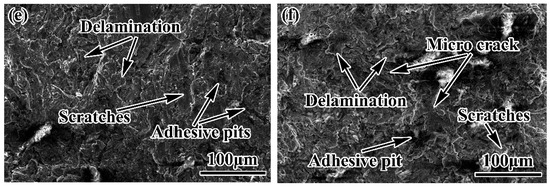
Figure 7.
Wear surfaces of the test steels tempered at different temperatures: (a) as-quenched; (b) 200 °C; (c) 240 °C; (d) 260 °C; (e) 300 °C; (f) 400 °C.
3.5. Wear Subsurface Layers
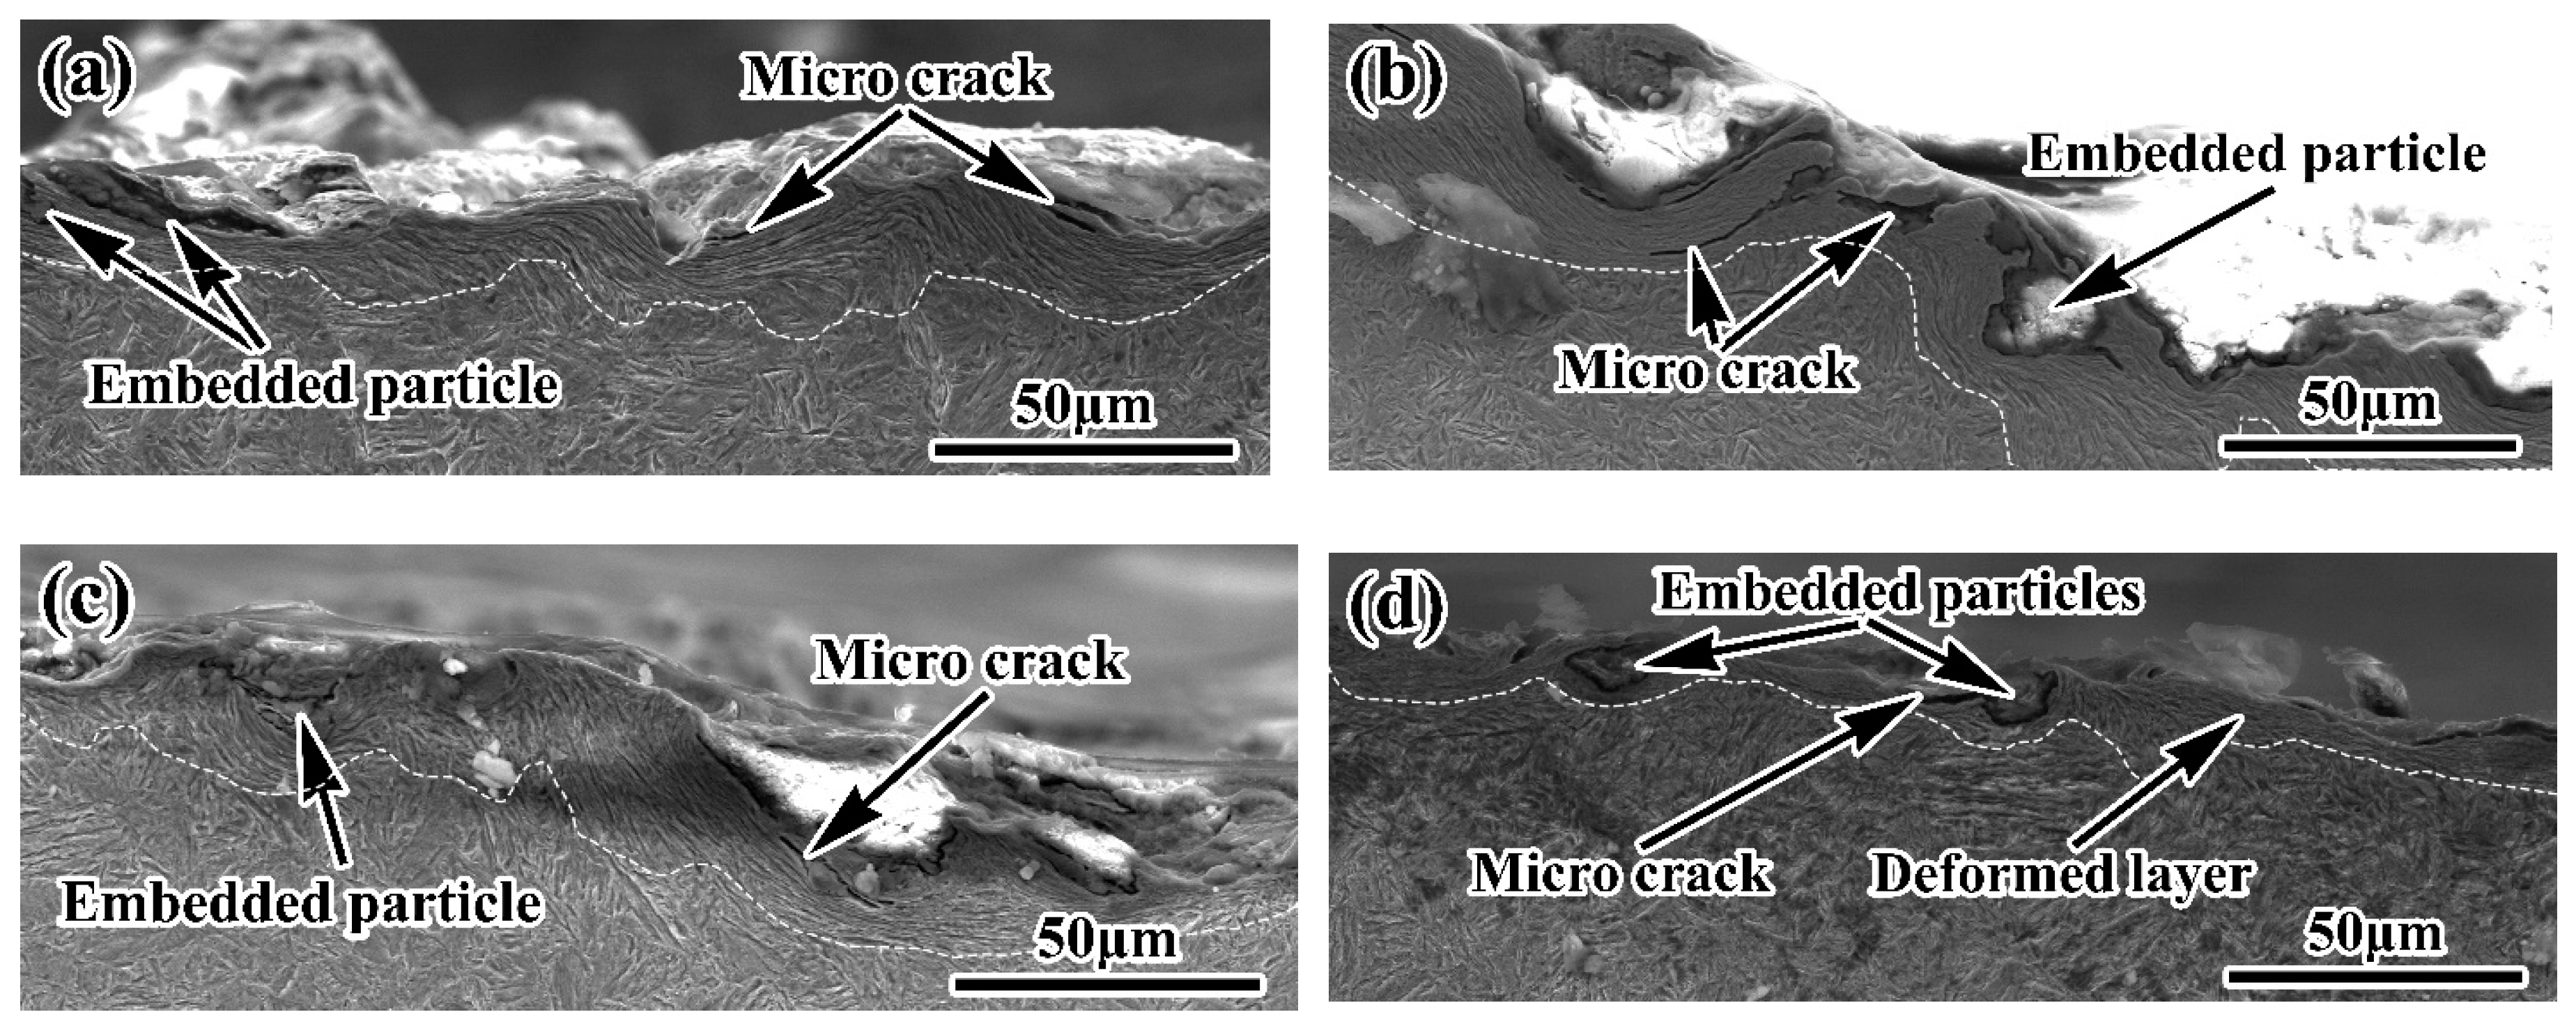
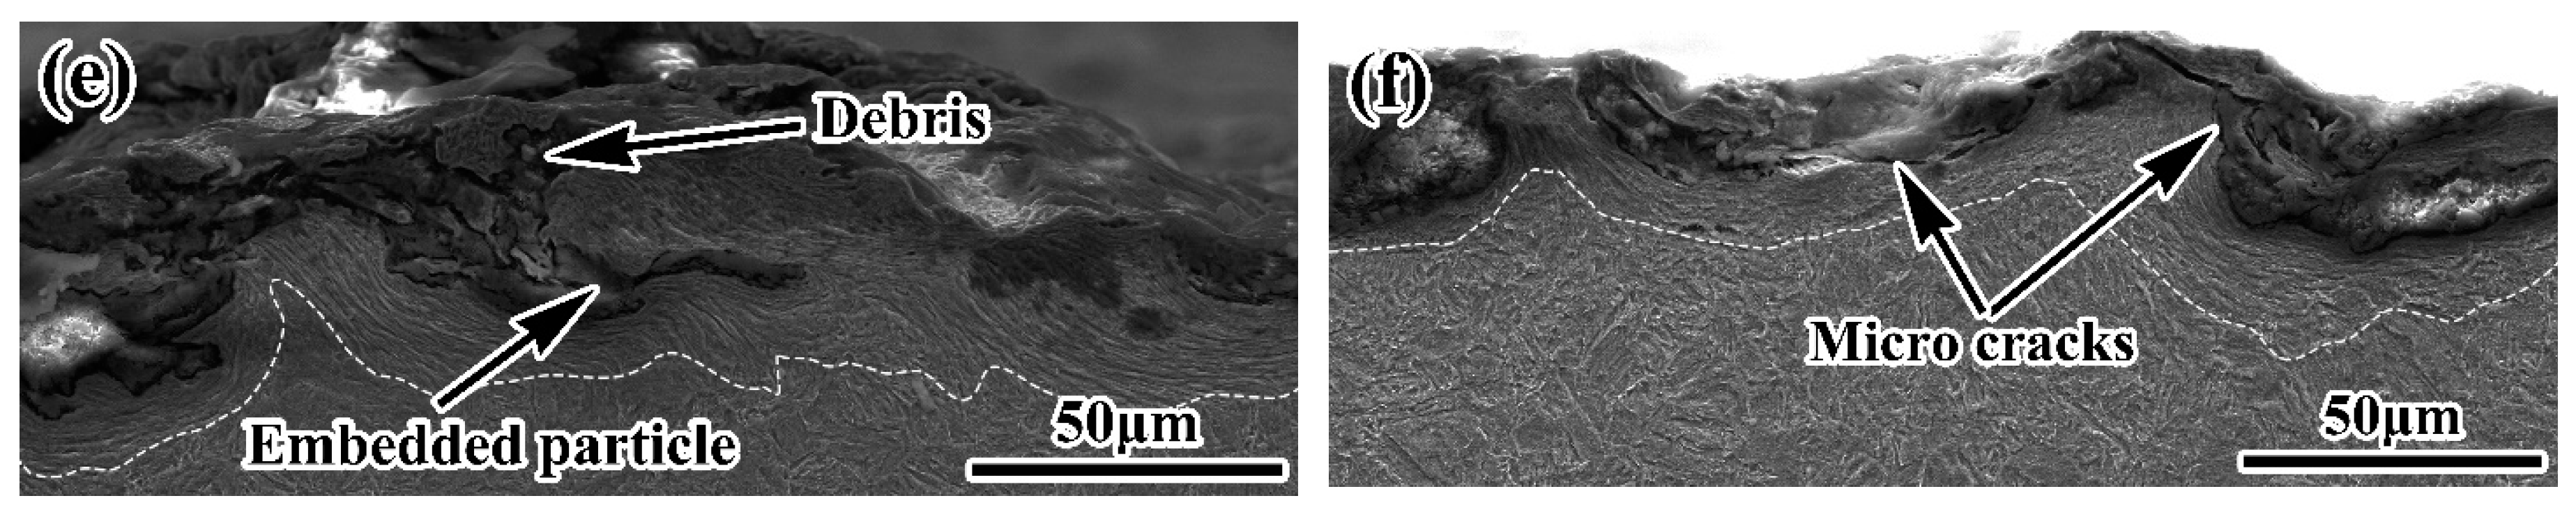
The wear behavior was further studied based on the wear subsurface layers of the quenched steel and steels tempered at different temperatures. In this wear test condition, quartz sand particles would embed in the matrix, and microcracks would form because of the intense and localized stress. As shown in Figure 8, similar subsurface layers were obtained with embedded quartz sand particles and microcracks distributed on them. However, some differences could still be found through the images. As shown in Figure 8a, weak hardenability was obtained because of the high hardness of the steel. The difference of the hardness between the deformation layers and matrix was small. Thus, the short microcracks formed and extended slowly. With the tempering temperature increasing, the hardness of the test steels decreased constantly, and the impact toughness increased first and then decreased. The softer the matrix was, the more easily the particles would be embedded within. The subsurface of the steel with the best wear resistance was shown in Figure 8b. Some particles would be wrapped in the deformed matrix, and other particles continued to cut the matrix as the wear time was extended. Figure 8e shows the typical cut behavior of the embedded particles. The lost matrix is shown in Figure 8e, circled using a white line. The particles embedded in the matrix because of the intense and localized stress. With the rolling of the lower specimen, the embedded particles would move and the microcracks would extend. As a result, part of the matrix was cut down. Similar behavior can also be observed in Figure 8f.
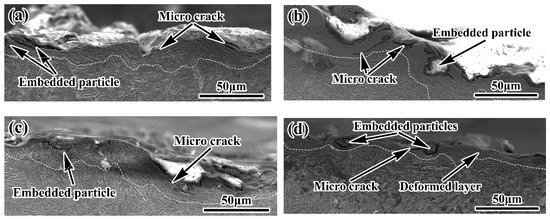
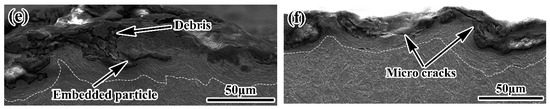
Figure 8.
The characteristics of wear subsurface layers of the test steels tempered at different temperatures: (a) as-quenched; (b) 200 °C; (c) 240 °C; (d) 260 °C; (e) 300 °C; (f) 400 °C.
4. Discussion
4.1. Microstructure and Mechanical Properties
Tempering is a significant process for steels to obtain optimal mechanical properties. Figure 2, Figure 3 and Figure 5 have shown the microstructure morphologies and fracture morphologies of the steels tempered at different temperatures. The different features between the images can explain the variation of mechanical properties [3,13]. When the steel is tempered at low temperatures, the diffusion velocity of carbon is slow. The decomposition of martensite depends on the separation and growth of carbides which can be seen in Figure 3b. When the tempering temperature is below 240 °C, the diffusion of carbon is inhibited. Otherwise, the effect of carbon content on hardness and the existence of twin martensite would lead to the stableness of hardness and tensile strength shown in Figure 3a [14,15]. As shown in Figure 3b, the carbide precipitations can hinder the movement of dislocation and make yield strength increase consequently. Otherwise, the impact toughness increases significantly because of the relieving of internal stress and activity of carbides [16]. When the tempering temperature is over 260 °C, the diffusion velocity of carbon increases, which can accelerate the decomposition of martensite and the separation of carbides [2]. A further decrease of carbon content in martensite makes the tensile strength and yield strength decrease constantly. However, the movement of dislocations is hindered, and the decreasing tendency of hardness slows down because of the interaction of carbides and dislocations [17]. As presented in Figure 4c, the impact toughness decreases sharply when the temperature increases from 260 °C to 280 °C. This significant reduction of impact toughness can be referred to as temper embrittlement, which can be confirmed by the variation of fracture morphologies [18]. Figure 5 shows the fracture morphologies of the steels tempered at different temperatures. As the tempering temperature increases from 260 °C to 300 °C, the ratio of quasi-cleavage fracture increases significantly. Meanwhile, the carbide precipitations along the grain boundaries would be the crack source. As a result, intergranular fracture occurs, and the impact toughness deteriorates [19]. Thus, the brittle temperature range is between 280 °C and 300 °C, which should be avoided when tempering.
4.2. Relationship between Mechanical Properties and Wear Resistance
The relationship between the mechanical properties and wear resistance of the steels is clarified in this study. The variation tendency of mechanical properties and wear resistance has been described in Section 3. As can be seen in Figure 4c,d, the as-quenched steel with the highest hardness and the lowest impact toughness possesses the worst wear resistance. The best wear resistance is obtained when steel is tempered at 200 °C. Many reports have pointed out sufficient toughness can improve the wear resistance significantly [3,4,6,7,15,17]. The steel tempered at 200 °C possesses the best wear resistance whose impact toughness increases distinctly up to 38 J/cm2. However, the increasing impact toughness does not make a constant increase in wear resistance. Hardness can reduce the penetration of particles and improve the wear resistance, thus, the steels with almost same hardness should have the familiar wear performance [17,20,21]. The relationship between mechanical properties and wear resistance shows that improvement in impact toughness would improve the wear resistance when sufficient surface hardness is obtained. As shown in Figure 8, similar hardenability is obtained when tempered at different temperatures. The surface hardness is the dominant influencing factor in this test condition.
As shown in Figure 6b, the best wear resistance is obtained when steel is tempered at 200 °C. With the wear time extending, the wear resistance of the steel tempered at 200 °C and 240 °C shows a different variation tendency. When tempered at 200 °C, the wear resistance decreases constantly, while the wear resistance increases first then decreases when tempered at 240 °C. Matrix hardness plays a dominant role initially during the wear test. As the test continues, the contact temperature increases constantly in the sliding conditions, which would lead to phase transformation and partial melting of matrix. Adhesive wear would be promoted. With the adhesive wear turning out to be the dominant wear mechanism, severe wear occurs, and the wear resistance of the steel decreases significantly [22,23]. The major difference between the steel tempered at 200 °C and 240 °C is the quantity of carbide precipitations. Carbide precipitations increase with tempering temperature increasing. When tempered at 240 °C, carbide precipitations interact with dislocations and hinder the movement of dislocations, which would help strengthen the matrix and improve the wear resistance [17]. With the wear time extending, the strengthening behavior of carbide precipitations decreased, resulting in the decrease of wear resistance [17,24].
As shown in Figure 4d and Figure 6b, the mechanical properties of the steel tempered at 260 °C are better than the steel tempered at 300 °C. With the tempering temperature increasing from 260 °C to 300 °C, more carbides separate out and they would help strength the matrix. While the strengthening behavior of carbides cannot offset the softened action of matrix [17]. As a result, the hardness of the steel decreases slightly. As discussed above, sufficient surface hardness plays a dominant role in improving the wear resistance. Thus, similar wear resistance is obtained when the tempering temperature increases from 260 °C to 300 °C.
4.3. Wear Mechanism
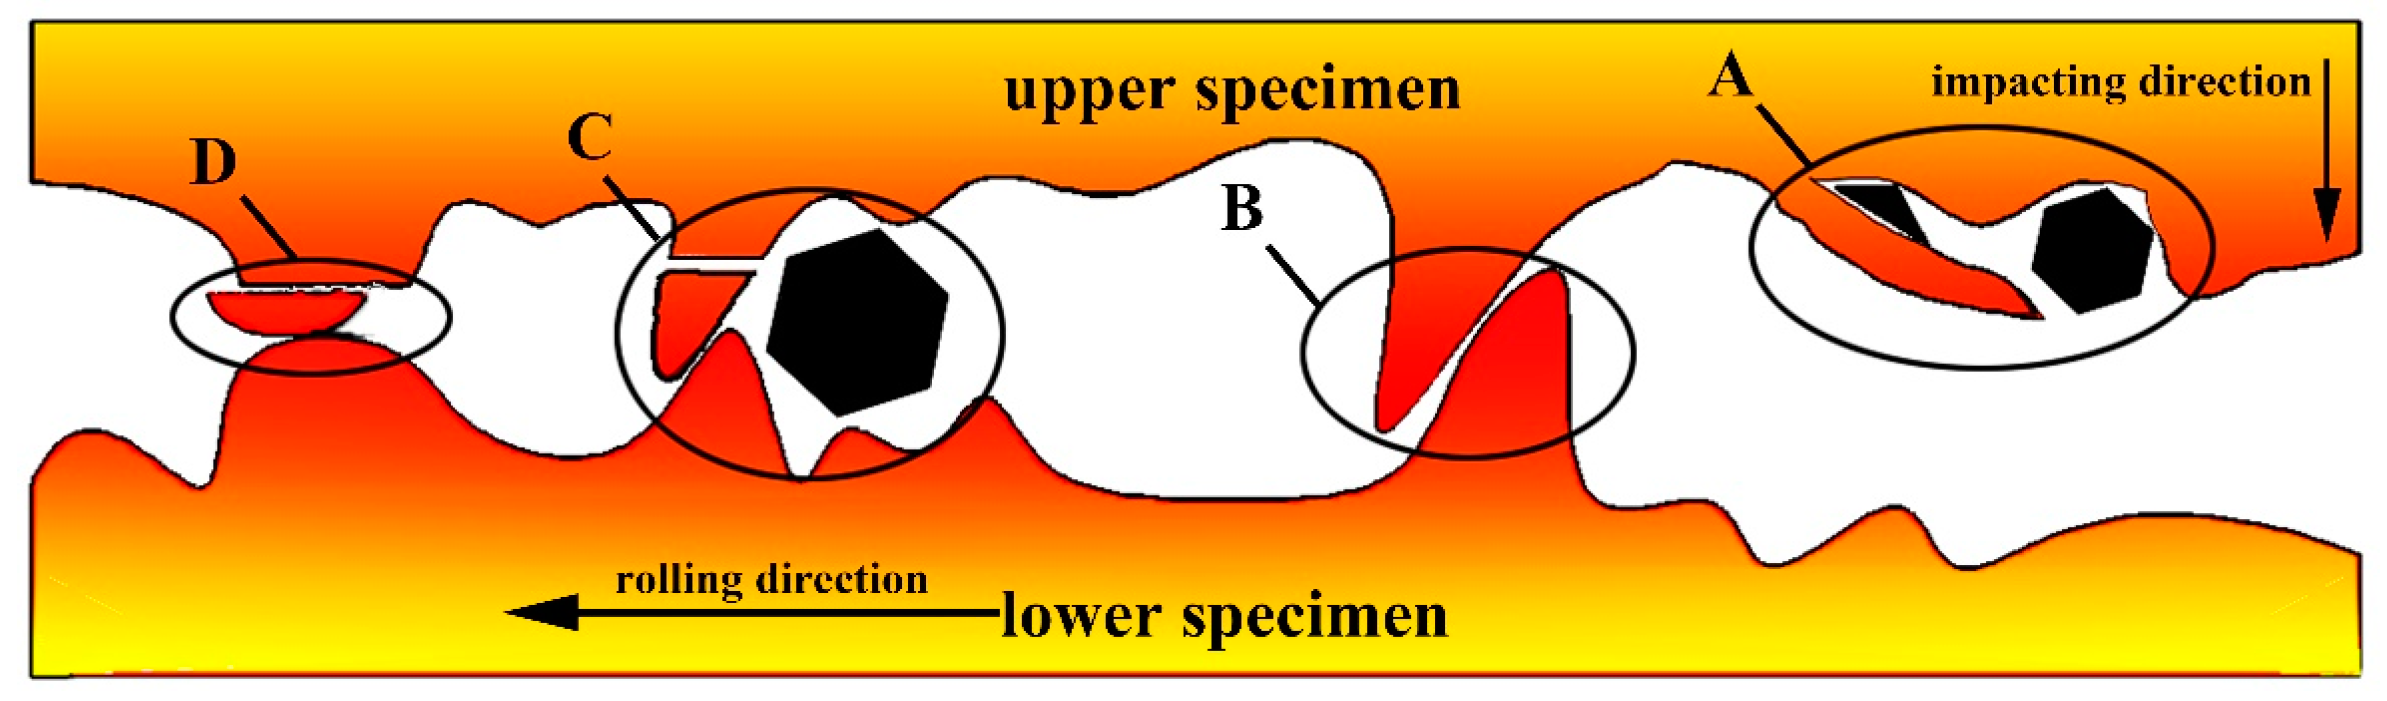
According to the description of the wear surfaces and subsurfaces, no clear difference was found. In order to describe the wear behavior more clearly, four main parts based on the wear surface morphologies were determined, which are shown in Figure 7 and Figure 8. The schematic illustration of the wear mechanisms is shown in Figure 9.

Figure 9.
Schematic illustration of the wear mechanism.
- (1)
- As shown in Figure 9 (part A) and (part C), some flowing quartz sand particles would embed in the matrix or be crushed because of the intense and localized stress. With the rolling of the lower specimen, some particles on the surface would slide along the rolling direction and leave scratches behind. Meanwhile, the embedded particles would cut down part of the matrix and the cracks formed because of the movement of the crushed particles. During this stage, the surface hardness of the matrix was considered to be the dominant factor which could hinder the embedding of the quartz sand particles and the ploughing of the particles on the surface [4,25].
- (2)
- With the periodical impact of the upper specimen, the surface of the steel was deformed. Delamination formed because of the contact of upper and lower specimens shown in Figure 9 (part B). Meanwhile, shallow deformation layers were obtained because of the high surface hardness and low impact toughness of the matrix, which could be observed in Figure 8. As the wear test continued, the dislocation piled up, resulting in the improvement of the surface hardness. Otherwise, the deformation layers would lead to a detrimental loss of toughness on the matrix surface, which might cause brittleness and be cut away, as shown in Figure 7e [26]. However, the cut-down burs would act as new abrasive particles which would mix with the crushed quartz sand particles and cause further wear.
- (3)
- As the wear test continued, the contact temperature of the wear surface would increase significantly. As shown in Figure 9 (part D), the matrix softened, and part of the embedded quartz sand particles would take away the matrix directly instead of sliding in the matrix. Moreover, the adhesive wear happened because of the welding of the upper specimen and lower specimen in the high temperature condition. During this period, the adhesive wear was considered to be the dominant wear mechanism which would lead to severe wear.
5. Conclusions
The microstructure evolution of the steel tempered at different temperatures was investigated and the effect of microstructure on mechanical properties was obtained. The effect of tempering behavior on wear resistance was analyzed and the wear process was explained. The research results will be better able to help companies accurately determine the tempering temperature during the production process and get the best matching between microstructure and wear resistance.
- (1)
- The microstructure after tempering mainly consists of tempered martensite and ferrite. With tempering temperature increasing, the carbide precipitations separated out constantly and were recognized as Fe3C. At temperatures over 260 °C, the tempered martensite transformed to tempered troosite. With the increasing of tempering temperature, the hardness decreased constantly. The impact toughness increased firstly, and then decreased sharply when the temperature was over 280 °C. According to the fracture morphologies, the amount of dimples decreased significantly when the temperature increased from 260 °C to 280 °C, which was confirmed to be temper embrittlement. The precipitation of Fe3C carbides along the grain boundaries was the main reason for temper embrittlement.
- (2)
- The best wear resistance was obtained when steel was tempered at 200 °C. With the wear time extending, the wear resistance of all specimens decreased constantly, except for the specimen tempered at 240 °C, whose best wear resistance was obtained when tested for 60 min. In this test condition, the hardness was considered to be the dominant factor that improved the wear resistance at the initiation of the wear test. Impact toughness would not effectively improve the wear resistance of the steels without a sufficient surface hardness.
- (3)
- In the initial wear test period, the abrasive wear was considered to be the dominant wear mechanism. The embedded and crushed quartz sand particles slid and cut the burs, leaving scratches and adhesions behind. With the wear time extending, the contact temperature increased significantly, and the adhesive wear turned to be the dominant wear mechanism which would result in severe wear.
Author Contributions
E.W. conceived and designed the experiments; E.W. performed the experiments; E.W. and R.S. analyzed the data; W.X. was responsible for language modification; E.W. wrote the paper.
Funding
This research received no external funding.
Conflicts of Interest
The authors declare no conflict of interest.
References
- Tylczak, J.H. Friction, lubrication, and wear technology. In Metal Handbook; American Society for Metals: Metals Park, OH, USA, 1992; Volume 18, p. 400. [Google Scholar]
- Speich, G.R.; Leslie, W.C. Tempering of steel. Metall. Trans. 1972, 3, 1043–1054. [Google Scholar] [CrossRef]
- Lindroos, M.; Ratia, V.; Apostol, M.; Valtonen, K.; Laukkanen, A.; Molnar, W.; Holmberg, K.; Kuokkala, V. The effect of impact conditions on the wear and deformation behavior of wear resistant steels. Wear 2015, 328–329, 197–205. [Google Scholar] [CrossRef]
- Singh, K.; Khatirkar, R.K.; Sapate, S.G. Microstructure evolution and abrasive wear behavior of D2 steel. Wear 2015, 328–329, 206–216. [Google Scholar] [CrossRef]
- Yi, C.; Wang, Z.D.; Kang, J.; Wu, D.; Wang, G.D. Effects of tempering temperature and Mo/Ni on microstructures and properties of lath martensitic wear-resistant steels. J. Iron Steel Res. Int. 2013, 20, 70–75. [Google Scholar]
- Ojala, N.; Valtonen, K.; Heino, V.; Kallio, M.; Aaltonen, J.; Siitonen, P.; Kuokkala, V. Effects of composition and microstructure on the abrasive wear performance of quenched wear resistant steels. Wear 2014, 317, 225–232. [Google Scholar] [CrossRef]
- Rendón, J.; Olsson, M. Abrasive wear resistance of some commercial abrasion resistant steels evaluated by laboratory test methods. Wear 2009, 267, 2055–2061. [Google Scholar] [CrossRef]
- Luo, Y.; Peng, J.; Wang, H.; Wu, X. Effect of tempering on microstructure and mechanical properties of a non-quenched bainitic steel. Mater. Sci. Eng. A-Struct. 2010, 527, 3433–3437. [Google Scholar] [CrossRef]
- Salemi, A.; Abdollah-Zadeh, A. The effect of tempering temperature on the mechanical properties and fracture morphology of a NiCrMoV steel. Mater. Charact. 2008, 59, 484–487. [Google Scholar] [CrossRef]
- Qin, B.; Wang, Z.Y.; Sun, Q.S. Effect of tempering temperature on properties of 00Cr16Ni5Mo stainless steel. Mater. Charact. 2008, 59, 1096–1100. [Google Scholar] [CrossRef]
- Hu, R.R.; Cai, Q.W.; Wu, H.B.; Tang, D. Heat treatment influence on the microstructure and mechanical properties of NM500 wear resistant steel. J. Univ. Sci. Technol. B 2013, 35, 1015–1020. [Google Scholar]
- Fu, H.; Xiao, Q.; Fu, H. Heat treatment of multi-element low alloy wear-resistant steel. Mater. Sci. Eng. A-Struct. 2005, 396, 206–212. [Google Scholar] [CrossRef]
- Shahram, K.; Hasan, S.; Jalal, H.; Mohammad, M. Effect of heat treatment on microstructure of modified cast AISI D3 cold work tool steel. J. Iron Steel Res. Int. 2010, 17, 40–45, 52. [Google Scholar]
- Grange, R.A.; Hribal, C.R.; Porter, L.F. Hardness of tempered martensite in carbon and low-alloy Steels. Metall. Trans. A 1977, 8A, 1775–1785. [Google Scholar] [CrossRef]
- Momeni, M.; Kheirandish, S.; Saghafian, H.; Hedjazi, J.; Momeni, M. Effects of heat treatment on mechanical properties of modified cast AISI D3 tool steel. Mater. Design. 2014, 54, 742–747. [Google Scholar] [CrossRef]
- Zhou, W.H.; Challa, V.S.A.; Guo, H.; Shang, C.J.; Misra, R.D.K. Structure–mechanical property relationship in a low carbon Nb–Cu microalloyed steel processed through a three-step heat treatment: The effect of tempering process. Mater. Sci. Eng. A-Struct. 2015, 620, 454–462. [Google Scholar] [CrossRef]
- Hernandez, S.; Leiro, A.; Ripoll, M.R.; Vuorinen, E.; Sundin, K.; Prakash, B. High temperature three-body abrasive wear of 0.25C 1.42Si steel with carbide free bainitic (CFB) and martensitic microstructures. Wear 2016, 360–361, 21–28. [Google Scholar] [CrossRef]
- Chakraborty, G.; Das, C.R.; Albert, S.K.; Bhaduri, A.K.; Paul, V.T.; Panneerselvam, G.; Dasgupta, A. Study on tempering behaviour of AISI 410 stainless steel. Mater. Charact. 2015, 100, 81–87. [Google Scholar] [CrossRef]
- Mishra, B.; Kumbhar, K.; Kumar, K.S.; Prasad, K.S.; Srinivas, M. Effect of copper addition on microstructure and mechanical properties of ultra high strength NiSiCrCoMo steel. Mater. Sci. Eng. A-Struct. 2016, 651, 177–183. [Google Scholar] [CrossRef]
- Zambrano, O.A.; Coronado, J.J.; Rodríguez, S.A. Tempering temperature effect on sliding wear at high temperatures in mottled cast iron. Tribol. Lett. 2015, 57, 1–11. [Google Scholar] [CrossRef]
- Jha, A.K.; Prasad, B.K.; Modi, O.P.; Das, S.; Yegneswaran, A.H. Correlating microstructural features and mechanical properties with abrasion resistance of a high strength low alloy steel. Wear 2003, 254, 120–128. [Google Scholar] [CrossRef]
- Kennedy, F.E.; Lu, Y.; Baker, I. Contact temperatures and their influence on wear during pin-on-disk tribotesting. Tribol. Int. 2015, 82, 534–542. [Google Scholar] [CrossRef]
- Zhao, G.; Hussainova, I.; Antonov, M.; Wang, Q.; Wang, T.; Yung, D. Effect of temperature on sliding and erosive wear of fiber reinforced polyimide hybrids. Tribol. Int. 2015, 82, 525–533. [Google Scholar] [CrossRef]
- Cheng, X.Y.; Zhang, H.X.; Li, H.; Shen, H.P. Effect of tempering temperature on the microstructure and mechanical properties in mooring chain steel. Mater. Sci. Eng. A-Struct. 2015, 636, 164–171. [Google Scholar] [CrossRef]
- Xu, X.; van der Zwaag, S.; Xu, W. Prediction of the abrasion resistance of construction steels on the basis of the subsurface deformation layer in a multi-pass dual-indenter scratch test. Wear 2015, 338–339, 47–53. [Google Scholar] [CrossRef]
- Ojala, N.; Valtonen, K.; Antikainen, A.; Kemppainen, A.; Minkkinen, J.; Oja, O.; Kuokkala, V. Wear performance of quenched wear resistant steels in abrasive slurry erosion. Wear 2016, 354–355, 21–31. [Google Scholar] [CrossRef]


© 2019 by the authors. Licensee MDPI, Basel, Switzerland. This article is an open access article distributed under the terms and conditions of the Creative Commons Attribution (CC BY) license (http://creativecommons.org/licenses/by/4.0/).