Article

A New Experimental and Numerical Framework for Determining of Revised J-C Failure Parameters

1
School of Aeronautics, Northwestern Polytechnical University, Xi’an 710072, China
2
Shaanxi Key Laboratory of Impact Dynamics and Engineering Application (IDEA), Northwestern Polytechnical University, Xi’an 710072, China
*
Author to whom correspondence should be addressed.
Metals 2018, 8(6), 396; https://doi.org/10.3390/met8060396
Submission received: 23 April 2018 / Revised: 15 May 2018 / Accepted: 27 May 2018 / Published: 30 May 2018

Abstract

:
Since damage evolutions of materials play important roles in simulations, such as ballistic impacts and collisions, a new experimental and numerical method is established to determine the revised Johnson–Cook (JC) failure parameters of a 2618 aluminum alloy and a Ti-6Al-4V titanium alloy. Not only the strain distributions, but also the stress triaxialities of designed specimens with different notches, are analyzed and revised using the finite element (FE) model. Results show that the largest strain concentrated on the surface of the circumferential area where the initial damage happened, which coincided with the practical damage evolution in the FE model. The complete damage strain, which denoted the largest strain before fracture calculated by the picture, is put forward to replace the traditional failure strain. Consequently, the digital image correlation (DIC) method and the micro speckle are carried out to measure the complete strain from the circumferential area. In addition, the relationships between the complete damage strain, the revised stress triaxiality, the strain rate and the temperature are established by conducting the quasi-static and dynamic experiments under different temperatures. Finally, the simulations for the ballistic impact tests are conducted to validate the accuracy of the parameters of the revised JC damage model.

1. Introduction

Designing a containment structure for a fan blade is important for aero-engines to improve safety and reliability, even when it is really an expensive and time-consuming process. As the full-scale conventional containment test costs millions of dollars, it always follows relatively inexpensive simulations. These simulations can be used to predict effects of many factors on ballistic performances and failure modes of advanced aero-engine alloys, and also contribute to design and optimization of containment systems. The dynamic mechanical properties of materials under high strain rates can be described through a relationship between a flow stress and strain, a strain rate, a temperature, and a deformation history, known as a constitutive relationship or a constitutive model. The constitutive models have become the core factors, which can significantly influence efficiency and accuracy of simulations [1,2]. In addition, recent reports indicated that ductile fracture was a complicated process, which was influenced by strain rate, temperature, deformation history, stress triaxiality and microstructure of a material [3,4,5]. As the same as the constitutive model, the damage evolutions of materials also play important roles in some simulations, such as ballistic impacts and collisions.
Theoretically, deformation of metal materials during an impact process is not merely the compression, tension or torsion, but composed of at least two kinds of deformation modes [6]. Consequently, stress states at different locations of a material always tend to be different. Actually, damage modes of a material with different loading histories are complex, thus making the investigation on the effect of stress state or stress triaxiality on damage evolution becomes necessary and valuable [7,8].
The efforts to investigate the performance of ductile fracture were started in the 1970s. It caps more than 40 years of widespread concerns with the influence of stress triaxiality on ductile fracture [9,10,11]. Bridgman reported hydrostatic stress could influence failure of materials, and stress triaxiality was represented as a result of the effect of hydrostatic stress [12]. Fouad et al. carried out some tests on metals and put forward that the failure strain changed with the variation of stress triaxiality [13,14,15]. Khan et al. presented a three-dimensional progressive failure analysis (PFA) of laminated composite structures, and failure of an isotopic-type material under hydrostatic failure was modeled from an analytical and finite element stand [16]. In addition, the relation between the failure strain and the stress triaxiality is not linear or monotonic. Researches also indicated that the stress triaxiality can be used to distinguish the fracture mechanism of metals. Since the development of constitutive models, many researchers have put forward that the failure strain can be influenced not only by the stress triaxiality but also by other factors, such as strain rate and temperature [17,18]. Johnson and Cook developed a special failure criterion to characterize the damage in the JC constitutive model, which was already widely used in research and engineering, and the damage was derived from the following cumulative damage law [19]:
D = Δ ε ε f
where Δ ε is an increment of an effective plastic strain during an increment in loading, and D is a damage parameter. D = 0 is assumed to be the initial status, and failure is then allowed to occur when D = 1. A failure strain considers stress triaxiality, strain rate and temperature, which can be defined as:
ε f = [ D 1 + D 2 exp ( D 3 σ * ) ] [ 1 + D 4 I n ε * ] [ 1 + D 5 T * ]
where σ * denote the mean stress normalized by the effective stress which is often referred to as stress triaxiality, and ε * is the normalized effective plastic strain rate. The parameters (i.e., D1, D2, D3, D4, and D5) are fracture constants of a material. Both the failure strain and the accumulation of damage are functions of stress triaxiality, strain rate, and temperature. Failed elements are then removed from the FE model with an element erosion algorithm. Research by Kim and Tvergaard also indicated that a microscopic mechanism of ductile failure was influenced by stress triaxiality [20,21]. As is known, nucleation, growth and coalescence of micro-voids can be considered as the mechanism of the ductile fracture of metals from the micro mechanical point of view. Researches by Anderson et al. pointed out that the growth of voids might be directly affected by the stress triaxiality and put forward that the occurrence of ductile fracture could be determined by the stress triaxiality, which was common in compressive and tensile tests for metals with good plasticity [22]. Researches on ductile fracture and failure models have been conducted for a long time; however, few investigations take an accurate method into account to obtain failure parameters. Specifically, there were few reports on measurement of failure strains. In addition, there is no close connection with the measurement of the failure strain when the stress triaxialities are revised.
In the present work, a new experimental and numerical method was established to determine the revised JC failure parameters of a 2618 aluminum alloy and a Ti-6Al-4V titanium alloy. A series of specimens were designed, and strain distributions of the designed specimens were analyzed by using the FE model. Loading speeds and stress triaxialities of the samples with different notches were also revised by using the FE model to ensure the same strain rate. The digital image correlation (DIC) method and the micro speckle were conducted to measure a strain field since the simulation results clearly indicated that the largest strain concentrated on surface of the circumferential area. The largest strain from the strain field before fracture calculated by the picture was considered as the complete strain, which was used to replace the failure strain. In addition, the relationships between the complete damage strain, the revised stress triaxiality, the strain rate and the temperature were established by carrying out the quasi-static and dynamic experiments under different temperatures. Finally, by using the parameters of the revised JC damage model, the simulations for the ballistic impact tests were conducted to validate the accuracy of parameters.

2. Materials and Testing Specimens

2.1. Materials

The 2618 aluminum alloy was provided by AECC Commercial Aircraft Engine Co., LTD (Shanghai, China). Ti-6Al-4V titanium projectiles, which were used for the ballistic impact tests, were purchased from Western Superconducting Technologies Co., Ltd. (Xi’an, China). A series of mechanical tests for the 2618 aluminum alloy and the Ti-6Al-4V titanium alloy were conducted to estimate the uniformity and the stability of the materials, and results showed the flow stresses and the fracture strain of the specimens taken from three directions were almost identical, thus proving the 2618 aluminum alloy and the Ti-6Al-4V titanium alloy were isotropic.

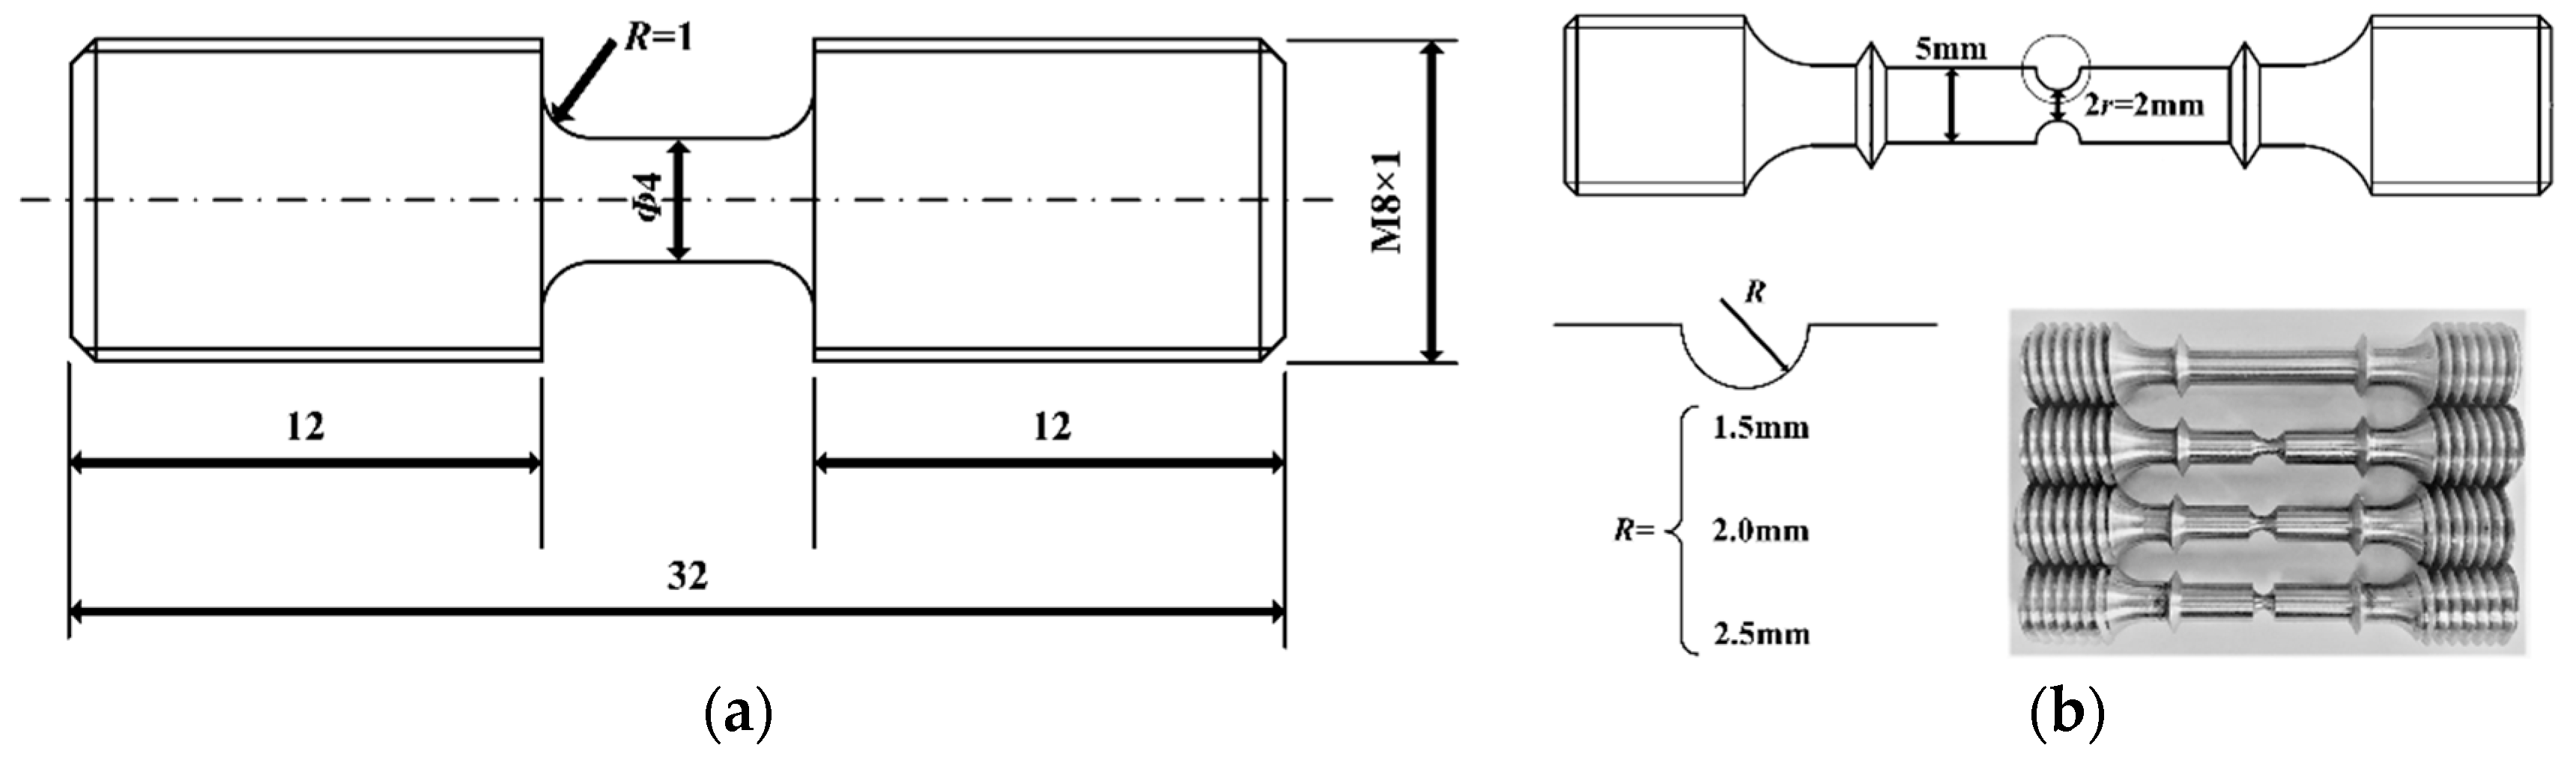
2.2. Specimens for the JC Constitutive and Damage Model

Smooth cylinder specimens with dimensions of Φ5 × 5 mm were used to characterize both quasi-static and dynamic compressive elastic–plastic behaviors of the 2618 aluminum alloy and the Ti-6Al-4V titanium alloy. Furthermore, the quasi-static specimens with a diameter of 5 mm and the smaller dynamic specimens with a diameter of 4 mm (as shown in Figure 1a) were used to obtain not only the tensile elastic–plastic behavior but also the damage characteristics. In addition, the cylinder specimens with different notch radii and pure torsion specimens were employed to determine the fracture behaviors under different stress triaxialities. Figure 1b shows the specimens with different notch radii for quasi-static tensile experiments, where r is the radius of the minimum cross section, and R is the radius of the circumferential notch. The pure torsion specimens were designed based on the Chinese standard GB/T228-2002.

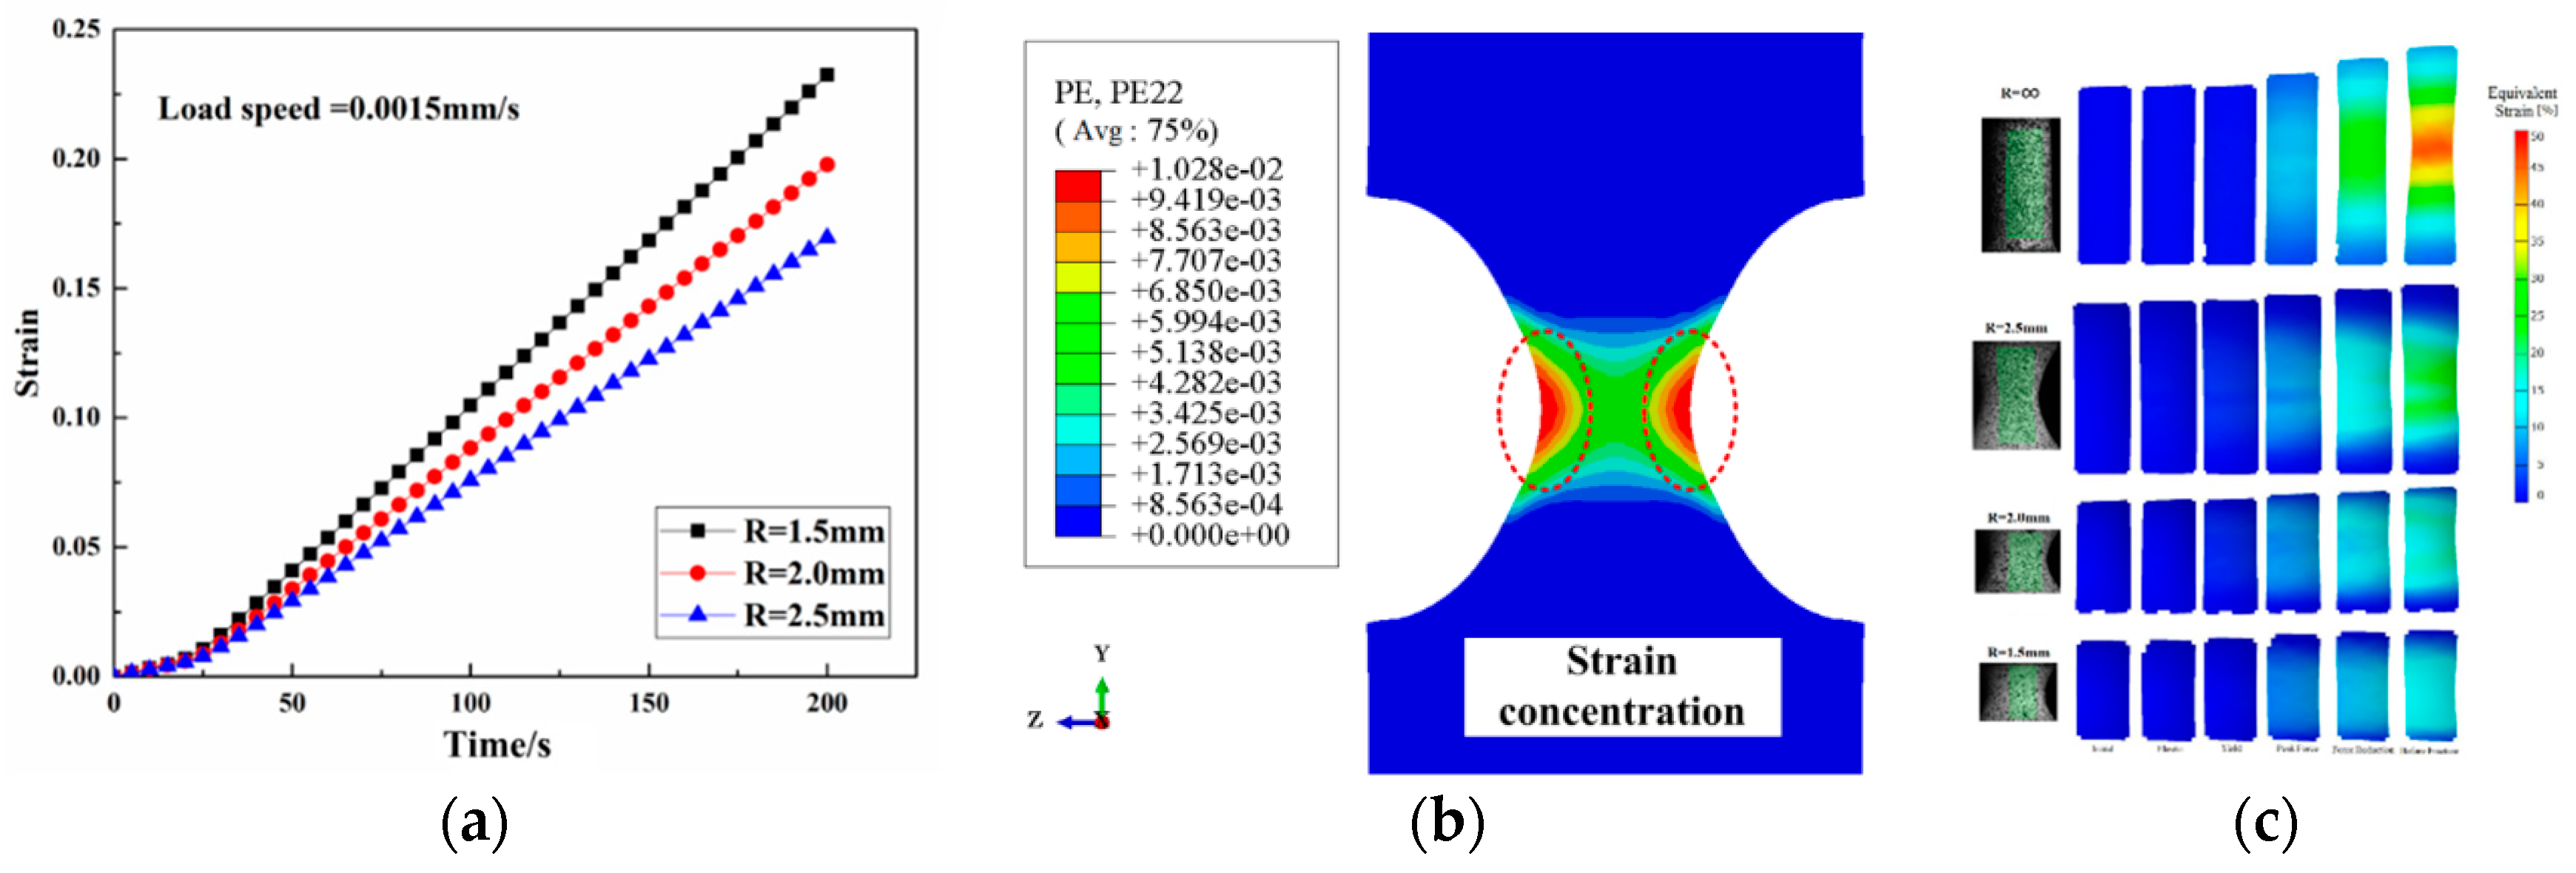
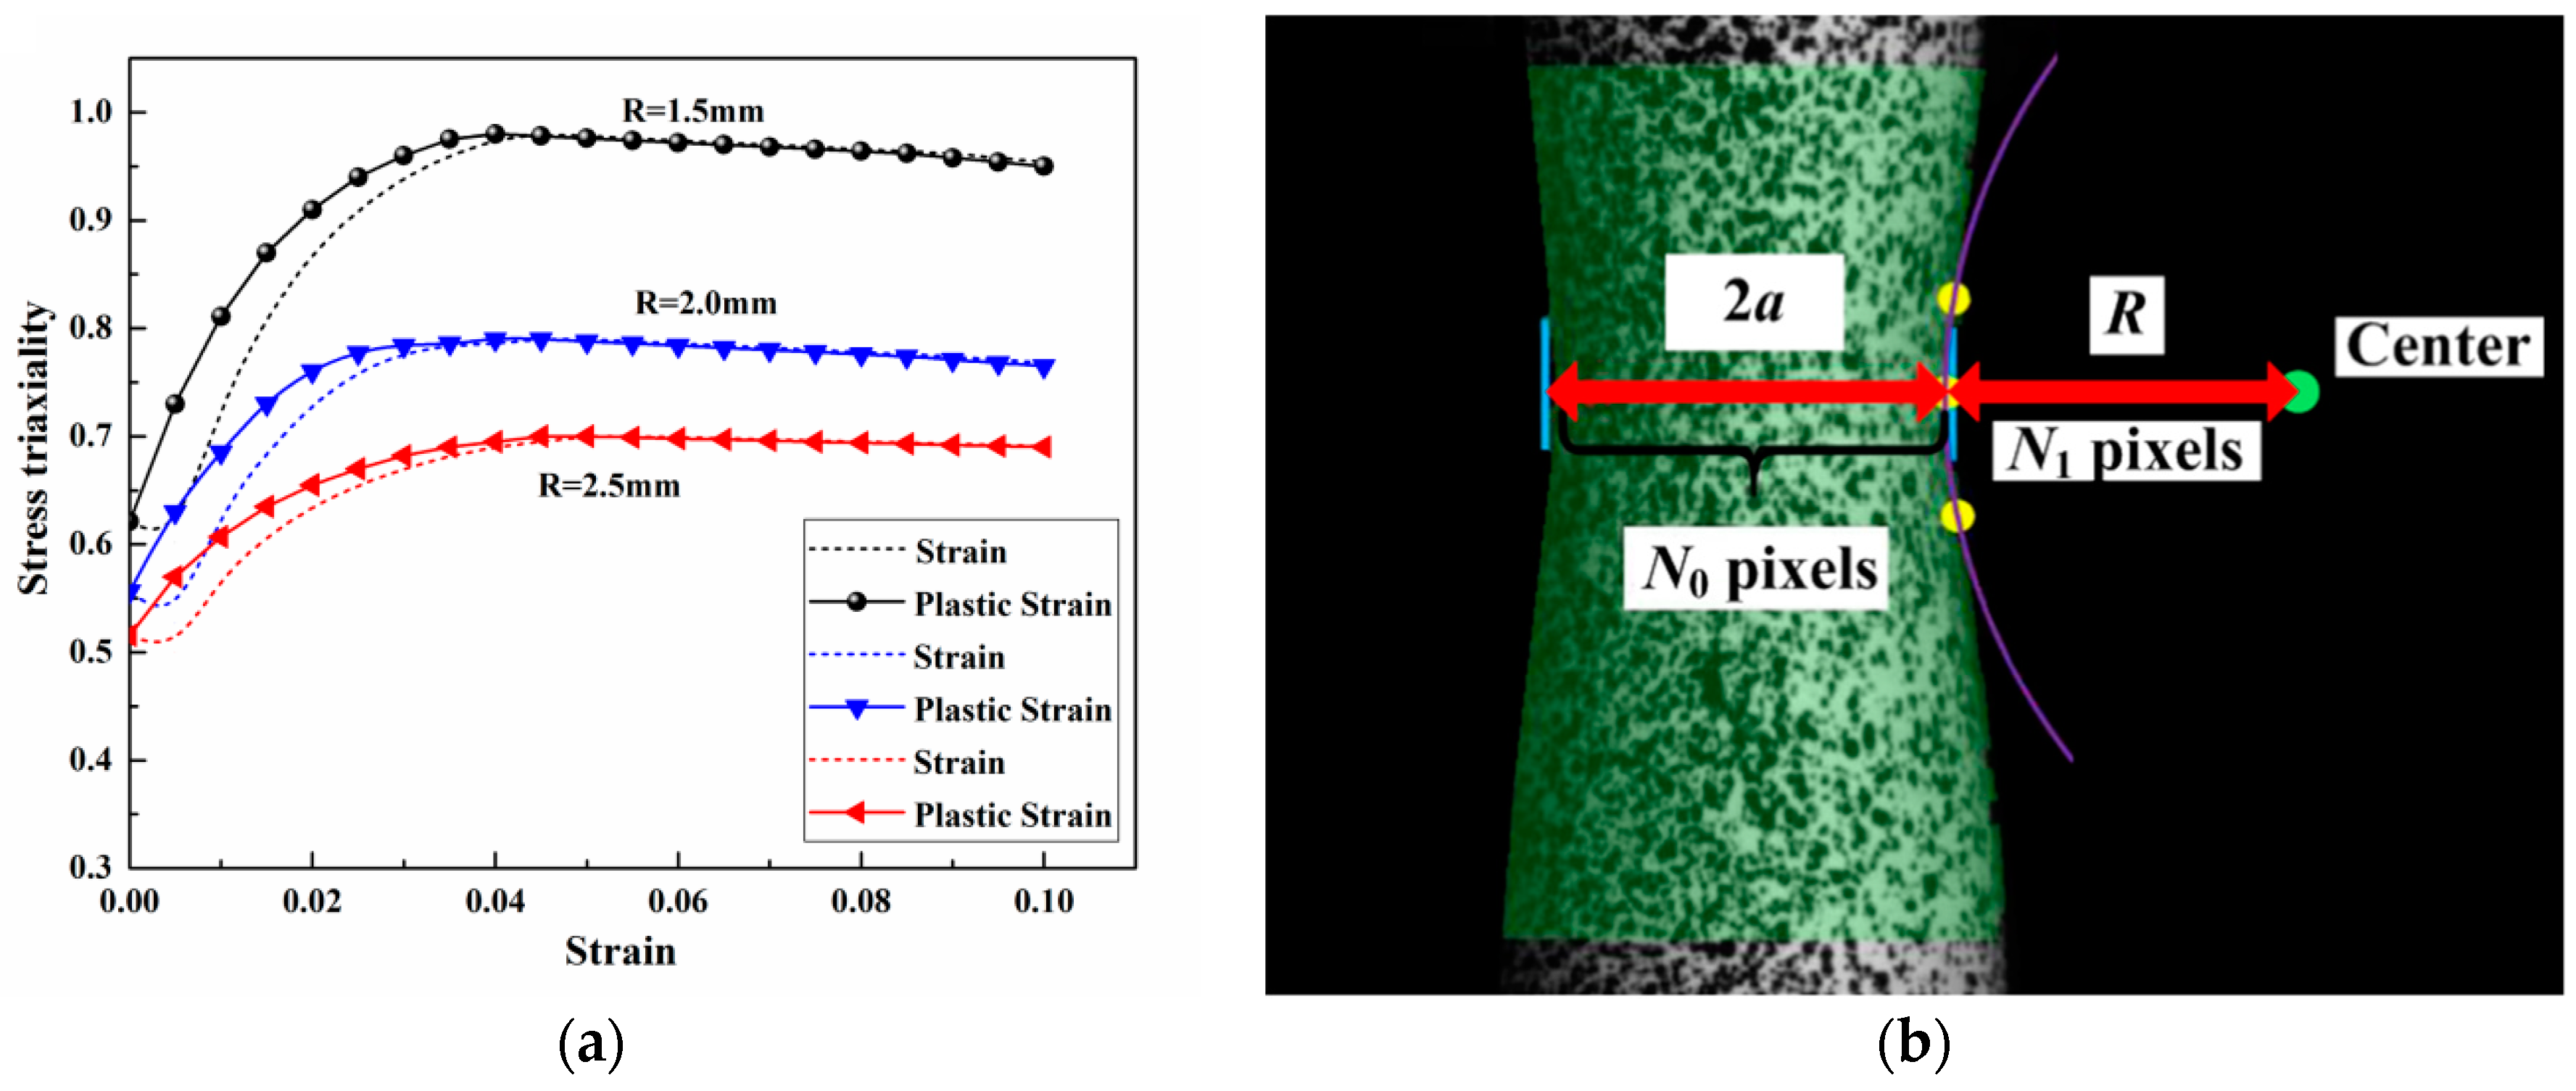
3. Determination of JC Failure Parameters

Quasi-static compressive experiments and tensile experiments were performed using the DNS-100 electronic universal testing machine, which had a maximum load capacity of 10 kN, and the quasi-static torsion experiments were carried out by using an electronic torsion testing machine. In addition, the high strain rate experiments were conducted under different strain rates by employing the split Hopkinson bar. The strain, the stress and the strain rate of the specimen can be calculated based on the one-dimensional elastic-stress wave theory [23], which can be shown as:
σ s = E ( A A s ) ε t
ε s = 2 C 0 l s 0 t ε R d τ
ε ˙ s = 2 C 0 l s ε R
where ε R and ε T are the reflected and transmitted strains which can be measured by the strain gages stuck on the input and output bars, respectively; C0 is the velocity of a longitudinal elastic wave; E is the Young’s modulus and A is the cross-sectional area of the loading bars; ls and As are the length and the cross-sectional area of the specimen, respectively; and σ s is the engineering stress and ε s is the engineering strain.
Theoretically, the variations of strain at the circumferential area were not the same when we applied the same loading speed, as shown in Figure 2a. Thus, a corresponding FE model combining the DIC method was performed to determine the loading speed for each kind of specimen, which was supported to avoid the strain rate effect. In detail, the FE model was established by using the JC constitutive parameters, which were obtained from the experiments, and the strain rates were calculated by using the maximum strain-to-time ratio. For the DIC method, the maximum strain in the strain-field-to-time ratio was regarded as the strain rate of specimens with notches. The strain levels were kept the same to make the calculation easier, as shown in the Figure 2c. Moreover, 72 images were captured per second by a high-speed camera, and the calculation process chose one image every 24 images. The strain rate of the quasi-static experiment was set as 10−3/s, so the loading speeds of specimens with cross sections of 1.5 mm, 2.0 mm and 2.5 mm notch were set as 0.00135 mm/s, 0.0015 mm/s and 0.0017 mm/s, respectively.
In general, the equivalent failure strain is calculated by [12]:
ε f = 2 ln ( d 0 d )
where d0 and d denote the initial and final diameters of specimens. However, the deformation of the notch area was complicated. Thus, the accuracy of the equivalent failure strain was always influenced by many factors, such as necking and uncertainty in the measure. The strain distribution of specimens with 1.5 mm notch in the tensile tests was illustrated by using the FE model, as shown in Figure 2b. The simulation results clearly indicated that the largest strain concentrated on the surface of the circumferential area. Therefore, the equivalent failure strain was revised by introducing the complete damage strain, which was defined as the maximum strain on the surface before the fracture.
Furthermore, the Bridgman method to determine the stress triaxialities was also revised, caused by the fact that the stress triaxiality was not constant during the tensile deformation. Consequently, the FE models were also established to revise the stress triaxialities. Figure 3a sketches the relationships between the stress triaxiality and the strain for three kinds of specimen. As is shown, the initial stress triaxialities in the FE model were the same as the stress triaxialities calculated by the Bridgman equation, and each of the stress triaxialities increased to a stable value accompanied with the plastic deformation. The stress triaxialities of the tensile specimens with notches can be revised by replacing the Bridgman’s results with the stable stress triaxialities calculated by FE model. In addition, the stress triaxiality of the smooth specimen was revised by considering the stress triaxiality before fracture, as shown in Figure 3b. Results from the tensile experiments showed the increase of stress triaxiality was almost uniform after the necking happened. Thus, the revised stress triaxiality can be calculated by:
σ * = 1 3 + 1 2 ln ( 1 + a 2 R ) ( t 2 t 1 t 2 )
where t1 is the time spent when the necking starts, and t2 is the time spent when the fracture happens. By calculating the pixels, Equation (7) can be replaced with:
σ * = 1 3 + 1 2 ln ( 1 + N 0 4 N 1 ) ( t 2 t 1 t 2 )
Finally, the JC damage model was revised by establishing the relationships between the complete damage strain, the revised stress triaxiality, the strain rate and the temperature.
As mentioned above, the maximum strain concentrated on the surface of the circumferential area. Therefore, the DIC method was applied to measure the strain field during experiments, and the maximum strain in the strain field before fracture calculated by the picture was considered as the complete damage strain, as shown in Figure 4a. It is worth mentioning that the measurement of the complete damage strain faced the challenge caused by the minor area of the notch. The micro speckle was performed using an airbrushing tool and an enamel paint manufactured by GUNZE Japan, as shown in Figure 4b.
Dynamic tensile tests were performed to get the parameter D4 of the revised JC damage model. The multiple-stress-wave induced fracture needed to be avoided to ensure the accuracy of the strain at the fracture. Thus, the pulse width of the stress wave was improved to guarantee the single-stress-wave induced fracture, which was validated by checking the high-speed video. The DIC method was also used to calculate the initial damage strain instead of tool measuring, such as a vernier caliper. Afterwards, the parameter D5 of the revised JC damage model was determined based on the quasi-static tensile tests at 373 K, 473 K and 573 K. For both the quasi-static and dynamic tests at high temperatures, two heating furnaces with the high-temperature resistant glass were used not only to heat the specimen, but also to provide an observation port to capture the pictures. Furthermore, a blue light was added to increase the image definition of the micro speckle in the high-temperature tests. It is worthy mentioning that the failure strains in the torsion tests were calculated by using the shear fracture strain as follows:
ε f = γ f / 3
where γ f is the shear fracture strain which can be calculated by a torsion angle, and this method is based on the assumption that the deformation of specimens is homogeneous along the axial direction until fracture.

4. Results and Discussion
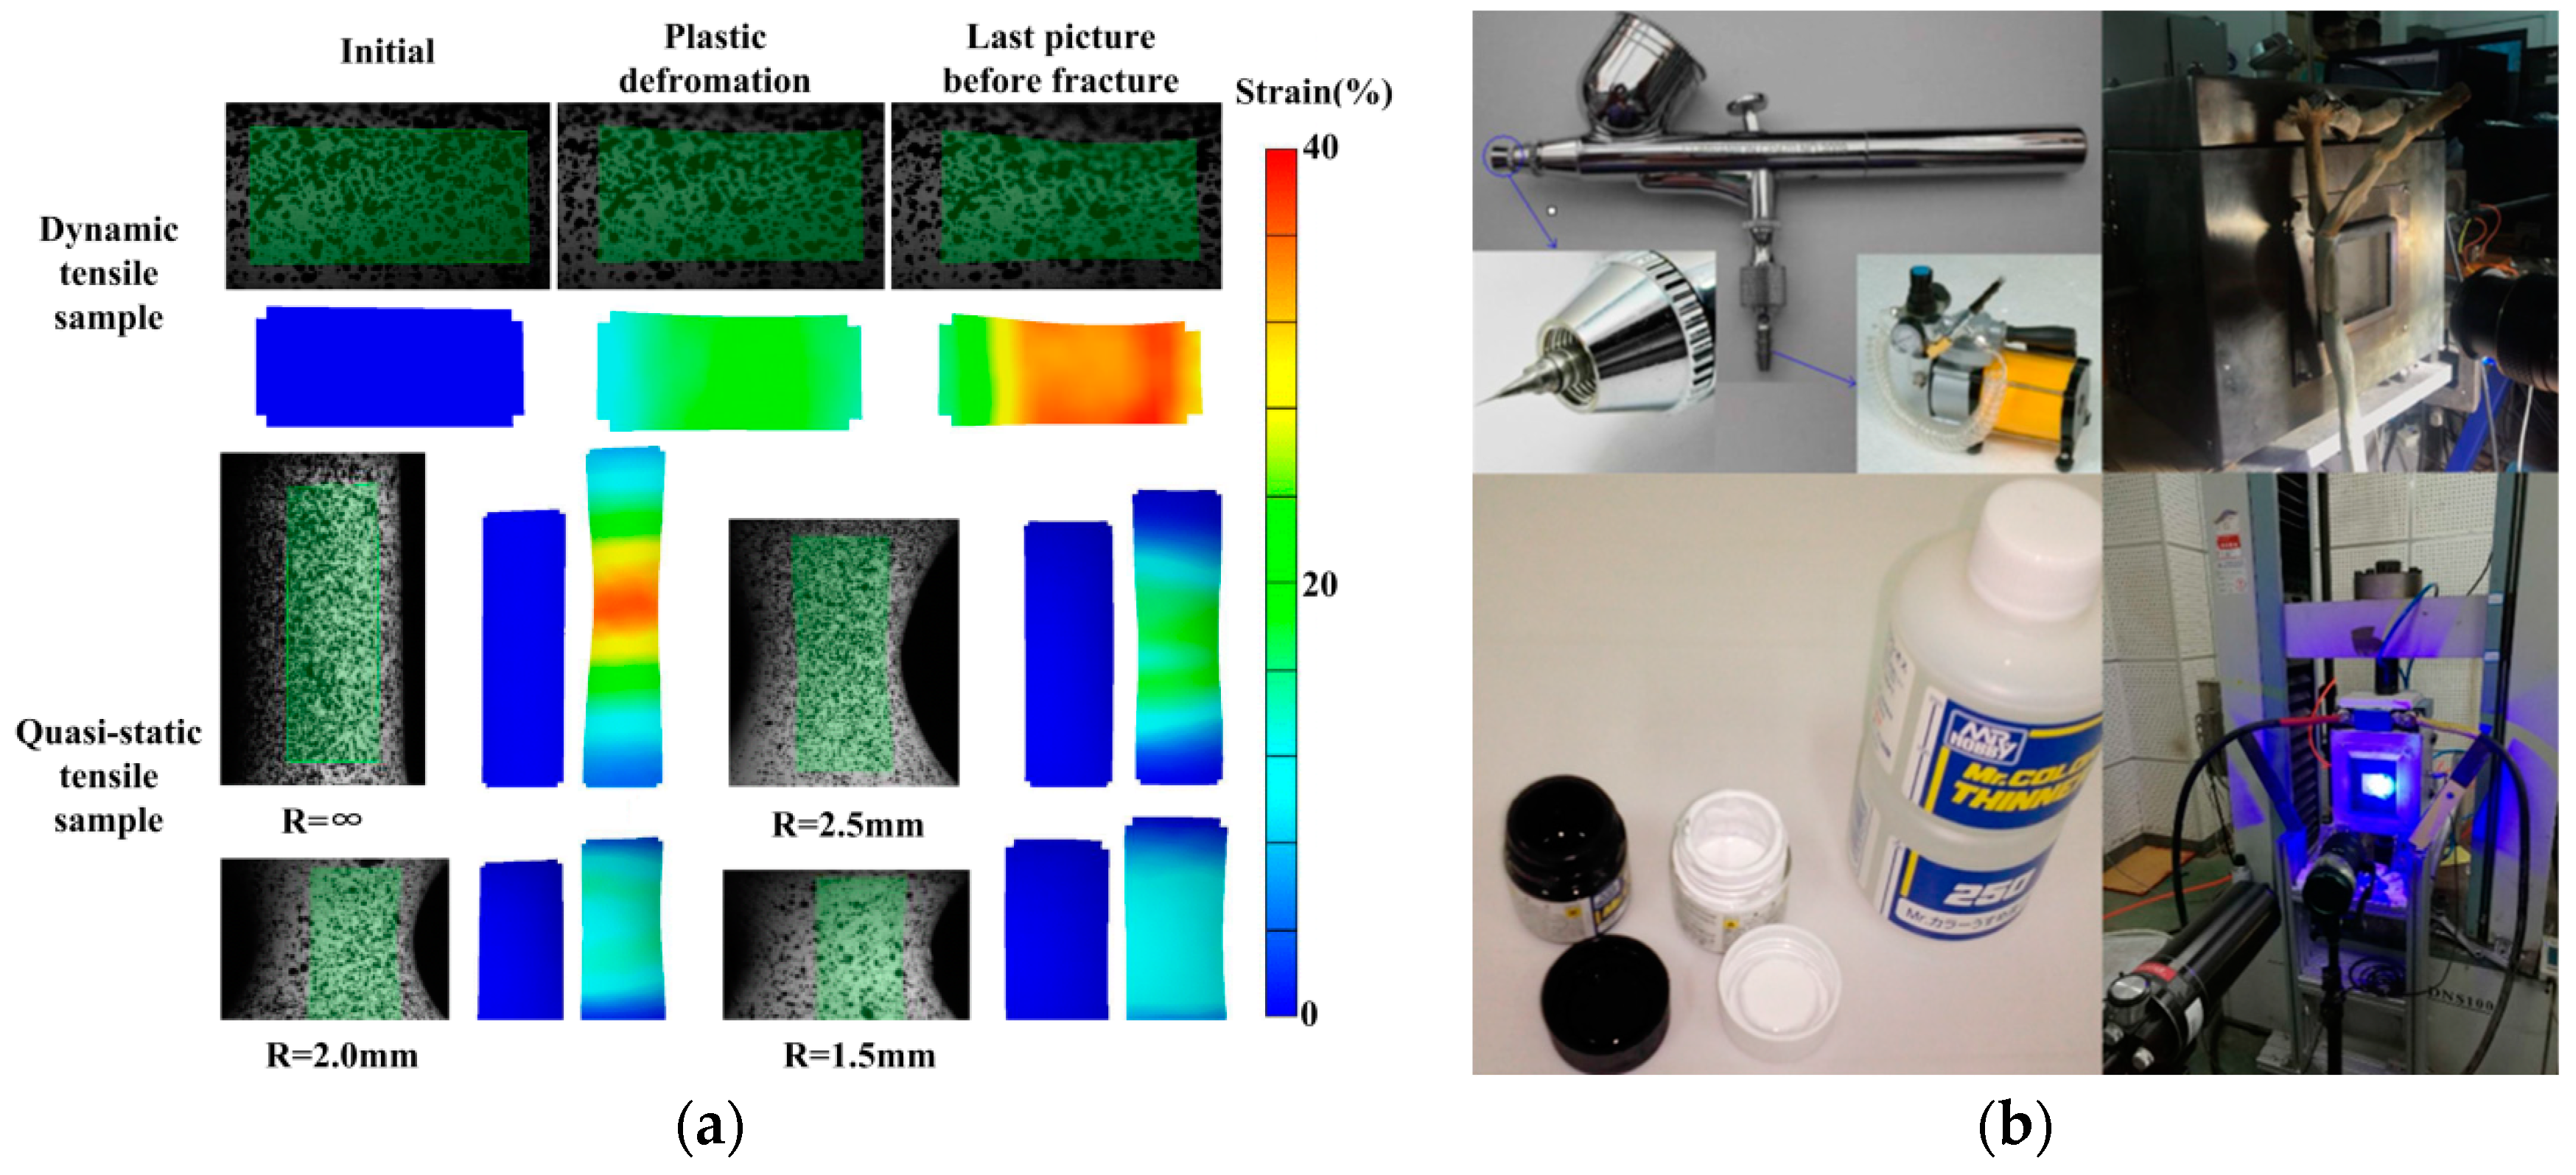
Figure 5 shows the true stress versus the true strain curves of the 2618 aluminum alloy and the Ti-6Al-4V titanium alloy tested at different strain rates. In addition, the fitted curves were also added for comparison. The parameters of the JC constitutive model [3] are listed in Table 1 based on an equation as follows:
σ = [ A + B ε n ] [ 1 + C I n ε ˙ * ] [ 1 T * m ]
where σ and ε are the effective stress and effective plastic strain, respectively. ε ˙ *   is the normalized effective plastic strain rate; n denotes the work hardening exponent; A, B, C and m are the constants of the material; and the quantity T* is defined as:
T * = ( T T r ) / ( T m T r )
where Tm is the melting temperature, and Tr is the reference temperature which is typically taken as 293 K, and the reference strain rates for both the two materials were set as 0.001. The FE models for the revision of strain rates and stress triaxialities were conducted by using these parameters.
Figure 6 shows the relationships between the complete damage strain, the revised stress triaxiality, the strain rate and the temperature of the 2618 aluminum alloy and the Ti-6Al-4V titanium alloy. As can be seen, the complete damage strains of both two materials decreased as the stress triaxialities increased. However, the equivalent failure strains were relatively larger than the complete damage strains, which were calculated by the DIC method, and this tendency was weakened with the increase of stress triaxiality. It was considered that the necking effect influenced the accuracy of the failure strain calculated by the Bridgman equations. Take the case of the Ti-6Al-4V titanium alloy for example. The fracture morphologies indicated that the failure mode was changed from the ductile fracture to the brittle fracture with the increase of stress triaxiality. The obvious dimples were found in the ductile extension region of the specimen without notch, which were hardly seen in the specimen with the 1.5 mm notch, as shown in Figure 7a,b. In addition, a transient crack zone existed where the dimples became shallow and less obvious in the center location of the fracture, which proved that the complete damage strains calculated from the surfaces of the specimens avoided the error caused by the change of fracture mode. In addition, the complete damage strains increased with the strain rate, and the toughness of material decreased under high strain rates. Figure 7c shows the fracture morphology of smooth tensile specimen under 2000 s−1. The secondary cracks were found in the fracture, which indicated that the specimens suffered from the tension–shear coupling in the high strain rate tests. Consequently, the complete damage strain increased since the tension–shear coupling induced the decreasing stress triaxiality. Finally, the revised JC failure parameters of the 2618 aluminum alloy and the Ti-6Al-4V titanium alloy were obtained by fitting the results, as listed in Table 2.

5. Validation

In previous study, ballistic impact tests on 22 mm 2618 aluminum plates were carried out with two kinds of Ti-6Al-4V titanium alloy projectiles to investigate the impact response at a nominal velocity of 210m/s. Considering the excellent ability of nonlinear analysis, we developed two finite element models by using the commercial software ABAQUS to validate the accuracy of the revised parameters. The mesh pattern and size dependency were examined at first for the purpose of finding an optimized mesh for stability, accuracy, and efficiency of the impact analysis. Both the Ti-6Al-4V titanium alloy projectile and the 2618 aluminum alloy plate were modeled with the eight-node underintegrated hexagonal solid elements (C3D8R). The in-plane mesh pattern was kept the same for all models, and the central part of the target was divided into three different regions, as shown in Figure 8. In addition, the mesh density was gradually coarsening from the inner region (the potential impact region) to the outer. Mesh transition between regions was good enough to prevent stress wave reflections from the boundary of regions. Simply refining the mesh does not necessarily improve the accuracy since the material-model parameters were calibrated for a specific mesh size and a mode of failure changes during the simulation. Furthermore, there was no clear theoretical guideline on the required mesh density for the range of impacts covered in this study. On account of softening effects and mesh dependent failure algorithms, the only reasonable methodology to find the most appropriate mesh size was trial and error, while the results against a controlled test data were compared. Subsequently, it was possible to arrive at an optimum after meshing were used, and some guidelines for that particular case were drawn. Thus, the thickness of each target was modeled with one mesh density in this study, while more similar experiments were performed during the calibration. For mesh patterns in the thickness direction, the number of through thickness elements was chosen to be 11 for the 22 mm target as a baseline, since implementation of reduced integration solid elements required at least three elements through the thickness to be able to capture the bending deformation modes accurately. A viscosity based stabilization method was used during the simulations to prevent hourglass modes of the reduced integration elements. A contact behavior between the projectile and the target was attained by using a penalty based single-surface-type contact algorithm that used a nodal constraint formulation with an element erosion scheme.
By using the parameters of the revised JC failure criteria in ABAQUS, the impact responses of the Ti-6Al-4V titanium alloy projectile and the 2618 aluminum alloy plate were examined based on an explicit analysis scheme. For the plates impacted by solid plate projectiles and hollow blade projectiles, simulations illustrated that there was no perforation on the targets, which was the same as the experiments. As shown in Figure 9a,b, the damage morphology and the size were comparatively coincident with the experiments. Moreover, the cracks on the back of the 2618 aluminum alloy plates were predicted as well, and both the experiments and the simulations indicated the same result that the possible initiating origin and the propagation direction of the cracks for the 2618 aluminum alloy plates impacted by solid plate projectiles and hollow blade projectiles were different. In conclusion, the failure mode, the dent formation, the perforation shape of the 2618 aluminum alloy plates in the simulations and the damage of the Ti-6Al-4V titanium alloy projectiles all corresponded well to the test results, which was attributed to the revised JC failure parameters.

6. Summary and Conclusions

A new experimental and numerical method was carried out to determine the revised JC failure parameters of the 2618 aluminum alloy and the Ti-6Al-4V titanium alloy. The specimens with different notches were designed, and then the loading speeds, the strain distributions and the stress triaxialities were all analyzed and revised by using the FE model. Results clearly indicated that the largest strain concentrated on the surface of the circumferential area. Thus, the traditional failure strain in the JC failure model was replaced by the complete damage strain, which was defined as the largest strain before fracture. Therefore, the DIC method and the micro speckle were conducted to measure the strain field. A series of quasi-static and dynamic experiments under different temperatures were conducted to support the establishment of the relationships between the complete damage strain, the revised stress triaxiality, the strain rate and the temperature. The results showed the Bridgman failure strains were relatively larger than the complete damage strains, which were calculated by the DIC method, and this tendency was weakened with the increase of stress triaxiality. In addition, the complete damage strains increased with the strain rate, and the toughness of material decreased under high strain rates, since the tension–shear coupling induced the decreasing stress triaxiality. Finally, the comparisons between the ballistic impact tests and simulations were conducted. The failure mode, the dent formation, the perforation shape of the 2618 aluminum alloy plates and the damage of the Ti-6Al-4V titanium alloy projectiles in the simulations all corresponded well to the experiments, thus proving the accuracy of the revised JC failure parameters.

Author Contributions

Conceptualization, Y.L. and Z.T.; data curation, C.W.; formal analysis, C.W. and Y.L.; investigation, C.W.; methodology, T.S. and P.X.; project administration, T.S. and Y.L.; resources, T.S. and P.X.; validation, C.W.; writing of the original draft, C.W.

Funding

This research was funded by National Natural Science Foundation of China: Nos.11772268, 11522220 and 11527803.

Acknowledgments

The authors would like to acknowledge Liang Hou from AECC Commercial Aircraft Engine Co., Ltd. and Xiang Wang from Jiangsu Tie Mao Glass Co., Ltd. in China.

Conflicts of Interest

The authors declare that there are no conflicts of interest regarding the publication of this article.

References

  1. Leseur, D. Experimental Investigations of Material Models for Ti-6A1-4V and 2024-T3; Office of Scientific and Technical Information: Oak Ridge, TN, USA, 1999.
  2. Tvergaard, V.; Needleman, A. Analysis of the cup-cone fracture in a round tensile bar. Acta Metall. 1984, 32, 157–169. [Google Scholar] [CrossRef]
  3. Johnson, G.R.; Cook, W.H. A constitutive model and data for metals subjected to large strains, high strain rates and high temperatures. In Proceedings of the 7th International Symposium on Ballistics, The Hague, The Netherlands, 19–21 April 1983; pp. 541–548. [Google Scholar]
  4. Peters, P.; Manopulo, N.; Lange, C.; Hora, P. A strain rate dependent anisotropic hardening model and its validation through deep drawing experiments. Int. J. Mater. Form. 2014, 7, 447–457. [Google Scholar] [CrossRef]
  5. Yoon, J.W.; Barlat, F.; Dick, R.E.; Chung, K.; Kang, T.J. Plane stress yield function for aluminum alloy sheets—Part II: Fe formulation and its implementation. Int. J. Plast. 2004, 20, 495–522. [Google Scholar] [CrossRef]
  6. Li, S.; Beyerlein, I.J.; Bourke, M.A.M. Texture formation during equal channel angular extrusion of FCC and BCC materials: Comparison with simple shear. Mat. Sci. Eng. Struct. 2005, 394, 66–77. [Google Scholar] [CrossRef]
  7. Xue, L.; Wierzbicki, T. Numerical simulation of fracture mode transition in ductile plates. Int. J. Solids Struct. 2009, 46, 1423–1435. [Google Scholar] [CrossRef]
  8. Bai, Y.; Wierzbicki, T. Forming severity concept for predicting sheet necking under complex loading histories. Int. J. Mech. Sci. 2008, 50, 1012–1022. [Google Scholar] [CrossRef]
  9. Mcclintock, F.A. A criterion for ductile fracture by the growth of holes. J. Appl. Mech. Trans. 1968, 35, 363–371. [Google Scholar] [CrossRef]
  10. Hancock, J.W.; Mackenzie, A.C. On the mechanisms of ductile failure in high-strength steels subjected to multi-axial stress-states. J. Mech. Phys. Solids 1976, 24, 147–160. [Google Scholar] [CrossRef]
  11. Tvergaard, V.; Needleman, A. Effect of material rate sensitivity on failure modes in the Charpy V-notch test. J. Mech. Phys. Solids 1986, 34, 213–241. [Google Scholar] [CrossRef]
  12. Bridgman, P.W. Studies in Large Plastic Flow and Fracture; McGraw-Hill: New York, NY, USA, 1952. [Google Scholar]
  13. Bai, Y.; Teng, X.; Wierzbicki, T. On the application of stress triaxiality formula for plane strain fracture testing. J. Eng. Mater. Technol. 2009, 131, 175–208. [Google Scholar] [CrossRef]
  14. Fouad, H. Experimental and numerical studies of the notch strengthening behaviour of semi-crystalline ultra-high molecular weight polyethylene. Mater. Des. 2010, 31, 1117–1129. [Google Scholar] [CrossRef]
  15. Bao, Y.; Wierzbicki, T. On fracture locus in the equivalent strain and stress triaxiality space. Int. J. Mech. Sci. 2004, 46, 81–98. [Google Scholar] [CrossRef]
  16. Khan, A.I. Progressive Failure Analysis of Laminated Composite Structures. Ph.D. Thesis, Virginia Tech., Blacksburg, VA, USA, 2015. [Google Scholar]
  17. Wierzbicki, T.; Bao, Y.; Lee, Y.W.; Bai, Y. Calibration and evaluation of seven fracture models. Int. J. Mech. Sci. 2005, 47, 719–743. [Google Scholar] [CrossRef]
  18. Barsoum, I.; Faleskog, J. Rupture mechanisms in combined tension and shear—Experiments. Int. J. Solids Struct. 2007, 44, 1768–1786. [Google Scholar] [CrossRef]
  19. Johnson, G.R.; Cook, W.H. Fracture characteristics of three metals subjected to various strains, strain rates, temperatures and pressures. Eng. Fract. Mech. 1985, 21, 31–48. [Google Scholar] [CrossRef]
  20. Kim, J.; Gao, X.; Srivatsan, T.S. Modeling of void growth in ductile solids: Effects of stress triaxiality and initial porosity. Eng. Fract. Mech. 2004, 71, 379–400. [Google Scholar] [CrossRef]
  21. Tvergaard, V.; Niordson, C. Nonlocal plasticity effects on interaction of different size voids. Int. J. Plast. 2004, 20, 107–120. [Google Scholar] [CrossRef]
  22. Anderson, D.; Winkler, S.; Bardelcik, A.; Worswick, M.J. Influence of stress triaxiality and strain rate on the failure behavior of a dual-phase DP780 steel. Mater. Des. 2014, 60, 198–207. [Google Scholar] [CrossRef]
  23. Kolsky, H. An investigation of the mechanical properties of materials at very high rates of loading. Proc. Phys. Soc. Sec. B 1949, 62, 676. [Google Scholar] [CrossRef]
Figure 1. (a) Specimens for dynamic tensile experiments; and (b) specimens with different notches radii for quasi-static tensile experiments.
Metals 08 00396 g001
Figure 2. (a) Variations of strain at the circumferential area when the same loading speed was applied to the 2618 aluminum alloy; (b) strain distribution of specimens with 1.5 mm notch for the 2618 aluminum alloy simulated by the FE model; and (c) determination of the strain rates by the DIC method.
Metals 08 00396 g002
Figure 3. (a) Relationships between the stress triaxiality and the strain for the specimens with three kinds of notches; and (b) schematic diagram for the revised strain triaxiality of the smooth quasi-static tensile specimens.
Metals 08 00396 g003
Figure 4. (a) Strain fields calculated by using the DIC method and micro speckles; and (b) heating furnace with high-temperature resistant glass, an airbrushing tool and an enamel paint.
Metals 08 00396 g004
Figure 5. (a) True stress versus true strain curves of the 2618 aluminum alloy; (b) fitting of temperature sensitivity for the 2618 aluminum alloy; (c) true stress versus true strain curves of the Ti-6Al-4V titanium alloy; and (d) fitting of temperature sensitivity for the Ti-6Al-4V titanium alloy.
Metals 08 00396 g005
Figure 6. (a) Relationship between the complete damage strain and the revised stress triaxiality of the 2618 aluminum alloy; (b) relationship between the complete damage strain and the revised stress triaxiality of the Ti-6Al-4V titanium alloy; (c) relationship between the complete damage strain and the strain rate of the 2618 aluminum alloy; (d) relationship between the complete damage strain and the strain rate of the Ti-6Al-4V titanium alloy; (e) relationship between the complete damage strain and the temperature of the 2618 aluminum alloy; and (f) relationship between the complete damage strain and the temperature of the Ti-6Al-4V titanium alloy.
Metals 08 00396 g006
Figure 7. (a) Fracture morphology in the ductile extension region of the smooth tensile specimen; (b) fracture morphology in the ductile extension region of the specimen with the 1.5 mm notch; and (c) fracture morphology of smooth tensile specimen under 2000 s−1.
Metals 08 00396 g007
Figure 8. (a) Exact mesh used for the 2618 aluminum alloy plates and the Ti-6Al-4V solid plate projectile and a hollow blade projectile; and (b) exact mesh used for the 2618 aluminum alloy plates and the Ti-6Al-4V hollow blade projectile.
Metals 08 00396 g008
Figure 9. (a) Damage morphologies of the 2618 aluminum alloy plates impacted by the Ti-6Al-4V solid plate projectiles and hollow blade projectiles; and (b) damage morphologies of the Ti-6Al-4V solid plate projectile and the hollow blade projectile.
Metals 08 00396 g009
Table 1. JC constitutive parameters of the 2618 aluminum alloy and the Ti-6Al-4V titanium alloy.
ParametersA (MPa)BCmn
2618 Aluminum alloy3603150.0032.40.44
Ti-6Al-4V titanium alloy1019.5674.10.030.4570.92
Table 2. Revised JC failure parameters of the 2618 aluminum alloy and the Ti-6Al-4V titanium alloy.
ParametersD1D2D3D4D5
2618 aluminum alloy0.0320.662−1.7710.01310.867
Ti-6Al-4V titanium alloy0.0210.132−1.10.02383.451

