Abstract
In order to study the effect of initial microstructures on the hot deformation behavior and workability of Ti2AlNb alloy, the isothermal compression experiments of as-rolled and solution-treated Ti–19Al–23Nb–0.5Mo alloys were conducted in the temperature range of 900–1100 °C and strain rate range of 0.001–10 s−1. Subsequently, the processing maps of different state materials were established based on dynamic material model (DMM) and Prasad’s instability criterion. The suitable regions for hot working were determined in the processing maps, which was verified through high-temperature tensile test. The results show that although the solution-treatment could be used to improve the ductility of as-rolled Ti2AlNb alloy at room temperature, the as-rolled microstructure exhibited better hot workability at high temperature compared to the solution-treated microstructure.
1. Introduction
Ti2AlNb alloys are attractive candidate materials for use in aviation and automobile industries because of its excellent properties, such as high specific strength, good oxidation resistance, and sufficient creep resistance at elevated temperatures [1,2]. Due to the introduction of amounts of lamellar O phase (orthorhombic structure with CmCm symmetry based on Ti2AlNb) with superior creep resistance, Ti2AlNb-based alloys can be used in the temperature range of 600–750 °C [3,4]. Besides, the hexagonal close-packed (hcp) α2 phase (DO19 structure based on Ti3Al), and body-centered cubic (bcc) phase β (disordered structure) or B2 phase (ordered structure) also exist in the Ti2AlNb alloys. The α2 phase is a brittle phase with high hardness and B2 phase is a plastic phase, which can increase the strength and improve the ductility of Ti2AlNb alloys, respectively. In the case of high temperature, the B2/β phase undergoes an ordered-disorder transition [5]. The phase transition temperature depends strongly on the alloy composition. L.A. Bendersky and K. Muraleedharan et al. [6,7] found that when the content of Nb element in the alloy exceeds 20%, the transition temperature of B2/β phase increases sharply. Actually, the mechanical properties of Ti2AlNb alloy are quite sensitive to their microstructure morphologies [8,9]. Xue Chen et al. [10] quantitatively investigated the coarsening behavior of the lamellar O phase and its effect on the tensile properties of Ti–22Al–25Nb alloy. O.G. Khadzhieva et al. [11] analyzed the phase and microstructure transformation occurring upon the ageing of a titanium alloy based on the O-phase. S. Emura et al. [12] successfully controlled the prior B2 grain size of a Ti–22Al–27Nb alloy to be in the range of 8–49 by means of the pinning effect of spherical a2 particles against grain growth.
Due to the inherent brittleness of intermetallic compounds, the Ti2AlNb alloys possess high flow stress and low ductility at room temperature, so they need to be processed at elevated temperature. However, the microstructure and properties of Ti2AlNb alloys exhibit a strong dependence on the processing parameters, such as deformation temperature, strain and strain rate, thus it is important to control and optimize the hot working parameters during hot deformation of Ti2AlNb alloys. Moreover, different initial microstructures usually show different hot-workability in Ti2AlNb alloys. Nevertheless, there is little study on the dependence of initial microstructures on the hot deformation behavior and workability of Ti2AlNb alloys, which restricts their thermal mechanical processing and wide application until now.
In this study, the hot deformation behaviors of a Ti2AlNb-based alloy with the chemical composition of Ti–19Al–23Nb–0.5Mo (at. %), as-rolled and solution-treated, were studied, respectively. The evolution of microstructure and mechanical properties during thermal deformation were analyzed. Meanwhile, the hot processing maps of the Ti2AlNb alloy with different initial microstructures were established. Furthermore, the difference of the deformation behaviors and thermal processing performance between two initial microstructures were discussed. Thereafter, the suitable hot-working conditions were determined, which could provide effective guidance for hot processing of the Ti2AlNb alloys.
2. Materials and Methods
The alloy sheet used in the present work was provided by Baoji Titanium Industry Co, Ltd. (Baoji, China), 480 mm in length, 240 mm in width, and 11.7 mm in thickness. The chemical composition of the as-rolled sheet was measured to be Ti–19Al–23Nb–0.5Mo in atomic percent through inductively coupled plasma mass spectrometer (ICP) (Optima 5300 DV, PerkinElmer, Waltham, MA, USA), as listed in Table 1. In order to determine the solution temperature of O phase, the solid solution was performed at 890–1090 °C with interval of 20 °C for 3 h, followed by water cooling to about 20 °C. The mechanical properties of the Ti2AlNb alloy under as-rolled and solution-treated conditions were analyzed through the microhardness test and tensile experiment. The microhardness of as-rolled and solution-treated alloys was measured on a HVS-1000A microhardness tester provided by Laizhou Huayin Testing Instrument Co., Ltd. (Laizhou, China), with a Vickers indenter under a test load of 1000 g and a dwell time of 15 s according to the ASTM standard E384-99.

Table 1.
Measured chemical composition of Ti2AlNb alloy.
The cylindrical specimens for isothermal compression were spark machined from the as-rolled and solution-treated sheet, 7.8 mm in diameter and 11.7 mm in height. The isothermal compression test was conducted in the temperature range from 900 °C to 1100 °C with 50 °C intervals and the strain rate range from 0.001 s−1 to 10 s−1 on a Gleeble-1500D thermal simulator (DSI Company, Sao Paulo, MN, USA). Before the onset of hot compression, the specimens were heated to deformation temperature at a heating rate of 10 °C/s and held for 5 min. Subsequently, the specimens were compressed to a true strain of 0.7 in low vacuum atmosphere of 1 × 10⁻³ Torr and then quenched into water of about 20 °C. In order to reduce the friction, graphite paper was used as lubricant between the crosshead and specimen during hot compression. After hot compression, the specimens were sectioned parallel to the compression axis for microstructural observation using an Olympus-PMG3 optical microscope (OM) (Olympus Corporation, Tokyo, Japan). The electron backscattered diffraction (EBSD) measurement was carried out on a Quanta 200FEG scanning electron microscope (FEI Company, Hillsborough, OR, USA), and the data with the confidence (CI) value higher than 0.5 were analyzed using the software of TSL-OIM (Analysis 6.1, EDAX Company, Mahwah, NJ, USA). The TEM analysis was conducted on a Talos F200x transmission electron microscope (FEI Company, Hillsborough, OR, USA) operated at 200 KV. The grain size of as-rolled and solution-treated specimens was measured by the linear intercept method using optical micrographs in three individual fields. The specimens for EBSD analysis were first mechanically ground and polished, and then electropolished in a solution of perchloric acid, methyl alcohol and butanol with the ratio of 6:60:34 for 120 s at the temperature of about −20 °C. The Ti2AlNb specimens for TEM test were mechanically milled to about 70 μm, followed by twin-jet electropolishing using a solution of perchloric acid, methyl alcohol, and butanol with the ratio of 6:60:34 at −20 °C and 25 V.
3. Results and Discussion
3.1. Microstructure and Properties of As-Rolled (AR) and Solution-Treated (ST) Ti2AlNb Alloy
Figure 1 shows the OM, SEM, and TEM microstructures of as-rolled Ti2AlNb alloy, respectively. The white α2 phase particles were dispersedly distributed in the matrix (see Figure 1a). The microstructure of the as-rolled sheet was mainly consisted of lamellar B2/O phases, equiaxed α2 (dark), B2 (light), and rim-O phases (gray), as depicted in Figure 1b. Figure 1d–f were the electron diffraction patterns of B2, α2 and O phases, respectively, selected from Figure 1c.
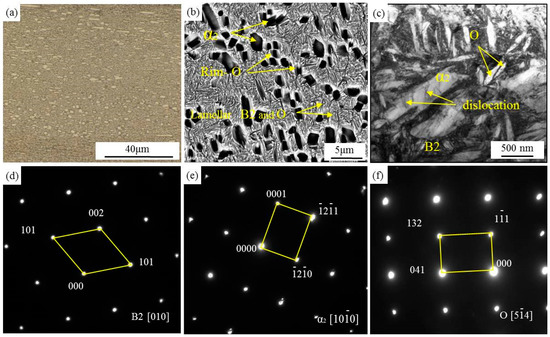
Figure 1.
Microstructures of as-rolled Ti-19Al-23Nb-0.5Mo alloy: (a) OM (optical microscope) image, (b) SEM (scanning electron microscope) micrograph of α2, B2 and O phases, (c) TEM (transmission electron microscope) micrograph of α2, B2 and O phases, (d–f), area fractions of α2, O, B2 phases in Figure 1c.
Figure 2 presents the SEM microstructures of the Ti2AlNb alloy at different solution temperatures (890–1090 °C) for 40 min. As shown in Figure 2a,b, when the solution temperature was below 930 °C, the dark α2 phase was surrounded by light gray rim-O phase due to the occurrence of the peritectoid transformation at the interface of α2 phase and B2 phase [13]. Also, the lamellar O phase was visible in the B2 phase matrix. When the solution temperature reached 950 °C, the microstructure mainly consisted of large B2 grains with grain size of about 2–5 μm and reduced α2 phase distributed along the B2 grain boundaries, but the lamellar O phase disappeared (see Figure 2c). It indicates that the transformation temperature of O phase was around 950 °C in this Ti2AlNb alloy. With further increasing of solution temperature, the B2 phase continued to coarsen while the α2 phase reduced gradually (see Figure 2d–f). When the solution temperature increased to 1050 °C or higher, only B2 grains existed in the matrix, suggesting that the α2 phase transition temperature was less than 1050 °C (see Figure 2f,g). The grain size of B2 phase grew rapidly from 173 μm to 273 μm when the temperature increased from 1050 °C to 1090 °C, which should be ascribed to the lack of the pinning effect of the secondary α2 phase distributed along B2 grain boundaries.
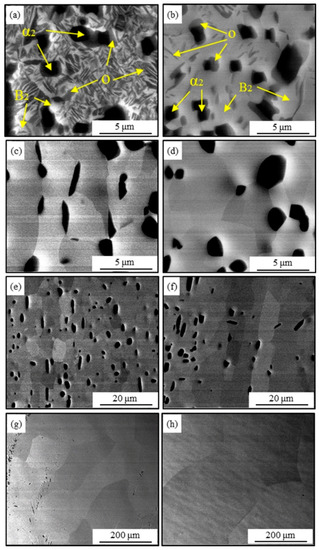
Figure 2.
SEM microstructures of solution-treated Ti2AlNb alloy: (a) 890 °C; (b) 930 °C; (c) 950 °C; (d) 970 °C; (e) 990 °C; (f) 1030 °C; (g) 1050 °C; and (h) 1090 °C.
In order to improve the ductility of the Ti2AlNb alloy, the solid solution was conducted at 980 °C for 3 h to eliminate O phase without coarsening B2 phase. The SEM and TEM microstructures of solution-treated sheet are shown in Figure 3. Through comparing Figure 1b and Figure 3a, it can be seen that the O phase disappeared completely after solid solution. Meanwhile, the α2 phase grains exhibited a spheroidization tendency and the dislocation density reduced clearly, as shown Figure 1c and Figure 3b.
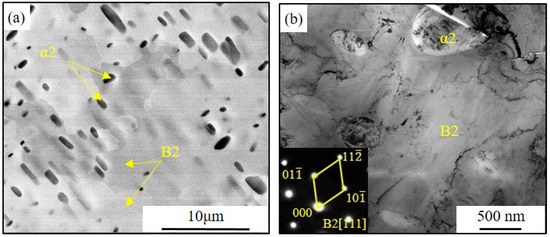
Figure 3.
Microstructure of the solution-treated Ti–19Al–23Nb–0.5Mo alloy (980 °C/3 h): (a) SEM microstructure, (b) TEM micrograph of α2 phase and B2 phase.
Figure 4 shows the mechanical properties of the Ti2AlNb alloy under as-rolled and solution-treated conditions. Compared to the as-rolled alloy, the tensile strength of solution-treated alloy decreased in RD (rolling direction) and TD (transverse direction) direction from 1110 MPa and 1157 MPa to 1020 MPa and 1058 MPa, respectively. The elongation in RD and TD direction increased from 5.7% and 2.4% to 9.5% and 4.1%, respectively. After solid solution in the α2+B2/β two-phase region, the average hardness of solution-treated samples was 326 (±9) HV (MPa), which was much lower than that of the as-rolled Ti2AlNb samples 408 (±12) HV (MPa). The change of mechanical properties should be partly attributed to the weakening of the secondary-phase strengthening effect as the lamellar /lenticular O phase dissolved into the matrix of B2 phase completely after solid solution. In addition, static recrystallization of β (B2) phase occurring in solid solution could eliminate the work hardening by decreasing dislocation density in as-rolled sheet.
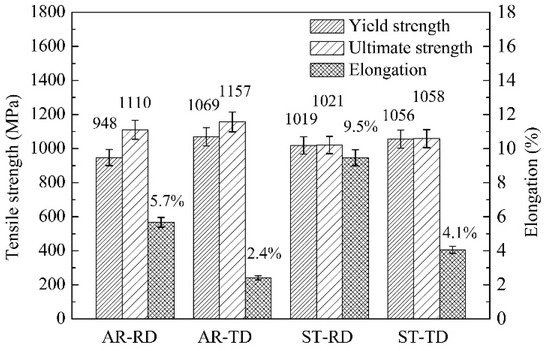
Figure 4.
Tensile strength and elongation in two directions (RD and TD) of AR (as-rolled) and ST (solution-treated) alloy.
3.2. Flow Stress Behavior of As-Rolled (AR) and Solution-Treated (ST) Alloy
Figure 5 shows the true stress-strain curves for as-rolled and solution-treated samples compressed at the temperatures of 900–1100 °C with interval 50 °C. For both the as-rolled and solution-treated alloys, the flow stress decreased with increasing temperature and decreasing strain rate, indicating that the flow stress was sensitive to deformation temperature and strain rate. Actually, the flow stress-strain curves exhibited two typical deformation characteristics in the hot compression experiment. When hot compression was conducted at 950–1050 °C with the strain rate lower than 0.01 s−1 or the temperature higher than 1100 °C with the strain rate lower than 1 s−1, the true stress-strain curves exhibited single peak stress at the initial deformation stage, followed by the decrease of flow stress to a relatively steady value. It represents typical deformation softening characteristic caused by sufficient dynamic recrystallization (DRX). Under the other deformation conditions, the flow stress decreased continuously beyond the peak value due to incomplete dynamic recrystallization or flow instability [14,15].
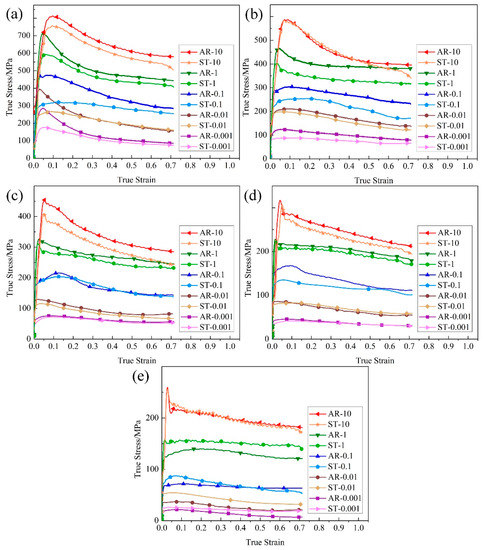
Figure 5.
Typical stress-strain curves at different temperatures and strain rates of as-rolled (AR) and solution-treated (ST) Ti2AlNb alloy, (a) 900 °C, (b) 950 °C, (c) 1000 °C, (d) 1050 °C, and (e) 1100 °C.
Under the temperature range of 900–1050 °C, the as-rolled alloy showed higher peak flow stress compared with the solution-treated alloy, as shown in Figure 6. However, the difference of peak stress reduced with the increasing of deformation temperature. The possible reason is that the reduction of dispersively distributed fine lamellar O phase and α2 phase accelerated the decreasing of flow stress of as-rolled alloy with the increase of deformation temperature, which led to the reduction of peak stress difference between as-rolled and solution-treated alloy. When the temperature increased to 1100 °C, both the secondary O phase and α2 phase disappeared in the B2 matrix, thus the solution-treated alloy even exhibited a higher peak flow stress relative to the as-rolled alloy, as shown in Figure 5e and Figure 6. It is well known that grain boundary slip was the main deformation mode of metals at high temperature [16,17]. In this study, the grain size of as-rolled and solution-treated Ti2AlNb alloy under 1100 °C was 88 μm and 95 μm, respectively. The larger grain size of solution-treated Ti2AlNb alloy should result in less internal grain boundaries, which was not conducive to plastic deformation and thus led to higher flow stress of solution-treated alloy compared to as-rolled alloy.
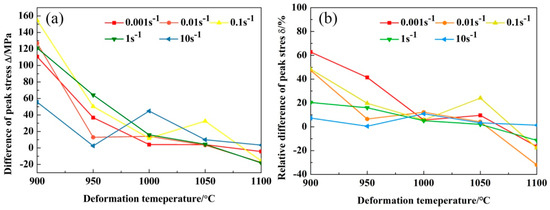
Figure 6.
The peak stress and strain characterization at different temperatures and strain rates of as-rolled and solution-treated alloy: (a) difference of peak stress (, is the difference of peak stress, is the peak stress of as-rolled alloy, and is the peak stress of solution-treated alloy), (b) Relative difference of peak stress (, is the relative difference of peak stress, is the peak stress of as-cast alloy, and is the peak stress of solution treated alloy).
3.3. Kinetic Analysis
Theoretically, plastic deformation is controlled by the thermally activated process. At all the stress levels, the relationship between flow stress, temperature and strain rate can be expressed by hyperbolic sine function [18]:
It also can be given by the Zener-Hollomon parameter as follows [19]:
where Z is the Zener-Hollomon parameter; A, and n are materials constants, and , , ; is the strain rate; T is the deformation temperature; R is the gas constant; Qact is the activation energy; and is the peak stress. According to Equation (1), the activation energy Qact can be obtained by taking partial differential equation of Equation (1), which can be expressed as [20]:
The α values could be calculated through linear fitting of the relationships of and , as shown in Figure 7a,b. Subsequently, the deformation activation energy could be obtained through linear fitting of the curves of and , as shown in Figure 7c–e. Besides, the stress constant n could be calculated according to the curves of shown in Figure 7f. In addition, the correlation coefficients of as-rolled and solution-treated alloys for the linear regression of lnZ and during 900–1000 °C were 0.9878 and 0.98511, respectively, which reached 0.9934 and 0.9944, respectively, during 1000–1100 °C, indicating the reliability of kinetic analysis of the Ti2AlNb alloy by hyperbolic sine law.
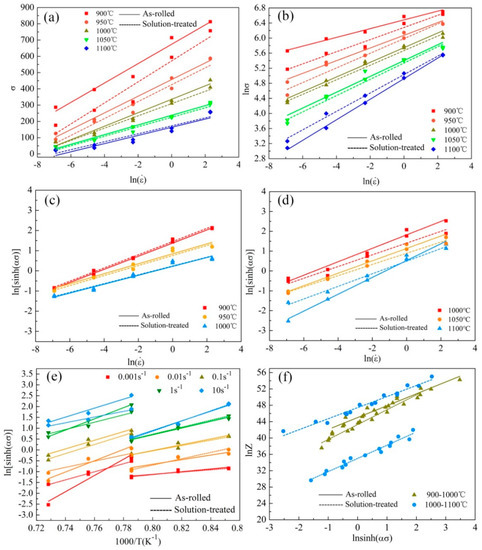
Figure 7.
The flow behaviors for as-cast and solution-treated Ti–19Al–23Nb–0.5Mo alloy: (a) ; (b) ; (c) and (d) ; (e) ; and (f) .
Table 2 lists the corresponding values of various parameters in the constitutive equation of as-rolled and solution-treated alloys. It can be seen that after solid solution, the activation energy decreased from 727 kJ/mol and 594 kJ/mol to 510 kJ/mol and 470 kJ/mol, respectively, in the temperature range of 900–1000 °C and 1000–1100 °C. Clearly, both the activation energies of as-rolled and solution-treated Ti2AlNb alloys during 900–1000 °C are higher than 1000–1100 °C in this study. Also, Xiong Ma [21] calculated the apparent activation energies of forged ingots were to be 789 kJ/mol in the α2 + B2/β + O phase region and 436 kJ/mol in the α2 + B2/β region, respectively. This should be partly caused by the dissolution of lamellar O phase above 1000 °C and gradual disappearance of α2 phase until 1050 °C. In addition, both the deformation activation energies of as-rolled alloy in the temperature range of 900–1000 °C and 1000–1100 °C were higher than that of solution-treated alloy. The possible reason is that the dissolution of lamellar O phase with excellent creep resistance may cause the decreasing of deformation activation energy.
Table 2.
Parameter of as-rolled and solution-treated alloy.
On the above basis, the dependence of the peak stress on the deformation temperature and strain rate of as-rolled Ti2AlNb alloy during 900–1000 °C and 1000–1100 °C, respectively, could be expressed as:
The constitutive equation of solution-treated Ti2AlNb alloy in the temperature range of 900–1000 °C and 1000–1100 °C, respectively, could be written as:
Usually, deformation mechanism could be represented by stress exponent in the constitutive relationship of materials. For metals, the deformation process was controlled by dislocation slide or dislocation climb when the stress exponent reached three or more [22]. Also, Boehlert et al. [9,23,24] pointed out that when the stress exponent was in the in the range of 3.5–7.2, hot deformation mechanism was dominated by dislocation slide or climb. Therefore, dislocation slide and climb may control plastic deformation during 900–1100 °C for both as-rolled and solution-treated Ti2AlNb alloy in the present study.
3.4. Hot Processing Map of As-Rolled and Solution-Treated Alloy
3.4.1. The Theory for Processing Map
Based on dynamic material modeling (DMM), the processing map was established by Prasad et al., which is widely used to study the deformation behavior of metal materials [25,26,27,28]. Further, Mahmudi et al. [29,30] utilized the theory of a processing map to predict shear deformation, which also exhibited good applicability. According to the DMM, the workpiece is considered to be a power dissipation and the total input power (P) consists of two complementary parts, wherein the G content represents the power dissipation for plastic deformation and J co-content represents the power dissipation through microstructure evolution, such as dynamic recovery, dynamic recrystallization, and phase transformation. The relationship can be described as:
For given deformation temperature and strain, the flow stress can be expressed as:
where K is the material constant; σ is the flow stress; is the strain rate; m is the strain rate sensitivity, which is thought to be independent of strain rate and can be described as follows:
The J co-content can be expressed as:
For the ideal linear dissipation body, m = 1 and J co-content reaches the maximum: . The efficiency of non-linear dissipator can be defined as:
The instability map is developed based on the extremum principle of irreversible thermodynamics applied for the large plastic flow body. The instability criterion can be defined as follows:
The variation of the instability parameter with temperature and strain rate constitutes the instability map, from which the instability regions can be obtained. For the stable flow:
The superposition of the power dissipation map over the instability map gives a processing map, in which different domains can be correlated with different microstructural mechanisms.
3.4.2. Hot Processing Map
Figure 8 shows the processing maps of as-rolled and solution-treated Ti2AlNb alloy based on Prasad’s criterion at the true strain of 0.7, respectively. It can be seen that the processing maps of as-cast and solution-treated alloy based on Prasad’s criterion exhibited similar peak power dissipation regions at 900–1100 °C and 0.001–0.1 s−1, as shown in Figure 8a,b. Both the instability regions in as-rolled alloy and solution-treated alloy were located under the temperatures of 900–1100 °C and strain rates of 0.3–10 s−1, as shown in Figure 8c,d. However, there was an evident difference existing between the stability regions of the two processing maps. The maximum peak dissipation efficiency of as-rolled alloy (1075–1100 °C and 0.001–0.25 s−1) and solution-treated alloy (1075–1100 °C and 0.01–0.25 s−1) was 0.6 and 0.5, respectively. It indicates that more deformation work was dissipated through microstructure evolution such as dynamic recovery and dynamic recrystallization, during hot compression of as-rolled alloy. Moreover, the region III for as-rolled alloy was wider than that for the solution-treated alloy, which suggests the processing area for as-rolled alloy should be larger.
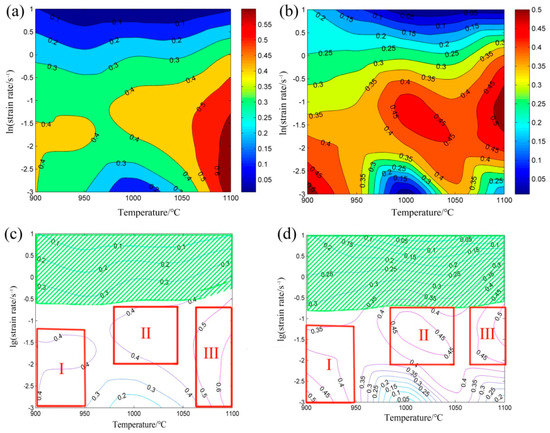
Figure 8.
Processing maps of as-rolled and solution-treated Ti2AlNb alloy: (a) power dissipation map of as-rolled alloy; (b) power dissipation map of solution-treated alloy; (c) processing map of as-rolled alloy; and (d) processing map of solution-treated alloy.
3.4.3. Instability Region
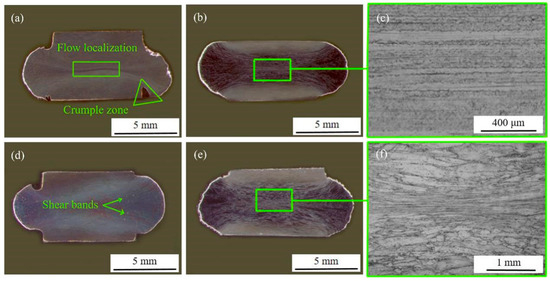
The processing map exhibited a large domain of flow instability at the strain rates higher than 1.0 s−1, which was probably caused by the occurrence of adiabatic shear bands or localized plastic flow [25,31,32]. Figure 9a,d show the macrostructures of hot compressed specimens of as-rolled and solution-treated alloy at 900 °C and 10 s−1, respectively. Figure 9b,f show the macrostructures of as-rolled and solution-treated alloy at 1100 °C and 10 s−1, respectively. It can be seen from Figure 9d that adiabatic shear bands were present at an angle of 45° to the compressive axis, which was often observed in titanium alloys at low temperatures and high strain rates. In general, shear bands were easily observed due to the adiabatic heating induced by lower thermal conductivity of titanium based alloy relative to other metal materials. The deformation heat generated during hot deformation with higher strain rate could not be released in time, resulting in localized temperature rising. Prasad et al. [25] also suggested that titanium alloys exhibit flow instability due to the formation adiabatic shear bands at high strain rates. Clearly, it can be observed that flow localization occurred in Figure 9a,b,d,e, which indicates that the Ti–19Al–23Nb–0.5Mo alloy was very sensitive to the deformation temperature and strain rate. Since flow instability should be avoided during hot working, it is necessary to control deformation temperatures and strain rates during hot working of the present alloy.
3.4.4. Stability Region
Figure 10 and Figure 11 show the EBSD images in three regions, i.e., region I, II, and III, of as-rolled and solution-treated alloy, respectively. The red, green, and yellow color denoted B2, (Ti3Al) and O (Ti2AlNb), respectively, in Figure 10d–f and Figure 11d–f. The mean grain size of as-rolled and solution-treated alloy under 900 °C and 0.001s−1 was quite small (~1 μm) (see Figure 10a,g and Figure 11a,g). Obviously, hot compression contributed to the microstructure refinement of as-rolled and solution-treated alloys, which should be beneficial for the improvement of the comprehensive mechanical properties of Ti2AlNb alloy workpieces.
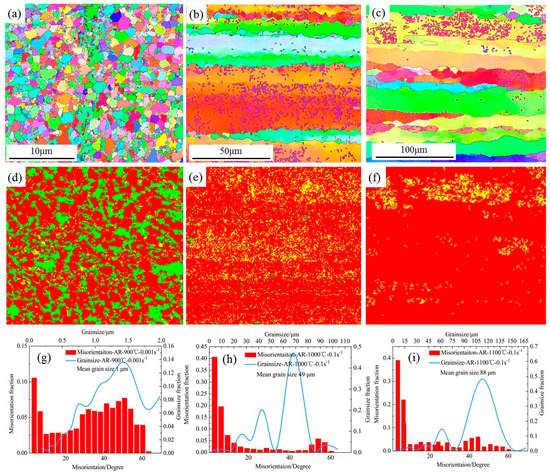
Figure 10.
Electron back scattering diffraction (EBSD) images of the specimens deformed at different deformation conditions of the as-rolled Ti2AlNb alloy: Grain size at 900 °C-0.001 s−1 (a); 1000 °C-0.1 s-1 (b), and 1100 °C-0.1 s−1 (c); Phase composition of Figure 10a (d); Figure 10b (e); and Figure 10c (f); Misorientation and grain size fraction of Figure 10a (g); Figure 10b (h); and Figure 10c (i). Wherein α2, B2 and O phase was displayed in green, red, and yellow color, respectively.
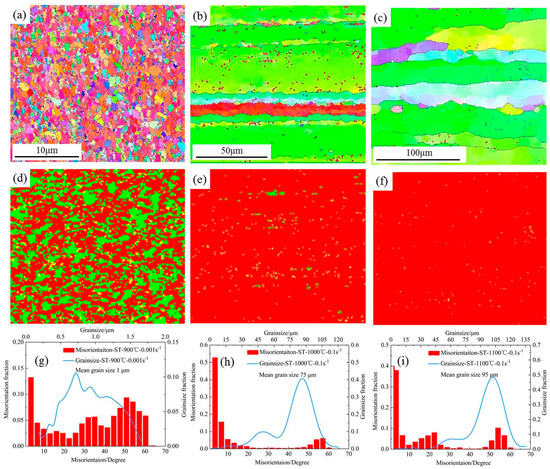
Figure 11.
Electron back scattering diffraction (EBSD) images of the specimens deformed at different deformation conditions of the solution-treated Ti2AlNb alloy: Grain size at 900 °C-0.001 s−1 (a); 1000 °C-0.1 s−1(b); and 1100 °C-0.1s−1 (c); Phase composition of Figure 11a (d); Figure 11b (e); and Figure 11c (f); Misorientation and grain size fraction of Figure 11a (g), Figure 11b; (h) and Figure 11c (i). Wherein α2, B2 and O phase was displayed in green, red, and yellow color, respectively.
As shown in Figure 10b and Figure 11b, both the microstructures of as-rolled and solution-treated alloy exhibited strip-like morphology, and amounts of DRX grains could be found along the strip-shaped grain boundaries under 1000 °C and 0.1 s−1. However, there is an evident difference in the hot compressed microstructures of as-rolled and solution-treated alloys. Large quantities of dispersively distributed O phase remained in the as-rolled alloy (see Figure 10e), while nearly no O phase could be found in the solution treated alloy (see Figure 11e). Since small O phase remaining in as-rolled alloy limited the growth of B2-phase grain, the mean grain size of B2 phase (49 μm) in as-rolled alloy was much smaller than that in solution-treated alloy (75 μm), as illustrated in Figure 10h and Figure 11h.
When deformed under 1100 °C and 0.1 s−1, the recrystallized grains grew obviously (see Figure 10c and Figure 11c) and phase could not be found (see Figure 10f and Figure 11f) both in as-rolled and solution-treated alloys. In addition, small amounts of residual O phase could be found in Figure 10f, which disappeared completely in Figure 11f. Similarly, the pinning effect of O phase limited the coarsening of B2 grains, which led to smaller grain size (88 μm) in as-rolled alloy than solution-treated alloy (95 μm), as illustrated in Figure 10i and Figure 11i.
3.4.5. Comparative Analysis of Hot Workability
Figure 12 shows the true stress-true strain curves of the two Ti2AlNb alloys in the tensile test at the temperatures of 900 °C, 1000 °C and 1100 °C, and the strain rates of 0.00 s−1 and 0.1 s−1, respectively. It can be seen that the ductility of the Ti2AlNb alloys in as-rolled state was less than 82.2% (corresponding to true strain of 0.6) under the temperature of 900 °C and strain rate of 0.001s−1, which limited large plastic deformation of the Ti2AlNb alloys, such as bulk forming processes (i.e., hot forging, extrusion, etc.). Nevertheless, sheet forming processes, such as hot stamping, bending, and flow forming, could be selected in region I for the Ti2AlNb alloys. When the temperature increased to 1000 °C, the ductility of as-rolled alloy reached 125% (corresponding to true strain of 0.8) at higher strain rate of 0.1 s−1. Therefore, region II should be proper for the Ti2AlNb alloy to undertake large plastic deformation, such as forging and extrusion. Boehlert et al. investigated the forging and rolling process of three O + BCC Ti2AlNb alloys in the temperature range of 932–1000 °C, which indicates that the sub-transus processing of the Ti2AlNb alloys was feasible for obtaining uniformly refined microstructure without large prior BCC grains [33]. When the temperature reached 1100 °C, there was a decrease in the elongation of as-rolled Ti2AlNb alloys, which should be attributed to the coarsening of B2 grain at higher temperature. Therefore, region III should be inappropriate for hot processing of the present as-rolled Ti2AlNb alloy.
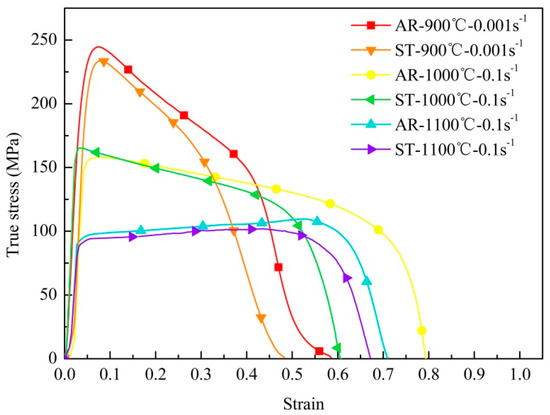
Figure 12.
Tensile stress-strain curves at different temperatures and strain rates of as-rolled (AR) and solution-treated (ST) Ti2AlNb alloy.
Noticeably, although the solution-treatment could be used to improve the ductility of the as-rolled alloy at room temperature, the solution-treated alloy exhibited inferior elongation compared to as-rolled alloy in the temperature range of 900–1100 °C. After solid solution at 980 °C for 3 h, the microstructure of Ti2AlNb alloy was coarsened evidently compared to initial as-rolled material (see Figure 1 and Figure 3), which caused lower elongation in the solution-treated alloy relative to as-rolled alloy during the hot tensile test. Besides, the pinning effect of remaining O phase and α2 phase at 1000 °C and 1100 °C, respectively, restricted the excessive growth of B2 grains in as-rolled Ti2AlNb alloy (see Figure 10 and Figure 11), which contributed to better ductility in as-rolled alloy compared to solution-treated alloy. Clearly, the as-rolled microstructure show better hot workability relative to the solution-treated microstructure for the present Ti2AlNb alloy.
4. Conclusions
The hot deformation behaviors of Ti–19Al–23Nb–0.5Mo alloy with as-rolled and solution-treated microstructures were investigated using isothermal compression experiment in the temperature range of 900–1100 °C and strain rate range from 0.001–10 s−1, based on which the hot processing maps were established and the hot workability was evaluated for the Ti2AlNb alloy with different microstructures. The main conclusions can be drawn as follows:
(1) The as-rolled Ti2AlNb alloy mainly consisted of lamellar B2/O phases, equiaxed α2, B2, and rim-O phases in the as-rolled state. After solution treated at 950 °C and 1050 °C, the lamellar O phase and equiaxed α2 phase disappeared successively. The microstructure of as-rolled Ti2AlNb alloy transformed into coarsened B2 grain and spheroidized α2 phase after solid solution at 980 °C for 3 h, which increased the ductility and decreased the strength of the Ti2AlNb alloy.
(2) Under the temperature range of 900–1050 °C, the as-rolled alloy showed higher peak flow stress compared with the solution-treated alloy. With the increase of deformation temperature, the reduction of lamellar O phase and equiaxed α2 phase accelerated the decreasing of flow stress in the as-rolled alloy and thus minimized the peak stress difference between the two Ti2AlNb alloys. When the temperature increased to 1100 °C, the solution-treated alloy even exhibited a higher peak flow stress relative to the as-rolled alloy probably because larger grain size in the solution-treated alloy could result in less internal grain boundaries and thus hinder grain boundary slip more strongly at high temperature.
(3) Four constitutive equations were formulated to describe the flow stress of as-rolled and solution-treated alloy, respectively, as a function of deformation temperature and strain rate. The deformation activation energy were calculated to be 727 and 594 kJ/mol during 900–1000 °C and 1000–1100 °C, respectively, for as-rolled alloy. Correspondingly, the activation energy was reduced to 510 and 470 kJ/mol, respectively, for solution-treated alloy.
(4) Two processing maps based on the Prasad’s instability criterion were developed for as-rolled and solution-treated alloy, respectively. The sheet forming process could be conducted in region I (near 900 °C/0.001 s−1) due to the occurrence of dynamic recrystallization, and large plastic deformation, such as forging and extrusion, could be carried out in region II (near 1000 °C/0.1 s−1) due to the high elongation of Ti2AlNb alloy. When the strain rate increased higher than 1.0 s−1, the material exhibited flow instability associated with the adiabatic shear bands and flow localization, which should be avoided during hot processing.
(5) Although the solution-treatment could be used to improve the ductility of the as-rolled alloy at room temperature, the solution-treated alloy exhibited inferior elongation compared to as-rolled alloy in the temperature range of 900–1100 °C. The as-rolled microstructure show better hot workability at high temperature relative to the solution-treated microstructure for the Ti2AlNb alloy.
Author Contributions
W.X. conceived and designed the experiments; X.Z. and S.W. performed the experiments; W.X. and S.W. analyzed the data and wrote the paper; D.S. and Z.Y. provided guidance and all sorts of support during the work.
Acknowledgments
This work is supported by the National Natural Science Foundation of China (No. 51775137).
Conflicts of Interest
The authors declare no conflict of interest.
References
- Dey, S.R.; Roy, S.; Suwas, S.; Fundenberger, J.J.; Ray, R.K. Annealing response of the intermetallic alloy Ti–22Al–25Nb. Intermetallics 2010, 18, 1122–1131. [Google Scholar] [CrossRef]
- Gogia, A.K.; Nandy, T.K.; Banerjee, D.; Carisey, T.; Strudel, J.L.; Franchet, J.M. Microstructure and mechanical properties of orthorhombic alloys in the Ti-Al-Nb system. Intermetallics 1998, 6, 741–748. [Google Scholar] [CrossRef]
- Jia, J.; Zhang, K.; Liu, L.; Wu, F. Hot deformation behavior and processing map of a powder metallurgy Ti–22Al–25Nb alloy. J. Alloys Compd. 2014, 600, 215–221. [Google Scholar] [CrossRef]
- Xue, C.; Zeng, W.; Xu, B.; Liang, X.; Zhang, J.; Li, S. B2 grain growth and particle pinning effect of Ti-22Al-25Nb orthorhombic intermetallic alloy during heating process. Intermetallics 2012, 29, 41–47. [Google Scholar] [CrossRef]
- Shen, J.; Feng, A. Recent advances on microstructural controlling and hot forming of Ti2AlNb-based alloys. Acta Metall. Sin. 2013, 49, 1286–1294. [Google Scholar] [CrossRef]
- Bendersky, L.A.; Roytburd, A.; Boettinger, W.J. Phase transformations in the (Ti, Al)3 Nb section of the Ti-Al-Nb system—I. Microstructural predictions based on a subgroup relation between phases. Acta Metall. Mater. 1994, 42, 2323–2335. [Google Scholar] [CrossRef]
- Muraleedharan, K.; Nandy, T.K.; Banerjee, D.; Lele, S. Transformations in a Ti-24Al-15Nb alloy: Part II. A composition invariant βo → O transformation. Metall. Trans. A 1992, 23, 417–431. [Google Scholar] [CrossRef]
- Wang, W.; Zeng, W.; Xue, C.; Liang, X.; Zhang, J. Microstructure control and mechanical properties from isothermal forging and heat treatment of Ti–22Al–25Nb (at.%) orthorhombic alloy. Intermetallics 2015, 56, 79–86. [Google Scholar] [CrossRef]
- Boehlert, C.J.; Miracle, D.B. Part II. The creep behavior of Ti-Al-Nb O + Bcc orthorhombic alloys. Metall. Mater. Trans. A 1999, 30, 2349–2367. [Google Scholar] [CrossRef]
- Chen, X.; Weidong, Z.; Wei, W.; Xiaobo, L.; Jianwei, Z. Coarsening behavior of lamellar orthorhombic phase and its effect on tensile properties for the Ti–22Al–25Nb alloy. Mater. Sci. Eng. A 2014, 611, 320–325. [Google Scholar] [CrossRef]
- Khadzhieva, O.G.; Illarionov, A.G.; Popov, A.A. Effect of aging on structure and properties of quenched alloy based on orthorhombic titanium aluminide Ti2AlNb. Phys. Met. Metall. 2014, 115, 12–20. [Google Scholar] [CrossRef]
- Emura, S.; Araoka, A.; Hagiwara, M. B2 grain size refinement and its effect on room temperature tensile properties of a Ti–22Al–27Nb orthorhombic intermetallic alloy. Scr. Mater. 2003, 48, 629–634. [Google Scholar] [CrossRef]
- Wei, W.; Weidong, Z.; Chen, X.; Xiaobo, L.; Jianwei, Z. Designed bimodal size lamellar o microstructures in Ti2AlNb based alloy: Microstructural evolution, tensile and creep properties. Mater. Sci. Eng. A 2014, 618, 288–294. [Google Scholar] [CrossRef]
- Xia, X.; Chen, Q.; Zhang, K.; Zhao, Z.; Ma, M.; Li, X.; Li, Y. Hot deformation behavior and processing map of coarse-grained Mg–Gd–Y–Nd–Zr alloy. Mater. Sci. Eng. A 2013, 587, 283–290. [Google Scholar] [CrossRef]
- Xia, X.; Chen, Q.; Huang, S.; Lin, J.; Hu, C.; Zhao, Z. Hot deformation behavior of extruded Mg–Gd–Y–Nd–Zr alloy. J. Alloys Compd. 2015, 644, 308–316. [Google Scholar] [CrossRef]
- Quast, J.P.; Boehlert, C.J. Comparison of the microstructure, tensile, and creep behavior for Ti-24Al-17Nb-0.66Mo (atomic percent) and Ti-24Al-17Nb-2.3Mo (atomic percent) alloys. Metall. Mater. Trans. A 2007, 38, 529–536. [Google Scholar] [CrossRef]
- Boehlert, C.J.; Majumdar, B.S.; Seetharaman, V.; Miracle, D.B. Part I. The microstructural evolution in Ti-Al-Nb O+Bcc orthorhombic alloys. Metall. Mater. Trans. A 1999, 30, 2305–2323. [Google Scholar] [CrossRef]
- Jin, Z.; Cui, Z. Investigation on dynamic recrystallization using a modified cellular automaton. Comput. Mater. Sci. 2012, 63, 249–255. [Google Scholar] [CrossRef]
- Xu, W.; Jin, X.; Shan, D.; Chai, B. Study on the effect of solution treatment on hot deformation behavior and workability of Mg-7Gd-5Y-0.6Zn-0.8Zr magnesium alloy. J. Alloys Compd. 2017, 720, 309–323. [Google Scholar] [CrossRef]
- Zhang, Y.; Jiang, S.; Liang, Y.; Hu, L. Simulation of dynamic recrystallization of NiTi shape memory alloy during hot compression deformation based on cellular automaton. Comput. Mater. Sci. 2013, 71, 124–134. [Google Scholar] [CrossRef]
- Ma, X.; Zeng, W.; Xu, B.; Sun, Y.; Xue, C.; Han, Y. Characterization of the hot deformation behavior of a Ti–22Al–25Nb alloy using processing maps based on the murty criterion. Intermetallics 2012, 20, 1–7. [Google Scholar] [CrossRef]
- Sherby, O.D.; Taleff, E.M. Influence of grain size, solute atoms and second-phase particles on creep behavior of polycrystalline solids. Mater. Sci. Eng. A 2002, 322, 89–99. [Google Scholar] [CrossRef]
- Appel, F.; Christoph, U.; Oehring, M. Creep deformation in two-phase titanium aluminide alloys. Mater. Sci. Eng. A 2002, 329, 780–787. [Google Scholar] [CrossRef]
- Tang, F.; Nakazawa, S.; Hagiwara, M. The effect of quaternary additions on the microstructures and mechanical properties of orthorhombic Ti2AlNb-based alloys. Mater. Sci. Eng. A 2002, 329, 492–498. [Google Scholar] [CrossRef]
- Prasad, Y.V.R.K.; Seshacharyulu, T. Processing maps for hot working of titanium alloys. Mater. Sci. Eng. A 1998, 243, 82–88. [Google Scholar] [CrossRef]
- Srinivasan, N.; Prasad, Y.V.R.K.; Rama Rao, P. Hot deformation behaviour of Mg–3Al alloy—A study using processing map. Mater. Sci. Eng. A 2008, 476, 146–156. [Google Scholar] [CrossRef]
- Sivakesavam, O.; Prasad, Y.V.R.K. Hot deformation behaviour of as-cast Mg–2Zn–1Mn alloy in compression: A study with processing map. Mater. Sci. Eng. A 2003, 362, 118–124. [Google Scholar] [CrossRef]
- Rao, K.P.; Prasad, Y.V.R.K.; Suresh, K. Hot working behavior and processing map of a γ-tial alloy synthesized by powder metallurgy. Mater. Des. 2011, 32, 4874–4881. [Google Scholar] [CrossRef]
- Sarebanzadeh, M.; Mahmudi, R.; Roumina, R. Constitutive analysis and processing map of an extruded Mg–3Gd–1Zn alloy under hot shear deformation. Mater. Sci. Eng. A 2015, 637, 155–161. [Google Scholar] [CrossRef]
- Karami, M.; Mahmudi, R. Hot shear deformation constitutive analysis and processing map of extruded Mg–12Li–1Zn Bcc alloy. Mater. Des. 2014, 53, 534–539. [Google Scholar] [CrossRef]
- Li, A.B.; Huang, L.J.; Meng, Q.Y.; Geng, L.; Cui, X.P. Hot working of Ti–6Al–3Mo–2Zr–0.3Si alloy with lamellar α+β starting structure using processing map. Mater. Des. 2009, 30, 1625–1631. [Google Scholar] [CrossRef]
- Poletti, C.; Degischer, H.P.; Kremmer, S.; Marketz, W. Processing maps of Ti662 unreinforced and reinforced with TiC particles according to dynamic models. Mater. Sci. Eng. A 2008, 486, 127–137. [Google Scholar] [CrossRef]
- Boehlert, C.J. The effects of forging and rolling on microstructure in O + Bcc Ti-Al-Nb alloys. Mater. Sci. Eng. A 2000, 279, 118–129. [Google Scholar] [CrossRef]
© 2018 by the authors. Licensee MDPI, Basel, Switzerland. This article is an open access article distributed under the terms and conditions of the Creative Commons Attribution (CC BY) license (http://creativecommons.org/licenses/by/4.0/).