Abstract
This study investigates the solution and artificial aging processes of TiB2/7050 composites. Using microscopic and mechanical tests, we systematically evaluate the material’s microstructural evolution and mechanical performance, aiming to optimize heat treatment parameters. The study shows that a solution temperature of 475 °C for 1 h is optimal for fully dissolving the second-phase particles. Regarding artificial aging, peak hardness of 246 HV is achieved at 140 °C for 16 h. Analysis of the phases and microstructure in O and T6-states shows that strengthening occurs through grain boundary hardening and precipitation hardening. The effect of TiB2 particles on the above process was also explored. During solidification, TiB2 particles were pushed by the advancing solid–liquid interface and primarily distributed along grain boundaries. This distribution subsequently slowed the solid solution process by reducing the contact area between the η(MgZn2) phase and the α(Al) matrix. During aging, they enhance grain boundary precipitates (GBPs) in particle-rich regions and inhibit the formation of precipitate-free zones (PFZs), with a concentration of the η’ phase forming around the particles. Beyond a certain distance from the particles, there is a decrease in η’ phase concentration. This study is expected to contribute to advanced lightweight materials research and development, opening up new opportunities for their application in various industries.
1. Introduction
Particle-reinforced aluminum matrix composites are advanced materials in which reinforcement particles (such as Al2O3, B4C, TiB2, and Ti2O3) with higher strength than the matrix are embedded in traditional aluminum alloys [1,2,3,4,5]. These composites offer excellent mechanical properties, including high modulus, strength, wear resistance, and fatigue resistance, making them ideal for applications in demanding fields [6,7,8]. Specifically, 7xxx (Al–Zn–Mg–Cu) series aluminum matrix composites are commonly used in aerospace and automotive industries [9,10,11,12,13]. Compared with other reinforced particles, TiB2 exhibits regular morphology and eminent thermal stability [14,15,16]. Ma et al. [17] studied the microstructure and mechanical properties of 7050 composites with the addition of 6 wt% TiB2-reinforced particles. They found that the average grain size decreased from 17.28 μm to 6.56 μm. The elastic modulus, yield strength, ultimate tensile strength, and fatigue limit of the composite were all higher than those of the unreinforced alloy. Sun et al. [18] investigated the effects of TiB2 particles on the mechanical properties and second-phase precipitation of the 7055 aluminum alloy. They found that these particles could alter the precipitation behavior during the aging process, resulting in interfacial precipitates, discontinuously distributed grain boundary precipitates, and narrower non-precipitation zones. By adding these particles, an excellent combination of mechanical properties and corrosion resistance was achieved. Xu et al. [19] used in situ synthesis of nanoparticles and extrusion methods to fabricate a high-strength aluminum-based composite drill pipe and investigated the effects of precipitates and TiB2 particles on the microstructure, mechanical properties, and intergranular corrosion (IGC) of the TiB2/7055 composite tube. After double-stage aging and reverse aging treatments, the precipitates were separated, and their size increased. Li et al. [20] found that the triple connection points coexisting with TiB2 and the precipitates with a diameter larger than 2 μm would, together with TiB2, promote the recrystallization process caused by the particles.
As a heat-treatable reinforced alloy, the Al–Zn–Mg–Cu alloy can be modified by adjusting the solution and aging precipitation sequence. Similarly, appropriate heat treatment can also significantly improve the mechanical properties to maximize the potential of TiB2/Al–Zn–Mg–Cu composites. A typical heat treatment of TiB2/Al–Zn–Mg–Cu composites mainly includes solution and artificial aging processes, in which Zn and Mg elements play a reinforcing role [21], and TiB2 particles do not change the precipitation sequence of solid solution → Guinier Preston (GP) zones → metastable η’ phase → stable η phase [22,23]. So, many researchers have adopted solution and artificial aging parameters of TiB2/Al–Zn–Mg–Cu composites that are same with those of Al–Zn–Mg–Cu. In [17], the TiB2/7050 composites and the unreinforced 7050 alloy were subjected to the same T6 treatment (477 °C/70 min + water quench + 120 °C/24 h). Chen et al. [24] used the same solution and artificial aging parameters to analyze different TiB2/7055 composites. They found that the elastic modulus, as well as the yield strength and the ultimate tensile strength, increased, while the ductility decreased with the weight fraction of TiB2 particles increasing. Yang et al. [25] proposed a new powder metallurgy routine to fabricate an Al–9Zn–2.5Mg–2.4Cu alloy and five different TiB2/Al–Zn–Mg–Cu composites, all of which were solution-treated at 475 °C for 1 h and aged at 120 °C for 24 h.
TiB2/Al–Zn–Mg–Cu composites exhibit more complex microstructures, higher dislocation densities, and a more intricate distribution of dislocations compared with the matrix material. These factors influence the solution and artificial aging processes. In order to reduce the influence of reinforcement particles and improve the solubility of the second phase, most researchers choose to increase the solution temperature. Yang et al. [26] researched the effect of different solution temperatures (465, 470, 475, 480, 485, 490 °C/1 h + water quench + 120 °C/20 h) on the microstructure and properties of TiB2/7050 composites. The results showed that an optimal combination of strength and plasticity could be achieved when the TiB2/7050 composite was subjected to a solution treatment at 480 °C. Some researchers also choose to increase the solution time. However, as the soaking time increases, the grain size also grows, thereby weakening the fine-grain strengthening effect of the material. Cheneke et al. [27] studied the influence of solution treatment on the aging behavior and mechanical properties of TiB2/2024 aluminum-based composites. The results showed that the optimal soaking time was 2.5 h, which could achieve the best aging precipitation kinetics and peak hardness. When the soaking time was less than 2.5 h, the precipitates were not completely dissolved, and the hardness decreased. However, when the soaking heat treatment time exceeded 2.5 h, the aging precipitation rate further accelerated, but due to the growth of the matrix grains, the hardness decreased instead. Chen et al. [28] proposed a new solution treatment process of the 4 wt% TiB2/Al–Zn–Mg–Cu composite by introducing an electropulsing-assisted solution (EAS). Compared with traditional solution treatment (TST, 475 °C/2 h + water quench), the adjusted EAS process can achieve rapid dissolution and high supersaturation without overburning. It is noted that through EAS treatment, both strength and elongation are enhanced compared with TST. After solution treatment, common methods to relieve internal stresses in materials include natural aging, artificial aging, and vibration aging. Selecting the appropriate aging temperature and time is crucial. Hao et al. [29] studied the artificial aging parameters of 12 wt% TiB2/7055 composites after a solution treatment at 460 °C for 1 h. They showed that the elastic modulus, yield strength, ultimate tensile strength, and elongation had their own unique artificial aging behavior to reach the peak. The elastic modulus reached its peak at 86 GPa after aging at 90 °C for 28 h, the yield strength peaked at 690 MPa after aging at 120 °C for 24 h, the ultimate tensile strength peaked at 718 MPa after aging at 120 °C for 28 h, and the elongation peaked at 4.2% after aging at 90 °C for 28 h. Therefore, a reasonable aging parameter should be selected to maximize the unique performance of this composite. Zhang et al. [30] studied the effect of artificial aging time (470 °C/1 h + ice water quench + 120 °C/0~120 h) on the mechanical properties of the TiB2/7075 composite, which reached peak aging after 36 h with a hardness of 170.9 HV and a strength of 594 MPa. The 7075 alloy reached peak aging only after 24 h, with a hardness of 169.6 HV and a strength of 561 MPa. Shen [31] obtained the optimal solution treatment for the Al–11Zn–2.0Mg–1.2Cu–0.12Zr–0.2Sc alloy; 2 wt.% and 5 wt.% TiB2/Al–Zn–Mg–Cu composites are 465 °C/1 h, 465 °C/1.5 h, and 465 °C/2.5 h, respectively. Meanwhile, the peak aging parameters of these three materials were obtained as 120 °C/20 h, 120 °C/18 h, and 120 °C/16 h, and the peak hardness achieved was 212 HV, 232 HV, and 254 HV, respectively.
Studies that specifically focus on the solution and artificial aging behavior of this composite remain limited. In particular, the effects of TiB2 reinforcement particles on precipitation behavior and interfacial structure evolution during aging have not been fully elucidated. The addition of TiB2 particles changes the material’s deformation behavior by altering atomic diffusion paths and increasing microstructural complexity, which increases the dislocation density and enhances the recrystallization driving force. Secondly, particles cause dislocation proliferation and thereby induce recrystallization nucleation, which is a typical particle-stimulated nucleation (PSN) mechanism [20]. Li et al. [32] investigated the microstructure and corrosion resistance of TiB2 particle-reinforced Al-Zn-Mg-Cu composites under the influence of particle distribution and anodization time. They characterized and discussed the relationships among TiB2 particle distribution, anodization time, coating growth patterns, and corrosion resistance. These changes can enhance certain properties; they also impact the material’s interface and dislocation structure. Hence, the microstructure evolution during the solution and aging of TiB2/7050 composites is more complex, which consequently causes the variation of mechanical properties. A systematic understanding of these mechanisms is of both theoretical and practical importance, as it is essential for optimizing heat treatment schedules and facilitating the large-scale production and application of these advanced composites. Therefore, the present study aims to systematically investigate the solution and artificial aging processes of TiB2/7050 composites, with emphasis on the role of TiB2 particles in modifying precipitation kinetics and interfacial microstructure.
In the present study, a comprehensive study was conducted on the solution and artificial aging processes of the TiB2/7050 composite. The secondary phases, grain structure, precipitation behavior, and interfacial microstructure under various parameters were examined. The mechanical tests were carried out to obtain the variation of yield strength, ultimate tensile strength, hardness, and elongation. The effects of TiB2 particles on the precipitation kinetics during the artificial aging process were discussed, and the formation of interfacial microstructure was explained in detail.
2. Materials and Methods
The material studied is a hot-extruded TiB2/7050 particle-reinforced aluminum matrix composite, provided by Southwest Aluminum (Group) Co., Ltd., Chongqing, China [33], and intended for aerospace structural applications. It was prepared through an exothermic reaction involving mixed salts of K2TiF6 and KBF4, which were added to an aluminum alloy 7050 solution to generate TiB2 particles at 850 °C. The mixture was stirred with a blade paddle mixer for 20 min before the slag was completely removed. The melt was then cast into a permanent mold to produce the ingot. Finally, at a temperature of 420 °C, the material was extruded at a ratio of 30:1 and processed into T-shaped structural steel. The chemical composition of the TiB2/7050 composite is provided in Table 1.

Table 1.
Chemical composition of the investigated TiB2/7050 particle-reinforced aluminum matrix composites, wt.%.
Based on the densities of the 7050 aluminum matrix and TiB2 particles, the calculated volume fraction of TiB2 is approximately 3.48 vol.%.
Using Wire Electrical Discharge Machining (Wire EDM), manufactured by NOVICK Digital Equipment Co., Ltd., Beijing, China, tensile specimens, hardness specimens, EBSD specimens, and other samples were extracted from the reinforcing ribs of the T-shaped base, as illustrated in Figure 1a. The tensile specimens were oriented with their longitudinal axis parallel to the extrusion direction to evaluate the mechanical properties along the primary working direction. The characteristics of the samples will be specified later. Phase identification was performed at a scanning speed of 4°/min. The electron backscatter diffraction instrument (EBSD), manufactured by Bruker Corporation, Billerica, MA, USA, is a sophisticated analytical device that integrates a focused ion beam dual-beam system. Its core functions include phase identification, grain orientation analysis, boundary characteristic detection, and three-dimensional crystallographic reconstruction. All these samples have undergone the heat treatment process, as shown in Figure 1b, including both the original state samples and the samples that have undergone heat treatment. They are classified into four main categories based on different solute soaking times, solute soaking temperatures, artificial annealing temperatures, and artificial annealing times, as shown in the first row of Table 2. Only the solute soaking temperature varies. The other three variables remain unchanged, namely, the heat treatment conditions being a solute soaking temperature of 475 ± 10 °C, a solute soaking time of 60 min, an artificial annealing temperature of 140 °C, and an artificial annealing time of 16 h. The three samples are combined into one group, and a total of three groups are formed. Then, they undergo heat treatment using the same muffle furnace. Therefore, the heat treatment process includes a 60 min ± 10 min solute soaking at a temperature of 475 ± 10 °C, followed by water quenching to room temperature, a 16 h ± 1 h artificial annealing at a temperature of 140 ± 10 °C, and finally, air quenching. Both the two-step heat treatment processes use a slow cooling furnace. The heat treatment parameters of the samples are shown in Table 2. These parameters were selected based on the standard heat treatment procedures for AA7050 in previous studies [34,35,36] and DSC results. Differential scanning calorimetry is used to measure the relationship between the difference in heat flow or heat power between the sample end and the reference end of a sample at a certain atmosphere and programmed temperature over time. It is mainly applied to measure parameters such as the specific heat capacity, fusion enthalpy, and crystallinity of substances.
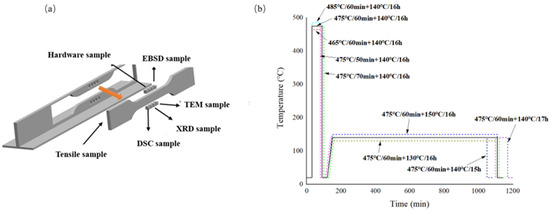
Figure 1.
Schematics of the (a) positions of samples extracted from the TiB2/7050 composite stringer and (b) heat treatment comprising solution and artificial aging.
Table 2.
Heat treatment parameters of samples.
The solution temperature was determined by differential scanning calorimetry (DSC). A sample measuring 3 mm × 3 mm × 3 mm was mechanically polished, cleaned with alcohol, and dried before testing. The DSC analysis was performed using an aluminum crucible over a temperature range of 0–600 °C, and the resulting DSC curve is shown in Figure 2. The low melting point phase in the Al-Zn-Mg-Cu series aluminum alloy is (α(Al) + η(MgZn2) + S(Al2CuMg) + ω(Al7CuFe)). Within the temperature range of 20 °C to 600 °C, the material undergoes five thermal reactions: Exothermic reaction A corresponds to the formation of the GP zone; Endothermic reaction B corresponds to the dissolution of the GP zone; Exothermic reaction C corresponds to the significant precipitation of the S phase; Endothermic reaction D corresponds to the dissolution of the S phase; and Endothermic reaction E corresponds to the melting of the low melting point structure. Between points D and E, there is a change in the slope of the DSC curve at 475 °C. However, since there are no obvious peaks, it can be determined that the starting temperature of Endothermic reaction E is approximately 475 °C. Therefore, the selection of the solid solution temperature test point is based on 475 ± 10 °C [37,38].
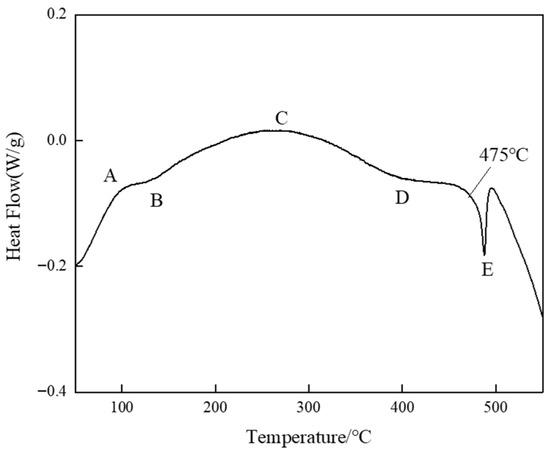
Figure 2.
DSC curve of TiB2/7050 composites.
For microstructural analysis, samples were polished with SiC paper and a polishing machine using a 0.5 μm diamond spray to achieve a mirror finish, followed by argon ion polishing to remove the stress layer. Microstructural observations were made with a Tescan Maia3 SEM (model 2016), manufactured by TESCAN Group, a.s., Brno, Czech, equipped with a EBSD module. Scanning electron microscopy (SEM) is a means of observation that lies between transmission electron microscopy and optical microscopy, using an operating voltage of 20 kV and a step size of 0.25 μm. Channel5 V5.12 was used to analyze grain size, recrystallized fraction distribution, and phase distribution. Electron backscatter diffraction (EBSD) analysis was carried out with a step size of 0.25 μm. Since the average size of the TiB2 reinforcing particles is approximately 0.62 μm, the width of the particle deformation zone (PDZ) around such particles in the aluminum-based composite material is typically in the nanometer range [39]. Therefore, a step size of 0.25 μm can ensure sufficient spatial resolution sampling of the particle/substrate interface area and its related local strain gradients to detect their presence and their impact on the microstructure evolution while still being able to map the overall grain structure with statistically representative characteristics.
Additionally, to examine the finer microstructure, a 3 mm diameter disc sample with a thickness of 0.1 mm was prepared. This disc was thinned using a Struers TenuPol-5 dual-jet electro-polisher with an electrolyte mixture of 7% perchloric acid and 93% ethanol at a voltage of 25 V. Ion thinning was then conducted using a Leica RES102 ion thinning instrument with settings of 1.0 kV and 0.6 mA for 30 min. The final microstructure was observed with a JEOL JEM-2100F transmission electron microscope, manufactured by JEOL Ltd, Tokyo, Japan..
The material hardness was measured using an HVS-5BZD Vickers hardness tester, manufactured by Jinan Hensgrand Instrument Co., Ltd., Jinan, China, with a maximum load of 5.0 kgf. Five random points were tested on each specimen, and the final hardness value was calculated as the arithmetic mean of these measurements.
For tensile testing, we followed the ASTM E8/E8M-21 standard for metallic materials at room temperature [40]. An MTS E45.305 electronic universal testing machine, manufactured by MTS Systems (China) Co., Ltd., Shanghai, China, with a maximum load of 300 kN was used. The tensile specimens were 5 mm thick, with a gauge length of 50 mm and a width of 12.5 mm, as shown in Figure 3. The reported tensile results are the arithmetic mean values obtained from three specimens.

Figure 3.
Standard tensile sample size.
The cross-section of each tensile specimen was cut using the Wire Electrical Discharge Machining machine (Wire EDM). After cleaning and drying with alcohol, the fracture morphology was examined using a Tescan VEGATS5136 scanning electron microscope, manufactured by TESCAN Group, a.s., Brno, Czech.
The microstructure of the unheat-treated O-state TiB2/7050 composite material obtained through the hot extrusion process is shown in Figure 4. The TiB2 particles are mostly hexagonal or quadrilateral in shape, and they are uniformly and dispersedly distributed in the matrix. However, in some areas, there are certain agglomeration phenomena, which are an inevitable microstructure feature when the mixed salt reaction technology generates TiB2 particles.
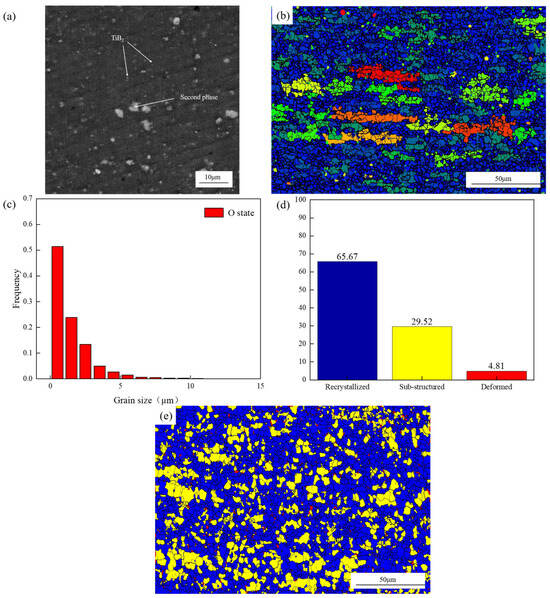
Figure 4.
Microscopic characteristics of O-state TiB2/7050 composite material: (a) SEM microscopic morphology; (b) EBSD grain size distribution map; (c) frequency statistics of grain size; (d) size of the recrystallized grains graph; (e) recrystallization ratio statistical.
The grain size distribution of the O-state hot extruded TiB2/7050 particle-reinforced aluminum matrix composite is shown in Figure 4b,c. The average grain size (excluding TiB2) is 1.25 μm, and the average size of TiB2 particles is 0.62 μm. The grains are distributed in a parallel manner to the extrusion direction and are accompanied by fine equiaxed grains between the larger ones. This is because the second-phase types of the Al-Zn-Mg-Cu series aluminum alloy are diverse and numerous, and after adding reinforcing particles, the dislocation density and distortion energy are further increased, breaking through the obstruction of the high misfit energy of aluminum alloys. During the hot extrusion process, most grains exhibit dynamic recovery and dynamic recrystallization. The recrystallization grain distribution of the O-state hot extruded TiB2/7050 particle-reinforced aluminum matrix composite is shown in Figure 4d,e. The fraction of recrystallization microstructure during the hot extrusion process is 65.67%. This is because in the high-temperature environment of hot extrusion of deformed aluminum alloys, the atomic diffusion ability is enhanced, and a large number of grains that were elongated and broken during the extrusion process are re-nucleated and grow into a uniform and fine recrystallized structure. According to Wang et al. [41], it is also indicated that TiC/TiB2 and other reinforcing particles can promote the refinement of the matrix aluminum alloy grains during solidification.
Figure 5 shows the engineering stress–engineering strain curves of the O-state TiB2/7050 particle-reinforced aluminum matrix composites that have undergone the hot extrusion process but have not undergone heat treatment, with a thickness of 5 mm. The average mechanical parameters are shown in Table 3.
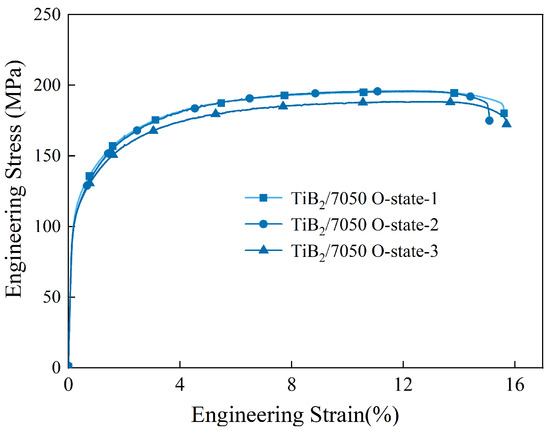
Figure 5.
The engineering stress–engineering strain curve of the O-state TiB2/7050 composite material.
Table 3.
The tensile test and hardness test results of the O-state TiB2/7050 composite material.
3. Results and Discussion
3.1. Effect of Solution Temperature on Microstructure and Mechanical Properties of TiB2/7050 Composites
In this paper, the grain size was statistically analyzed using Channel5. For EBSD analysis, the grain definition was set as follows: a minimum of five pixels per grain was required to be identified as an independent grain, and the minimum misorientation angle between adjacent pixels to distinguish different grains was 15°. This definition is consistent with the common standard for aluminum alloy EBSD characterization [35]. Firstly, the EBSD data was imported into Channel5 software, and preprocessing operations such as noise removal, image enhancement, and image smoothing were performed. Then, accurately extract the grain boundaries, select the major axis of the detected elliptical shape, set the statistics to be conducted at intervals of 10, and render the grain size distribution map from blue to red according to the grain size from small to large. Figure 6 shows the grain size distribution of TiB2/7050 composites after artificial aging at different solution temperatures for 1 h. The average grain sizes at 465 °C, 475 °C, and 485 °C were 1.94 μm, 2.19 μm, and 1.97 μm, respectively, with maximum grain sizes of 31.63 μm, 53.72 μm, and 56.27 μm. As the solution temperature rises, the grain size does not change much, but some grains increase significantly, which weakens the strengthening effect of the fine grains. However, the sufficient dissolution of the soluble second phase and the dispersion distribution of alloy elements within the grains counteract the weakening effect.
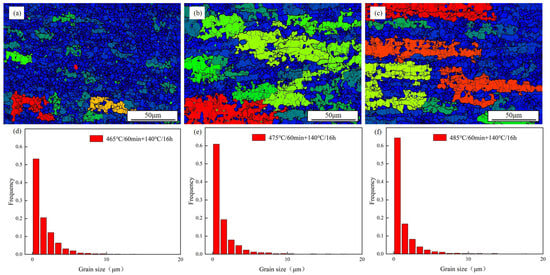
Figure 6.
EBSD maps of the TiB2/7050 composite: (a) 465 °C/60 min + 140 °C/16 h, (b) 475 °C/60 min + 140 °C/16 h, (c) 485 °C/60 min + 140 °C/16 h; grain size distribution of the TiB2/7050 composite: (d) 465 °C/60 min + 140 °C/16 h, (e) 475 °C/60 min + 140 °C/16 h, (f) 485 °C/60 min + 140 °C/16 h.
Figure 7 shows the distribution of recrystallized and non-recrystallized grains of TiB2/7050 composites at various solution temperatures. In Channel5, an average orientation difference of less than 1° was set to represent recrystallized structure, 1–7.5° to represent recovered subgrain structure, and greater than 7.5° to represent deformed structure. These thresholds are chosen based on the following physical reasoning. Grains with misorientations below 1° are considered recrystallized, as they are largely free of the dislocations and subgrain boundaries that cause lattice curvature [42]. The range of 1° to 7.5° captures the recovered substructure, where dislocations have organized into low-angle grain boundaries (LAGBs) [43]. Misorientations exceeding 7.5° indicate a significantly deformed state with a high density of geometrically necessary dislocations (GNDs). This classification is consistent with established methodologies for characterizing recrystallization in aluminum alloys and their composites, including TiB2-reinforced systems, where the presence of nanoparticles can influence but not fundamentally alter these dislocation-based definitions [14]. The recrystallization fraction initially decreased and then increased with temperature, reaching its lowest at 475 °C (35.20%).
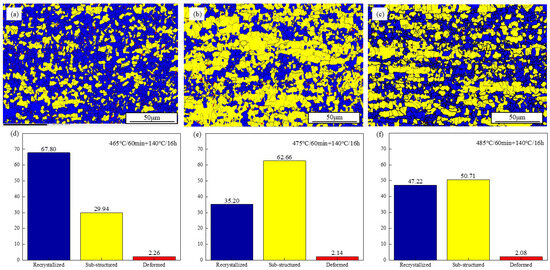
Figure 7.
Recrystallization grain distribution map of the TiB2/7050 composite: (a) 465 °C/60 min + 140 °C/16 h, (b) 475 °C/60 min + 140 °C/16 h, (c) 485 °C/60 min + 140 °C/16 h; statistics of recrystallized fraction and structure size of the TiB2/7050 composite: (d) 465 °C/60 min + 140 °C/16 h, (e) 475 °C/60 min + 140 °C/16 h, (f) 485 °C/60 min + 140 °C/16 h.
As shown in Figure 8a, the O-state material contains a large number of coarse second phases (MgZn2). These coarse second phases are usually generated through casting or hot extrusion processes. After solid solution treatment, the second phases dissolve, but the TiB2 particles still exist in the form of aggregates. The aggregates are prone to causing cracks when subjected to external forces. As can be seen from Figure 8a,e, the maximum diameter of the soluble second phase in the O-state structure is 2.76 μm, the average diameter is 0.55 μm, and the volume fraction is 2.8%. After solid solution treatment, the proportion of the soluble second phase decreases rapidly, and at 475 °C, the proportion of the soluble second phase has dropped to 0.00113%. During the solid solution treatment process, the second phases dissolve, thereby reducing the size and volume fraction of these phases to improve the material’s properties.
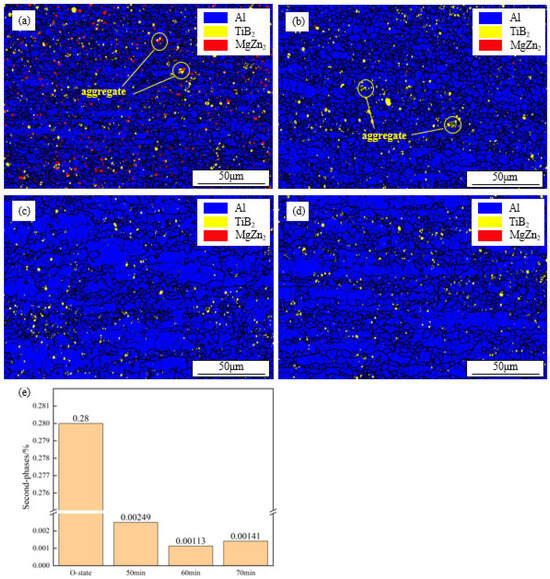
Figure 8.
Phase distribution of (a) O-state, (b) 465 °C/60 min + 140 °C/16 h, (c) 475 °C/60 min + 140 °C/16 h, (d) 485 °C/60 min + 140 °C/16 h, and (e) statistical diagram of MgZn2 phase proportion.
Figure 9a,b show the changes in the mechanical properties of TiB2/7050 composites after heat treatment at different solution temperatures. The solution and artificial aging significantly improved these properties, with yield strength (Rp0.2) increasing from 117.8 MPa to 577.6 MPa and ultimate tensile strength (Rm) rising from 197.5 MPa to 619.1 MPa. As the solution temperature increased from 465 °C to 485 °C, both yield strength and ultimate tensile strength first decreased and then increased, while elongation increased and then decreased. Figure 9c illustrates the hardness changes at different solution temperatures. After solution treatment at 475 °C for 1 h and artificial aging at 140 °C for 16 h, the hardness reached a peak of 246 HV. However, at 485 °C, hardness decreased due to the melting of low melting point phases in the microstructure. When the solution temperature is lower than 475 °C, the second phase is not fully dissolved, and the solution strengthening effect is not obvious, resulting in the hardness of the sample at 465 °C being lower than that of the sample at 475 °C. When the solution temperature was raised to 475 °C, the second phase of the sample had completely dissolved. The increase in strength brought about by solution strengthening remains unchanged, while the growth of grains leads to a weakening of the fine-grain strengthening effect, thus causing the hardness of the sample at 485 °C to slightly decrease compared to that at 475 °C.
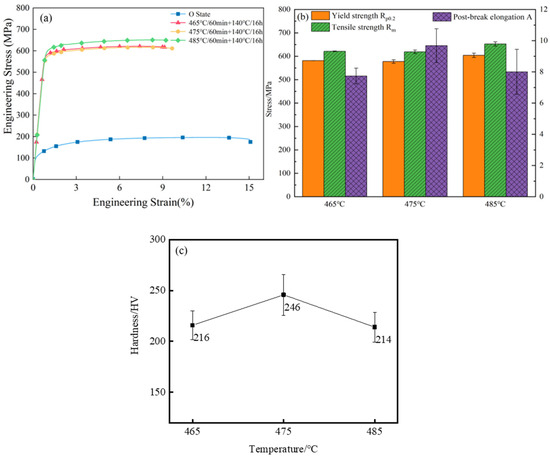
Figure 9.
(a) Engineering stress–engineering strain curves of samples, (b) changes of mechanical properties of TiB2/7050 composites, (c) hardness changes of TiB2/7050 composites at different solution temperatures: 465 °C, 475 °C, 485.
The tensile fracture microstructure of TiB2/7050 composites at different solution temperatures is shown in Figure 10. In the O-state, the fracture surface exhibited both brittle and plastic zones, with microporous aggregation being the dominant fracture mode. The equiaxial dimples and numerous spheroidal second-phase particles were visible (Figure 10a,b). After solution and artificial aging, the spherical second-phase particles dissolved into the matrix, eliminating them from the fracture surface (Figure 10c–e). At a solution temperature of 475 °C, the fracture surface exhibited a mixed morphology. While some regions displayed features resembling a herringbone pattern—likely arising from the influence of TiB2 particle clusters on crack propagation paths—the dominant fracture mechanism remained ductile microvoid coalescence, as evidenced by the widespread presence of fine, equiaxed dimples. (Figure 10f). As the solution temperature increased from 465 °C to 475 °C, the dimples grew in size, improving plasticity (Figure 10b,d). However, at 485 °C, cracks appeared, and the dimples became smaller and shallower with fewer tearing edges (Figure 10h,i). This was due to the transformation of the second-phase particles and low melting point structures into a liquid phase, which sped up the solid solution process. While this improved solid solution, incomplete dissolution at 485 °C led to the formation of voids, which could cause cracks under tensile stress, reducing plasticity. In contrast, fully dissolved aggregates enhanced material hardness and acted as strengthening phases, improving mechanical properties. Therefore, when the solution temperature exceeds the eutectic point, the complete dissolution of the second-phase particles enhances the solid solution strengthening effect.
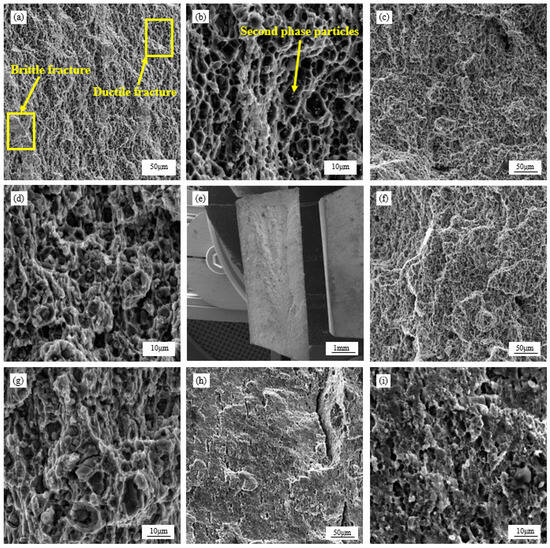
Figure 10.
SEM images of the TiB2/7050 composite tensile fracture at (a,b) O-state, (c–e) 465 °C/60 min + 140 °C/16 h, (f,g) 475 °C/60 min + 140 °C/16 h, and (h,i) 485 °C/60 min + 140 °C/16 h.
3.2. Effect of Solution Time on Microstructure and Mechanical Properties of TiB2/7050 Composites
Figure 11 shows the grain size distribution of the TiB2/7050 composite material after artificial aging treatment under the condition of the same solution temperature but different solution times. As solution time increased, the average grain size rose. Particularly, after 70 min, the average grain size reached 2.11 μm, with 32.99% of grains exceeding this size. During the solid solution process, the second-phase at grain boundaries dissolved, promoting atomic diffusion and incorporating alloying elements into the matrix, leading to increased strength.
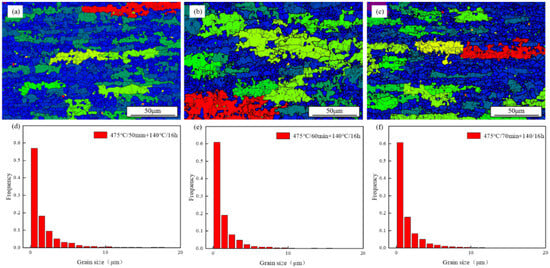
Figure 11.
EBSD maps of the TiB2/7050 composite: (a) 475 °C/50 min + 140 °C/16 h, (b) 475 °C/60 min + 140 °C/16 h, (c) 475 °C/70 min + 140 °C/16 h; grain size distribution of the TiB2/7050 composite: (d) 475 °C/50 min + 140 °C/16 h, (e) 475 °C/60 min + 140 °C/16 h, (f) 475 °C/70 min + 140 °C/16 h.
Figure 12 shows the change in recrystallization with solution time; the proportion of recrystallization structure first decreased and then increased. After hot extrusion, the material exhibits a deformed structure with a high dislocation density. During solution treatment, the elevated temperature promotes recovery processes through thermally activated climb and glide of dislocations, leading to a significant reduction in dislocation density. The dissolution of coarse second-phase particles released solute atoms (e.g., Zn, Mg, Cu) into the matrix. The increased solute concentration not only enhanced the solid solution strengthening effect but also contributed to the retardation of recrystallization through solute drag on migrating grain boundaries, rather than by hindering atomic diffusion.
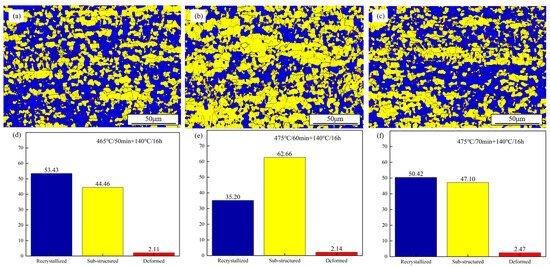
Figure 12.
Recrystallization grain distribution map of the TiB2/7050 composite: (a) 475 °C/50 min + 140 °C/16 h, (b) 475 °C/60 min + 140 °C/16 h, (c) 475 °C/70 min + 140 °C/16 h; statistics of recrystallized fraction and structure size of the TiB2/7050 composite (d) 475 °C/50 min + 140 °C/16 h, (e) 475 °C/60 min + 140 °C/16 h, (f) 475 °C/70 min + 140 °C/16 h.
As shown in Figure 13, the proportion of coarse second-phase gradually decreased with the extension of solid solution time, and the second phase is fully dissolved at 475 °C for 60 min, which increased strength and hardness.
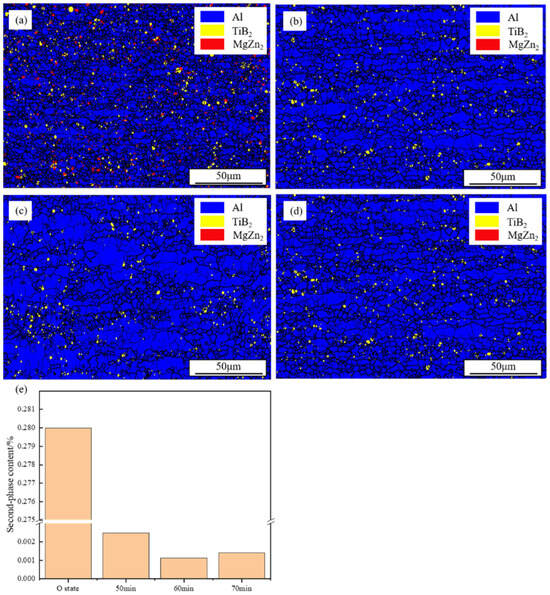
Figure 13.
Phase distribution of (a) O-state, (b) 475 °C/50 min + 140 °C/16 h, (c) 475 °C/60 min + 140 °C/16 h, (d) 475 °C/70 min + 140 °C/16 h, and (e) statistical diagram of MgZn2 phase proportion.
Figure 14a,b show the changes in the mechanical properties of TiB2/7050 composites after heat treatment with varying solution times. Between 50 and 70 min, the yield strength, the ultimate tensile strength, and the elongation all showed a trend of increasing first and then decreasing. As revealed by the EBSD analysis in Figure 11, the average grain size increased from 2.04 μm at 60 min to 2.11 μm at 70 min, with the proportion of grains larger than the average size increasing significantly (by 32.99%). This grain coarsening, particularly the abnormal growth of a small number of grains, can lead to local strain incompatibility during tensile deformation, promoting early crack initiation and reducing the material’s capacity for uniform plastic deformation. Additionally, prolonged exposure at elevated temperatures may alter the grain boundary character and reduce the density of mobile dislocations, further contributing to the observed loss in ductility. Figure 14c illustrates the hardness changes with different solution times. The hardness followed a similar trend to strength, increasing initially and then decreasing with longer solution times. Between 50 and 60 min, the solid solution became more complete, improving both hardness and strength. However, when the solution time exceeded 60 min, hardness decreased due to slight grain growth and reduced precipitate phase content.
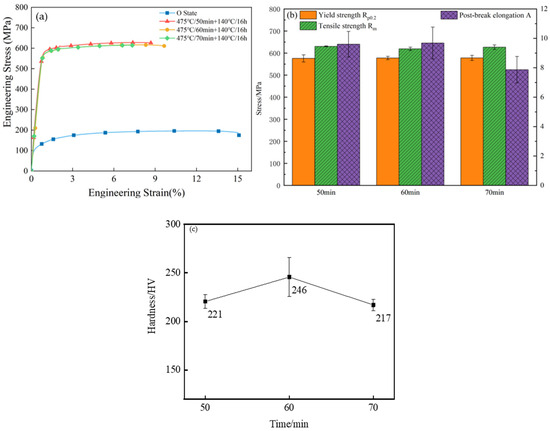
Figure 14.
(a) Engineering stress–engineering strain curves of samples, (b) changes of mechanical properties of TiB2/7050 composites, (c) hardness changes of TiB2/7050 composites at different solution times: 50 min, 60 min, 70 min.
Figure 15 shows the tensile fracture microstructure of TiB2/7050 composites after different solution times. The fracture mode is predominantly microporous aggregation, with no significant difference in the size or depth of the fracture dimples. However, after 50 min of solid solution treatment, a small number of undissolved second-phase particles remained in the fracture. As the solution time increased, the number of second-phase particles decreased, indicating that the solubility of the second phase improved over time. A full solid solution was achieved after 60 min of treatment.
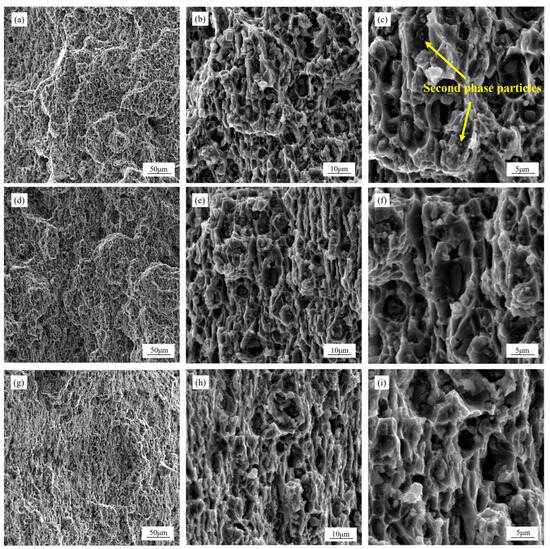
Figure 15.
SEM images of the TiB2/7050 composite tensile fracture for (a–c) 475 °C/50 min + 140 °C/16 h, (d–f) 475 °C/60 min + 140 °C/16 h, and (g–i) 475 °C/70 min + 140 °C/16 h.
3.3. Effect of Artificial Aging Temperature on the Microstructure and Mechanical Properties of TiB2/7050 Composites
Figure 16c,f illustrate that the proportion of fine crystalline structures (less than 1 µm) significantly decreased when the aging temperature was 150 °C. This suggested that precipitate coarsening occurred at this temperature. To avoid this, the artificial aging temperature should be kept below 150 °C to prevent coarsening and maintain the material’s plasticity.
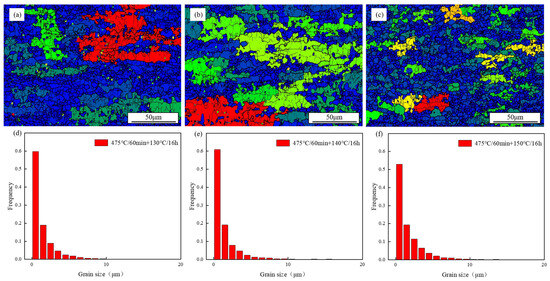
Figure 16.
EBSD maps of the TiB2/7050 composite: (a) 475 °C/60 min + 130 °C/16 h, (b) 475 °C/60 min + 140 °C/16 h, (c) 475 °C/60 min + 150 °C/16 h; grain size distribution of the TiB2/7050 composite: (d) 475 °C/60 min + 130 °C/16 h, (e) TiB2/7050 composite at 475 °C/60 min + 140 °C/16 h, (f) 475 °C/60 min + 150 °C/16 h.
As seen in Figure 17, the degree of recrystallization does not increase monotonically with the increase in artificial aging temperature. When the artificial aging temperature was 140 °C, the soluble second phase dissolved in the aluminum alloy matrix precipitates in the form of fine precipitates. These precipitates were small in size and widely dispersed, achieving the optimal state of the Zener pinning effect, causing many areas to remain in the substructure recovery stage, and forcibly interrupting and suppressing the recrystallization process.
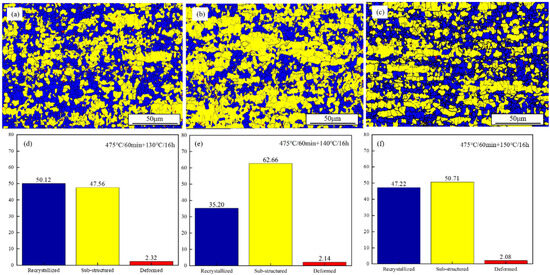
Figure 17.
Recrystallization grain distribution map of the TiB2/7050 composite: (a) 475 °C/60 min + 130 °C/16 h, (b) 475 °C/60 min + 140 °C/16 h, (c) 475 °C/60 min + 150 °C/16 h; statistics of recrystallized fraction and structure size of the TiB2/7050 composite: (d) 475 °C/60 min + 130 °C/16 h, (e) 475 °C/60 min + 140 °C/16 h, (f) 475 °C/60 min + 150 °C/16 h.
Figure 18 presents the phase distribution and proportion of second phases in TiB2/7050 composites at different aging temperatures. The precipitation sequence for the Al–Zn–Mg–Cu alloy follows GP zone → η’ phase → η stable phase (MgZn2). In the under-aged state, the GP zone is the primary precipitate, interacting with dislocations via cleavage. At peak aging, the GP and η’ phases dominate, transitioning to a bypassing mechanism, improving strength and hardness. In the over-aged state, η stable and η’ phases prevail, and the dislocation interaction is characterized by the bypassing mechanism. Figure 18d shows the statistical proportions of the MgZn2 phase detected by EBSD at different aging temperatures. At 130 °C (under-aged condition), the proportion of the MgZn2 phase is relatively high. The material was analyzed through the electron diffraction pattern, it is evident that there are a large number of dense and continuous grain boundaries and η’ precipitates. These small precipitates play a positive role in strengthening. When the temperature rises to 140 °C (peak-aged condition), the proportion of MgZn2 slightly decreases. However, this decrease does not indicate the loss of strength. Instead, it indicates that some grain boundaries transform into the η’ phase, accompanied by a slight coarsening of the precipitate structure, thereby optimizing the precipitation strengthening effect. Based on the observations from transmission electron microscopy, at 150 °C (over-aged condition), although the proportion of MgZn2 is lower than that at 130 °C, it represents the formation of large and balanced η phases. Compared to 140 °C, the significant increase in MgZn2 at 150 °C indicates the occurrence of over-aging, showing the coarsening of precipitates and the emergence of stable η phases at this temperature. Therefore, the peak aging state at 140 °C is not solely determined by the content of MgZn2 but depends on the optimal type, size, and distribution of precipitates, which can maximize the strengthening effect. Therefore, the peak processing conditions should be determined by a comprehensive consideration of various properties, while 140 °C can provide the highest hardness along with a balanced combination of strength and ductility. As shown in the tensile results in Figure 19b, 130 °C can offer the highest yield strength, but at the cost of a slightly reduced hardness.
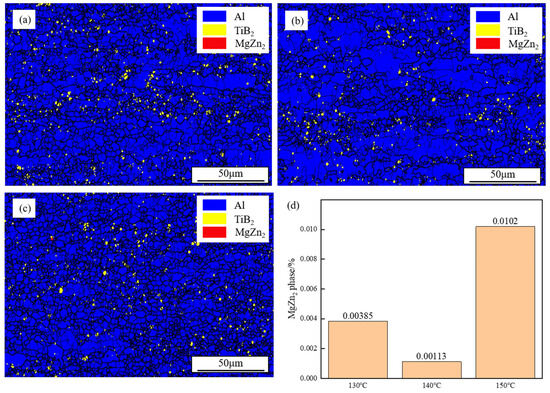
Figure 18.
Phase distribution of (a) 475 °C/60 min + 130 °C/16 h, (b) 475 °C/60 min + 140 °C/16 h, (c) 475 °C/60 min + 150 °C/16 h, and (d) statistical diagram of MgZn2 phase proportion.
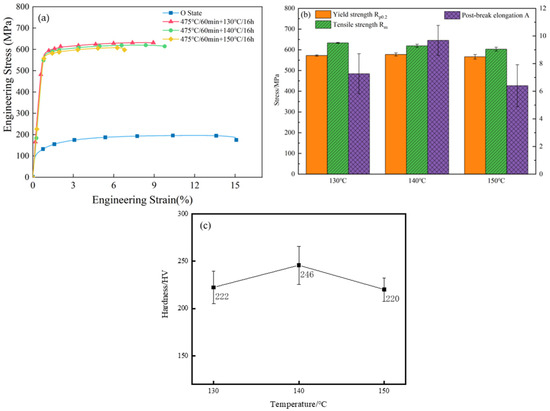
Figure 19.
(a) Engineering stress–engineering strain curves of samples, (b) changes of mechanical properties of TiB2/7050 composites, (c) hardness changes of TiB2/7050 composites at different aging temperatures: 130 °C, 140 °C, 150 °C.
Figure 19a,b show that the yield strength was mostly unaffected, the ultimate tensile strength slightly decreased, and the elongation increased and then decreased as the artificial aging temperature rose from 130 °C to 150 °C. As illustrated in Figure 19c, the hardness reached a peak at 140 °C, with a maximum value of 246 HV.
Figure 20 displays the tensile fracture morphology of TiB2/7050 composites after aging at different temperatures. Before 140 °C, the fracture surfaces showed larger and deeper dimples, indicating good plasticity, which was consistent with the tensile test results. At 150 °C, dimples became smaller and shallower with secondary cracks appearing, suggesting reduced plasticity and toughness at higher aging temperatures.
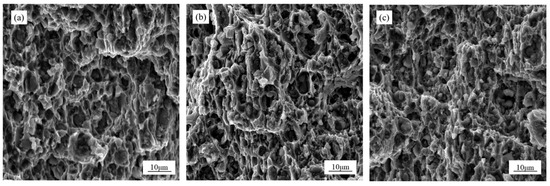
Figure 20.
SEM images of the TiB2/7050 composite tensile fracture for (a) 475 °C/60 min + 130 °C/16 h, (b) 475 °C/60 min + 140 °C/16 h, (c) 475 °C/60 min + 150 °C/16 h.
3.4. Effect of Artificial Aging Time on the Microstructure and Mechanical Properties of TiB2/7050 Composites
Figure 21 presents the grain size distribution of TiB2/7050 composites after varying artificial aging times. At 15 h, 57.71% of the grains were smaller than 1 µm. After 16 h, it increased to 60.84%, and it reached 61.23% for 17 h, with some grains growing larger.
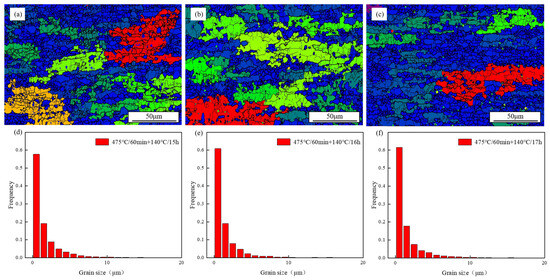
Figure 21.
EBSD maps of the TiB2/7050 composite: (a) 475 °C/60 min + 140 °C/15 h, (b) 475 °C/60 min + 140 °C/16 h, (c) 475 °C/60 min + 140 °C/17 h; grain size distribution of the TiB2/7050 composite: (d) 475 °C/60 min + 140 °C/15 h, (e) 475 °C/60 min + 140 °C/16 h, (f) 475 °C/60 min + 140 °C/17 h.
Figure 22 shows that the artificial aging parameters of 140 °C + 16 h are the key to inhibiting recrystallization and obtaining a non-recrystallized or partially recrystallized fine microstructure. It showed that the second phase continuously precipitated and coarsened with the increasing of artificial aging time, causing the pinning resistance to show a trend of first increasing and then decreasing and resulting in the phenomenon that the recrystallization process was initially suppressed and then enhanced.

Figure 22.
Recrystallization grain distribution map of the TiB2/7050 composite: (a) 475 °C/60 min + 140 °C/15 h, (b) 475 °C/60 min + 140 °C/16 h, (c) 475 °C/60 min + 140 °C/17 h; statistics of recrystallized fraction and structure size of the TiB2/7050 composite: (d) 475 °C/60 min + 140 °C/15 h, (e) 475 °C/60 min + 140 °C/16 h, (f) 475 °C/60 min + 140 °C/17 h.
Figure 23 displays the engineering stress–strain curves and mechanical properties of samples at 475 °C solution for 1 h, followed by 140 °C artificial aging for varying times. The ultimate tensile strength initially increased, reaching 618.86 MPa at 16 h, and then decreased with further aging. Figure 23c shows that hardness increased first and then decreased, aligning with the changes in ultimate tensile strength. As shown in Figure 21, although the proportion of particles smaller than 1 micron gradually increased slightly from 60.84% at 16 h to 61.23% at 17 h, as shown in Figure 23, the hardness and strength both decreased at 17 h. Under the T6 treatment conditions, precipitation strengthening is the main contributing factor to the overall strength, while grain boundary strengthening plays a secondary role. At 17 h, the material entered the over-aged state. Long-term aging at 140 °C would lead to the coarsening of η’ precipitates; the semi-continuous η’ phase would become larger, thereby reducing its number density and increasing the spacing between adjacent particles. Formation of the equilibrium η phase: some η’ grains would transform into the disordered equilibrium η phase (MgZn2), which is less effective in hindering dislocation movement. These microstructural changes significantly reduced the precipitation strengthening effect. Although a slight increase in the proportion of fine grains provided a minor enhancement for grain boundary strengthening, this was not sufficient to compensate for the significant loss in precipitation strengthening. Therefore, at 17 h, the overall effect was a decrease in both hardness and strength, although the proportion of fine grains was still high. This explanation is consistent with the classical understanding of age-hardening alloys: the peak age-hardening state corresponds to the best precipitate structure, and any deviation from this state—whether over-aged or under-aged—would lead to a general decrease in strength, even though other microstructural characteristics (such as grain size) were still developing in a favorable direction.
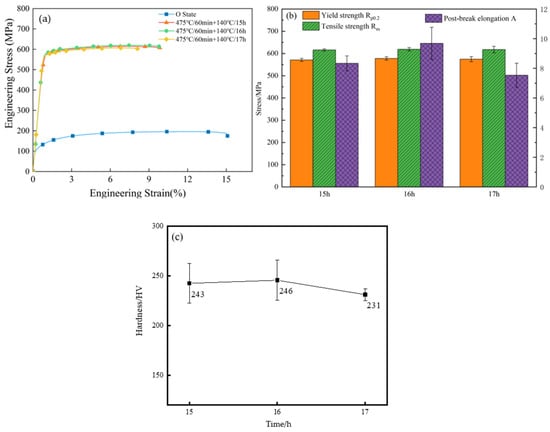
Figure 23.
(a) Engineering stress–engineering strain curves of samples, (b) changes of mechanical properties of TiB2/7050 composites, (c) hardness changes of TiB2/7050 composites at different aging times: 15 h, 16 h, 17 h.
Figure 24 displays the tensile fracture morphology of TiB2/7050 composites after aging at different times. Within 16 h, the fracture surfaces of the material have a large number of ductile pit structures, indicating good plasticity, which was consistent with the tensile test results. When the aging time exceeds 16 h, the size of the ductile pits on the fracture surface of the material decreases, the depth reduces, and the morphology has a significant change compared with the fracture surface at 16 h. This indicates that when the aging time exceeds 16 h, the plasticity and toughness of the material have decreased.
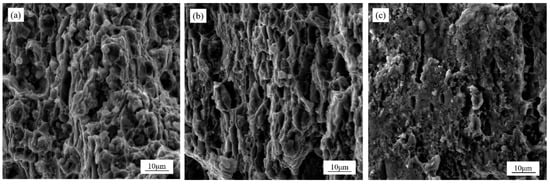
Figure 24.
SEM images of the TiB2/7050 composite tensile fracture for (a) 475 °C/60 min + 140 °C/15 h, (b) 475 °C/60 min + 140 °C/16 h, (c) 475 °C/60 min + 140 °C/17 h.
3.5. Effect of Reinforcement Particles on Aging Treatment of TiB2/7050 Composites
Although the TiB2 reinforcement particles do not directly engage in precipitation during aging, they influence the precipitation rate. The addition of these particles increases dislocation density at the matrix–particle interface, and due to the addition of the reinforcing particles, more dislocations are distributed at the interface of the particle-reinforced aluminum matrix composites compared to the base aluminum alloy. A higher dislocation density will accelerate the precipitation rate. Studying the influence of different particle distribution characteristics on the precipitation rate is an important part of revealing the effect of particles on the aging process. Transmission electron microscopy (TEM) observations of particle-rich and particle-poor regions provide insights into the precipitation dynamics in these composite materials, which may guide the optimization of aging treatments for achieving peak properties.
Figure 25 reveals that TiB2 particles predominantly clustered at grain boundaries, with significant dislocation density in these regions. In Channel5, the statistical range is set to 3 × 3, and the statistical range for direction differences is set from 0° to 5°. The local orientation difference, depicted in Figure 26, reflects the average dislocation density levels and substructures, like dislocation walls and microbands. This distribution confirms that particle-rich regions exhibited higher dislocation densities in both O-state and T6-state materials, while solution aging significantly reduced overall dislocation density but increased dislocations around the base material due to thermal effects.
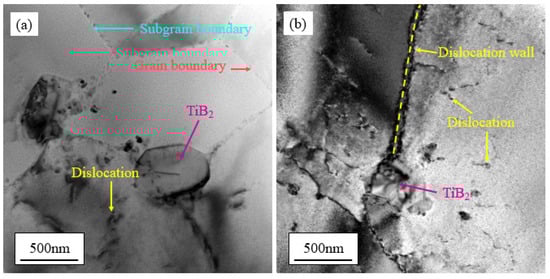
Figure 25.
Microstructure characteristics of TiB2/7050 composites: the distribution range of TiB2 (a) around the grain boundary, (b) around the dislocation.
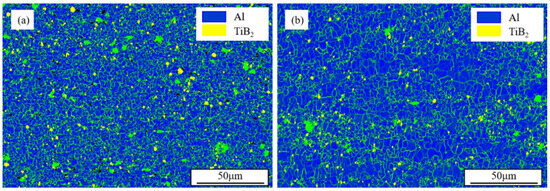
Figure 26.
Images of local orientation difference of TiB2/7050 composites: (a) O-state, (b) T6-state.
After solution treatment at 475 °C for 1 h and aging at 140 °C for 16 h, TEM imaging (Figure 27a) showed non-granular areas with circular and rod-shaped precipitates. The electron diffraction pattern in Figure 27b lacked η’ quasi-stable phase spots, but high-resolution imaging (Figure 27c) revealed GP and η’ phases in circular and rod-shaped forms, respectively. In particle-rich regions (Figure 27e), the precipitate distribution was uniform and dense, while diffraction spots (Figure 27f) clearly showed η’ phase content, which was notably higher than that in particle-poor regions.

Figure 27.
Microstructure characteristics of TiB2/7050 composites after solution at 475 °C for 1 h and aging at 140 °C for 16 h: (a) bright field image of the TiB2/7050 composite without particles, (b) electron diffraction spot in the region shown in Figure (a), (c) high-resolution image of part of the region shown in Figure (a), (d) fast Fourier processing result (FFT) of part of the region shown in Figure (c), (e) bright field images of particle regions, (f) electron diffraction spots in the region shown in Figure (e), and (g) energy spectrum measurements of the region containing TiB2 particles in Figure (f).

Figure 28 shows the changes in the morphology and density of the precipitates in the TiB2 composite material over time under the conditions of a solid solution temperature of 475 °C, a solid solution time of 60 min, and an artificial aging temperature of 140 °C. TiB2-rich regions exhibited larger grain boundary precipitates (GBPs) and minimal precipitate-free zones (PFZs), as seen in Figure 28a. In contrast, regions without TiB2 particles (Figure 28b) displayed smaller GBPs, greater spacing, weaker boundary connectivity, and broader PFZs. This suggests that TiB2 particles promote larger GBPs and reduce PFZs.
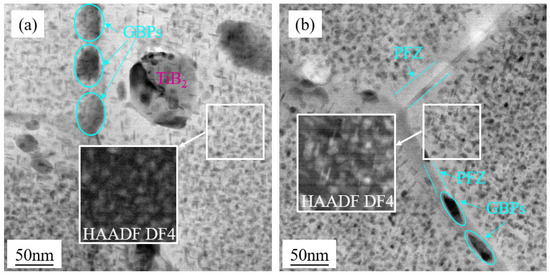
Figure 28.
The bright field images of grain boundary precipitates transmitted by samples with different aging times: (a) 140 °C (15 h), (b) 140 °C (17 h).
Aging at 140 °C for 15 h revealed uniform precipitate distribution in particle-poor regions (Figure 29a), with electron diffraction (Figure 29b) identifying GP and η’ phases. The η’ phase appeared smaller here than that in the particle-rich area, indicating that extending aging from 15 to 16 h increases η’ phase size. In particle-rich areas (Figure 29e), diffraction patterns (Figure 29f) showed intensified η’ spots, reflecting an increase in η’ content.
Aging at 140 °C for 17 h revealed that microstructures further evolved (Figure 30a–c), showing larger η’ phases. In particle-rich areas (Figure 30e), high-resolution imaging revealed η phases, indicating full aging. Compared with the particle-poor region, η’ content was higher in the particle-rich zone, suggesting that particles may support η’ phase precipitation within a limited range.

Figure 29.
Microstructure characteristics of TiB2/7050 composites after solution at 475 °C for 1 h and aging at 140 °C for 15 h: (a) bright field image of the TiB2/7050 composite without particles, (b) electron diffraction spot in the region shown in Figure (a), (c) high-resolution image of part of the region shown in Figure (a), (d) fast Fourier processing result (FFT) of part of the region shown in Figure (c), (e) bright field images of the particle region, (f) electron diffraction spots in the region shown in Figure (e), and (g) energy spectrum measurements of the region without TiB2 particles in Figure (a).


Figure 30.
Microstructure characteristics of TiB2/7050 composites after solution at 475 °C for 1 h and aging at 140 °C for 17 h: (a) bright field image of the TiB2/7050 composite without particles, (b) electron diffraction spot in the region shown in Figure (a), (c) high-resolution image of part of the region shown in Figure (a), (d) fast Fourier processing result (FFT) of part of the region shown in Figure (c), (e) bright field images of the particle region, (f) high-resolution images of the region shown in Figure (e) and its local electron diffraction spots, and (g) energy spectrum measurements of the TiB2 particle region shown in Figure (f).

4. Conclusions
This study provides critical insights into the heat treatment optimization for TiB2/7050 composites, guiding process adjustments to achieve desired mechanical properties.
- As the solution temperature increased from 465 °C to 485 °C, soluble second-phase content dropped substantially after treatment, reaching 0.00113% at 475 °C. As the solid solution temperature increases, the average grain size changes slightly, while a small number of grains significantly grow. Higher solution temperatures slightly increased grain growth, reducing fine-grain strengthening. Extending solution time from 50 to 60 min improved second-phase dissolution, raising hardness and strength. Beyond 60 min, grain growth became notable, with an average grain size of 2.11 μm after 70 min, and grains exceeding this size proportionately increased by 32.99%.
- Aging above 150 °C caused η-phase (MgZn2) coarsening, resulting in over-aging and reduced fine-grain structure. Thus, aging temperatures should be kept below 150 °C to prevent coarsening and preserve material strength and plasticity. Optimal peak aging for TiB2/7050 composites was observed at 140 °C for 16 h, yielding a peak tensile strength of 619.1 MPa, with fine crystals (<1 μm) comprising 60.84%.
- TiB2 particles slowed the solid solution by reducing the η (MgZn2) and α (Al) contact area. TiB2 particles, which were primarily distributed along grain boundaries as a result of being pushed by the solidification front during casting, significantly influenced the subsequent aging behavior. In TiB2 particle-rich regions, larger and more connected grain boundary precipitates (GBPs) were observed, along with minimal precipitate-free zones (PFZs). Conversely, particle-poor regions exhibited smaller GBPs and broader PFZs. TiB2 particle-rich regions displayed larger and more connected grain boundary precipitates (GBPs) and minimal precipitate-free zones (PFZs), while TiB2 particle-poor regions showed smaller GBPs, weaker boundary connections, and extended PFZs. Aging from 15 to 16 h increased η’ quasi-stable phase content in particle-rich areas, achieving peak aging at 16 h. This suggested a limited range of particle influence on the distribution of the η’ phase.
This paper mainly explores the mechanism of the effect of reinforcing particles on the behavior during single-stage solid solution. In the future, the effect of reinforcing particles on dual-stage solid solution aging, contact-type solid solution treatment, and other processes can also be studied. Further, using pre-tensioning and high-temperature solid solution methods, the particle-rich and particle-poor areas can be eliminated, thereby promoting a more uniform distribution of the precipitated phase and improving the mechanical properties of the material.
Author Contributions
Conceptualization, B.Y.; methodology, B.Y.; investigation, Z.W. and W.H.; writing—original draft preparation, W.H.; writing—review and editing, Z.W. and B.Y. All authors have read and agreed to the published version of the manuscript.
Funding
The authors gratefully acknowledge financial support from the Tianjin Municipal Education Commission Research Program Project (2020KJ106) and the Tianjin Research Innovation Project for Postgraduate Students (2022SKYZ159).
Data Availability Statement
The original contributions presented in the study are included in the article; further inquiries can be directed to the corresponding author.
Acknowledgments
During the preparation of this study, Jiguang Li from Tianjin Long March Launch Vehicle Manufacturing Co., Ltd. provided guidance and technical support on the test method and result analysis. The authors want to express their sincere acknowledgement to Li.
Conflicts of Interest
The authors declare no conflict of interest.
References
- Xu, J.Y.; Zou, B.L.; Tao, S.Y.; Zhang, M.X.; Cao, X.Q. Fabrication and properties of Al2O3–TiB2–TiC/Al metal matrix composite coatings by atmospheric plasma spraying of SHS powders. J. Alloys Compd. 2016, 672, 251–259. [Google Scholar] [CrossRef]
- Zhao, K.; Kang, H.J.; Wu, Y.H.; Liu, M.M.; Guo, E.Y.; Chen, Z.N.; Wang, T.M. Manipulating the particle distribution of in situ TiB2p/Al composites via acoustic vibration and cooling rate. Mater. Lett. 2019, 262, 127063. [Google Scholar] [CrossRef]
- Li, J.H.; Xiang, Z.L.; Shen, G.L.; Huang, J.C.; Sun, W.C.; Yang, Z.; Han, Y.; Li, L.Z.; Li, M.; Chen, Z.Y. Microstructure evolution and mechanical properties of TiB2/Al–Cu–Mn–Cd composite with the adoption of two-stage solution and aging treatment. Crystals 2024, 14, 836. [Google Scholar] [CrossRef]
- Dong, H.T. Research on microstructure and properties of SiC particle reinforced 2A02Al matrix composites. Powder Metall. Ind. 2022, 32, 91–95. [Google Scholar]
- Wang, A.; Tang, Z.J.; Wu, Y.; Wang, H.W.; Wang, H.Z. Microstructure and properties of 7050 aluminum matrix composites reinforced by TiB2 particles fabricated through laser powder bed fusion (Invited). Chin. J. Lasers 2024, 51, 0402304. [Google Scholar]
- Singh, K.; Singh, H.; Vardhan, S.; Mohan, S. Mechanical study of Al 7050 and Al 7075 based metal matrix composites: A review. Mater. Today Proc. 2021, 43, 673–677. [Google Scholar] [CrossRef]
- Li, J.G.; Laghari, R.A. A review on machining and optimization of particle-reinforced metal matrix composites. Int. J. Adv. Manuf. Technol. 2019, 100, 2929–2943. [Google Scholar] [CrossRef]
- Duan, M.G.; Li, Y.Z.; Yang, X.; Qian, X.D.; Liu, K.; Zhao, H.; Li, B. Mechanical responses of in-situ TiB2/7050 composite subjected to monotonic and cyclic loadings: A comparative study with 7050-Al. Int. J. Fatigue 2022, 163, 107102. [Google Scholar] [CrossRef]
- Liu, J.; Liu, C.Z.; Yan, D.Y.; Chen, Z.; Wang, H.W. Microstructures and mechanical properties of TiB2/7050Al composites with high tensile strength, good ductility, and fatigue resistance. Aerosp. Mater. Technol. 2024, 54, 119–124. [Google Scholar]
- Ramasamy, M.; Daniel, A.A. A review on aluminium (Al7050) metal matrix composite characteristics reinforced with titanium. Mater. Today Proc. 2021, 43, 1720–1723. [Google Scholar] [CrossRef]
- Liu, J.; Chen, Z.; Zhang, F.G.; Ji, G.; Wang, M.L.; Ma, Y.; Ji, V.; Zhong, S.Y.; Wu, Y.; Wang, H.W. Simultaneously increasing strength and ductility of nanoparticles reinforced Al composites via accumulative orthogonal extrusion process. Mater. Res. Lett. 2018, 6, 406–412. [Google Scholar] [CrossRef]
- Liao, Y.; Yan, H.G.; Xia, W.J.; Chen, J.H.; Su, B.; Li, X.Y.; Zhao, L. Effect of heat treatment on the microstructure and properties of high strain rate rolled 7050 aluminum alloy. Met. Mater. Int. 2022, 28, 1014–1025. [Google Scholar] [CrossRef]
- Wang, J.J.; He, Z.Y.; Li, X.G.; Lu, K.; Wang, X.; Li, L.; Yuan, Z.T.; Zhan, Z.L.; Tang, W.S. Corrosion behavior of AlZnMgCu/TiB2 composites prepared via the in-situ generation of TiB2. J. Mater. Res. Technol. 2025, 36, 1017–1027. [Google Scholar] [CrossRef]
- Chen, Z.; Sun, G.A.; Wu, Y.; Mathon, M.H.; Borbely, A.; Chen, D.; Ji, G.; Wang, M.L.; Zhong, S.Y.; Wang, H.W. Multi-scale study of microstructure evolution in hot extruded nano-sized TiB2 particle reinforced aluminum composites. Mater. Des. 2017, 116, 577–590. [Google Scholar] [CrossRef]
- Liu, G.; Geng, J.W.; Li, Y.G.; Cai, L.; Chen, D.; Wang, M.L.; Ma, N.H.; Wang, H.W. Microstructures evolution of nano TiB2/7050Al composite during homogenization. Mater. Charact. 2020, 159, 110019. [Google Scholar] [CrossRef]
- Xue, J.; Wang, J.; Sun, B.D. Research development of TiB2 particle reinforced Al matrix composites. H. Wrk. Technol. 2009, 38, 47–49. [Google Scholar]
- Ma, Y.; Chen, Z.; Wang, M.L.; Chen, D.; Ma, N.H.; Wang, H.W. High cycle fatigue behavior of the in-situ TiB2/7050 composite. Mater. Sci. Eng. A 2015, 640, 350–356. [Google Scholar] [CrossRef]
- Sun, G.Q.; Shao, L.X.; Wang, Z.P.; Li, Y.T.; Deng, Y.Q.; Zhang, P.; Zhao, G.Q.; Li, X.F.; Wang, H.W. Sub-micron particles induced microstructure modification to achieve exceptional mechanical and corrosion properties combination in additive manufactured TiB2/Al-Zn-Mg-Cu composites. Adv. Compos. Hybrid Mater. 2025, 8, 322. [Google Scholar] [CrossRef]
- Xu, H.; Geng, J.W.; Li, K.N.; Wang, F.M.; Li, Y.G.; Xia, P.K.; Chen, D.; Wang, H.W. Effect of precipitation control on strength and corrosion resistance of TiB2/ Al-Zn-Mg-Cu composite pipe. J. Alloys Compd. 2025, 1036, 181980. [Google Scholar] [CrossRef]
- Li, D.; Han, Y.F.; Dong, Q.; Yan, J.; Zhao, W.; Lu, S.S.; Zhang, J.; Sun, B.D. Microstructure evolution from homogeneous as-cast state to annealed heterogeneous structure and mechanical properties of Al-Zn-Mg-Cu alloys with trace TiB2 particles. Mater. Des. 2024, 247, 113452. [Google Scholar] [CrossRef]
- Ju, X.; Zhang, F.; Chen, Z.; Ji, G.; Wang, M.; Wu, Y.; Zhong, S.; Wang, H. Microstructure of multi-pass friction-stir-processed Al–Zn–Mg–Cu alloys reinforced by nano-sized TiB2 particles and the effect of T6 heat treatment. Metals 2017, 7, 530. [Google Scholar] [CrossRef]
- Yang, Q.; Cheng, D.L.; Zhang, F.G.; Shi, Q.W.; Chen, Z.; Wang, M.L.; Zhong, S.Y.; Wu, Y.; Wang, H.W. Spark plasma sintering mechanisms of the Al–Zn–Mg–Cu alloys and TiB2/Al–Zn–Mg–Cu composites. Mater. Charact. 2020, 172, 110825. [Google Scholar] [CrossRef]
- Huang, R.S.; Li, M.N.; Yang, H.F.; Lu, S.M.; Zuo, H.N.; Zheng, S.J.; Duan, Y.H.; Yuan, X.H. Effects of Mg contents on microstructures and second phases of as-cast Al–Zn–Mg–Cu alloys. J. Mater. Res. Technol. 2022, 21, 2105–2117. [Google Scholar] [CrossRef]
- Chen, D.; Le, Y.K.; Bai, L.; Ma, N.H.; Li, X.F.; Wang, H.W. Mechanical properties and microstructure of in situ TiB2–7055 composites. Chin. J. Aeronaut. 2006, 19, 66–70. [Google Scholar]
- Yang, Q.; Ma, Y.; Chen, Z.; Ji, G.; Wang, M.L.; Zhong, S.Y.; Wu, Y.; Ji, V.; Wang, H.W. A new powder metallurgy routine to fabricate TiB2/Al–Zn–Mg–Cu nanocomposites based on composite powders with pre-embedded nanoparticles. Materialia 2019, 8, 100458. [Google Scholar]
- Yang, M.; Lin, M.; Sun, F.D.; Liu, J.; Chen, Z.; Wang, H.W. Effect of solution treatment on microstructure and properties of TiB2/7050Al composite. Heat Treat. Met. 2023, 48, 53–59. [Google Scholar]
- Cheneke, S.; Benny Karunakar, D. The effect of solution treatment on aging behavior and mechanical properties of AA2024-TiB2 composite synthesized by semi-solid casting. SN Appl. Sci. 2019, 1, 1501. [Google Scholar] [CrossRef]
- Chen, J.; Luo, X.H.; Geng, J.W.; Chen, D.; Li, Y.G.; Xia, P.K.; Wang, H.W. Microstructure evolution and mechanical properties of in situ TiB2/Al–Zn–Mg–Cu composites by electropulsing-assisted solution treatment. Adv. Eng. Mater. 2024, 26, 2401325. [Google Scholar] [CrossRef]
- Hao, S.M.; Mao, J.W.; Xie, J.P. Microstructure of in-situ TiB2 particle reinforced 7055 aluminum alloy matrix composites. Trans. Mater. Heat Treat. 2015, 36, 29–34. [Google Scholar]
- Zhang, X.L.; Chen, L.; Li, Z.G.; Zhao, G.Q.; Zhang, C.S. Aging precipitation and its effects on mechanical properties of TiB2 particulate reinforced 7075Al composite. Mater. Sci. Eng. A 2020, 837, 142742. [Google Scholar] [CrossRef]
- Shen, G.L. Study on Micro-Nano Multiphases Synergistic Strengthening of TiB2/Al–Zn–Mg–Cu Composites. Ph.D. Thesis, Beijing University of Technology, Beijing, China, June 2024. [Google Scholar]
- Liu, G.; Geng, J.W.; Li, Y.G.; Cai, L.; Wang, M.L.; Chen, D.; Ma, N.H.; Wang, H.W. Effects of pre-strain on the microstructural evolution and mechanical strength of in situ TiB2/7050 Al composite. Adv. Eng. Mater. 2019, 21, 1900042. [Google Scholar] [CrossRef]
- Sun, N.; Wen, Q.H.; He, Y.; Qiu, Z.; Huang, Q.B.; Gao, S.; Tang, Q.Y.; LI, S.; Feng, W.; Bai, Q.Q. The Preparation of an Extruded Material of a TiB2/7050 Aluminum-Based Composite Material. Patent CN 119,634,480, A, 18 March 2025. [Google Scholar]
- Zeng, Y.; Yin, Z.M.; Zhu, Y.Z.; Cui, J.Z. Microstructure investigation of a new type super high strength aluminum alloy at different heat-treated conditions. Rare Met. 2004, 4, 377–384. [Google Scholar]
- Rometsch, P.A.; Zhang, Y.; Knight, S. Heat treatment of 7xxx series aluminium alloys-Some recent developments. Trans. Nonferrous Met. Soc. China 2014, 24, 2003–2017. [Google Scholar] [CrossRef]
- Hu, H.; Wang, X. Effect of heat treatment on the in-plane anisotropy of as-rolled 7050 aluminum alloy. Metals 2016, 6, 79. [Google Scholar] [CrossRef]
- Ma, Y.L.; Huang, Y.C.; Zhang, X.Y. Precipitation thermodynamics and kinetics of the second phase of Al–Zn–Mg–Cu–Sc–Zr–Ti aluminum alloy. J. Mater. Res. Technol. 2021, 10, 445–452. [Google Scholar] [CrossRef]
- Han, Y.; Li, L.; Mou, S.Z.; Deng, Z.Z.; Yue, Y.K.; Zhang, X.M. Research on the homogenization process of the Al-9.1Zn-1.9Mg-1.6Cu alloy. Spec. Cast. Nonferrous Alloys 2010, 30, 891–893. [Google Scholar]
- Dan, C.Y.; Chen, Z.; Mathon, M.H.; Ji, G.; Li, L.W.; Wu, Y.; Brisset, F.; Guo, L.; Wang, H.W.; Ji, V. Cold rolling texture evolution of Tib2 particle reinforced Al-based composites by neutron diffraction and EBSD analysis. Mater. Charact. 2018, 136, 293–301. [Google Scholar] [CrossRef]
- ASTM E8/E8M-21; Standard Test Methods for Tension Testing of Metallic Materials. ASTM International: West Conshohocken, PA, USA, 2021.
- Wang, H.Y..; Li, B.B.; Li, Y.; Yu, W.; Wang, Y.; Lu, B.; Li, J.D.; Xu, G.M. Effect of nano-TiC/TiB2 on recrystallization, texture and mechanical properties of Al–Cu–Li alloy during solid-solution treatment. J. Mater. Res. Technol. 2023, 27, 372–385. [Google Scholar] [CrossRef]
- Takuya, K.; Masaaki, T.; Atsushi, Y. Same area EBSD observation on early stage of recovery and recrystallization in Al1050 aluminum after cold-rolling. J. Jpn. Inst. Met. 2012, 76, 528–534. [Google Scholar]
- Seyed, S.M.; Anjabin, N.; Kim, H. Study of geometrically necessary dislocations of a partially recrystallized aluminum alloy using 2D EBSD. Microsc. Microanal. 2019, 25, 656–663. [Google Scholar] [CrossRef]


Disclaimer/Publisher’s Note: The statements, opinions and data contained in all publications are solely those of the individual author(s) and contributor(s) and not of MDPI and/or the editor(s). MDPI and/or the editor(s) disclaim responsibility for any injury to people or property resulting from any ideas, methods, instructions or products referred to in the content. |
© 2026 by the authors. Licensee MDPI, Basel, Switzerland. This article is an open access article distributed under the terms and conditions of the Creative Commons Attribution (CC BY) license.