Abstract
The microstructure evolution law and the changes in mechanical properties of 442 ferritic stainless steel after annealing treatment at different temperatures are systematically investigated. The results show that, as the annealing temperature increases, the cold-rolled 442 ferritic stainless steel successively undergoes the process of recovery, recrystallization and grain growth, with the microstructure gradually changing from a fibrous to recrystallized structure, and the secondary phases, such as the Nb(C, N) phase, σ phase and Laves phase, precipitate. In terms of mechanical properties, the tensile strength, yield strength and Vickers hardness gradually decrease, while the elongation after fracture gradually increases. When the annealing temperature reaches 800 °C, the material exhibits the optimal comprehensive mechanical properties. The yield strength, tensile strength and elongation reach 371 MPa, 534 MPa and 31%, respectively, and the hardness is 175 HV. The fracture mode of the sample is mainly ductile fracture. EBSD analysis indicates that the strong Brass {110}<112> texture existing in the cold-rolled state gradually weakens with the annealing process, and the {111}<110>texture strengthens, thereby reducing the influence of unfavorable textures. The research results provide theoretical basis and data support for microstructure regulation and performance optimization of 442 ferritic stainless steel.
1. Introduction
Stainless steel, as an important type of metallic material, has been widely used in many fields due to its excellent corrosion resistance, good mechanical properties and beautiful appearance [1]. Among them, ferrite stainless steel, due to its unique chemical composition and microstructure, demonstrates outstanding performance in specific environments and has become a key material in many industries, such as aerospace, automotive manufacturing, chemical engineering, and marine engineering [2,3,4]. The 442 ferrite stainless steel has been widely used in the automotive industry, particularly in exhaust systems, including manifolds, catalytic converters, mufflers, and tail pipes. The thermomechanical processing history, particularly annealing parameters, fundamentally governs the microstructural evolution and final performance of FSS components. However, the annealing behavior of FSS differs substantially from that of austenitic stainless steels. While austenitic grades undergo complex recrystallization and phase transformation sequences [5], FSS typically exhibit continuous recrystallization and pronounced grain growth, with grain boundary mobility strongly influenced by interstitial elements (C, N) and stabilizing additions (Nb, Ti) [6,7]. Previous studies on various FSS grades have established general trends: increasing the annealing temperature above 800 °C promotes significant grain coarsening, with abnormal grain growth reported in Nb-stabilized grades when precipitates dissolve [8,9]. However, the kinetics of grain growth and its correlation with mechanical properties remain grade-specific. For instance, Sun Xiaoyu et al. [10] reported that microstructural refinement can be achieved by the optimization of annealing processes, improving the elongation, yield strength, and tensile strength of FSS 430. An optimal annealing temperature of 950 °C was identified, resulting in better homogeneity and enhanced mechanical properties among the cold-rolled and annealed FSSs. During annealing processes, the fraction of high-angle grain boundaries of FSS 430 annealed at 950 °C was found to be the highest, indicating that a homogeneous microstructure with a high recrystallization rate is formed in the FSS 430 strips. In addition, a high fraction of hard grains (SF < 0.4) and low fraction of soft grains were found in FSS 430 annealed at 950 °C, thereby improving the plasticity of the material. These comparative studies highlight that the balance between grain boundary mobility and precipitate stability is critical, yet such systematic investigations specifically are notably absent for 442 FSS in the literature.
The mechanical property response to annealing in FSS is equally complex and grade-dependent. Annealing generally reduces yield strength through recovery and recrystallization, but the degree of softening is controlled by solute strengthening from Cr and Mo, as well as precipitation strengthening from Nb(C,N) [11,12]. Zhang et al. [13] found that, compared with Nb-free UFG steel, the re-precipitation of Nb(C,N) particles inhibits grain boundary movement and refines the ferrite grains, thereby enhancing the thermal stability and strength, but the elongation is reduced due to the finer ferrite grains. However, when Nb is partially dissolved, it is possible to improve the thermal stability and strength without sacrificing elongation thanks to the precipitation strengthening of fine Nb(C,N) particles and appropriate grain size. For 442 FSS specifically, the current literature provides fragmented data on either microstructural or mechanical properties in isolation, without establishing quantitative relationships between annealing parameters, grain structure, precipitate distribution, and service-relevant performance metrics.
In this study, the microstructure evolution of 442 ferritic stainless steel during annealing was first characterized by scanning electron microscopy (SEM), electron backscatter diffraction (EBSD), and transmission electron microscopy (TEM) to elucidate its microstructural changes under different annealing conditions. Subsequently, the mechanical properties of the steel were investigated using a universal testing machine, aiming to establish the relationship between the annealing process, microstructure evolution, and mechanical properties.
2. Experimental Procedures
2.1. Material Preparation
The cold-rolled sheet of 442 ferritic stainless steel produced by a steel plant was selected as the research object. The thickness of the steel sheet after secondary cold rolling was 0.5 mm. The chemical composition of the steel was tested by optical emission spectroscopy, as shown in Table 1.

Table 1.
Chemical composition of ferritic stainless steel (wt.%).
The stainless steel was cut into samples of 50 × 80 × 0.5 mm3 by wire cutting; then, it was placed in a muffle furnace (instrument model: In 8XL-2-13, Shanghai Yiheng Scientific Instrument Co., Ltd., Shanghai, China), heated at a rate of 15 °C/min to 600 °C, 650 °C, 700 °C, 750 °C, 800 °C, and 850 °C respectively, and held in the furnace for 1 h. Then, it was cooled to room temperature with the furnace. The heat treatment process is shown in Figure 1.
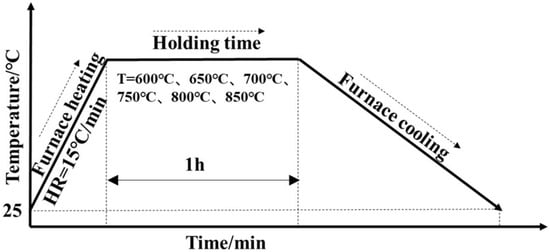
Figure 1.
Process diagram of heat treatment for 442 ferritic stainless steel.
2.2. Microstructure Analysis
The SPECTRO spark direct reading spectrometer (SPECTRO Analytical Instruments GmbH, Kleve, Germany) was used for component measurement. The working voltage was 230 V, the power was 50–60 Hz, and the detection wavelength range was 120 nm to 780 nm. Tungsten rods were used as electrodes to excite the block on the spark stage. The phase analysis of the test steel was carried out by using the DX-2800 X-ray diffractometer (Dandong Haoyuan Instrument Co., Ltd., Dandong, China). The scanning range (2θ) was 40° to 160°, the acceleration voltage was 40 kV, the X-ray wavelength was 1.5406 Å, the current was 150 mA, and the scanning speed was 5°/min. Prepare the etching solution (5 g FeCl3 + 50 mL HCl + 100 mL H2O) for etching. After cleaning with alcohol and drying, observe the metallographic structure using an optical metallographic microscope (OM; LSM 800) (ZEISS LSM 800 laser confocal module; Carl Zeiss Microscopy GmbH, Jena, Germany). The microstructure and morphology of the samples were observed by scanning electron microscopy (SEM; Quanta FEG 450 FEI) (FEI Quanta FEG 450; Thermo Fisher Scientific (FEI Company), Hillsboro, OR, USA).The operating voltage of the scanning electron microscope was 20 kV, and the components were tested by energy-dispersive spectroscopy (EDS; X-Max80) (Oxford Instruments X-Max80; Oxford Instruments NanoAnalysis, High Wycombe, UK).
Texture analysis of the rolled samples was conducted using orientation imaging microscopy (OIM) (EDAX TSL OIM™; EDAX Inc., Mahwah, NJ, USA) based on electron backscatter diffraction (EBSD) technology with a Quanta450FEG scanning electron microscope equipped with an EBSD detector (AztecX-Max80) (Thermo Fisher Scientific Quanta 450 FEG SEM with Oxford Instruments Aztec X-Max80 EBSD detector; Hillsboro, OR, USA). After mechanical polishing of the sample surface, electrolytic polishing was carried out using a DC power supply to remove the stress layer. The solution used for electrolytic polishing was a 10% perchloric acid +90% anhydrous ethanol solution, with a voltage of 40 V and a duration of 10 s.
The sample was subjected to double-spray electrolytic thinning (LEBOTJ100-SE) (LEBOTJ100-SE double-spray electrolytic thinner; LEBO Science & Technology Co., Ltd., Nanjing, China). The double-spray solution was a 10% HClO4 + 90% CH3OH solution. The double-spray temperature was −40 °C and the voltage was 60 V. The microstructure of the samples was observed by transmission electron microscopy (JEOL JEM-F200; JEOL Ltd., Akishima, Tokyo, Japan). The dislocation distribution and precipitated phases in the samples were observed respectively, and the elemental composition of the precipitates was detected. The test acceleration voltage was 200 kV.
2.3. Mechanical Property Testing
The hardness of the specimens was tested by using a Vickers hardness tester, and the test was conducted using a 0.5 HV hardness needle(2.5 HVS-1000 Vickers hardness tester; Laizhou Huayin Testing Instrument Co., Ltd., Laizhou, China). The mechanical properties of the samples were tested by using an electronic universal testing machine (WAW-1000C electronic universal testing machine; Jinan Shijin Group Testing Machine Co., Ltd., Jinan, China), and the dimensions of the tensile specimens are shown in Figure 2. The gauge length of the sample was 16 mm and the tensile speed was 1 mm/min. The ultimate tensile strength (UTS), yield strength (YS) and total elongation (EL) were tested. The surfaces of the tensile specimens were polished and their dimensions were precisely measured using a micrometer. The fracture morphology of the tensile sample was analyzed using a scanning electron microscope.
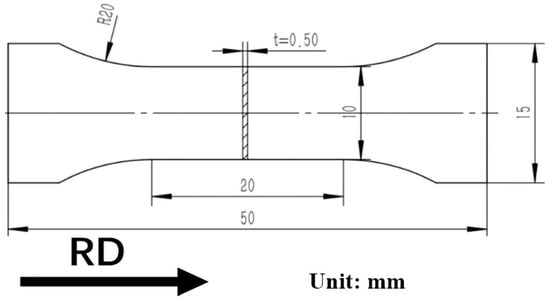
Figure 2.
The dimensions of tensile specimen.
3. Results and Discussion
3.1. Phase Analysis
Figure 3 shows the XRD diffraction patterns of 442 ferritic stainless steel after annealing at different temperatures. It can be seen from the figure that obvious ferrite peaks of (110), (200) and (211) are detected in the samples at different annealing temperatures. As the annealing temperature increases, no other phases are produced in the sample. The ferrite phase is composed of a single phase after the annealing treatment, indicating that no phase transformation occurs in 442 ferritic stainless steel under annealing conditions. With the increase in the annealing temperature, the characteristic diffraction peaks gradually narrow and their intensity increases, with a particularly significant manifestation at 800 °C. The reasons for this phenomenon are as follows. (1) Reduction in defect density: The annealing treatment reduces the dislocation density, thereby decreasing lattice distortion and suppressing the broadening of XRD peaks. (2) Improvement in crystallinity: At 800 °C, recrystallization is completed, resulting in the formation of uniform equiaxed grains. The scattering effect of grain boundaries on X-rays is consequently weakened. (3) Optimization of grain orientation: At 800 °C, recrystallization is completed, resulting in the formation of uniform equiaxed grains, which weakens the scattering effect of grain boundaries on X-rays. It should be noted that the above analysis is based on the qualitative observation of diffraction peak evolution, focusing on the effects of defect reduction and textural changes.
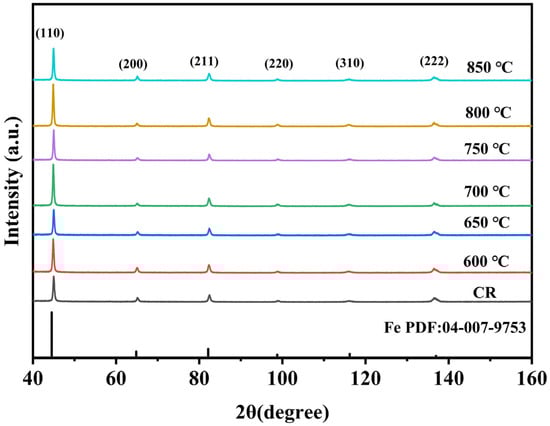
Figure 3.
XRD pattern of 442 ferritic stainless steel.
3.2. Microstructure Analysis
Figure 4 shows the metallograph of the microstructure evolution of 442 stainless steel before and after annealing treatment. From a qualitative perspective, the microstructural characteristics of the ferrite matrix in stainless steel are maintained both before and after annealing. In the cold-rolled specimens without annealing treatment, the ferrite grains show significant preferential orientation characteristics along the rolling direction, presenting a typical fibrous microstructure morphology. When the annealing temperature is in the range of 600–700 °C, the material still maintains the original fibrous microstructure distribution characteristics; when the annealing temperature is raised to 750 °C, the microstructure undergoes a significant transformation, and grains with clear grain boundaries begin to form; and when the annealing temperature is in the range of 800–850 °C, a sharp coarsening of the grain size is observed. The evolution law of this microstructure is closely related to the temperature dependence of the grain boundary migration rate. With the increase in the annealing temperature, the migration rate of grain boundaries increases, and at the same time, grain rotation and recrystallization occur, which directly affect the mechanical properties of the material. Therefore, it is necessary to conduct a systematic study on the correlation mechanism between the evolution of the fibrous structure of materials and their mechanical properties.
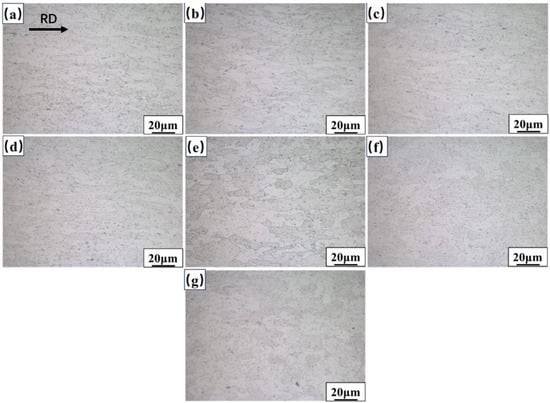
Figure 4.
The metallograph of the specimen before and after annealing. (a) Unannealed, (b) 600 °C, (c) 650 °C, (d) 700 °C, (e) 750 °C, (f) 800 °C, and (g) 850 °C.
Figure 5 shows the scanning electron microscopy characterization results of the microstructure evolution of the specimens at different annealing temperatures. The microstructure characteristics show a good correspondence with the metallographic analysis results. Within the annealing temperature range of 600–700 °C, the material maintains a significant rolled character fiber structure. Within the temperature range of 800–850 °C, the microstructure completes the recrystallization transformation and the grains are completely coarser. It can be observed through scanning electron microscopy characterization that there are precipitated phases in some grain boundary regions. Based on the chemical composition characteristics of these precipitated phases, energy-dispersive spectroscopy (EDS) is used for component analysis. The results show that the precipitated phase mainly contains characteristic elements such as Nb, C, and N, as shown in Figure 6.
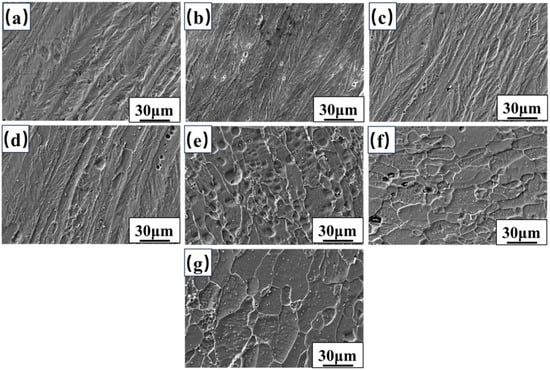
Figure 5.
Scanning image of the morphology of the sample. (a) Unannealed, (b) 600 °C, (c) 650 °C, (d) 700 °C, (e) 750 °C, (f) 800 °C, and (g) 850 °C.
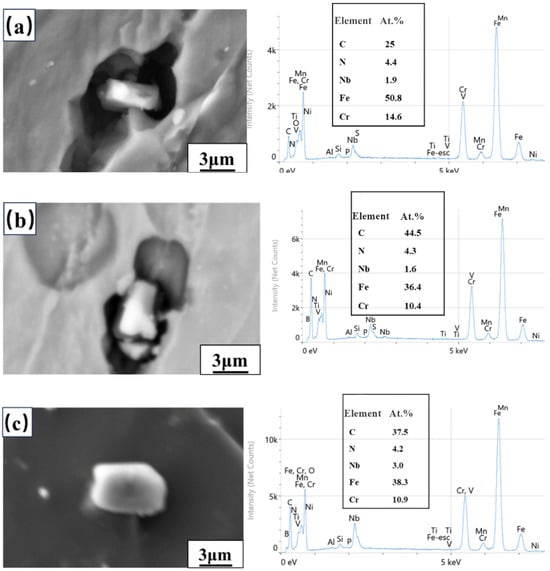
Figure 6.
Chemical composition analysis of precipitations at different annealed temperatures using EDS. (a) Unannealed, (b) 700 °C, and (c) 850 °C.
It can be seen from Figure 5 and Figure 6 that the microstructure of the sample shows a high degree of consistency with the metallographic analysis. The unannealed sample shows a typical banded microstructure. After annealing at 750 °C, the organization undergoes an unusually rapid transformation due to the high heating rate, and polygonized grains or irregularly shaped grains begin to form. Compared with annealing at 600–650 °C, annealing above 800 °C significantly improves the integrity and regularity of grain boundaries. Dispersed micron-sized carbide precipitates can be seen in the sample, and their formation mechanism is related to the segregation behavior of the elements. The precipitation or distribution of a small quantity of carbides at the grain boundaries not only inhibits recrystallization but also hinders grain growth, increasing the density of the grain boundaries. From the perspective of the strengthening mechanism of ferritic stainless steel, it demonstrates fine-grain-strengthening and precipitation-strengthening mechanisms.
3.3. Precipitate Analysis
Microstructure characterization by scanning electron microscopy and EDS energy spectrum analysis were carried out, as shown in Figure 6. Combined with the results of direct reading spectroscopic chemical composition detection, the influence of annealing temperature on the evolution of the precipitated phase is observed. Quantitative energy spectrum analysis indicated that the presence of Nb(C, N) complex phases is detected in the unannealed samples at 700 ° C and 850 ° C, among which NbC is the main part.
3.4. Grain Orientation and Texture Analysis
The grain orientation distribution of the matrix is examined using electron backscatter diffraction (EBSD) analysis (see Figure 7). It can be seen that the unannealed, 600 °C and 650 °C annealed specimens all present significant characteristics of deformed microstructures. Their microstructure is mainly composed of elongated deformed grains, and grain boundaries cannot be observed. These deformed grains are mainly composed of (101)-oriented and (111)-oriented grains, and a significant amount of fibrous microstructure is distributed in the deformed grains. When comparing the effects of different annealing temperatures on the microstructures of the samples, it can be found that the content of fibrous structure in the samples annealed at 600 °C and 650 °C is reduced compared with the unannealed samples. When the annealing temperature rises to 700 °C, the content of the fibrous structure further decreases, obvious recrystallized grains appear, and the size of the recrystallized grains is very uneven. However, the fibrous structure does not completely disappear and retains part of the shape of the fibrous structure, until it completely disappeares in the annealed samples at 750–850 °C. Although the fibrous organization disappears at 750 °C, the grains are still in the state of elongation, and are mainly recrystallized grains at 800 °C, at which time the grains are polygonized grains. The grain organization is basically unchanged at 850 °C, the grain size grows slightly, the homogeneity and regularity are gradually enhanced, and the plasticity and toughness of the material are improved.
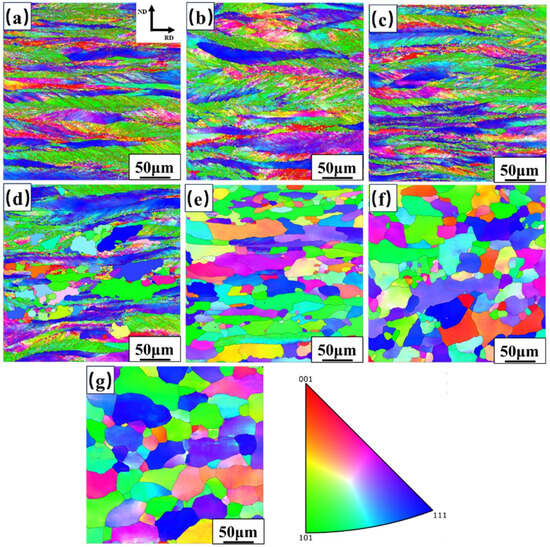
Figure 7.
The grain orientation distribution of 442 stainless steel after annealing at different temperatures. (a) Unannealed, (b) 600 °C, (c) 650 °C, (d) 700 °C, (e) 750 °C, (f) 800 °C, and (g) 850 °C.
The orientation differences in grain boundaries in typical specimens are analyzed using Aztec Crystal 3.1 software. It was found that the proportion of small-angle grain boundaries in unannealed specimens is 77.8%, and the proportion of large-angle grain boundaries is 22%, indicating that there are a large number of dislocations in the deformation substructure of the cold-rolled samples. Therefore, the cracks of this sample are prone to spread and have poor toughness. When the annealing temperature is 850 °C, the grains are mainly composed of sub-grains and recrystallized grains, and the grain size distribution is uneven. Among them, the proportion of small-angle grain boundaries is 20% and that of large-angle grain boundaries is 80%. Large-angle grain boundaries have a strong absorption capacity for dislocations, significantly reducing the resistance of cracks, which can improve the toughness of the material and prevent cracks from spreading easily.
By observing the three-dimensional orientation distribution function (ODF) graphs of the samples at different annealing temperatures (shown in Figure 8), as can be seen from the position of the red area, the sample is composed of a strong Brass ({110}<112>) texture and a {111}<110> texture. The Brass texture is prone to causing lattice distortion, and the Brass texture has a specific crystal orientation. Among them, the crystal plane of each grain is parallel to the rolling direction, and the grains present a specific arrangement during rolling, which leads to an uneven distribution of the stress field and strain field in the sample. When the sample is subjected to external forces, the Brass texture changes the interaction between grains and the way stress is transferred, resulting in lattice distortion, thus adversely affecting the 442 ferritic stainless steel.
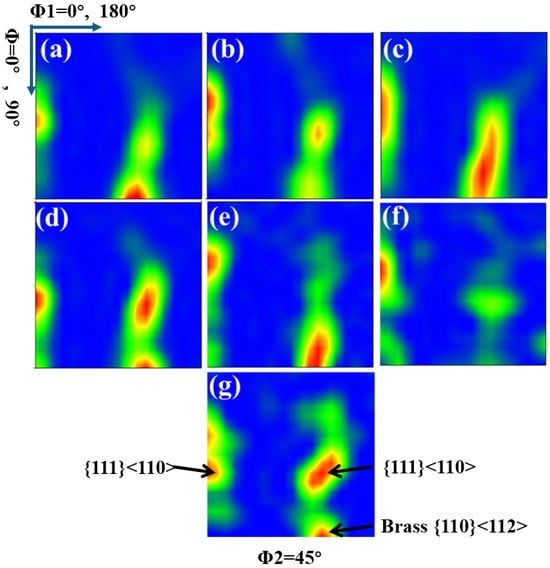
Figure 8.
The ODF diagrams of the specimens at different annealing temperatures. (a) Unannealed, (b) 600 °C, (c) 650 °C, (d) 700 °C, (e) 750 °C, (f) 800 °C, and (g) 850 °C.
As the annealing temperature increases, the reduction in brass texture intensity exhibits a semi-quantitative relationship with the increase in ductility. Specifically, the weakening of the Brass texture enhances grain interaction and stress transfer, thereby reducing lattice distortion and improving the ductility of 442 ferritic stainless steel. This provides evidence of a direct link between microstructural changes and macroscopic mechanical properties.
3.5. Dislocation and Precipitated Phase Analysis
The influence of annealing temperature on dislocation morphology is characterized by transmission electron microscopy (TEM), as shown in Figure 9. Typical high-density dislocation entanglement structures are observed in the specimens that are not annealed and those annealed at 600–650 °C. With the increase in the annealing temperature, the dislocation density at 700–800 °C showed a gradient decreasing trend. When annealed at 850 °C, the dislocation entanglement basically disappeared. This evolution law can be attributed to the fact that, in the temperature range of 600–650 °C, recrystallization has not been fully initiated, and the stored energy generated by the high dislocation density (ρ) is as follows in Formula (1) [14]:
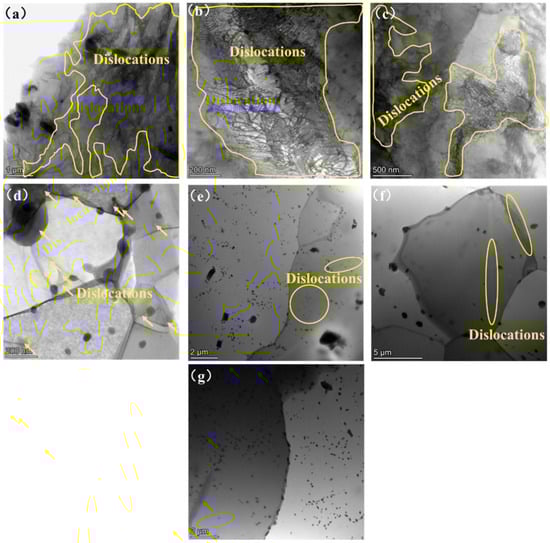
Figure 9.
TEM images at different annealing temperatures. (a) Unannealed, (b) 600 °C, (c) 650 °C, (d) 700 °C, (e) 750 °C, (f) 800 °C, and (g) 850 °C.
Among them, μ is the shear modulus and b is the Burgers vector. Cold rolling enables the storage energy of the high dislocation density to exist in ferrite. The higher the dislocation density is, the greater the storage energy will be. During annealing, the storage energy is released and provides energy for the nucleation and growth of static recrystallized grains. With the increase in the annealing temperature, recrystallization is gradually completed and the dislocation density decreases. Therefore, the dislocations at 700–800 °C gradually decrease and basically disappear at 850 °C.
During the annealing process, the formation of precipitated phases is also observed. Figure 10 shows the transmission electron microscopic images of the σ phase at different temperatures, and the crystal plane spacing is determined by selected-area electron diffraction. The precipitations, such as Nb(C, N) (shown in Figure 6) and the σ phase, are formed in ferritic stainless steel, and their presence can enhance precipitation strengthening by pinning dislocations, but they also reduce toughness. At lower annealing temperatures, the formation of the σ phase is more pronounced, which is accompanied by higher yield strength and tensile strength but relatively lower toughness. As the annealing temperature increases further, the nucleation and growth of the σ phase are inhibited, and its morphological influence on the matrix is weakened, which is one of the factors contributing to the decrease in material strength. The effect of the σ phase on properties shows a temperature-dependent trend. At 600–700 °C, the precipitation strengthening effect of the σ phase is relatively prominent. At 800–850 °C, the adverse impact of the σ phase on toughness is alleviated. This trend is derived from the qualitative analysis of the σ phase morphology and corresponding mechanical property changes, as the quantitative determination of the σ phase fraction was not performed herein.
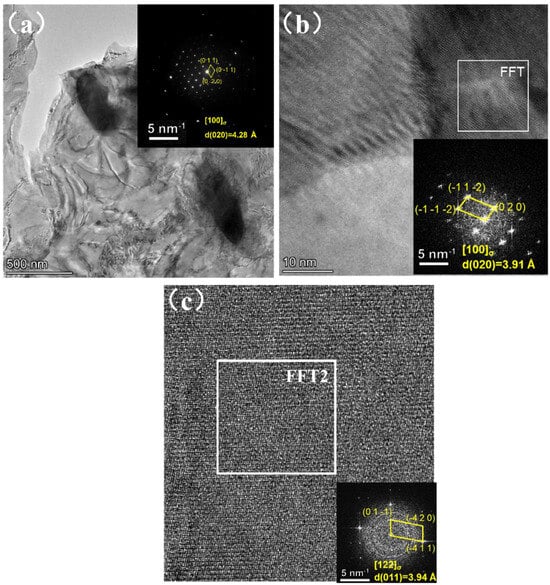
Figure 10.
Bright-field image and selected-area electron diffraction photograph of the σ phase. (a) Unannealed, (b) 700 °C, and (c) 800 °C.
To gain a deeper understanding of the impact of the σ phase on material properties, further analysis of the nucleation and growth mechanisms of the σ phase and its relationship with the material’s microstructure and mechanical properties is needed. By controlling the annealing conditions, we can optimize the formation of the σ phase to achieve both increased material strength and improved toughness. The gradual weakening of the diffraction spots of the σ phase observed in the figure indicates that its precipitation morphology and structure are also changing, and the degree of influence on the microstructure and mechanical properties of 442 stainless steel is gradually diminishing. This further supports the possibility of controlling the formation of the σ phase by adjusting the annealing temperature to optimize material properties.
The Laves phase has also been observed in this study, as shown in Figure 11. The Laves phase is present in a small amount and serves as a secondary factor with no decisive impact on the overall mechanical property trends of the material. Although its existence may slightly influence the movement of dislocations, its effect is far less significant than that of Nb(C, N) and σ phases. This conclusion is based on the qualitative observation of the Laves phase morphology and the comparative analysis of its content relative to other precipitated phases. The formation of the Laves phase may impede the slip of dislocations, thereby enhancing the material’s strength; at the same time, it may reduce the material’s plastic deformation ability, thus affecting its toughness. The precipitation of the Nb(C, N) phase is observed during annealing at various temperatures, indicating that carbides and nitrides are primarily responsible for the precipitation strengthening, as shown in Figure 6.
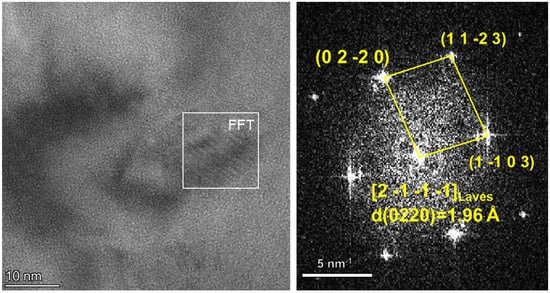
Figure 11.
Bright-field image and selected area electron diffraction photograph of the Laves phase annealed at 700 °C.
As the annealing temperature increases further, the nucleation and growth of the precipitations are inhibited, leading to a reduction in its content within the material, which may be one of the reasons for the decrease in material strength. However, as shown in Figure 12b, although the tensile strength and yield strength decrease with increasing temperature, the elongation increases, indicating an improvement in the material’s toughness. This improvement in toughness may be due to the reduced content of the precipitation, thereby lessening its adverse effect on toughness.
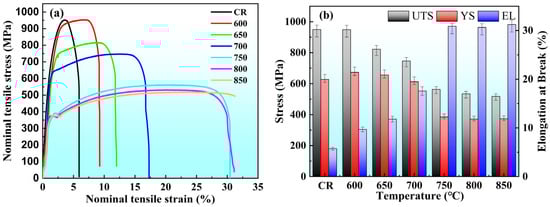
Figure 12.
Tensile properties of annealed specimens at different temperatures. (a) Stress–strain curve. (b) Tensile strength—UTS, Yield strength—YS and Elongation—EL.
3.6. Mechanical Performance Testing
Figure 12 shows the mechanical properties at different annealing temperatures. It can be seen from Figure 12a that, with the increase in the annealing temperature, both tensile strength and yield strength gradually decrease, and elongation gradually increases. The unannealed specimens have the highest tensile strength of 949 MPa, an elongation of 6.27%, and a relatively steep work-hardening stage can be observed. The annealing temperature is raised from 600 °C to 700 °C, the tensile strength decreased to 747 MPa, the yield strength decreased from 673 MPa to 613 MPa, and the elongation increased from 9.7% to 17.57%. When annealing is carried out in this temperature range, except for a small amount of recrystallized grains observed in the IPF diagram of the EBSD at 700 °C, the stainless steel is mainly in the recovery stage, and the work-hardening slope slightly decreased compared with the rolled state. Annealing at 750 °C for recrystallization is basically completed, but there are still elongated grains, with a tensile strength and yield strength of 564 MPa and 385 MPa, respectively, and an elongation of 30.89%, while the curve shows a gentle plastic flow platform. When the recrystallization is completed at the annealing temperature of 800 °C, the tensile strength, yield strength and elongation are 534 MPa, 371 MPa and 31%, respectively. When the annealing temperature is 850 °C the grains start to grow, and the tensile strength, yield strength and elongation are 518 MPa, 373 MPa and 31.24%, respectively, while the slope of the work hardening decreases further. It can be found from Figure 12a that, when the annealing temperature is 750 °C, 800 °C, and 850 °C, the curve shows obvious upper and lower yield points, indicating that, when the annealing temperature is greater than 750 °C, the interstitial atoms of C and N obtain energy and time and can diffuse into the dislocations or defect areas to form Cottrell atmosphere to resist external forces. Therefore, 800 °C is determined as the optimal annealing temperature. Compared with 850 °C, the practical engineering significance of this optimal temperature is reflected in three aspects. (1) Microstructure stability: The average grain size at 800 °C (21.28 μm) is smaller than that at 850 °C (24.93 μm), which can reduce the risk of toughness degradation during long-term high-temperature service. (2) Wear resistance: The Vickers hardness at 800 °C (175 HV) is slightly higher than that at 850 °C (172 HV), maintaining better wear resistance in practical applications. (3) Sensitivity to holding time: The recrystallization at 800 °C is complete and stable, and the material properties are less sensitive to slight fluctuations in the holding time, reducing the difficulty of industrial production control. These advantages confirm that 800 °C is a more reliable optimal annealing temperature rather than a mere comparative result between two adjacent temperature points.
Figure 13 presents the Vickers hardness of the specimens before and after annealing. The hardness is higher when unannealed, annealed at 600 °C, and annealed at 650 °C; starts to decrease at 700 °C; decreases to a minimum at 750 °C, 800 °C, and 850 °C; and the change in hardness is not significant at these three temperatures. The higher hardness value mainly results from the work hardening caused by cold deformation, that is, the increase in dislocation density, the occurrence of entanglement, and the increase in hardness. As the annealing temperature increases, the dislocation density gradually decreases, and recovery, recrystallization and grain growth occur. The grain boundary area between coarse grains decreases, thereby reducing the hardness of the material.
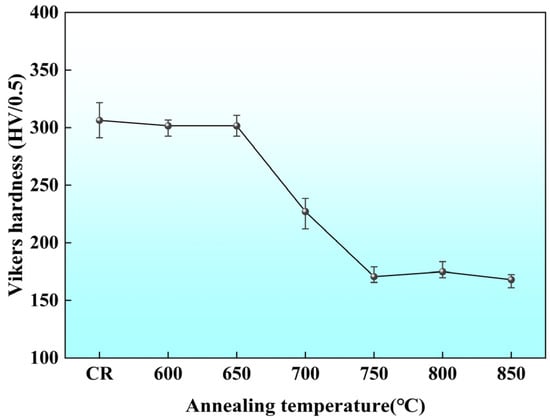
Figure 13.
Hardness curves of specimens at different annealing temperatures.
Furthermore, the fracture morphology of the sample after annealing is shown in Figure 14. It can be seen that the fracture surfaces of the annealed samples are mainly ductile fractures. The samples annealed at 650 °C, 700 °C and 750 °C have a small and shallow number of dimples and, at the same time, these types of micropores are more distributed. The number of dimples distributed on the annealed tensile fracture surfaces at 750 °C, 800 °C and 850 °C increases, and they are larger and deeper. The ductile fracture mode is more obvious. Since the samples all have recrystallized structures, the grains are approximately equiaxed and the grain sizes are almost same. In contrast, the number of dimples at the fracture surfaces annealed at the last three temperatures gradually increased, and the diameter of the dimples also increases while the depth gradually deepens. Among them, the sample at an annealing temperature of 800 °C has a large number of dimples and larger diameter; thus, the plasticity is the best, which is consistent with the results of the stress–strain curve. This is also due to the fact that the annealed specimen has a complete recrystallization microstructure and texture. The ductile–brittle transformation mechanism of ferritic stainless steel can be described by the Cottrell model [15]:
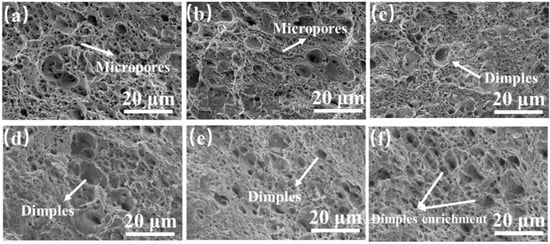
Figure 14.
The fracture morphology of the specimens at different annealing temperatures. (a) 600 °C, (b) 650 °C, (c) 700 °C, (d) 750 °C, (e) 800 °C, and (f) 850 °C.
In the formula, is the brittle fracture stress or flow stress, is the Hall–Petch slope, d is the average grain size, σ0 is the lattice friction stress, γ is the effective surface energy of the hidden crack, μ is the shear modulus and C is a constant. The larger the value on the left side of the formula and the smaller the value on the right side, the more likely the material is to fracture in a brittle mode. In the 442 stainless steel, the d value decreases as the annealing temperature increases. Therefore, as the annealing temperature increases, the fracture of the annealed specimens changes from brittle fracture to ductile fracture.
Figure 15 presents the variation in the average grain size for different annealing temperatures. With the increase in the annealing temperature, its average grain size first decreases and then increases, and the average grain size gradually tends to a normal distribution. Before annealing, the microstructure of the stainless steel is a fibrous structure with a large grain size; after annealing, recrystallization occurs and the average grain size decreases. Significant recrystallization occurs when the annealing temperature is at 750 °C, and tiny crystal nuclei begin to form, with the average grain size being the smallest. Subsequently, as the annealing temperature increases, the grains begin to gradually grow, but the average grain size is much smaller than that of the cold-rolled samples, and the properties of the specimens will increase significantly. Figure 15a shows the average grain size of the cold-rolled samples, which is 52.68 μm. After annealing at 600 °C, the average grain size gradually decreased to 39.85 μm because of the recovery occurring at this time. Until the annealing temperature reaches 750 °C, the average grain size decreased to the lowest of 18.19 μm due to the occurrence of recrystallization, and some fibrous structures still existed, as shown in Figure 15e. When the annealing temperatures are 800 °C and 850 °C, the grains gradually grow in size; the average grain sizes are 21.28 μm and 24.93 μm, respectively (as shown in Figure 15f,g), when the grains are gradually transformed into equiaxial crystals, and their yield and tensile strengths are increased sharply.
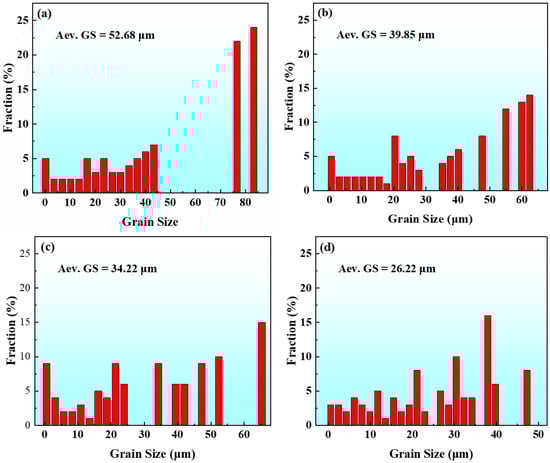
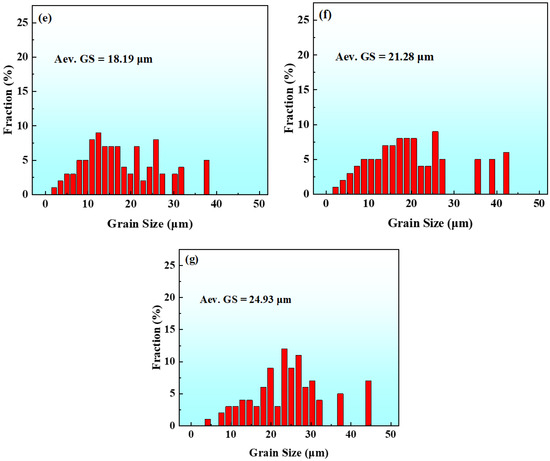
Figure 15.
The variation in grain size at different annealing temperatures. (a) Unannealed, (b) 600 °C, (c) 650 °C, (d) 700 °C, (e) 750 °C, (f) 800 °C, and (g) 850 °C.
4. Conclusions
In conclusion, this study focuses on 442 ferritic stainless steel sheets with a thickness of 0.5 mm, systematically revealing the regulatory laws of annealing at 600–850 °C on their microstructure, texture, and mechanical properties. The key conclusions are as follows.
(1) The 442 ferritic stainless steel maintains a single ferrite phase during annealing at 600–850 °C, and its microstructure gradually transforms from a fibrous structure in the cold-rolled state to a recrystallized structure. The recovery process is basically completed at 750 °C, recrystallization is fully achieved at 800 °C, and grains gradually grow larger at 800–850 °C.
(2) The precipitated phases during annealing include the NbC, σ phase, and Laves phase. The interplanar spacing of the σ phase decreases to 3.91 Å as the temperature rises to 700 °C, and slightly increases to 3.94 Å at 800 °C. The effect of the σ phase on sample properties shows a temperature-dependent trend, the precipitation strengthening effect is relatively prominent at 600–700 °C, and the adverse impact on toughness is alleviated at 800–850 °C (derived from qualitative morphological analysis). The Laves phase is present in a small amount and serves as a secondary factor, with no decisive impact on the overall property trends.
(3) Increasing annealing temperature improves the strength–toughness matching of the steel, the tensile/yield strength and hardness decrease, while the elongation increases. An annealing temperature of 800 °C is optimal—at this temperature, the comprehensive mechanical properties (tensile strength of 534 MPa, yield strength of 371 MPa, elongation of 31%, and hardness of 175 HV) and ductile fracture characteristics are optimal. Compared with 850 °C, it has better long-term service stability (a smaller grain size of 21.28 μm), higher wear resistance (175 HV), and lower production control sensitivity. In addition, the strong Brass {110}<112> texture in the cold-rolled state weakens during annealing, which shows a semi-quantitative correlation with the improvement in ductility and is one of the contributing factors.
Author Contributions
Methodology and software, Y.L.; validation and formal analysis, C.W.; writing-original draft preparation and writing-review and editing, C.C.; conceptualization and data curation, J.S.; investigation and data curation, Y.H.; visualization and supervision, X.L.; methodology and funding acquisition, X.T. All authors have read and agreed to the published version of the manuscript.
Funding
This research is supported by Science and Technology Project of Gansu Province (23JRRB0003), and Science and Technology Project of Jiayuguan City (QKJ25-12).
Data Availability Statement
The original contributions presented in this study are included in the article. Further inquiries can be directed to the corresponding author.
Conflicts of Interest
Authors Yufeng Li and Changbo Wang were employed by Jiuquan Iron and Steel Group. The remaining authors declare that the research was conducted in the absence of any commercial or financial relationships that could be construed as a potential conflict of interest.
References
- Baddoo, N.R. Stainless-steel in construction: A review of research, applications, challenges and opportunities. J. Constr. Steel Res. 2008, 64, 1199–1206. [Google Scholar] [CrossRef]
- Gardner, L. Stability and design of stainless-steel structures—Review and outlook. Thin-Walled Struct. 2019, 141, 208–216. [Google Scholar] [CrossRef]
- Lo, K.H.; Shek, C.H.; Lai, J.K.L. Recent developments in stainless-steels. Mater. Sci. Eng. R 2009, 65, 39–104. [Google Scholar] [CrossRef]
- Theofanous, M.; Chan, T.M.; Gardner, L. Structural response of stainless-steel oval hollow section compression members. Eng. Struct. 2009, 31, 922–934. [Google Scholar] [CrossRef]
- Wang, P.; Siddiqui, F.M.; Poletti, C.M.; Enzinger, N. Phase transformation and recrystallization of cold-rolled AISI 304L austenitic stainless steel during annealing. Mater. Des. 2025, 252, 113738. [Google Scholar] [CrossRef]
- Modak, P.; Mandal, A.; Gupta, R.; Karmakar, A.; Sarkar, S.K.; Ahlawat, S.; Haldar, A.; Mitra, R.; Neogy, S.; Biswas, A.; et al. Phenomenal Effect of Stable (Ti, Mo)C Nano-Sized Precipitates in Retarding the Recrystallization and Grain Growth in High-Strength Ferritic Steel. Metall. Mater. Trans. A 2022, 53, 689–705. [Google Scholar] [CrossRef]
- Cai, G.; Li, C.; Wang, D.; Zhou, Y. Investigation of annealing temperature on microstructure and texture of Fe-19Cr-2Mo-Nb-Ti ferritic stainless steel. Mater. Charact. 2018, 141, 169–176. [Google Scholar] [CrossRef]
- Jiang, M.; Han, Y.; Sun, J.; Sun, J.; Zu, G.; Chen, H.; Ran, X. Precipitation of Cu- and Nb-rich phases and its strengthening effect in 17Cr ferritic stainless steel during high-temperature creep process. Mater. Charact. 2021, 179, 111346. [Google Scholar] [CrossRef]
- Wang, X.; Wang, X.; Su, W.; Xie, Z.; Zhang, W.; Zhou, J.; Li, Y.; Shang, C. Effect of Nb content on abnormal grain growth in 444-type ferritic stainless steel during simulated brazing. Mater. Lett. 2024, 360, 136061. [Google Scholar] [CrossRef]
- Sun, X.; Ma, L.; Li, J.; Zhang, M.; Ma, X. An analysis of microstructure and mechanical properties of ferritic stainless steel 430 during cold rolling and subsequent annealing. Int. J. Adv. Manuf. Technol. 2022, 123, 1159–1173. [Google Scholar] [CrossRef]
- Zhang, J.; Xin, W.B.; Hou, D.Y.; Peng, J.; Zhao, Z.B.; Tong, Y. Effect of Mo on acicular ferrite transformation and interphase precipitation of Nb–V–N microalloyed steel during a continuous cooling process. J. Iron Steel Res. Int. 2024, 32, 1662–1677. [Google Scholar] [CrossRef]
- Liu, G.; Li, Y.; Liao, T.; Wang, S.; Lv, B.; Guo, H.; Huang, Y.; Yong, Q.; Mao, X. Revealing the precipitation kinetics and strengthening mechanisms of a 450 MPa grade Nb-bearing HSLA steel. Mater. Sci. Eng. A 2023, 884, 145506. [Google Scholar] [CrossRef]
- Zhang, Q.; Wang, W.; Yuan, Q.; Wang, Z.; Zhang, Z.; Xu, G. Effect of Niobium on the Thermal Stability and Mechanical Properties of a Low-Carbon Ultrafine Grain Steel. Met. Mater. Int. 2022, 29, 2018–2027. [Google Scholar] [CrossRef]
- Hull, D.; Bacon, D.J. Introduction to Dislocations; Elsevier: Amsterdam, The Netherlands, 2011. [Google Scholar]
- Petch, N.J. The ductile-brittle transition in the fracture of α-iron: I. Philos. Mag. 1958, 3, 1089–1097. [Google Scholar] [CrossRef]


Disclaimer/Publisher’s Note: The statements, opinions and data contained in all publications are solely those of the individual author(s) and contributor(s) and not of MDPI and/or the editor(s). MDPI and/or the editor(s) disclaim responsibility for any injury to people or property resulting from any ideas, methods, instructions or products referred to in the content. |
© 2026 by the authors. Licensee MDPI, Basel, Switzerland. This article is an open access article distributed under the terms and conditions of the Creative Commons Attribution (CC BY) license.