Abstract
Rare-earth aluminum alloy materials exhibit excellent strength, plasticity, and toughness at room temperature, making them easily meet the lightweight requirements of structural components, and high-temperature plastic forming is widely applied. Accordingly, the present study is dedicated to investigating the rheological characteristics of rare-earth aluminum alloys subjected to tensile deformation at elevated temperatures. High-temperature tensile tests were implemented across a temperature interval of 623 to 723 K and a strain rate spectrum ranging from 0.01 to 1.0 s−1. Experimental outcomes reveal that the flow stress exhibits a downward trend with the elevation in deformation temperature as well as the reduction in strain rate. It is also confirmed that flow stress correlates closely with the evolution of strain, which further motivates the construction of a modified Arrhenius constitutive equation integrated with strain compensation. Nevertheless, it is noted that the predictive precision of the strain-compensated Arrhenius constitutive model declines remarkably once the applied strain exceeds the scope covered by the experiments. Through error analysis, it was revealed that the material parameters of the Arrhenius-type constitutive model are influenced by strain, strain rate, and deformation temperature. On this basis, an optimized Arrhenius constitutive model was proposed in the current research. The parameter fitting was accomplished by comparing the calculated stresses from the model with experimental data, which involved strain compensation and a comprehensive consideration of the effects of temperature and strain rate. The resulting model is capable of precisely describing the material’s flow behavior within the experimental strain range and effectively predicting it beyond that range.
1. Introduction
Al-Zn-Mg-Cu alloy sheets, owing to their lightweight nature, high strength, and excellent corrosion resistance, find widespread application in lightweight engineering fields, including aerospace, automotive, and rail transportation [1,2]. However, they exhibit poor formability at room temperature and low forming precision [3,4]; thus, they are mostly shaped via hot stamping technology [5,6]. The hot deformation process of Al-Zn-Mg-Cu alloy is extremely complex. Strain hardening and dynamic softening during hot deformation exert significant influences on the microstructure and properties of the alloy post-forming. Temperature and strain rate play pivotal roles in the hot deformation mechanisms that govern the microstructure and properties of aluminum alloys [7,8,9,10,11,12]. Constitutive equations, which quantitatively describe the deformation capacity of metallic materials under varying temperatures, strain rates, and other conditions through mathematical language [13,14], stand as an irreplaceable model in the calculation of deformation forces and simulating hot deformation processes [15,16,17]. Consequently, investigating the hot deformation behavior of aluminum alloys and establishing their constitutive equations hold great significance. Constitutive models can be broadly classified into phenomenological models, micro-mechanism models, and artificial neural network models [18,19]. Owing to its high precision and operational convenience, the Arrhenius constitutive model has been widely adopted [20].
The Arrhenius constitutive model offers advantages in characterizing the influences of temperature, strain rate, and strain on metals during high-temperature deformation processes, making it widely applicable for predicting hot deformation behavior and optimizing processing parameters. In recent years, modifying the Arrhenius constitutive model to adapt to the deformation characteristics of different metallic materials has become a significant research focus. Enhancements to the Arrhenius model have concentrated on strain compensation, parameter coupling, and the integration of microscopic mechanisms, substantially improving its prediction accuracy and physical significance.
Researchers abroad have conducted numerous studies on the intrinsic equations governing the high-temperature deformation of aluminum alloy sheets. Frequently, Arrhenius-type equations are employed to describe the behavior, incorporating a strain rate sensitivity factor, material parameters, and activation energy. These models are typically designed for specific temperature and strain rate ranges that apply to high-temperature deformation conditions. To enhance accuracy, many research teams have further refined traditional intrinsic models by introducing internal variables such as dynamic recrystallization, particle slip, and other mechanisms to better represent materials’ behavior under different conditions.
Liu et al. [21] investigated the hot tensile deformation behavior and microstructure evolution of a 7075 aluminum alloy sheet. Through the establishment of a hyperbolic sine Arrhenius constitutive equation, the authors investigated the fracture morphology and microstructural evolution. The findings revealed that the activation energy for hot deformation of the alloy is 132.52 kJ/mol. Furthermore, with increasing deformation temperature or decreasing strain rate, the softening mechanism of the alloy transitions from dynamic recovery to dynamic recrystallization. Long et al. [22] developed a strain compensation model for an Al–Cu–Li alloy via isothermal compression tests. They employed a fifth-order polynomial to fit the strain-dependent parameters, achieving a mean absolute relative error of only 4.65%. The superiority of the model was demonstrated through comparative verification with the Johnson–Cook and Zerilli–Armstrong models. Additionally, the influence of particle-stimulated nucleation (PSN) induced by coarse second-phase particles was analyzed. Gong et al. [23] proposed a strain-compensated Arrhenius model for a magnesium alloy but highlighted that the material parameters are influenced by multiple factors, necessitating a move beyond reliance solely on strain. Wang et al. [24] optimized the constitutive model for 2219-O aluminum alloy through friction and temperature correction, proposing a modified model with a simpler structure. Its prediction accuracy was comparable to that of the strain compensation model, and the reliability of the hot forming simulation was verified via secondary development in DEFORM-3D. Xia et al. [25] compared the strain compensation (SC), genetic algorithm (GA), and K function modification (KM) models for 2A12-T4 aluminum alloy, finding that the KM model achieved the highest accuracy due to its coupling of temperature and strain rate effects, thereby extending the applicability of the modification methods. Furthermore, Yu et al. [26] developed an Arrhenius model incorporating the Zener–Hollomon (Z) parameter for an Al–Mg–Si–Ce–B alloy to describe dynamic recovery (DRV) and continuous dynamic recrystallization (CDRX) behaviors. The softening mechanisms were validated by TEM/EBSD, and the model successfully identified unstable deformation regions under conditions of low temperature and high strain rate. Shi et al. [27] enhanced the correlation coefficient of the model for an Al–Cu–Mn alloy to 96.2% through strain compensation and analyzed the regulatory effects of DRV and nano-precipitates on the flow stress.
In summary, the current core refinements of the Arrhenius constitutive model are manifested in the following aspects: (1) strain compensation: enhancing the characterization of parameter evolution with strain through polynomial fitting; (2) integration of the Z-parameter: coupling temperature and strain rate effects to improve the model’s universality across diverse deformation conditions [28]; (3) incorporation of microscopic mechanisms: integrating mechanisms such as dynamic recrystallization (DRX) and dynamic recovery (DRV) to enhance physical significance [29]; and (4) experimental correction: reducing errors through friction/temperature correction or model comparison. These improvements have significantly enhanced the model’s predictive accuracy for flow stress, providing a more reliable theoretical tool for optimizing hot working processes (such as finite element simulation) and microstructural control.
Most existing Arrhenius constitutive equations for the high-temperature deformation of aluminum alloys are primarily developed for high-temperature compression. The specimens used in high-temperature compression tests are cylindrical, and during compression, the fracture strain is less sensitive to deformation conditions, resulting in a wide strain range of experimental data. However, for high-strength aluminum alloy sheets at elevated temperatures, the fracture strain is significantly affected by deformation conditions—under certain conditions, the fracture strain is relatively small, leading to a narrow strain range of experimental data. Since the fitting of constitutive equation parameters in existing models relies on polynomial fitting, which only considers the effect of strain while ignoring the influences of temperature and strain rate, the constitutive equations exhibit high prediction accuracy only within the strain range of the experimental data, whereas beyond this strain range, the prediction accuracy deteriorates sharply. Consequently, the applicable strain range of existing constitutive equations is limited, which is insufficient to predict the flow stress of high-strength aluminum alloys during actual production processes.
This study focuses on investigating the flow behavior of rare-earth aluminum alloys through hot tensile tests conducted under different temperatures and strain rates. It analyzes the effects of strain rate, strain, and deformation temperature on the material parameters of these alloys and proposes a strain-compensated Arrhenius constitutive equation. Furthermore, through error analysis, a modified model to predict flow stress under diverse conditions has been developed. Currently, the strain-compensated Arrhenius constitutive model is widely adopted for describing the high-temperature deformation behavior of aluminum alloys. However, for rare-earth aluminum alloys, this model can only characterize the true stress–strain curves within a strain of 0.085. In actual hot stamping processes, the material deformation strain often exceeds 0.085, which limits the engineering application of the conventional strain-compensated Arrhenius constitutive equation. In contrast, the modified Arrhenius constitutive model developed in the present work is capable of precisely depicting the flow stress within the scope of experimental data and extrapolating to those outside the experimental data range. This broadens the strain range for characterizing the high-temperature deformation behavior of the material, thereby providing a theoretical basis for the numerical simulation of actual hot stamping processes.
2. Materials and Methods
The experimental material was a 2 mm thick high-strength rare-earth aluminum alloy sheet. Following solution treatment at 751 K for 30 min and water quenching, it was subjected to aging at 393 K for 24 h. Its chemical composition is provided in Table 1. The experimental material exhibits a room temperature tensile strength of 680 MPa, a yield strength of 650 MPa, and an elongation until fracture of approximately 12%. Figure 1 shows the original microstructure of the rare-earth aluminum alloy sheet after chemical etching, revealing a typical banded microstructure.

Table 1.
Chemical composition of Al-Zn-Mg-Cu-Er alloy sheet.
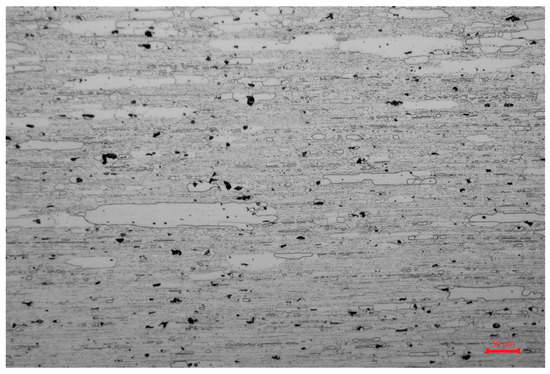
Figure 1.
Initial microstructure of Al-Zn-Mg-Cu-Er alloy sheet.
Based on the hot stamping temperature range of the Al-Zn-Mg-Cu alloy, the stamping forming strain rate was simulated. High-temperature isothermal uniaxial tensile tests were performed on a Gleeble 3500 thermal simulation testing machine (DSI Inc., New York, NY, USA), which enables direct output of true stress–strain experimental data and precise control of the strain rate during material high-temperature deformation under the Strain Control mode. Experiments were performed over a strain rate range of 0.01–1 s−1 and a temperature range of 623–723 K. The dimensions of the isothermal tensile specimen are shown in Figure 2. The studied alloy sheet was cut into tensile specimens using a wire electrical discharge machine, with the specimen’s length direction aligned parallel to the rolling direction. The tensile specimens were polished by 400-grit silicon carbide sandpaper. The welding locations of the thermocouples and the corresponding specimen installation configuration are presented in Figure 3 and Figure 4.
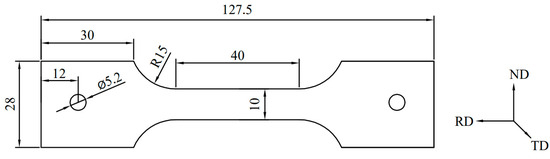
Figure 2.
Dimensions of test specimen.
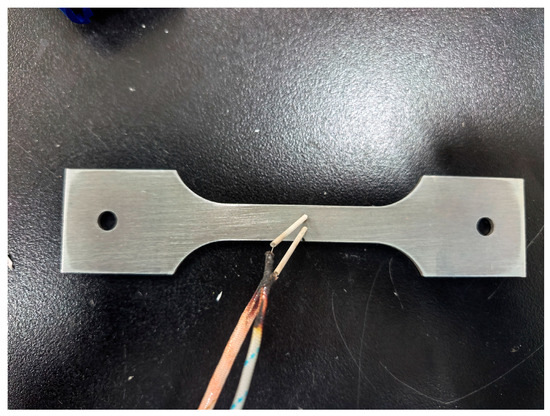
Figure 3.
Thermocouple welding position.
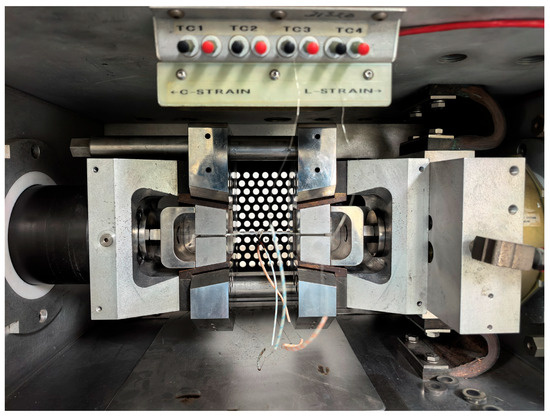
Figure 4.
Specimen clamping method.
Based on the hot stamping process of the aluminum alloy, a uniaxial hot tensile test scheme was devised. The procedure for the hot tensile test was as follows: the specimen was heated to 723.15 K at a rate of 10 K/s, then further heated to 751.15 K at 5 K/s and held for 30 min. Subsequently, the specimen was cooled to the deformation temperature at a cooling rate of 20 K/s, maintained for 10 s to achieve temperature uniformity within the gauge length, and then stretched under constant temperature and strain rate until fracture, followed by water quenching. This process is illustrated in Figure 5.
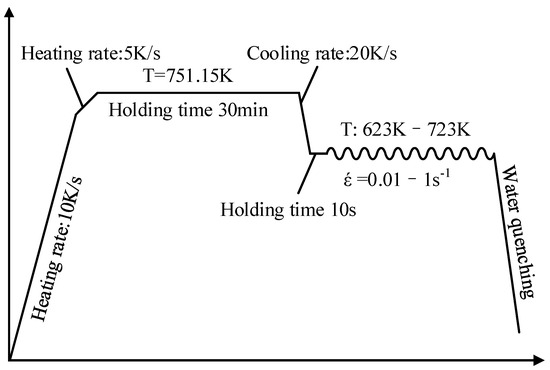
Figure 5.
Schematic illustrations of isothermal tensile.
After water quenching, the deformed specimen was sectioned along the compression axis using wire electrical discharge machining, followed by rough grinding, fine grinding, polishing, and etching. The metallographic etching solution consisted of 1% HF, 1.5% HCl, 2.5% HNO3, and 95% H2O. The optical microstructure was observed using an optical microscope. The original sheet microstructure exhibited elongated, banded grains that were relatively coarse.
3. Results and Discussion
3.1. High-Temperature Flow Stress Behavior
Figure 6 illustrates the true stress–strain curves of the rare-earth aluminum alloy, which were derived from isothermal tensile experiments performed under three distinct temperature levels and three varying strain rates. It can be observed that at small true strains, the flow stress increases rapidly with increasing strain, a stage where work hardening dominates the deformation behavior. After reaching the peak stress, the true stress continuously decreases, indicating that softening mechanisms—such as dynamic recovery or dynamic recrystallization—have surpassed work hardening as the dominant process.
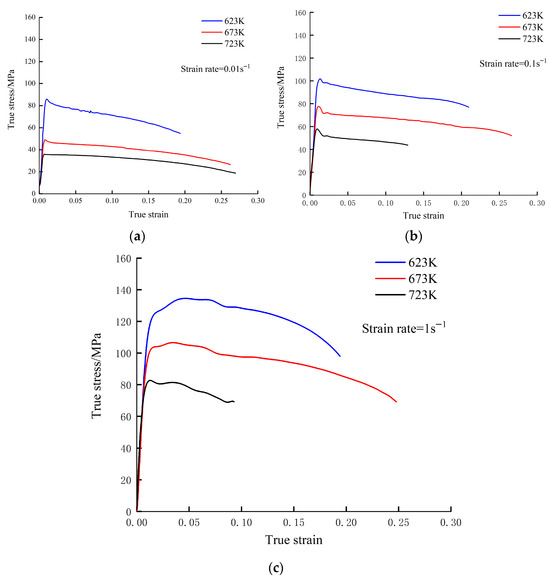
Figure 6.
Flow stress curves of Al-Zn-Mg-Cu-Er alloy under different temperatures: (a) 623 K; (b) 673 K; (c) 723 K.
At a constant strain rate, higher temperatures result in lower true stress. Conversely, at a constant temperature, higher strain rates lead to greater true stress. This phenomenon can be attributed to the fact that high strain rates shorten the deformation time, thereby suppressing thermal softening mechanisms. Specifically, the duration available for dynamic recovery and dynamic recrystallization decreases as the strain rate increases, leading to reduced effectiveness of thermal softening. Consequently, the material exhibits significant strain rate sensitivity.
The peak stress during high-temperature deformation of the material varies with deformation temperature and strain rate. As the temperature increases, the peak stress decreases significantly due to the acceleration of thermally activated softening processes, which reduces the material’s resistance to deformation. Conversely, an increase in strain rate leads to a notable rise in peak stress, attributable to the shortened deformation time, reduced duration for thermal softening, and more pronounced work hardening effects. When the temperature rises or the strain rate decreases, the position of the peak stress shifts to the left in the stress–strain curve. This occurs because higher temperatures promote the earlier initiation of softening mechanisms, while lower strain rates allow sufficient time for thermal softening to fully develop, both contributing to an earlier occurrence of peak stress. It can be observed from Figure 7 that a three-dimensional surface fitting of peak stress, lg(έ), and temperature was performed to derive an equation describing the variation in peak stress with deformation temperature and strain rate. The correlation coefficient (R2) between the calculated values from the derived equation and the measured data is 0.992.
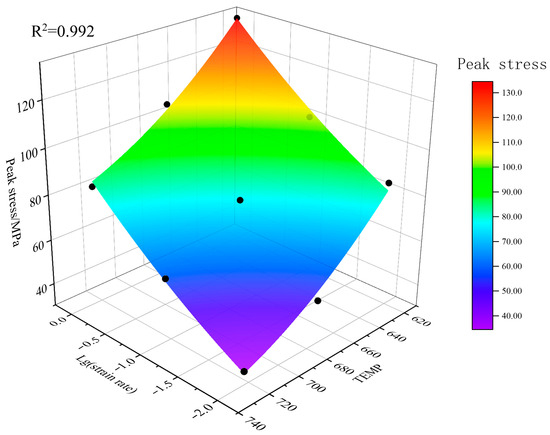
Figure 7.
The amount of peak stress influenced by lg(έ) and temperature.
In summary, the high-temperature deformation mechanisms of rare-earth aluminum alloys are simultaneously influenced by both the deformation temperature and the strain rate. The morphology of their high-temperature flow curves reflects the competitive outcome between dynamic recovery/recrystallization and work hardening. Therefore, analyzing the high-temperature deformation of rare-earth aluminum alloys necessitates the concurrent consideration of the effects of temperature and strain rate
3.2. Microstructure Evolution
During hot deformation, the changes in the mechanical properties of metallic materials are closely related to their microstructural evolution. Variations in hot deformation parameters alter the microstructure of the material, which in turn influences the dominant deformation mechanisms. Consequently, the mechanical properties of the material are modified, ultimately affecting its final formability and dimensional accuracy.
Figure 8 presents the micrographs of the Al-Zn-Mg-Cu-Er alloy under different hot-deformation parameters, with all images taken at a magnification of 500×. The microstructural characteristics differ remarkably from those of the original sheet and display an obvious dependence on the applied deformation parameters. Under a deformation temperature of 623 K, the microstructure displays a fibrous, band-like distribution, with deformed grains plastically elongated along the stretching direction. Most grain boundaries are relatively aligned, characteristic of a dynamic recovery structure. At strain rates of 0.01 s−1 and 0.1 s−1, no significant recrystallized grains are observed. However, at a strain rate of 1 s−1, a small number of recrystallized equiaxed grains locally appear. As the deformation temperature increases to 673 K, grain boundaries begin to evolve from a fibrous morphology to a riverine pattern with increasing strain rate. At 723 K, distinctly recrystallized equiaxed grains emerge. The extent of recrystallization decreases with increasing strain rate, which can be attributed to the longer duration of thermal exposure at lower strain rates, allowing more sufficient dynamic recrystallization.
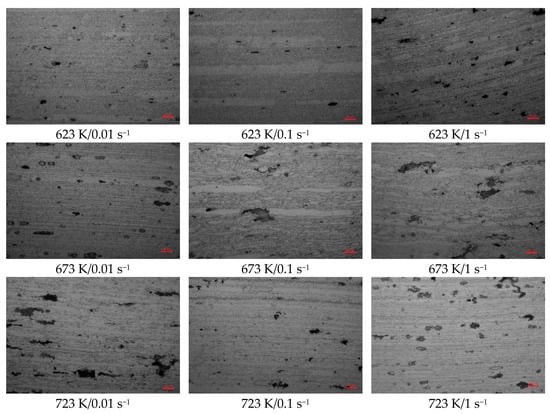
Figure 8.
OM images under different deformation conditions.
3.3. Arrhenius Constitutive Model
The Arrhenius constitutive model is widely used to describe the relationship between strain rate, flow stress, and temperature at high temperatures, taking into account the strain activation energy. The thermal activation energy governs dislocation motion, grain boundary slip, and diffusion processes in metals. Typically, as the deformation temperature increases, the thermal activation energy also increases, enhancing dislocation slip and diffusion capabilities, leading to dynamic dislocation recovery that reduces flow stresses. An increase in strain rate results in higher dislocation density and increased viscous forces during material deformation, thereby raising the material’s flow stress. Figure 6 illustrates how changes in deformation temperature, strain rate, and strain impact flow stress. For the precise description and prediction of alloys’ thermal deformation behavior, establishing a flow stress constitutive equation is indispensable—this equation elucidates the correlations among flow stress, temperature, strain rate, and strain as key variables. The mathematical expression of the Arrhenius constitutive model is presented as follows:
where έ is the strain rate (s−1); A is the material antecedent factor; Q is the activation energy (kJ/mol); R is the gas constant (8.314 J/(mol-K)); T is the absolute temperature of deformation (K); σ is the true stress (MPa); and F(σ) is the stress correlation function, which is divided into three expressions:
where α, n, β, and n1 are material constants, α = β/n1, and n is the stress exponent.
The Z parameter in the Arrhenius constitutive equation serves to characterize the influence of strain rate and temperature on flow stress variations, as expressed in Equation (4).
From Equations (3) and (4), it is evident that stress is solely dependent on temperature and strain rate. However, numerous studies have indicated that material constants exhibit variations with strain. Therefore, introducing strain into the constitutive equation is crucial for predicting flow stress with greater accuracy. Using the aforementioned calculations, the parameters α, Q, n, and lnA were determined across a strain range of 0.01–0.085.
For instance, considering a strain of 0.03, The values of n1 and β can be obtained from the mean slopes of the ln(έ) − lnσ and ln(έ) − σ curves by means of Equation (6), as shown in Figure 9a,b. Following this, the stress multiplier α—defined as α = β/n1—can be determined. The calculation procedure for the activation energy Q is outlined as Equation (5) [23]:
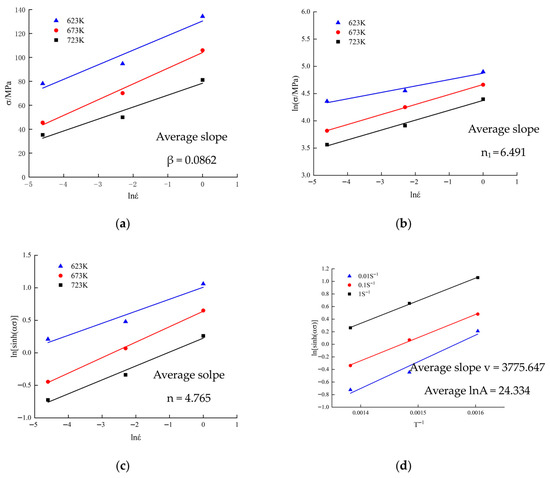
Figure 9.
Relationship between (a) lnέ − σ; (b) lnέ − lnσ; (c) lnέ − ln[sinh(ασ)]; and (d) 1/T − ln[sinh(ασ)].
With the use of Equation (6) and experimental flow stress data, the relations of lnέ versus ln[sinh(ασ)] can be generated, which are illustrated in Figure 9c and Figure 9d, respectively. The mean slopes of these parallel straight lines can act as approximate values of n and v under given temperature and strain rate conditions.
Utilizing the calculated values of α and Q, it can be deduced from Equation (7) that the 1/T − ln[sinh(ασ)] intercept, which is given as (ln(έ) − lnA)/n, can be evaluated as lnA. Moreover, the 1/T − ln[sinh(ασ)] intercept can be adjusted to be represented by the symbol “w”.
Through the repetition of the above-described calculation process, the lnA, α, n, and Q parameters can be acquired corresponding to different strain levels. Within the present research, these material constants were derived for strains spanning from 0.01 to 0.085 with an incremental step of 0.005. Figure 10 illustrates the correlations between the material constants (lnA, α, n, Q) and true strain. To maximize the accuracy of parameter fitting, a variety of polynomial functions were employed. The fourth-degree polynomial fit provided the highest accuracy for α, the fifth-degree polynomial fit yielded the highest accuracy for n, and the functions obtained from the sixth-degree polynomial fits of Q and lnA displayed high correlation coefficients. Through polynomial fitting, an intrinsic model for strain-compensated rare-earth aluminum alloy was developed with the following mathematical expression:
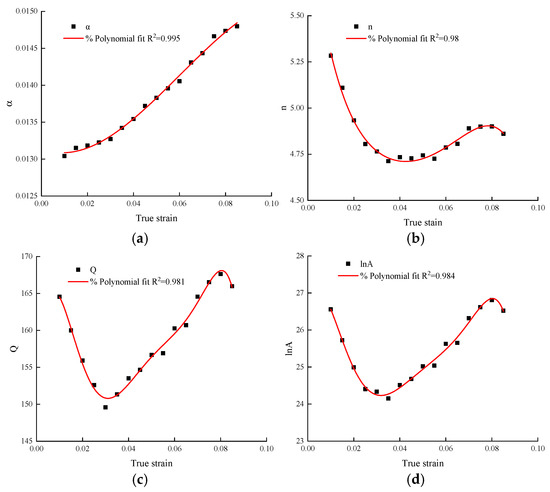
Figure 10.
Relationships between material parameters: (a) α; (b) n; (c) Q; (d) lnA; and true strain ε by polynomial fitting.
Equation (8) presents the results of fitting the material parameters, which are summarized in Table 2. The accuracy of the principal model was evaluated using the correlation coefficient (R2) and the average relative error (AARE). The correlation coefficient (R2) was adopted to evaluate the intensity of the linear correlation between the experimental data and the predicted outcomes. Its calculation formula is presented in Equation (9) [23]. Meanwhile, to quantify the comprehensive relative deviation between experimental results and predicted values, the average absolute relative error (AARE) was adopted. Its computational expression is presented in Equation (10) [23].
Table 2.
Coefficients of polynomial for material parameters.
The strain-compensated Arrhenius constitutive model is employed to forecast flow stresses across a range of experimental conditions. The comparison between the predicted and experimental results is illustrated in Figure 11a–c. When assessing the strain range of 0.01–1 against the experimental values within the range of 0.01–0.085, the accuracy of the strain-compensated Arrhenius constitutive equation predictions is notably superior. However, beyond this range, the accuracy of the constitutive equation diminishes significantly. In Figure 11d, it is found that the correlation coefficient R2 for experimental versus predicted stress is 0.75609, with an AARE of 9.729% when the predicted strain range is set as 0.01–1. The conventional Arrhenius model fails to reliably characterize the stress–strain behavior of rare-earth alloys under elevated-temperature environments. It exhibits a substantial computational error when strains exceed the scope of the calculations. Furthermore, polynomial fitting is effective only within the range of experimental data, failing to capture the trend of flow stress changes with strain. To enhance both the fitting precision and prediction model accuracy, the utilization of higher-order constitutive equations is recommended.
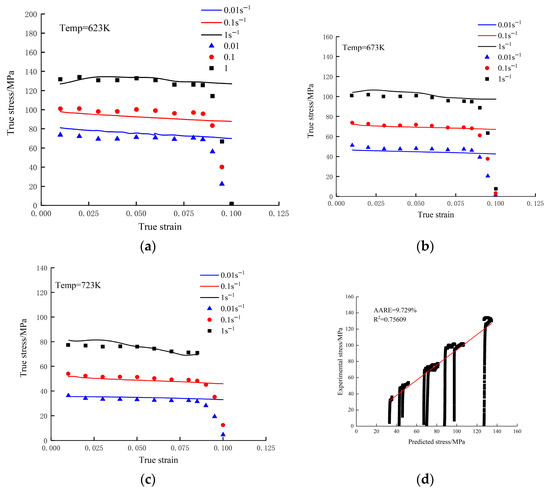
Figure 11.
Measured stress values (curves) and predicted values obtained from the strain-compensated Arrhenius constitutive equation (dots): (a) 623 K; (b) 673 K; (c) 723 K; (d) correspondence between measured and calculated flow stress values.
3.4. Arrhenius Constitutive Model Modification
Due to the inability of the strain-compensated Arrhenius constitutive model to predict rheological stresses beyond the strain range of experimental data, it is necessary to revise the high-temperature tensile Arrhenius constitutive model for rare-earth aluminum alloys.
3.4.1. Function Modification of Arrhenius Constitutive Model
The conventional solution of the Arrhenius constitutive equation requires the fitting of four material parameters at various strains, namely, lnA, α, n, and Q. The computational process is intricate and computationally intensive, leading to a large computational volume. Hence, a transformation is made to the original expression of the Arrhenius constitutive equation, which reduces both the number of material parameters and the computational volume.
This transformation allows for the representation of Equations (2)–(4) at all stress levels.
The effect of deformation temperature and strain rate on the flow stress of aluminum alloy materials can be expressed in terms of the Zener–Hollomom parameter Z.
The Arrhenius constitutive equation for describing the relationship between strain rate, flow stress, and temperature is obtained with the expression:
Bringing in Equations (5), (7) and (12), and obtaining :
From Section 3.3, it can be seen that v is the slope of 1/1000 T − ln[sinh(ασ)], and w is the y-intercept of 1/1000 T − ln[sinh(ασ)]:
Substituting Equation (14) into Equation (13) gives:
Letting , the form of Equation (16) becomes:
Letting:
Then:
By referring to Equation (16), the Arrhenius constitutive equation is simplified from calculating four strain-dependent parameters (α, n, Q, lnA) to calculating three strain-dependent parameters (α, v, w).
3.4.2. Determination of α(ε, T)
In the conventional Arrhenius constitutive model, n1 and β—material parameter values—can be extracted from the average slopes corresponding to −lnσ and −σ, respectively.
The parameter α can be derived from β/n1 and is solely dependent on strain. However, it is evident from Figure 9a,b that the slopes at different temperatures vary significantly, leading to potential errors. To address this, after dividing the slopes of −lnσ and −σ at the same temperature, the resulting α values at various temperatures (as displayed in Figure 12a) indicate that the variation in α with strain is minimal. Nevertheless, the value of α experiences a substantial change with temperature, increasing as the temperature rises. As a result, α is considered to be a function of both strain and temperature. By plotting the true strain on the x-axis, temperature on the y-axis, and α value on the z-axis, a surface representing α is constructed. The surface equation is then fitted to obtain Equation (20) using the specific parameters detailed in Table 3. The resulting fitted R2 value is 0.9996.
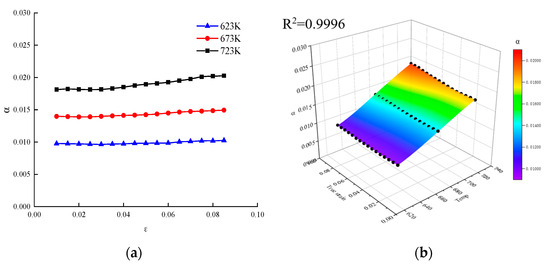
Figure 12.
Changes in α(ε, T) (a) with respect to T and ε; (b) 3D graphical representation of α(ε, T) through curved surface fitting.
Table 3.
Fitting equation coefficient of α.
3.4.3. Determination of v(ε, έ) and w(ε, έ)
From Section 3.3, v and w represent the slope and intercept, respectively. The values of v and w exhibit varying trends under different strain rates, as illustrated in Figure 13a,c. Specifically, v and w show opposite trends as strain increases, and these trends are contrary to those observed at strain rates of 1, 0.01, and 0.1. Within the strain range of 0.01–0.085, the range of v values decreases with increasing strain rate at different rates, while the domain of w values increases with higher strain rates. This sensitivity of v and w to changes in strain and strain rate leads to diverging trends at different rates, significantly impacting the accuracy of stress prediction.
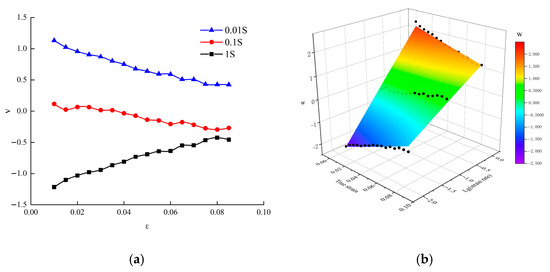
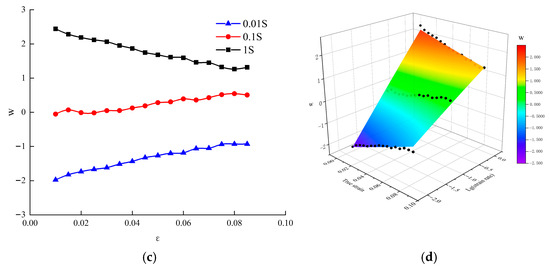
Figure 13.
(a) Variation in v(ε, έ) with respect to true strain and strain rate; (b) 3D graphical representation of v(ε, έ) through curved surface fitting; (c) variation in w(ε, έ) with respect to true strain and strain rate; (d) 3D graphical representation of w(ε, έ) through curved surface fitting.
Thus, regarded as functions dependent on the logarithm of strain and strain rate, v and w have their fitted results presented in Figure 13b,d. The fitting equation coefficient of v and w are shown in Table 4 and Table 5, respectively. For different strain and strain rate conditions, the correlation coefficients (R2) derived from the nonlinear 3D surface fitting of v(ε, έ) and w(ε, έ) are 0.986 and 0.993, respectively. The mathematical expressions of v(ε, έ) and w(ε, έ) can be presented by Equations (21) and (22).
Table 4.
Fitting equation coefficient of v.
Table 5.
Fitting equation coefficient of w.
3.4.4. Analysis of the Regularity of 1/α
As indicated by Equation (19), H(η) is the product of parameter α and the flow stress σ. Based on Equation (18), the values of H(η) under different deformation temperatures and strain rates within the strain range of 0.01 to 0.085 can be calculated, as shown in Figure 14.
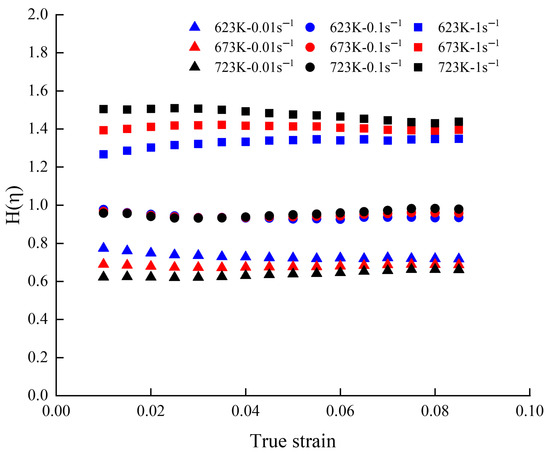
Figure 14.
Variation in H(η) with true strain, strain rate, and temperature.
At a strain rate of 0.1 s−1, the value of H(η) falls within the range of 0.92 to 0.98, approaching unity, indicating that temperature has negligible influence on H(η) under this condition. Consequently, the relationship 1/α ≈ σ can be reasonably applied. A comparison between 1/α and the stress–strain curves at different temperatures is presented in Figure 15a contrasts the experimentally calculated 1/α values with the high-temperature tensile stress–strain curve, while subfigure (b) compares the 1/α values derived from the α surface fitting equation in Equation (20) with the corresponding high-temperature tensile stress–strain curve. At a deformation temperature of 623 K, the experimental 1/α values show better consistency with the stress–strain curve than the fitted 1/α values. The error in the fitted 1/α increases with accumulating strain, which is attributed to inaccuracies in the α fitting itself and the progressive deviation in H(η) from unity as strain increases at 623 K. In contrast, at deformation temperatures of 673 K and 723 K, both the experimental and fitted 1/α values correlate well with the corresponding stress–strain curves. Notably, the fitted 1/α maintains good agreement with the curve even when extrapolated beyond the range of the experimental data, demonstrating the high predictive accuracy of the surface fitting equation beyond its original calibration domain. Therefore, at a strain rate of 0.1 s−1, the value of 1/α can be effectively equated to the flow stress value.
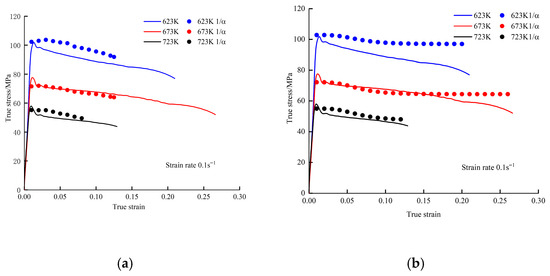
Figure 15.
(a) Comparisons between 1/α calculated based on experimental data and experimented flow stresses; (b) comparisons between 1/α calculated based on fitting function and experimented flow stresses.
3.4.5. Analysis of the Regularity of H(η)
From Equation (18), it can be seen that H(η) is determined by temperature, strain rate, and strain. When the strain rate is 0.01, H(η) decreases as temperature increases, with the value range of H(η) at different temperatures being (0.6–0.8); when the strain rate is 0.1, the value range of H(η) is (0.92, 0.98), and H(η) barely changes with temperature. When the strain rate is 1, H(η) increases as temperature increases, with the value range of H(η) being (1.2, 1.4). It can be seen that the values of H(η) at different temperatures under the same strain rate vary little, indicating that temperature has a small impact on H(η). At the same temperature, the value range of H(η) under different strain rates increases with the increase in strain rate, and the distribution of the value range is wider, indicating a greater impact of strain rate; under identical temperature and strain rate conditions, H(η) values exhibit no obvious variation under increasing strain; therefore, the data scope of H(η) is mainly influenced by strain rate.
As can be seen from Figure 15, at the same deformation temperature, the strain rate sensitivity H(η) increases with the rise in deformation temperature, indicating a positive correlation between the strain rate sensitivity and deformation temperature of rare-earth aluminum alloys. At higher deformation temperatures, the internal atomic diffusion of rare-earth aluminum alloys becomes more active, requiring a higher activation energy. When the strain rate is low, the material has sufficient time for atomic diffusion, whereas at high strain rates, the material cannot complete the same diffusion process in a short period of time. Therefore, to achieve the same strain amount, the material requires higher stress at high strain rates. Hence, H(η) reflects the trend of the variation in strain rate sensitivity of the material at different temperatures.
3.4.6. Verification of Modified Constitutive Model Function
Based on the computational findings in Section 3.3, it is apparent that a notable discrepancy exists between experimental and predicted stress values for the conventional Arrhenius constitutive model when the applied strain range goes beyond the scope of experimental data. The modified Arrhenius constitutive equation proposed for rare-earth aluminum alloys—applicable within the temperature interval of 623–723 K, strain rate scope of 0.01–1 s−1, and strain range of 0.01–0.1—may be expressed as Equation (23).
The flow stresses predicted by the modified intrinsic equation at temperatures ranging from 627 to 723 K, taking the impacts of deformation parameters into account, are presented in Figure 16a–c. By comparing the strain-compensated model illustrated in Figure 11 with the modified model presented in Figure 16, the findings reveal that the latter exhibits greater precision even with a slight deviation from the scope of experimental data. The accuracy of the forecast outcomes is notably elevated, and modified eigenequations can more effectively predict stress changes in rare-earth aluminum alloys beyond the scope of experimental data. This suggests that modified eigenequations can more precisely capture the flow stress trends of rare-earth aluminum alloys. Essentially, when describing the flow stress trend using the intrinsic equation, it is inevitable to consider changes in material parameters rather than treating them as constants.
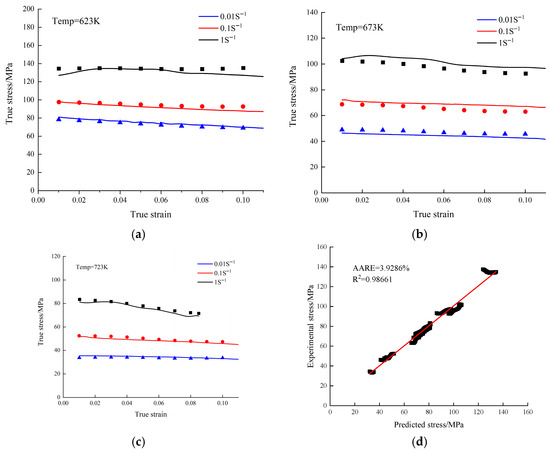
Figure 16.
Measured stress values (curves) and predicted values obtained from the modified Arrhenius constitutive equation (dots): (a) 623 K; (b) 673 K; (c) 723 K; (d) correspondence between measured and calculated flow stress values.
To facilitate a better comparison of the accuracy between experimental and predicted stresses, the R2 and AARE parameters were computed, and the correlation between predicted and experimental flow stresses is illustrated in Figure 16d. It is evident that the correlation coefficient R2 is 0.98611, and AARE is 3.9286%. A comparison between these values and those in Figure 11d reveals a marked decrease in error, which reflects the higher predictive accuracy of the modified constitutive equation. With consideration of temperature, strain rate, and strain influences, the revised Arrhenius constitutive model demonstrates superior ability to predict the mechanical behavior trends of rare-earth aluminum alloys.
4. Conclusions
The high-temperature tensile deformation behavior of rare-earth aluminum alloys was investigated at 573–723 K and at a 0.01–1 s−1 strain rate through hot tensile tests. The intrinsic relationship was analyzed in conjunction with the true stress–strain curve. The flow behavior was characterized by the strain-compensated Arrhenius constitutive model and the revised Arrhenius model. The detailed conclusions are presented as follows:
(1) Flow stress curves of rare-earth aluminum alloys during hot stretching were obtained, showing that the flow stress increased with higher strain rates and decreased with lower temperatures.
(2) The strain-compensated Arrhenius constitutive model exhibits significant deviations beyond the range of experimental data, indicating that the polynomial fitting approach cannot accurately capture the variation trends of material parameters under different deformation conditions, resulting in limited extrapolation capability. However, when the fitting of parameters simultaneously accounts for the coupled effects of temperature, strain rate, and strain, the constitutive equation can achieve a certain level of extrapolation capability.
(3) The function H(η) was analyzed to understand its influence on the stress–strain behavior under different deformation temperatures and strain rates. Moreover, when the strain rate is 0.1 s−1, the relationship σ ≈ 1/α holds true.
(4) An established modified hyperbolic sinusoidal constitutive equation showed a high correlation coefficient of 0.987 between predicted and experimental stress values, with an AARE of 3.93%. This confirms the precision and the validity of the intrinsic model in forecasting the flow stress of rare-earth aluminum alloys.
The focus of this study is to propose a new constitutive model for rare-earth aluminum alloys and compare its accuracy and description range with the currently widely used strain-compensated Arrhenius constitutive model. The results indicate that the modified constitutive equation for rare-earth aluminum alloys not only exhibits high fitting accuracy but can also describe the stress–strain curves beyond the experimental data range, laying a theoretical foundation for the hot stamping process and numerical simulation of rare-earth aluminum alloy sheets. However, due to the addition of rare-earth elements, the material possesses certain corrosion resistance, which makes metallographic corrosion highly challenging and hinders the acquisition of ideal metallographic images. Therefore, other microstructural characterization methods should be adopted for further research. Future studies will focus on the thermal softening mechanism, microstructural evolution, and dislocation changes in rare-earth aluminum alloys during high-temperature tensile deformation. These aspects will be compared and verified with the new parameters in the modified constitutive equation to obtain the potential physical significance of the modified constitutive equation.
Author Contributions
Conceptualization, H.R.; Methodology, H.R. and Q.Z.; Software, H.R.; Validation, H.R.; Formal analysis, H.R.; Investigation, H.R., Q.Z. and B.D.; Resources, F.S.; Data curation, F.S. and K.C.; Writing—original draft, H.R.; Writing—review & editing, B.D.; Visualization, K.C. and Q.Z.; Supervision, B.D. All authors have read and agreed to the published version of the manuscript.
Funding
This research received no external funding.
Data Availability Statement
The original contributions presented in this study are included in the article. Further inquiries can be directed to the corresponding author.
Conflicts of Interest
Authors Fuzhen Sun, Keqian Cai and Quanda Zhang were employed by the company Beijing National Innovation Institute of Lightweight Ltd. and He Ren is a student of the same company. The remaining authors declare that the research was conducted in the absence of any commercial or financial relationships that could be construed as a potential conflict of interest.
References
- Chen, L.; Hou, Y.; Li, Z. Enhancing mechanical properties and corrosion resistance of a high strength 7A99 Al alloy by introducing pre-rolling in solution and aging treatments. J. Alloys Compd. Interdiscip. J. Mater. Sci. Solid-State Chem. Phys. 2022, 898, 162972. [Google Scholar] [CrossRef]
- Li, J.; Wu, X.; Cao, L.; Liao, B.; Liu, Q. Hot deformation and dynamic recrystallization in Al-Mg-Si alloy. Mater. Charact. 2021, 173, 110976. [Google Scholar] [CrossRef]
- Zhang, W.; Pang, Q.; Lu, J.; Hu, Z. Comparative study on deformation behavior, microstructure evolution and post-forming property of an Al-Zn-Mg-Cu alloy in a novel warm forming process. J. Mater. Process. Technol. 2023, 312, 117854. [Google Scholar] [CrossRef]
- Guo, Y.; Zhang, J.; Zhao, H. Microstructure evolution and mechanical responses of Al–Zn–Mg–Cu alloys during hot deformation process. J. Mater. Sci. 2021, 56, 13429–13478. [Google Scholar] [CrossRef]
- Zheng, K.; Dong, Y.; Zheng, J.-H.; Foster, A.; Lin, J.; Dong, H.; Dean, T.A. The effect of hot form quench (HFQ®) conditions on precipitation and mechanical properties of aluminium alloys. Mater. Sci. Eng. A 2019, 761, 138017. [Google Scholar] [CrossRef]
- Shao, Z.; Lin, J.; Ganapathy, M.; Dean, T. Experimental and modelling techniques for hot stamping applications. Procedia Manuf. 2018, 15, 6–13. [Google Scholar] [CrossRef]
- Lin, Y.; Chen, X.-M. A critical review of experimental results and constitutive descriptions for metals and alloys in hot working. Mater. Des. 2011, 32, 1733–1759. [Google Scholar] [CrossRef]
- Dehghan, H.; Abbasi, S.; Momeni, A.; Taheri, A.K. On the constitutive modeling and microstructural evolution of hot compressed a286 iron-base superalloy. J. Alloys Compd. 2013, 564, 13–19. [Google Scholar] [CrossRef]
- Huang, S.-H. Effect of strain rate and deformation temperature on strain hardening and softening behavior of pure copper. Trans. Nonferrous Met. Soc. China 2016, 26, 1044–1054. [Google Scholar] [CrossRef]
- Wang, X.; Li, Z.; Xiao, Z.; Qiu, W. Microstructure evolution and hot deformation behavior of Cu-3Ti-0.1Zr alloy with ultra-high strength. Trans. Nonferrous Met. Soc. China 2020, 30, 2737–2748. [Google Scholar] [CrossRef]
- Shi, C.; Han, M.; Zhang, K.; Lu, Z. Effects of sintering temperature on microstructure evolution and hot deformation behavior of tial-based alloys prepared by spark plasma sintering. JOM 2018, 70, 2739–2745. [Google Scholar] [CrossRef]
- Li, Z.; Fu, S.H.; Wang, T.; Zhao, Y.X.; Zhang, Y.; Zhang, M.C. Microstructure evolution and processing map of superalloy gh720li during isothermal compression. Mater. Sci. Forum 2013, 747–748, 588–593. [Google Scholar] [CrossRef]
- Lin, Y.; Chen, X.-M.; Wen, D.-X.; Chen, M.-S. A physically-based constitutive model for a typical nickel-based superalloy. Comput. Mater. Sci. 2014, 83, 282–289. [Google Scholar] [CrossRef]
- Ke, B.; Ye, L.; Tang, J.; Zhang, Y.; Liu, S.; Lin, H.; Dong, Y.; Liu, X. Hot deformation behavior and 3D processing maps of aa7020 aluminum alloy. J. Alloys Compd. 2020, 845, 156113. [Google Scholar] [CrossRef]
- Liang, X.-P.; Liu, Y.; Li, H.-Z.; Zhou, C.-X.; Xu, G.-F. Constitutive relationship for high temperature deformation of powder metallurgy Ti–47Al–2Cr–2Nb–0.2W alloy. Mater. Des. 2012, 37, 40–47. [Google Scholar] [CrossRef]
- Lin, Y.; Xia, Y.-C.; Chen, X.-M.; Chen, M.-S. Constitutive descriptions for hot compressed 2124-t851 aluminum alloy over a wide range of temperature and strain rate. Comput. Mater. Sci. 2010, 50, 227–233. [Google Scholar] [CrossRef]
- Li, C.-A.; Qin, G.; Wang, H.; Geng, P. Constitutive modeling and dynamic recrystallization mechanism elaboration of fgh96 with severe hot deformation. J. Mater. Res. Technol. 2022, 21, 2947–2964. [Google Scholar] [CrossRef]
- Li, F.; Zhu, C.; Li, S.; Jiang, H.; Zhang, P.; Yang, R.; Zhao, S. A comparative study on modified and optimized zerilli-armstrong and arrhenius-type constitutive models to predict the hot deformation behavior in 30Si2mncrmove steel. J. Mater. Res. Technol. 2022, 20, 3918–3929. [Google Scholar] [CrossRef]
- Samantaray, D.; Mandal, S.; Bhaduri, A. A comparative study on johnson cook, modified zerilli–armstrong and arrhenius-type constitutive models to predict elevated temperature flow behaviour in modified 9Cr–1Mo steel. Comput. Mater. Sci. 2009, 47, 568–576. [Google Scholar] [CrossRef]
- Ghosh, S.; Hamada, A.; Patnamsetty, M.; Borek, W.; Gouda, M.; Chiba, A.; Ebied, S. Constitutive modeling and hot deformation processing map of a new biomaterial Ti–14Cr alloy. J. Mater. Res. Technol. 2022, 20, 4097–4113. [Google Scholar] [CrossRef]
- Liu, M.; Shan, Z.; Li, X.; Zang, Y. Hot tensile deformation behavior and microstructure evolution of 7075 aluminum alloy sheet. J. Mater. Res. Technol. 2023, 24, 724–736. [Google Scholar] [CrossRef]
- Long, S.; Wu, D.-X.; Wang, S.-Y.; Jiang, Y.-P.; Xia, R.-Z.; Li, S.-S.; Zhou, Y.-T.; Peng, P.; Dai, Q.-W. An optimized constitutive model and microstructure characterization of a homogenized Al-Cu-Li alloy during hot deformation. J. Alloys Compd. 2022, 929, 167290. [Google Scholar] [CrossRef]
- Gong, H.; He, Y.-B.; Zhang, T.; Chen, K.; Wu, Y.-X.; Zhang, X.-L.; Liu, X.-L. Modified constitutive behavior model of Mg-10Gd-3Y-0.4Zr alloy during high-temperature deformation process. J. Cent. South Univ. 2023, 30, 2458–2471. [Google Scholar] [CrossRef]
- Wang, H.; Qin, G.; Li, C. A modified arrhenius constitutive model of 2219-O aluminum alloy based on hot compression with simulation verification. J. Mater. Res. Technol. 2022, 19, 3302–3320. [Google Scholar] [CrossRef]
- Xia, Y.; Shu, X.; Zhang, Q.; Pater, Z.; Li, Z.; Xu, H.; Ma, Z.; Xu, C. Modified arrhenius constitutive model and simulation verification of 2A12-T4 aluminum alloy during hot compression. J. Mater. Res. Technol. 2023, 26, 1325–1340. [Google Scholar] [CrossRef]
- Yu, Y.; Pan, Q.; Wang, W.; Huang, Z.; Xiang, S.; Liu, B. Dynamic softening mechanisms and zener-hollomon parameter of Al–Mg–Si–Ce–B alloy during hot deformation. J. Mater. Res. Technol. 2021, 15, 6395–6403. [Google Scholar] [CrossRef]
- Shi, D.; Zhang, F.; He, Z.; Zhan, Z.; Gao, W.; Li, Z. Constitutive equation and dynamic recovery mechanism of high strength cast Al-Cu-Mn alloy during hot deformation. Mater. Today Commun. 2022, 33, 104199. [Google Scholar] [CrossRef]
- Liu, H.; Cheng, Z.; Yu, W.; Wang, G.; Zhou, J.; Cai, Q. Deformation Behavior and Constitutive Equation of 42CrMo Steel at High Temperature. Metals 2021, 11, 1614. [Google Scholar] [CrossRef]
- Cao, R.; Wang, W.; Ma, S.; Yan, H.; Mu, Z.; Zhang, S. Arrhenius constitutive model and dynamic recrystallization behavior of 18CrNiMo7-6 steel. J. Mater. Res. Technol. 2023, 24, 6334–6347. [Google Scholar] [CrossRef]


Disclaimer/Publisher’s Note: The statements, opinions and data contained in all publications are solely those of the individual author(s) and contributor(s) and not of MDPI and/or the editor(s). MDPI and/or the editor(s) disclaim responsibility for any injury to people or property resulting from any ideas, methods, instructions or products referred to in the content. |
© 2026 by the authors. Licensee MDPI, Basel, Switzerland. This article is an open access article distributed under the terms and conditions of the Creative Commons Attribution (CC BY) license.