1. Introduction
Ti6Al4V alloy, renowned for its outstanding strength-to-weight ratio, corrosion resistance, and weldability, has been widely employed in the fabrication of aerospace structural components [
1]. Laser welding, a technology distinguished by high energy density and precision, plays a crucial role in the fabrication of these components. This is because it can create narrow heat-affected zones and minimize distortion [
2]. However, the mechanical performance of laser-welded joints [
3,
4], encompassing tensile strength [
5,
6], microhardness [
7,
8], and fatigue life, is significantly affected by multiple interacting process parameters, such as laser power, welding speed, defocus amount, and wire feeding speed [
9,
10]. The intricate nonlinear relationship among these parameters and the resulting mechanical properties renders the determination of optimal process conditions through traditional trial-and-error methods arduous. Such methods are not only time-consuming but also material-intensive [
11,
12].
Forward prediction models have been widely studied in numerous studies to establish correlations between process parameters and weld quality. For example, artificial neural networks (ANNs) [
13], especially backpropagation (BP) neural networks, have been utilized to predict microstructural features and mechanical properties based on input parameters [
14,
15]. Olabi et al. developed an ANN integrated with the Taguchi method to optimize CO
2 laser welding parameters, achieving satisfactory prediction accuracy for weld bead geometry [
16]. Wang et al. established a Φ-joint strength relationship and a GA-optimized BP neural network (inputs: penetration/width; outputs: welding parameters) with small errors in magnesium–CFRP riveting–welding bonding, offering a new welding quality control method [
17]. However, these studies predominantly focused on the forward mapping from process parameters to outcomes, whereas systematic research on reverse engineering, which involves deriving process parameters from target mechanical properties, remains scarce.
The reverse engineering of process parameters holds significant practical importance for engineering applications, with the aim of establishing a reliable mapping from desired mechanical properties to optimal process settings. Previous endeavors in this field have predominantly relied on response surface methods (RSMs) or simple regression models. These methods often exhibit low accuracy when dealing with highly nonlinear relationships. For example, Kumar et al. established regression models to characterize the relationship between process parameters (laser power, welding speed, and defocused position) and output responses (fusion zone width, heat-affected zone size, and fusion zone area) in fiber laser welding of 5 mm thick Ti-6Al-4V alloy [
18]. Yacout et al. conducted a study that employed response surface methodology (RSM) to develop mathematical models for predicting the mechanical properties (ultimate tensile strength (UTS) and hardness (HV)) of friction stir-welded AA6082-T6 joints [
19].
The dearth of robust reverse engineering models for laser welding process parameters can be attributed to several challenges [
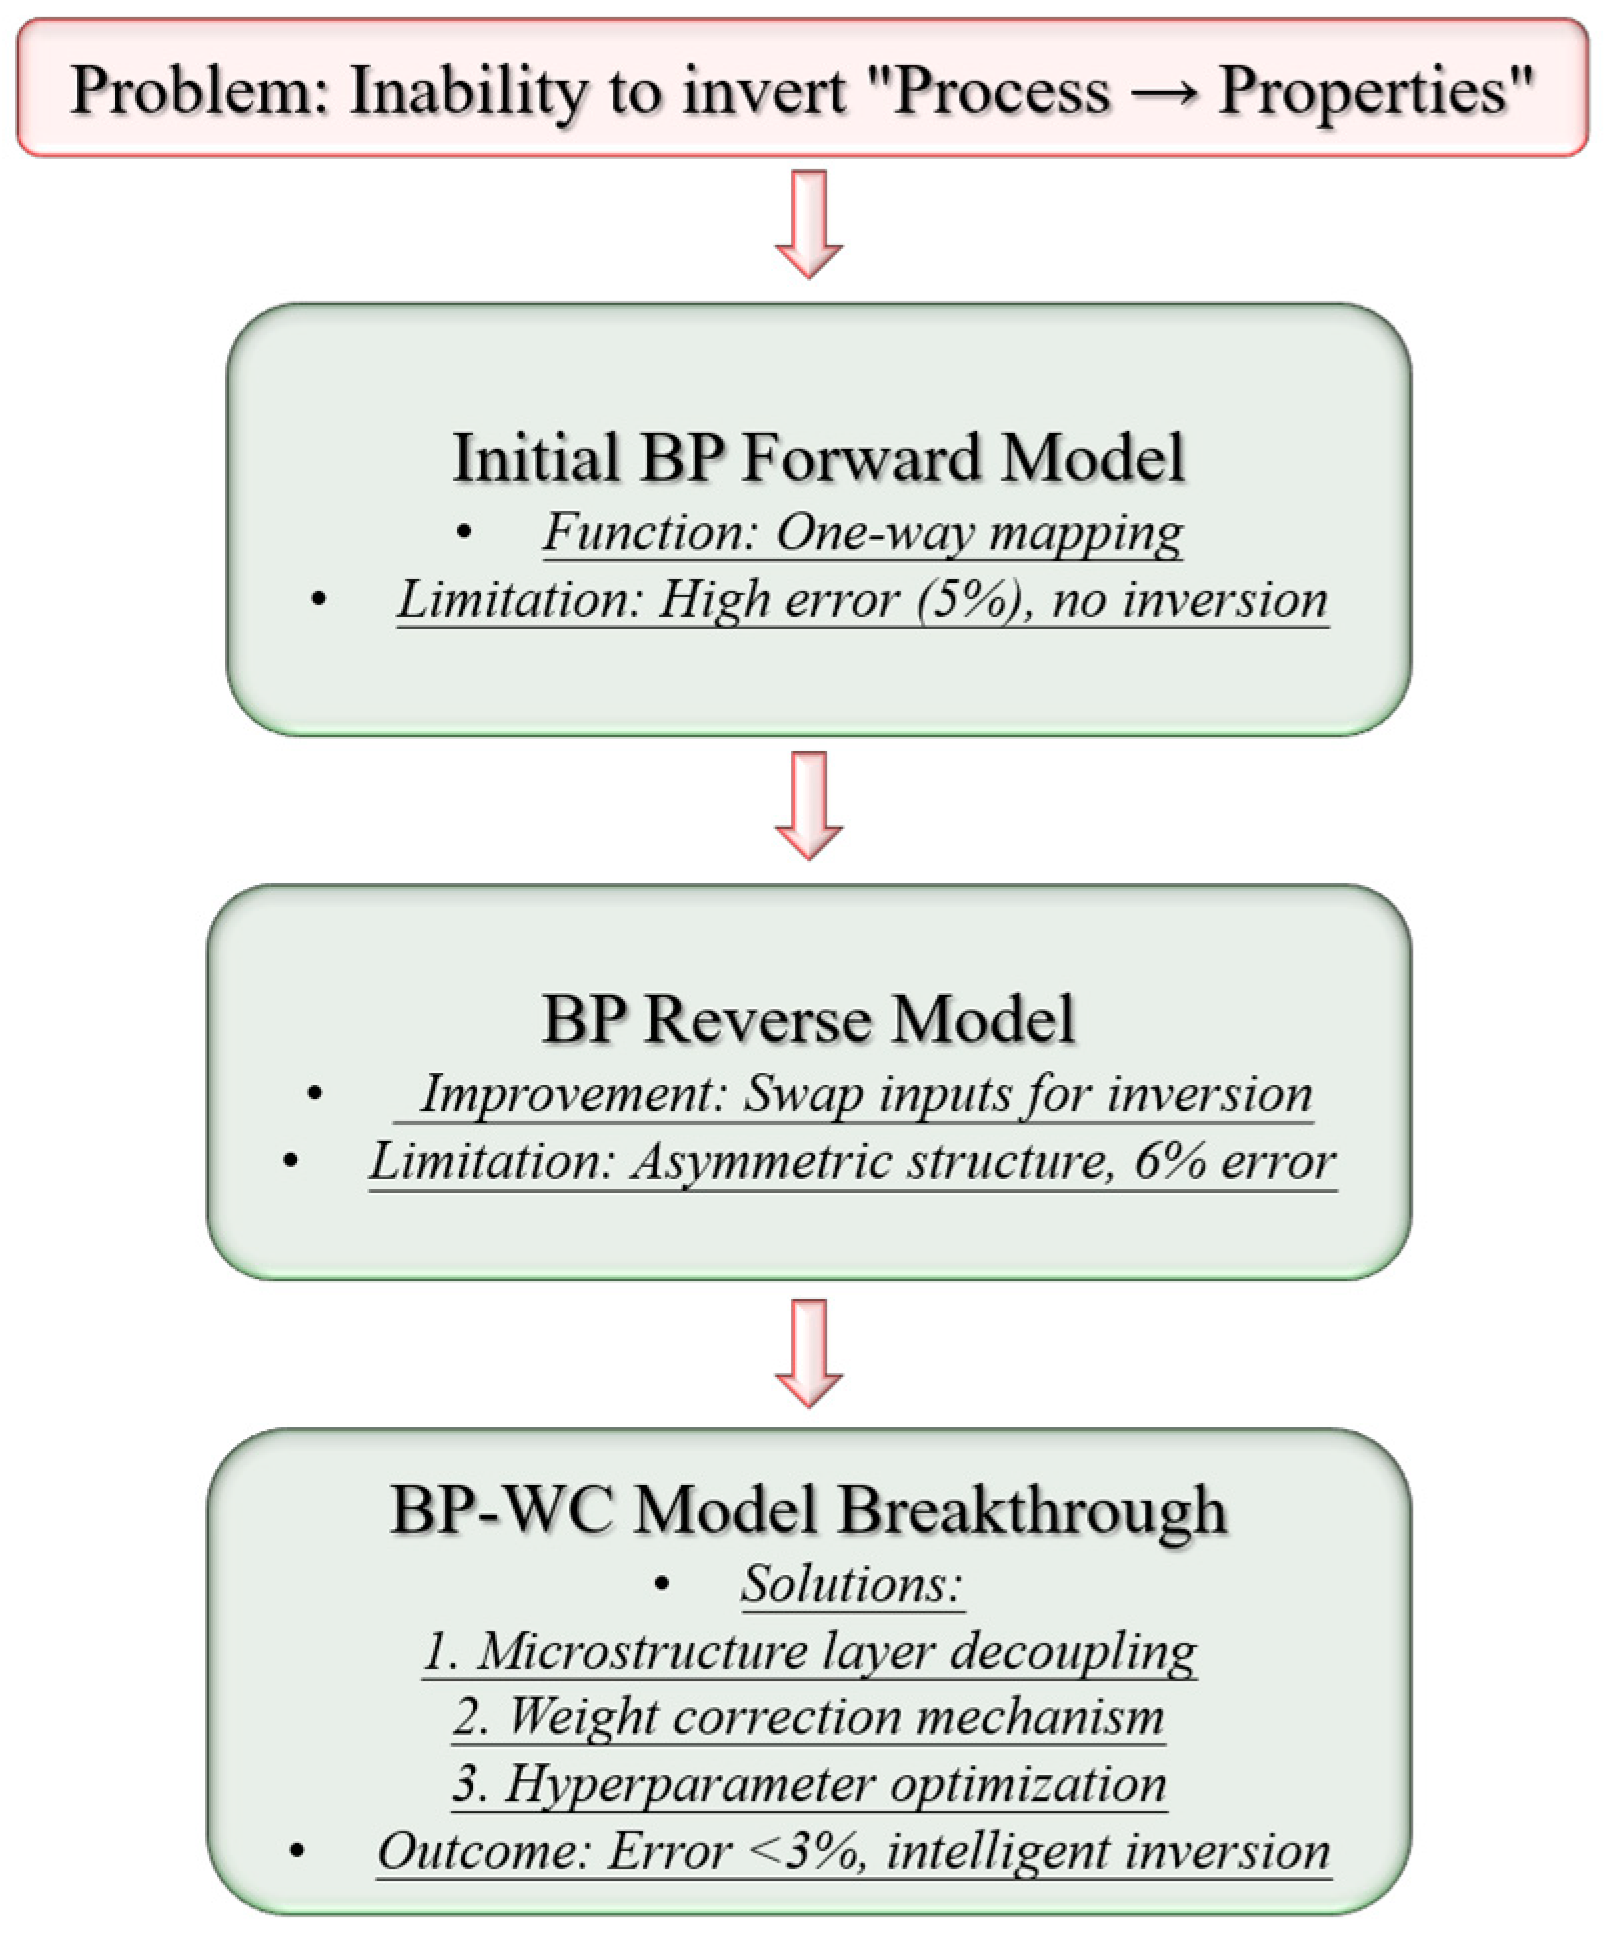
20]. Firstly, the bidirectional nonlinear mapping between parameters and properties gives rise to substantial uncertainty, particularly when multiple parameters interact concurrently. Secondly, the absence of an integrated framework that incorporates microstructural features as intermediate variables impedes the interpretability and accuracy of reverse models. Moreover, the inherent noise in experimental data and the complexity of laser welding physics further exacerbate the challenges in the reverse engineering process. Existing BP models for welding optimization primarily focus on forward mapping (process parameters—mechanical properties) and lack adaptability to noisy experimental data. The BP-WC framework introduces a weight correction (WC) mechanism that dynamically adjusts connection weights based on microstructural feature importance (e.g., martensite length), reducing prediction bias caused by uneven data distribution.
This study aims to address the gaps by developing a BP neural network-based reverse engineering model of laser welding process parameters for Ti6Al4V alloy. The specific objectives are as follows: (1) to construct a bidirectional mapping model that integrates “process parameters–microstructure–mechanical properties” to explore the underlying relationships; (2) to optimize the BP neural network via a differential evolution algorithm to enhance the accuracy of mechanical property prediction and process parameter reverse calculation; (3) to develop a novel BP-WC model based on weight coefficients to reduce reverse engineering errors; and (4) to validate the model through experimental tests for different welding gaps, thereby ensuring its feasibility for aerospace applications. By pursuing these objectives through the established models and experimental validations, this research endeavors to provide an efficient and reliable approach for the reverse engineering design of laser welding parameters.
3. Experimental Results
There remains an irreplaceable need to investigate the synergistic effect of process parameters. In actual welding processes, process parameters (laser power, welding speed, and gap) do not act in isolation; instead, they collectively regulate microstructural characteristics (e.g., martensite size, depth-to-width ratio) via intermediary mechanisms such as heat input and molten pool behavior. Suppose this synergistic effect is ignored, and conclusions are drawn solely based on the influence of individual parameters. In that case, the resulting model will struggle to reflect the physical essence of real welding processes. Consequently, subsequent construction of machine learning models may be biased due to the lack of correlation among input variables.
This study on synergistic effects thus lays a key foundation for the development of the BP-WC model. On one hand, it clarifies the basis for selecting input variables of the model: process parameters (e.g., laser power, welding speed) and microstructural features (e.g., martensite length, depth-to-width ratio) must be jointly included in the input layer, rather than relying on a single dimension. On the other hand, it reveals the chain of “parameter interaction–microstructural evolution–performance variation,” which provides physical meaning for designing “weighting coefficients” in the BP-WC model.
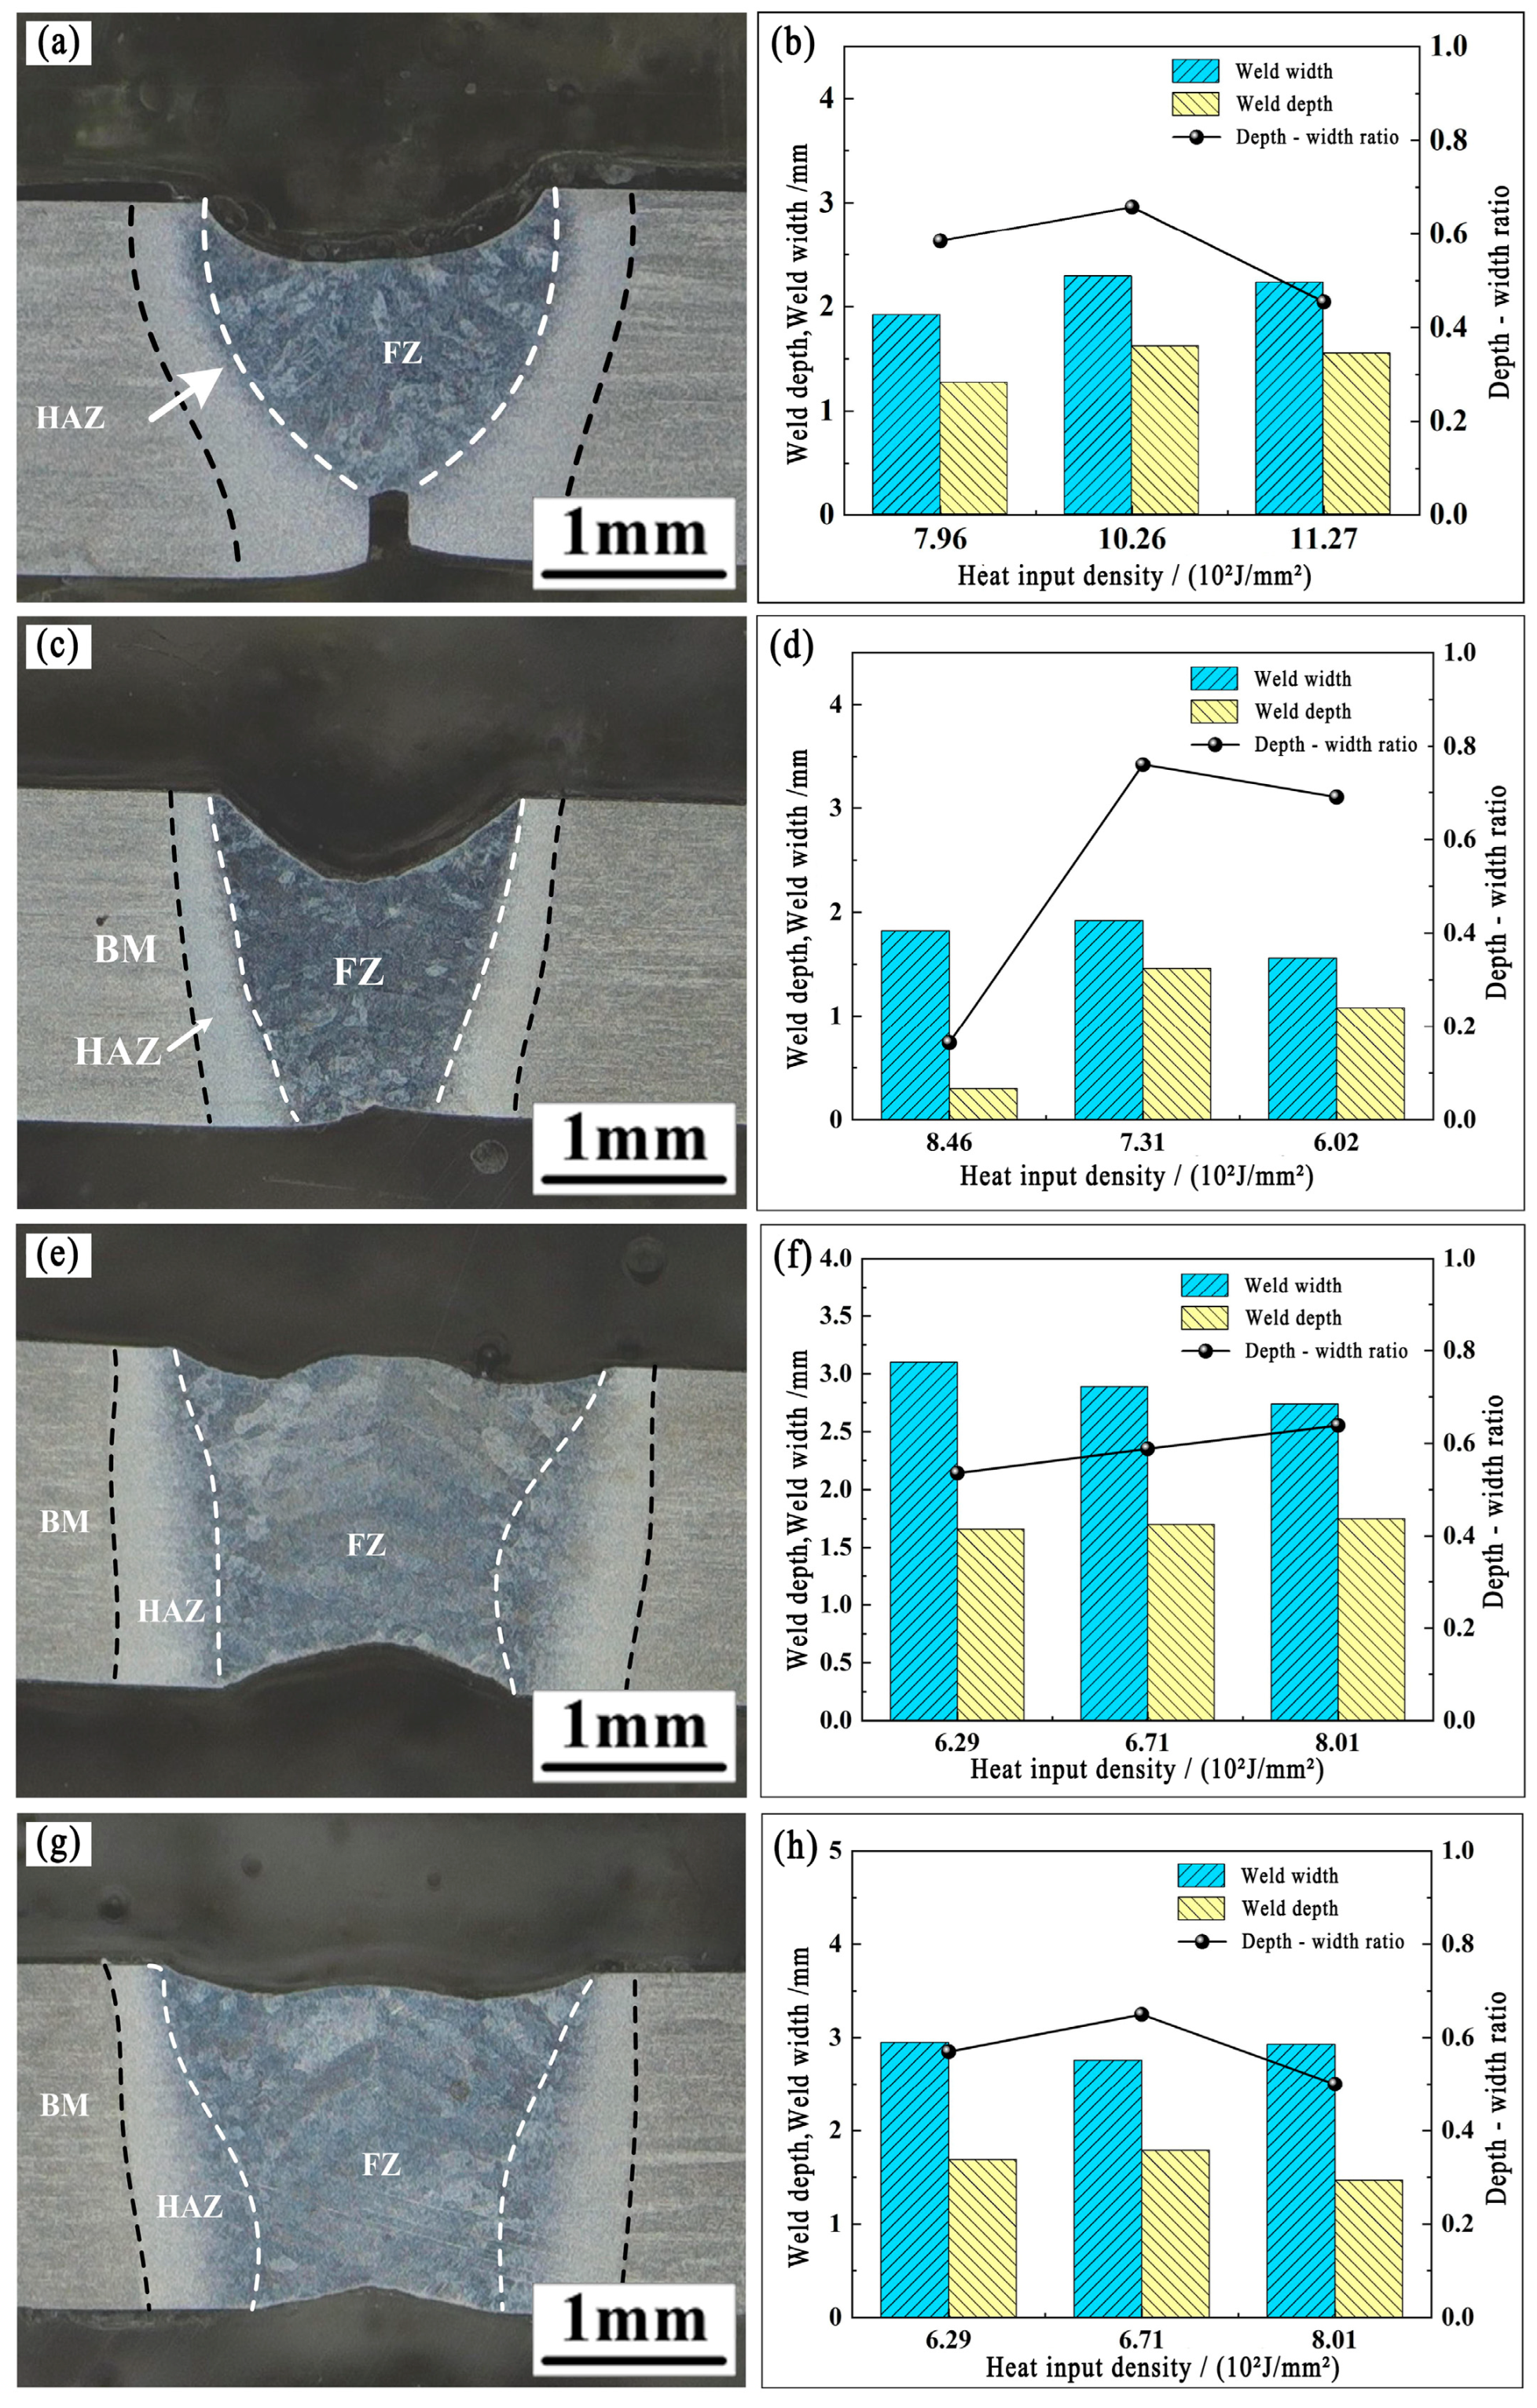
Figure 5 shows the cross-sectional morphology of Ti6Al4V alloy laser-welded joints, along with the correlations between melting depth, melt width, and heat input density. In laser autogenous welding (
Figure 5a,b), “light leakage” results in insufficient energy absorption, leading to defects such as incomplete penetration and surface collapse. The depth-to-width ratio increases under low heat input density (with melting depth growing faster than melt width) but decreases with excessive heat input (as melt width grows faster).
For gaps ≥ 0.2 mm, oscillating laser welding (
Figure 5c,d, 0.3 mm gap) was employed to mitigate intensified “light leakage,” forming a symmetric “Y”-shaped joint without obvious pores. Melting depth, melt width, and depth-to-width ratio first increase and then decrease with heat input density: low input induces heat conduction welding, high input triggers deep melting, and gap-induced energy leakage eventually reduces the ratio.
For gaps ≥ 0.3 mm, laser wire-filling welding (
Figure 5e,f, 0.4 mm gap) prevents defects, with joints exhibiting a “Y-H” transition. Melt width first decreases and then increases with heat input density, while melting depth and depth-to-width ratio show the opposite trend—low input prioritizes wire melting (with less energy absorbed by the base material), and high input saturates wire energy absorption (enabling more energy to be absorbed by the base material).
For gaps ≥ 0.4 mm, oscillating laser wire-filling welding (
Figure 5g,h, 0.5 mm gap) suppresses “light leakage,” forming an “H”-shaped joint. Melt width decreases, while melting depth and depth-to-width ratio increase with heat input density, due to dominant energy absorption by the filler wire and molten metal filling.
Welding processes regulate joint morphology through the synergistic effect of energy distribution and material supplementation (filler wire). Heat input density drives transitions in welding modes, while gap size and filling strategy affect energy utilization efficiency, collectively governing the evolution of melting depth and melt width.
Figure 6 illustrates the microstructures of Ti6Al4V alloy laser-welded joints’ fusion zones and the correlation between martensite length and heat input density under different welding processes.
Figure 6a,b show laser autogenous welding: The fusion zone is composed of longitudinal/transverse acicular α′ martensite and a small amount of parallel acicular α phase. Martensite length first decreases and then increases with heat input density—low input enhances laser stirring, which inhibits growth, while high input weakens stirring and slows cooling, leading to coarsening.
Figure 6c,d present oscillating laser welding: The fusion zone has a similar structure (acicular α′ martensite and α phase), but the martensite length is significantly smaller than that in autogenous welding, attributed to enhanced molten pool stirring induced by the oscillating laser beam. It continues to decrease with increasing heat input, as the stirring effect is strengthened.
Figure 6e,f display laser wire-filling welding: The fusion zone contains acicular α′ martensite and Widmannstätten structure. The filler wire promotes martensite formation, resulting in a larger martensite length compared to autogenous welding; higher heat input, enhanced laser stirring, and homogenized solute diffusion gradually reduce the martensite length.
Figure 6g,h show oscillating laser wire-filling welding: The fusion zone consists of directional acicular α′ martensite and α phase, with a smaller martensite size than that in wire-filling welding alone. Martensite length decreases initially (strengthened oscillation stirring inhibits growth) but increases when heat input exceeds a threshold (stirring saturates, and cooling slows, allowing growth).
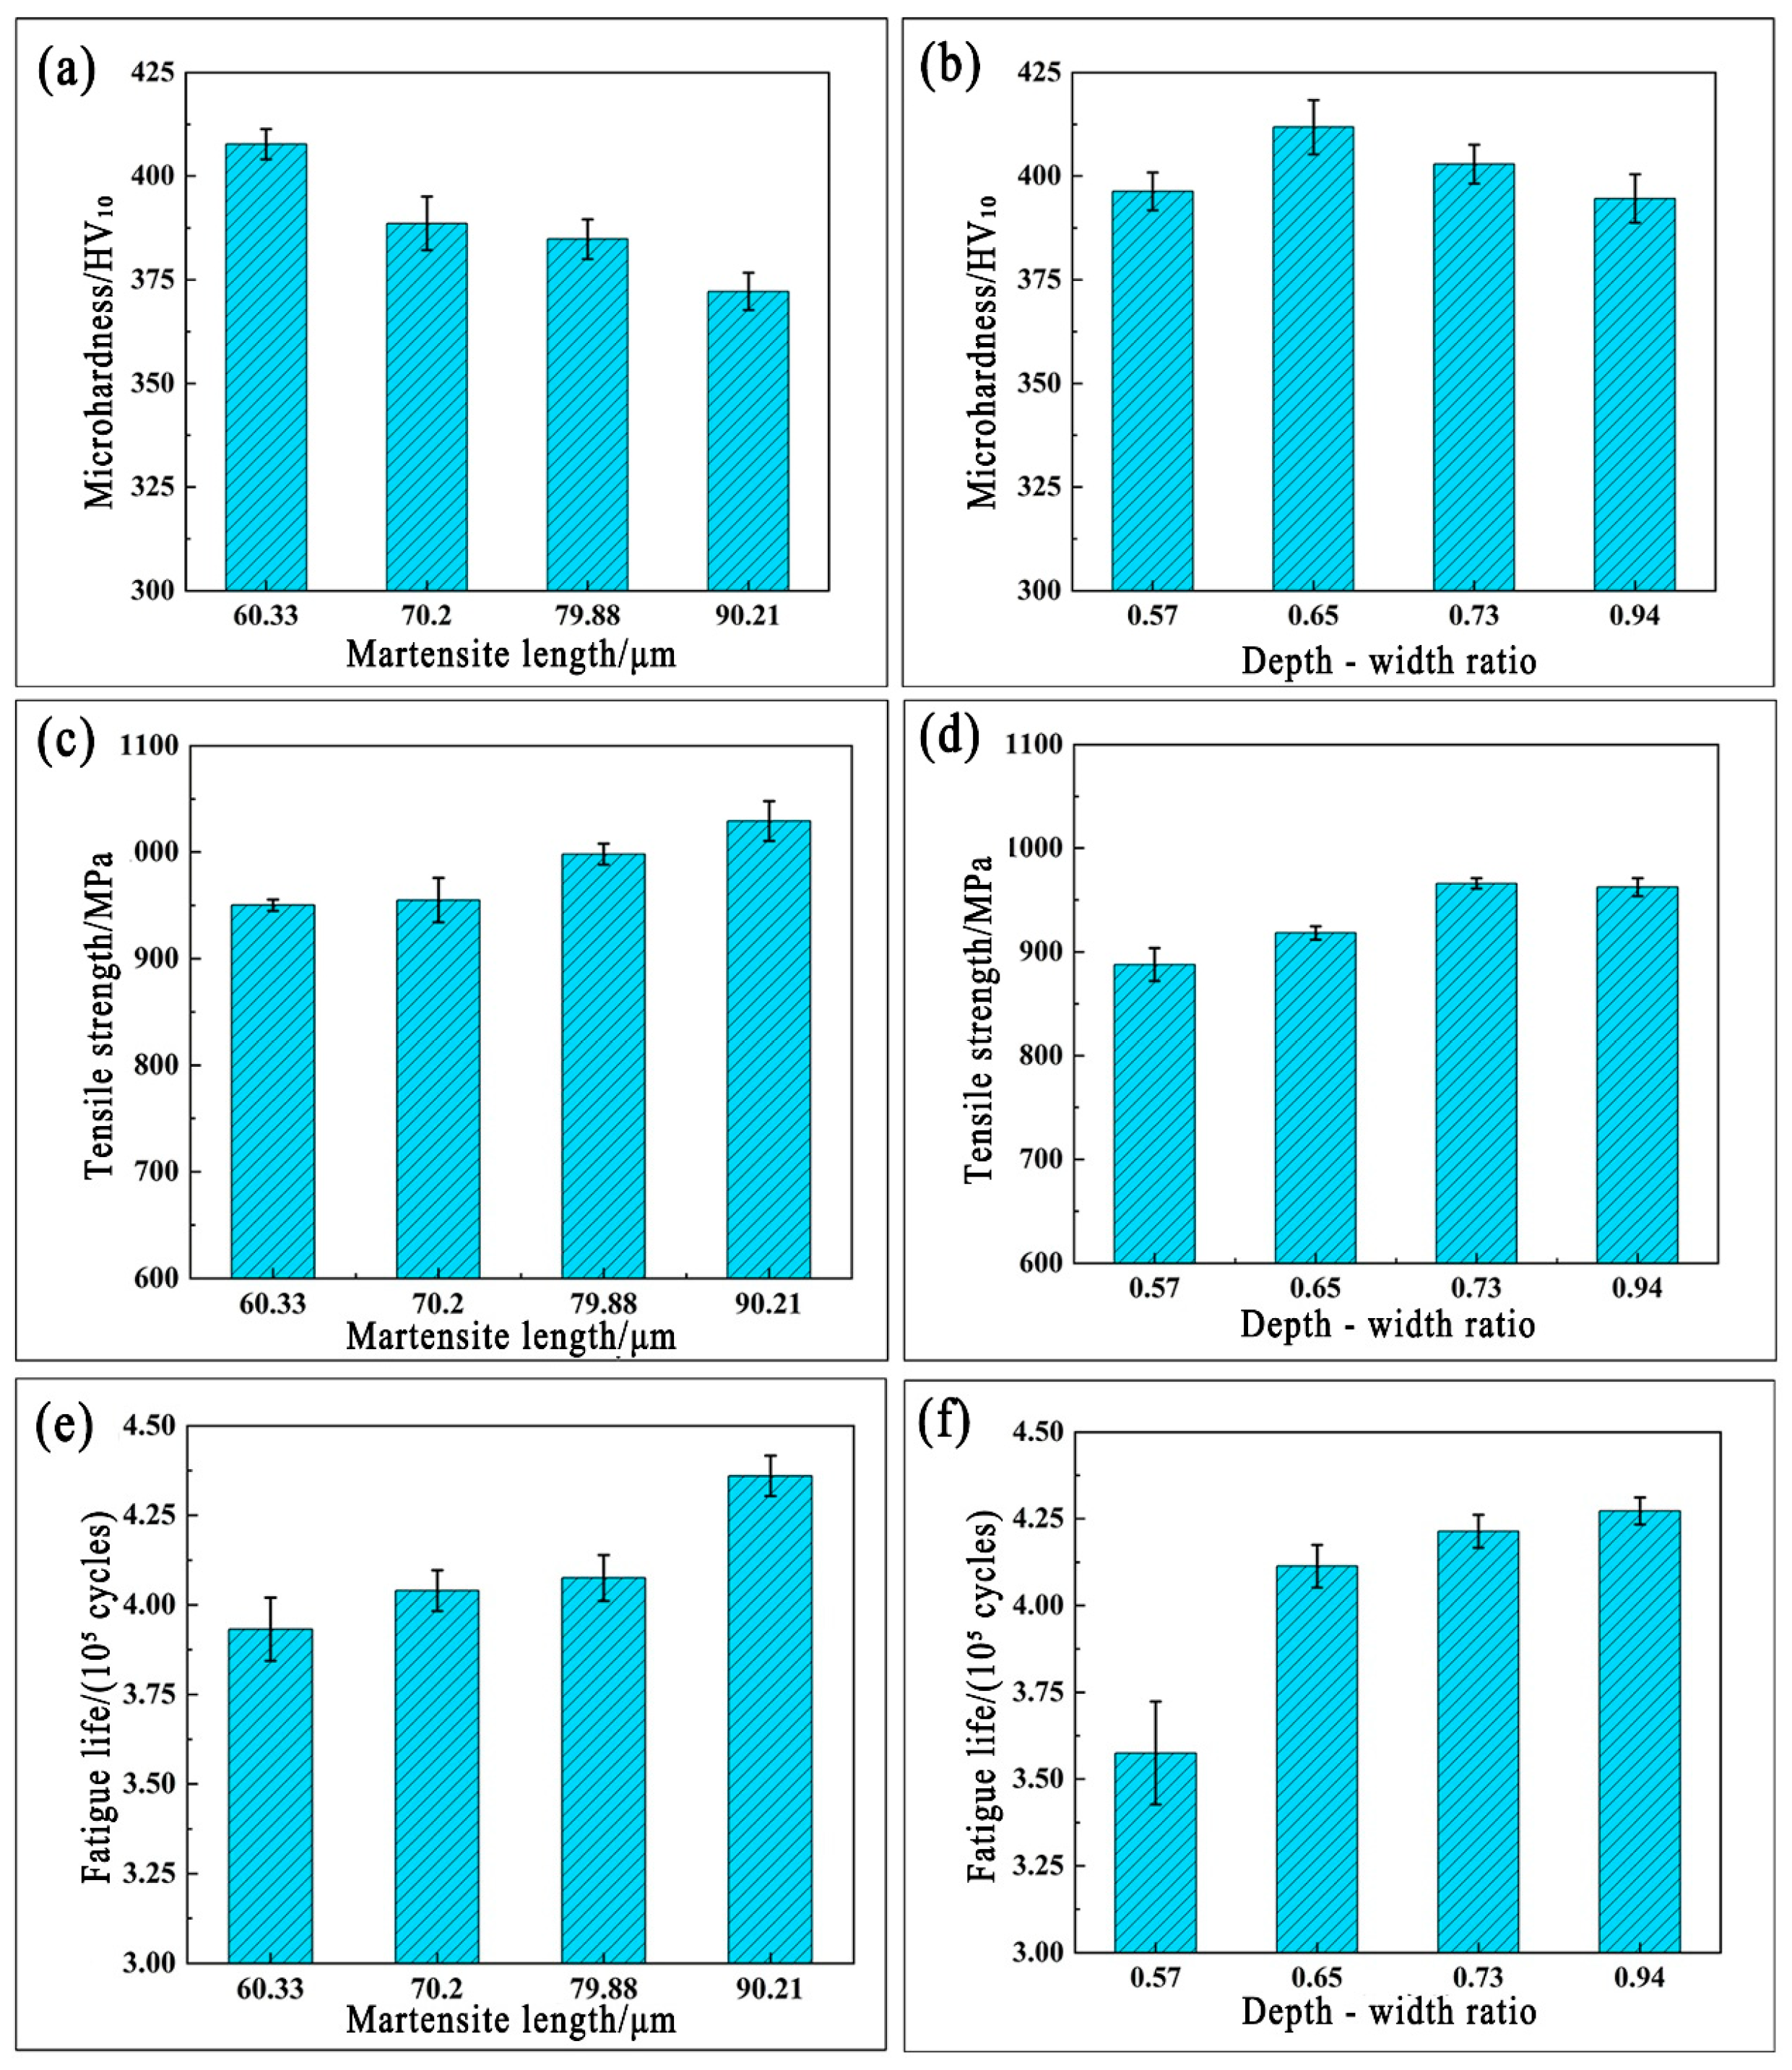
For Ti6Al4V alloy laser-welded joints, tensile properties, microhardness, and fatigue strength are core indices for evaluating comprehensive mechanical properties, with weld microstructure characteristics exerting a significant influence on them. Using the control variable method, the effects of individual microstructural features and their dominant mechanisms were analyzed to guide process parameter optimization.
Microhardness (
Figure 7a,b): With similar depth-to-width ratios, microhardness decreases as martensite length increases; with similar martensite lengths, it first rises and then falls with increasing depth-to-width ratio (peaking at ~0.65). Martensite length has a more pronounced effect, as acicular α′ martensite forms a tightly interlocked “basket weave structure” that enhances hardness.
Tensile strength (
Figure 7c,d): Acicular α′ martensite in a basket weave structure improves both strength and toughness. With similar depth-to-width ratios, tensile strength increases with martensite length; with similar martensite sizes, it first rises and then falls with the depth-to-width ratio (peaking at ~0.73). A reasonable depth-to-width ratio is critical—excessively large or small values deteriorate performance, while martensite length plays a more significant role within this range.
Fatigue life (
Figure 7e,f): Trends mirror those of tensile strength. With similar depth-to-width ratios, fatigue life increases with martensite length; with similar martensite sizes, it improves with the depth-to-width ratio. This is attributed to the fact that a higher depth-to-width ratio reduces stress concentration (resulting in fewer crack sources), while longer martensite enhances toughness (slowing crack propagation).
4. Model
4.4. Comparative Experiments
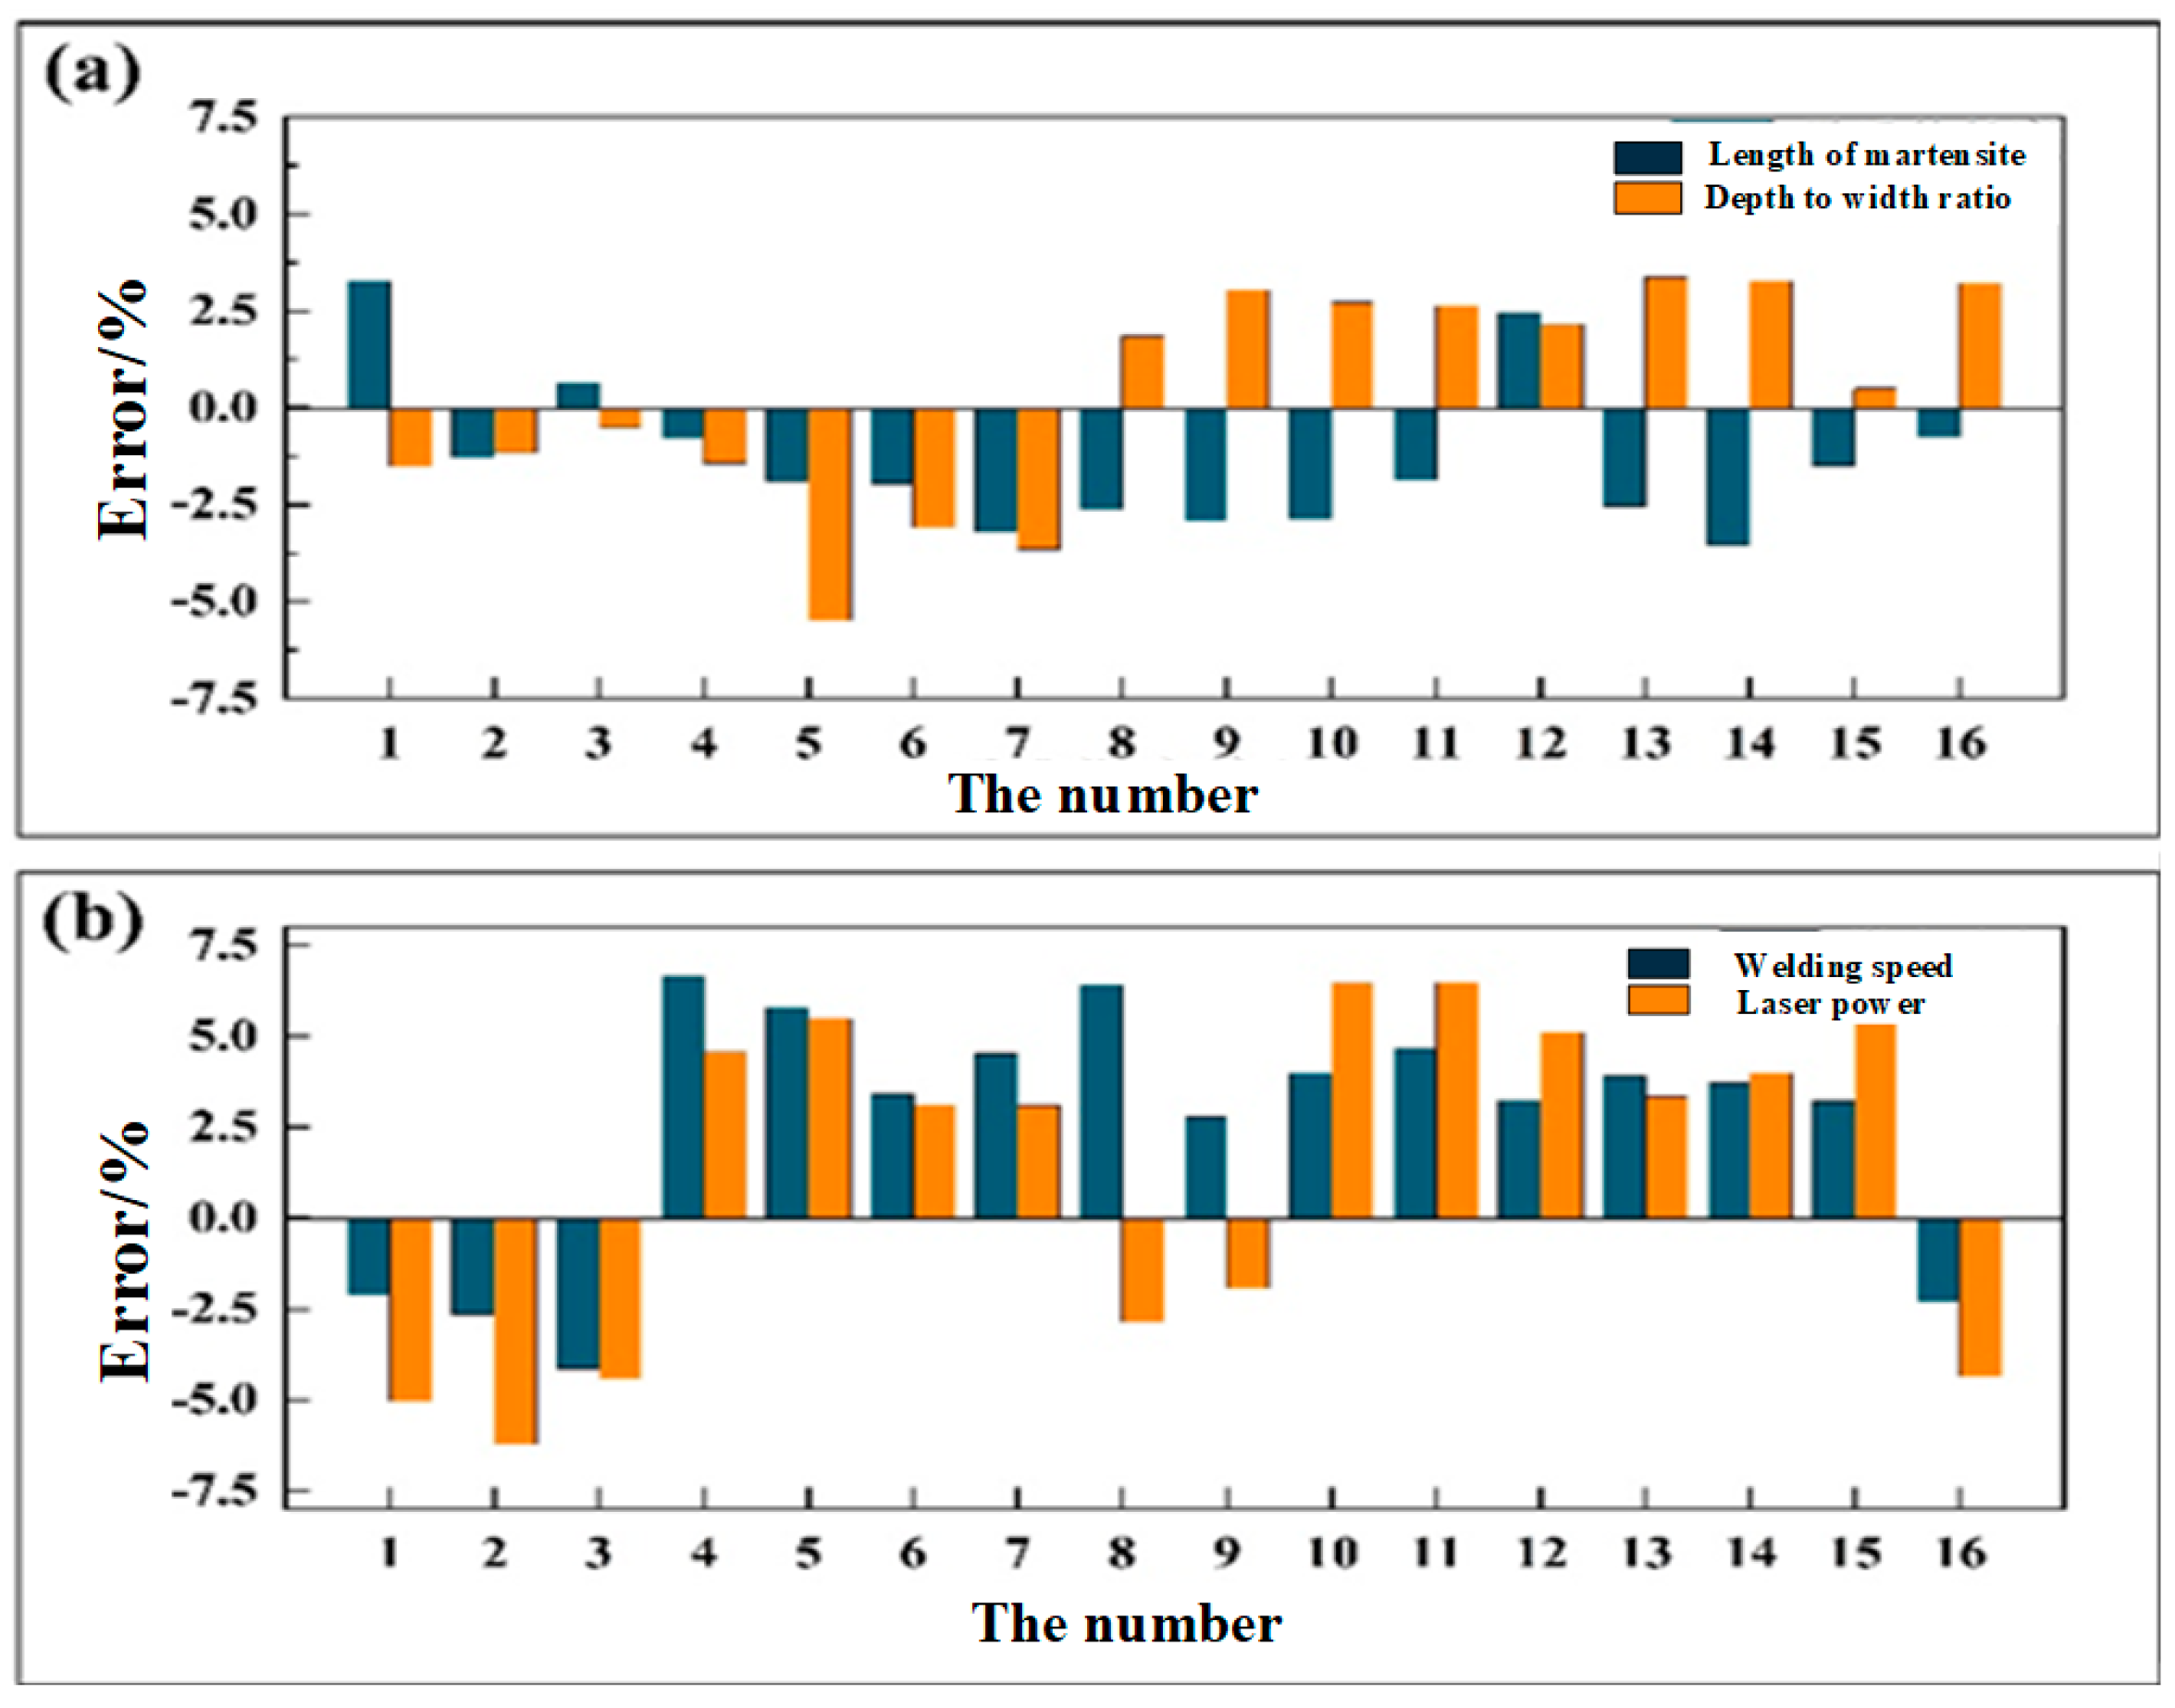
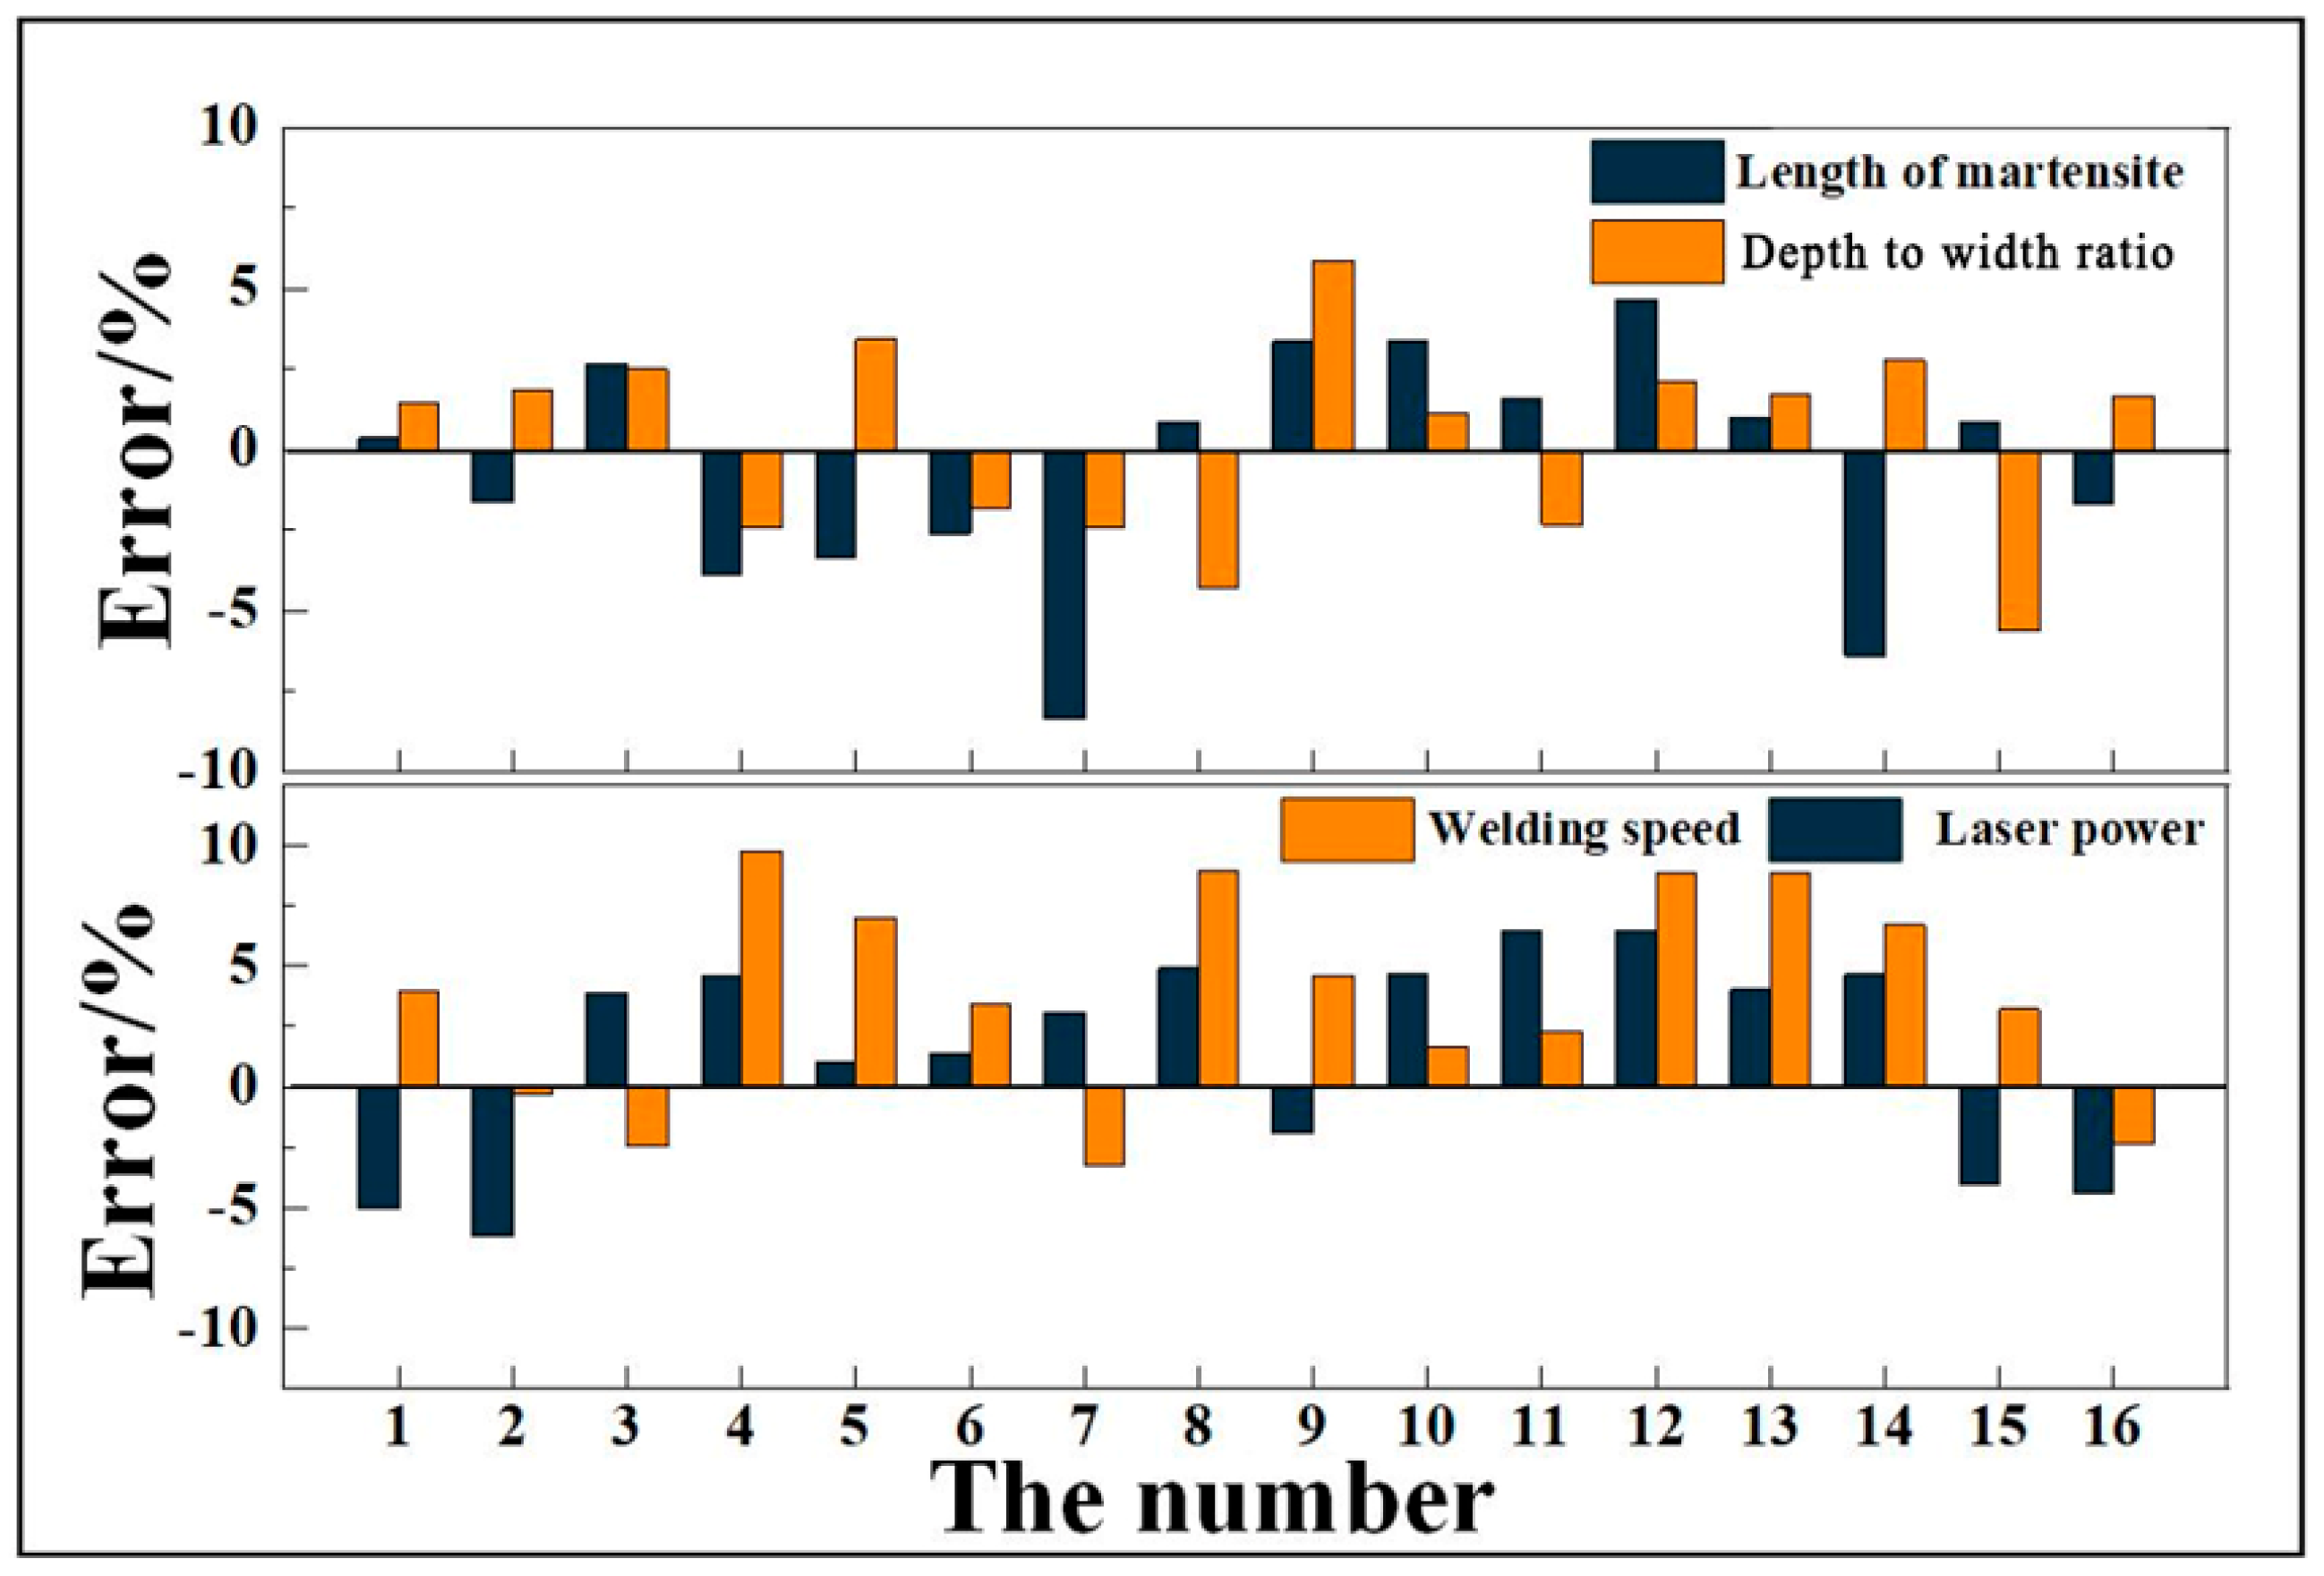
To verify the BP-WC model’s superiority, 16 test samples (30% of the total) were used for comparison with the traditional BP model (results in
Figure 15).
Compared with the BP forward model, the BP-WC model has similar forward prediction errors (microstructure average ~2%, mechanical properties ~3%) but provides a more reliable weight benchmark for backward inverse derivation.
Compared with the BP inverse model, the BP-WC model shows significantly improved inverse accuracy: The average inverse error of microstructure (martensite length and depth-to-width ratio) is reduced to 2% (max 4.4%), outperforming the BP inverse model’s 5~6.7%. The average inverse error of process parameters (laser power and welding speed) is 3.95~4.49% (max 6.46%), better than the BP inverse model’s 6.73~7.14%.
Key reasons for error reduction are as follows: microstructure’s intermediate buffering reduces error accumulation; the weight correction mechanism corrects pseudo-inverse matrix deviation; and hyperparameters optimized by the differential evolution algorithm make the model more consistent with actual mappings.
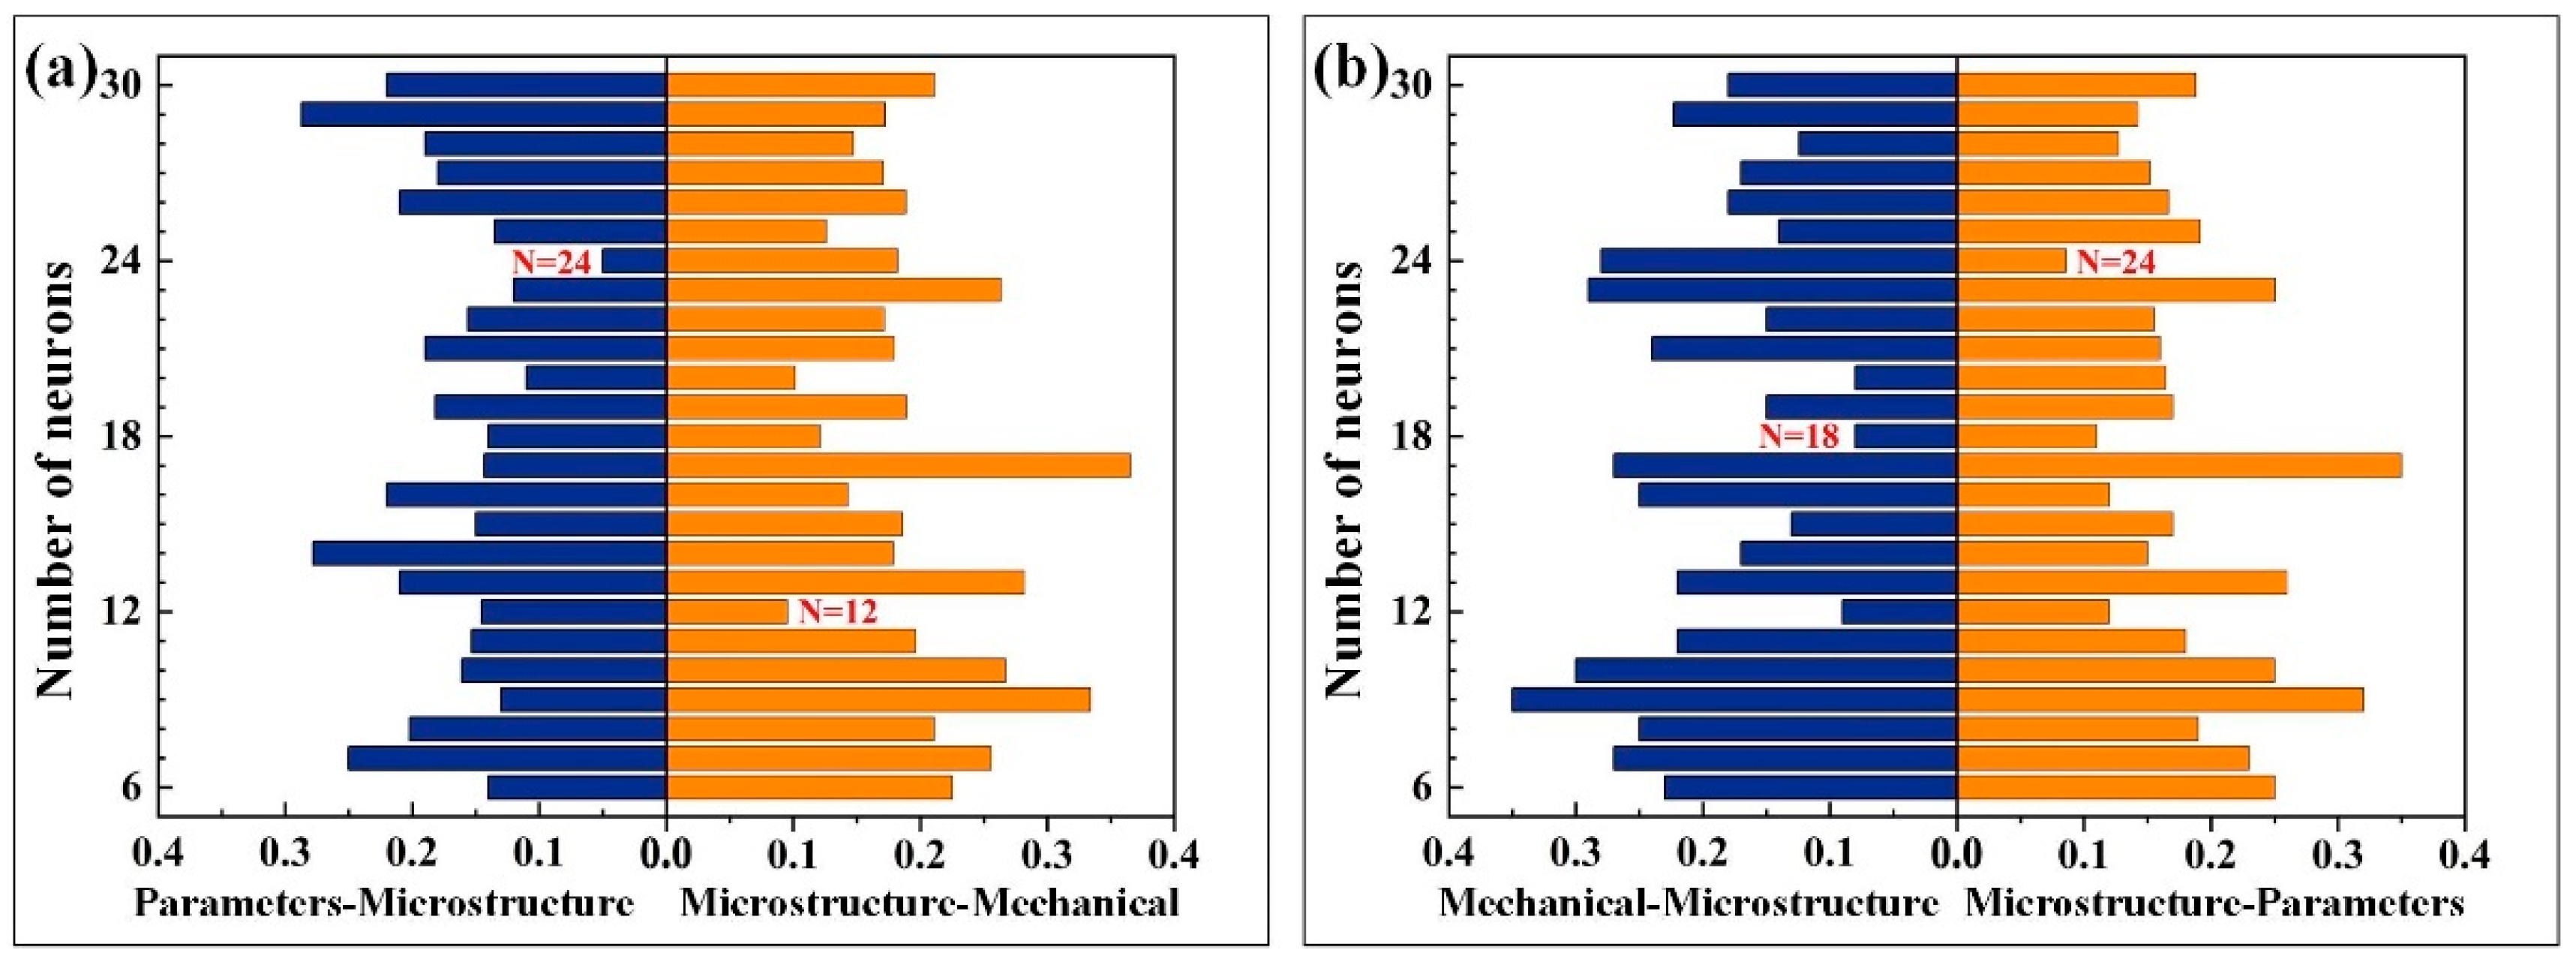
Notably, comparing the BP-WC model before and after optimization (with/without the differential evolution algorithm) is crucial to verify the improvement effect of hyperparameter optimization (e.g., adjusting hidden layer neurons to 24 and 12) on accuracy.
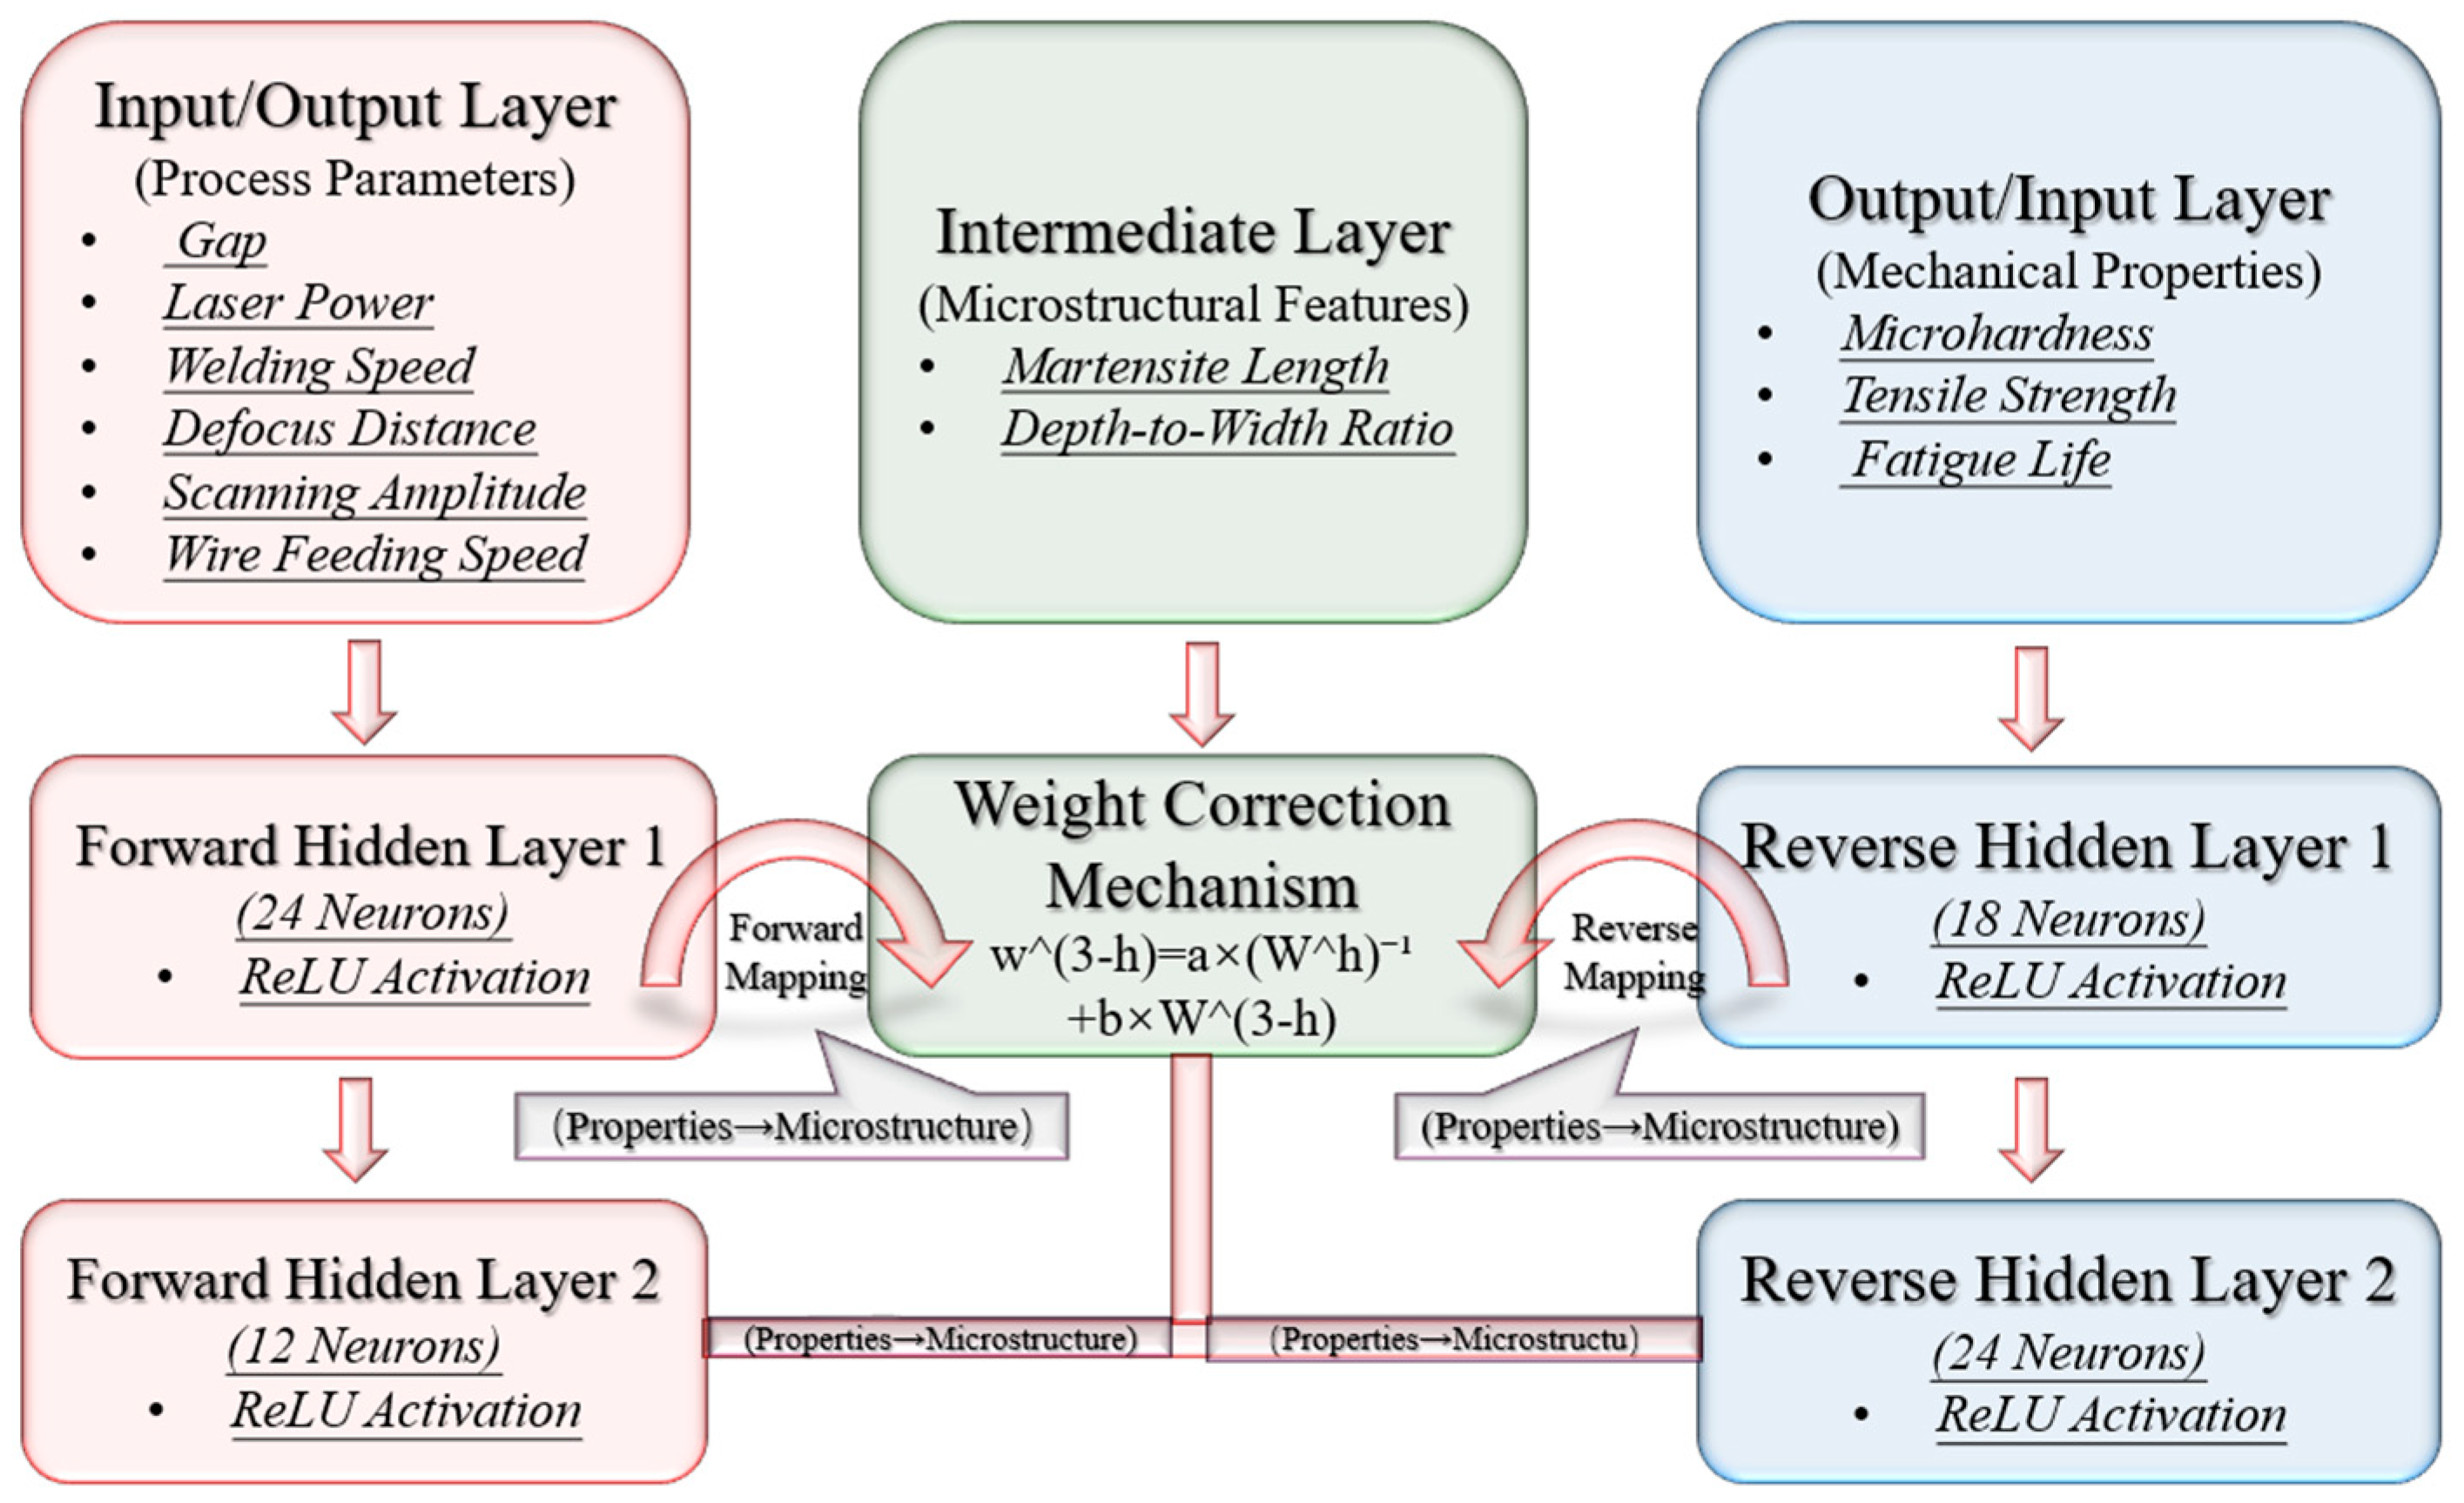
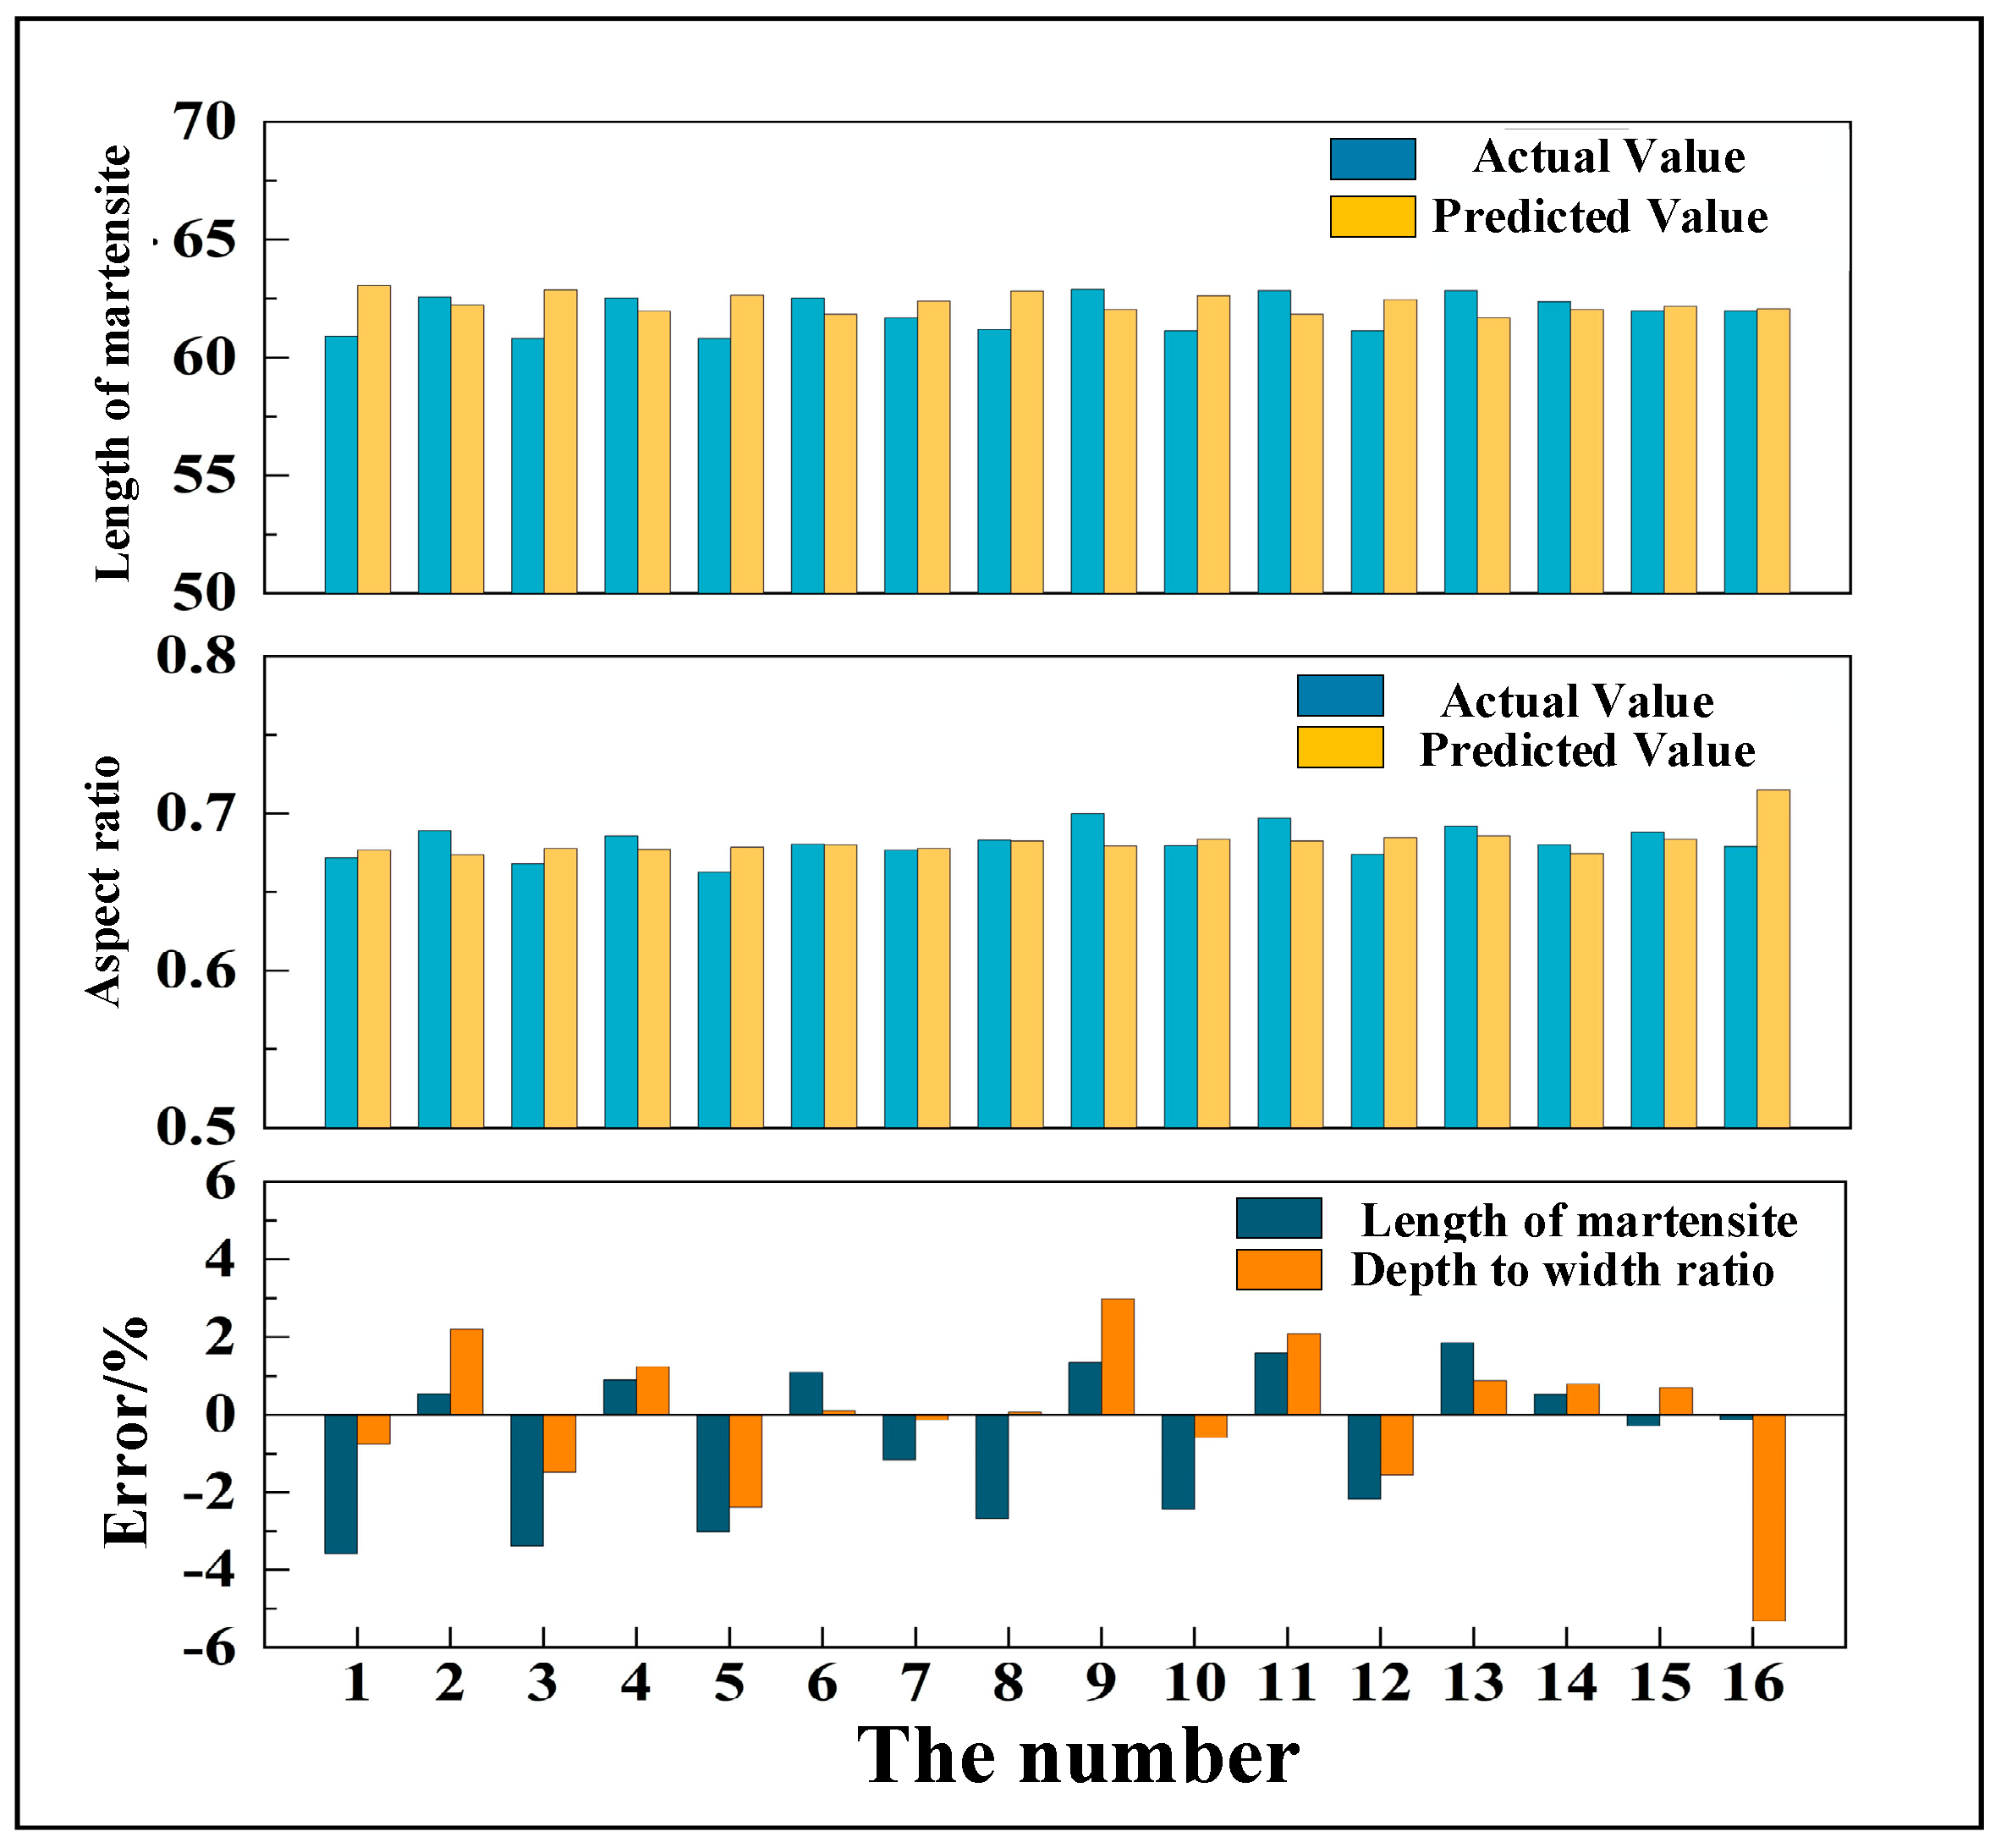
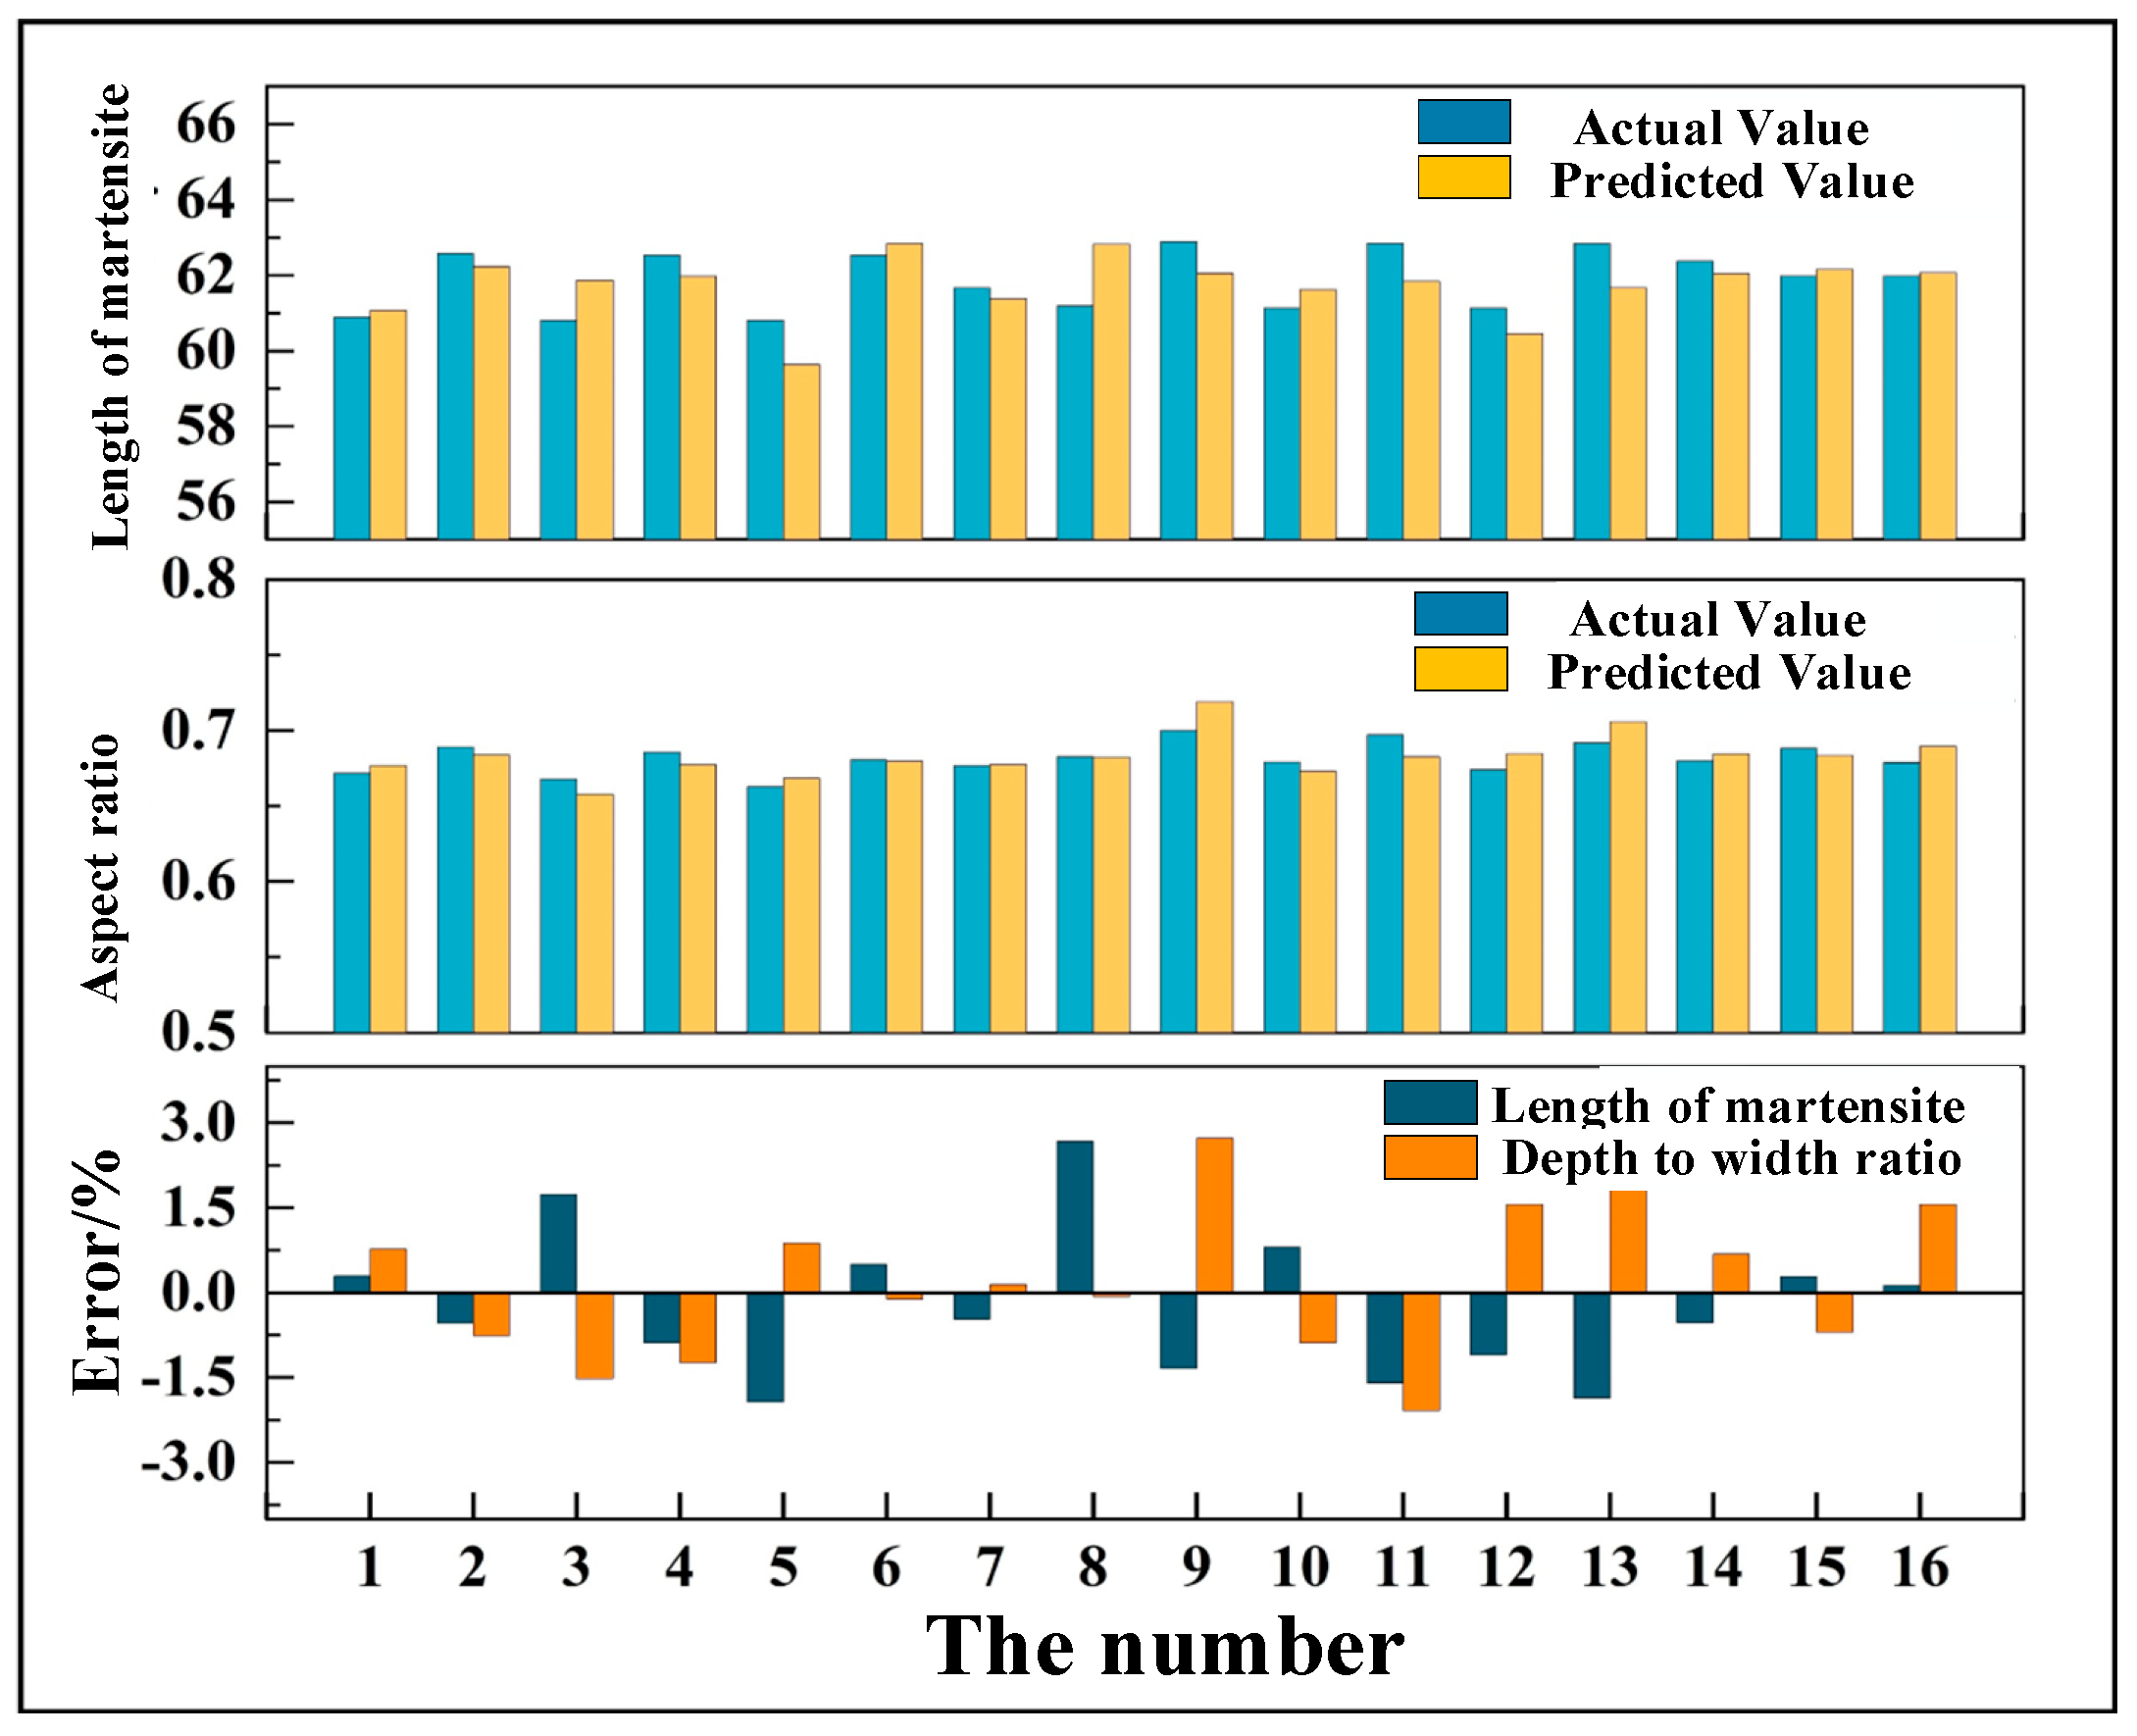
Based on the differential evolution algorithm’s optimization results for BP forward and inverse models, their neural network structures were redesigned: 24 neurons for the “process parameters–microstructure” hidden layer and 12 for “microstructure–mechanical properties”. The redesigned models were trained and validated to provide parameters for BP-WC optimization. As shown in
Figure 16, the optimized BP forward model’s “process parameters–microstructure” part has average prediction errors of 1.54% and 2.23% for microstructure characteristics, with significantly reduced fluctuations.
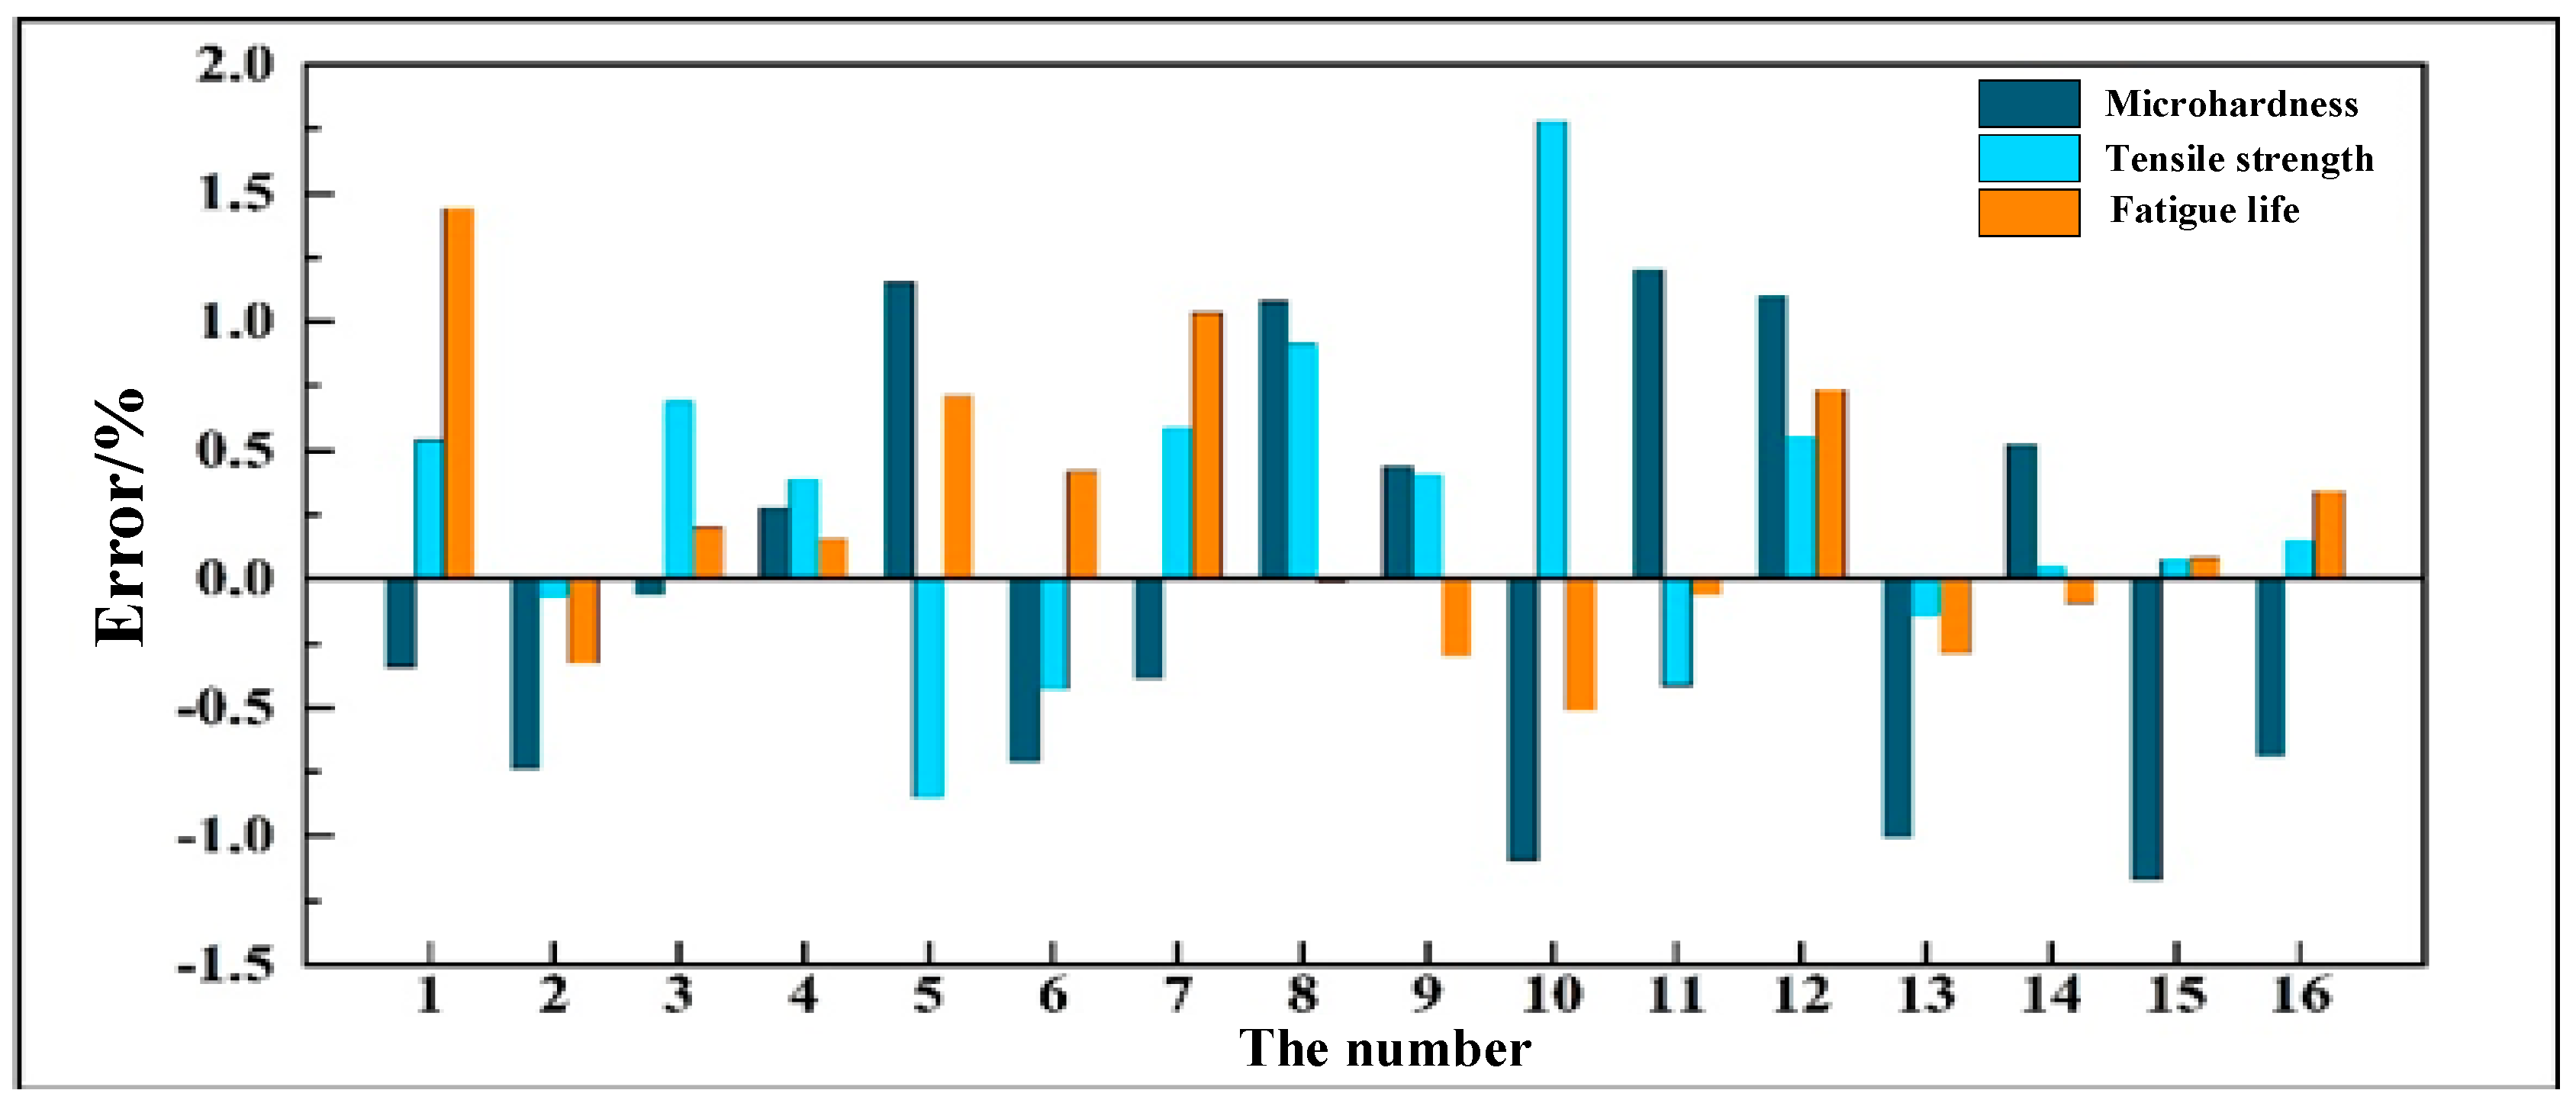
In
Figure 17, the prediction results of the “microstructure–mechanical properties” part of the optimized BP forward model are shown. Comparing the above results with the prediction results before optimization, it can be found that the prediction accuracy of the BP forward model for mechanical properties improves, with the average error being less than 2% and the error fluctuations having decreased. The above results indicate that the addition of the differential evolution algorithm improves the accuracy and reliability of material property prediction.
In
Figure 18, the inverse derivation results of the optimized BP inverse derivation model are presented. Comparing the above inverse derivation results with those in
Figure 12, it can be found that the optimized model significantly improves the inverse derivation accuracy of microstructure characteristics, with only some samples having inverse derivation errors of microstructure characteristics exceeding 5%. Moreover, the inverse derivation accuracy of laser power and welding speed is also improved, with their average inverse derivation errors reduced to 4.17% and 4.84%, respectively. In addition, by comparing the inverse derivation results of different samples, it can be seen that the error fluctuations of the model significantly improve.
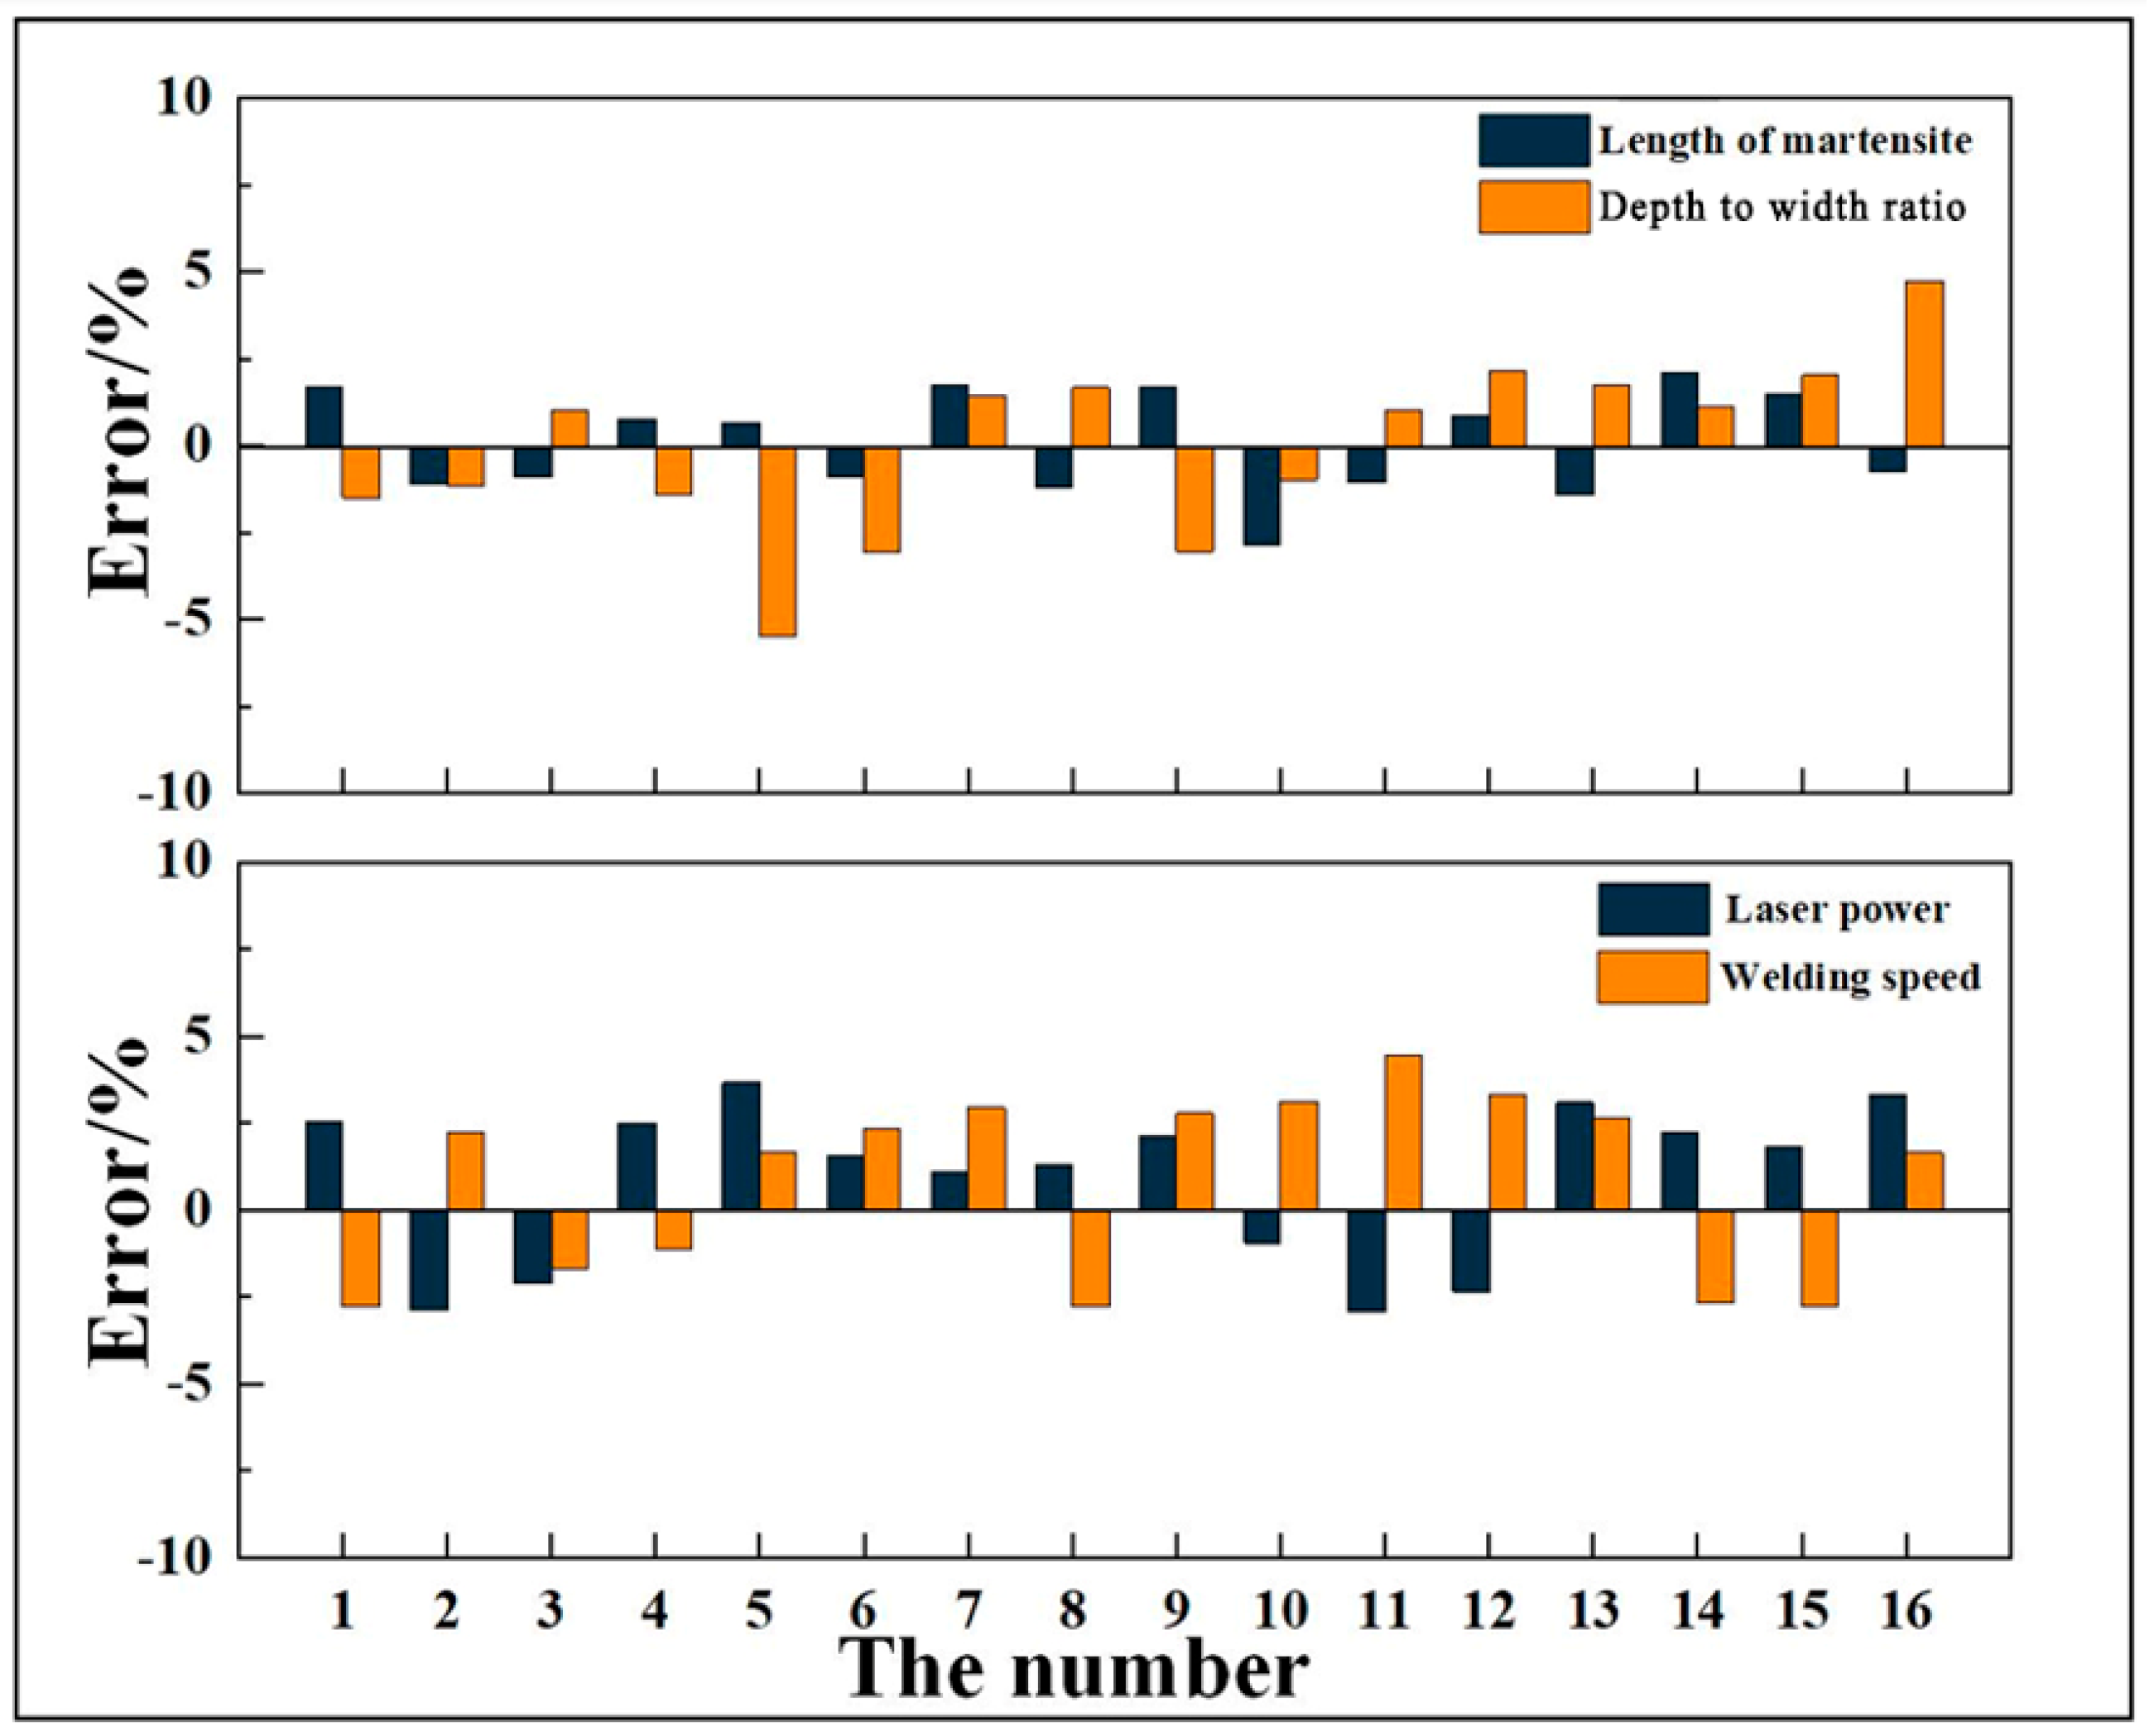
Based on the optimized BP forward and inverse derivation models for Ti6Al4V alloy laser welding, their weight coefficients and bias coefficients were obtained to establish the optimized BP-WC inverse derivation model. The inverse derivation model was then trained and validated, and the inverse derivation results of the optimized BP-WC inverse derivation model are shown in
Figure 19. By comparing the inverse derivation results before and after optimization, it can be found that the optimized BP-WC inverse derivation model significantly improves the inverse derivation accuracy of microstructure characteristics and process parameters. Moreover, the error fluctuations obviously decrease: the average inverse derivation error for microstructure characteristics decreases by about 2%, while the average inverse derivation error for process parameters drops to 3%.
Author Contributions
Conceptualization, Y.Z.; methodology, F.L.; validation, F.L.; formal analysis, F.L. and Y.L.; investigation, F.L., Y.L., and X.Z.; resources, Y.Z.; data curation, F.L. and X.Z.; writing—original draft, F.L.; writing—review and editing, Z.R. and Y.Z.; visualization, F.L., Y.L., Z.R., and X.Z.; supervision, Y.Z.; project administration, Y.Z.; funding acquisition, F.L. All authors have read and agreed to the published version of the manuscript.
Funding
This research was supported by the China Postdoctoral Science Foundation (2024M764234), the National Key Research and Development Program of China (2023YFB3407800), and Jiangsu Funding Program for Excellent Postdoctoral Talent (2024ZB608).
Data Availability Statement
The original contributions presented in this study are included in the article. Further inquiries can be directed to the corresponding author.
Acknowledgments
We thank the Center for Microscopy and Analysis at the Nanjing University of Aeronautics and Astronautics for advanced facilities.
Conflicts of Interest
Author Fei Li was employed by the company Chengdu Aircraft Industrial (Group) Co., Ltd. The remaining authors declare that the research was conducted in the absence of any commercial or financial relationships that could be construed as a potential conflict of interest.
References
- Auwal, S.T.; Ramesh, S.; Yusof, F. A review on laser beam welding of titanium alloys. Int. J. Adv. Manuf. Technol. 2018, 97, 1071–1098. [Google Scholar] [CrossRef]
- Panwisawas, C.; Perumal, B.; Mark Ward, R.; Turner, N.; Turner, R.P.; Brooks, J.W.; Basoalto, H.C. Keyhole formation and thermal fluid flow-induced porosity during laser fusion welding in titanium alloys: Experimental and modelling. Acta Mater. 2017, 126, 251–263. [Google Scholar] [CrossRef]
- Califano, A.; Giannella, V.; Caiazzo, F.; Berto, F.; Sepe, R. Mechanical Behavior of Ti6Al4V Laser Welded Single Lap Joints. Procedia Struct. Integr. 2023, 47, 842–848. [Google Scholar] [CrossRef]
- Li, G.; Wang, Y.; Liang, Y.; Gao, P.; Liu, X.; Xu, W.; Yang, D. Microstructure and mechanical properties of laser welded Ti-6Al-4V (TC4) titanium alloy joints. Opt. Laser Technol. 2024, 170, 110320. [Google Scholar] [CrossRef]
- Panov, D.; Naumov, S.; Stepanov, N.; Sokolovsky, V. Effect of pre-heating and post-weld heat treatment on structure and mechanical properties of laser beam-welded Ti2AlNb-based joints. Intermetallics 2022, 143, 107466. [Google Scholar] [CrossRef]
- Zhang, K.; He, C.; Liu, D.; Yan, C.; Niu, H.; Yang, Z.; Bao, Y. Effect of heat input on microstructure and tensile properties of laser welded Ti–3Al–6Mo–2Fe–2Zr alloy joint. J. Mater. Res. Technol. 2022, 17, 1652–1661. [Google Scholar] [CrossRef]
- Chen, J.; Li, H.; Liu, Y.; Zhao, X.; Cai, Y.; Chen, H.; Chen, Y.; Feng, A.; Wang, H.; Sun, Z. Deformation behavior and microstructure characteristics of the laser-welded Ti-6Al-4V joint under variable amplitude fatigue. Mater. Charact. 2023, 196, 112606. [Google Scholar] [CrossRef]
- Chattopadhyay, A.; Muvvala, G.; Sarkar, S.; Racherla, V.; Nath, A.K. Effect of laser shock peening on microstructural, mechanical and corrosion properties of laser beam welded commercially pure titanium. Opt. Laser Technol. 2021, 133, 106527. [Google Scholar] [CrossRef]
- Quillace, A.; Prisco, U.; Ciliberto, S.; Astarita, A. Effect of welding parameters on morphology and mechanical properties of Ti–6Al–4V laser beam welded butt joints. J. Mater. Process. Technol. 2012, 212, 427–436. [Google Scholar] [CrossRef]
- Ahn, J.; Chen, L.; Davies, C.M.; Dear, J.P. Parametric optimisation and microstructural analysis on high power Yb-fibre laser welding of Ti–6Al–4V. Opt. Lasers Eng. 2016, 86, 156–171. [Google Scholar] [CrossRef]
- Li, S.; Mo, B.; Xu, W.; Xiao, G.; Deng, Z. Research on nonlinear prediction model of weld forming quality during hot-wire laser welding. Opt. Laser Technol. 2020, 131, 106436. [Google Scholar] [CrossRef]
- Campanelli, S.L.; Casalino, G.; Mortello, M.; Angelastro, A.; Ludovico, A.D. Microstructural Characteristics and Mechanical Properties of Ti6Al4V Alloy Fiber Laser Welds. Procedia CIRP 2015, 33, 428–433. [Google Scholar] [CrossRef]
- Rawa, M.J.H.; Dehkordi, M.H.R.; Kholoud, M.J.; Abu-Hamdeh, N.H.; Azimy, H. Using the numerical simulation and artificial neural network (ANN) to evaluate temperature distribution in pulsed laser welding of different alloys. Eng. Appl. Artif. Intell. 2023, 126, 107025. [Google Scholar] [CrossRef]
- Wu, S.; Kong, W.; Feng, Y.; Chen, P.; Cheng, F. Penetration prediction of narrow-gap laser welding based on coaxial high dynamic range observation and machine learning. J. Manuf. Process. 2024, 110, 91–100. [Google Scholar] [CrossRef]
- Chang, Y.; Yue, J.; Guo, R.; Liu, W.; Li, L. Penetration quality prediction of asymmetrical fillet root welding based on optimized BP neural network. J. Manuf. Process. 2020, 50, 247–254. [Google Scholar] [CrossRef]
- Buffa, G.; Fratini, L.; Micari, F. Mechanical and microstructural properties prediction by artificial neural networks in FSW processes. J. Manuf. Process. 2012, 14, 289–296. [Google Scholar] [CrossRef]
- Wang, H.; Li, J.; Liu, L. Process optimization and weld forming control based on GA-BP algorithm for riveting-welding hybrid bonding between magnesium and CFRP. J. Manuf. Process. 2021, 70, 97–107. [Google Scholar] [CrossRef]
- Kumar, C.; Das, M.; Paul, C.P.; Singh, B. Experimental investigation and metallographic characterization of fiber laser beam welding of Ti-6Al-4V alloy using response surface method. Opt. Lasers Eng. 2017, 95, 52–68. [Google Scholar] [CrossRef]
- Yacout, G.G.; Shash, A.Y.; Hegazi, H.A.; ElSherbiny, M.G. Application of response surface methodology for optimizing friction stir welding parameters of AA6082-T6 aluminium alloy. J. Mater. Res. Technol. 2025, 37, 3765–3776. [Google Scholar] [CrossRef]
- Rominiyi, A.L.; Mashinini, P.M. A critical review of microstructure and mechanical properties of laser welded similar and dissimilar titanium alloy joints. J. Adv. Join. Process. 2024, 9, 100191. [Google Scholar] [CrossRef]
- GB/T 228-2002; Metallic Materials—Tensile Testing at Ambient Temperature. Standards Press of China: Beijing, China, 2002.
Figure 1.
Multi-functional laser welding platform: (a) schematic diagram of the equipment; (b) local enlarged drawing.
Figure 2.
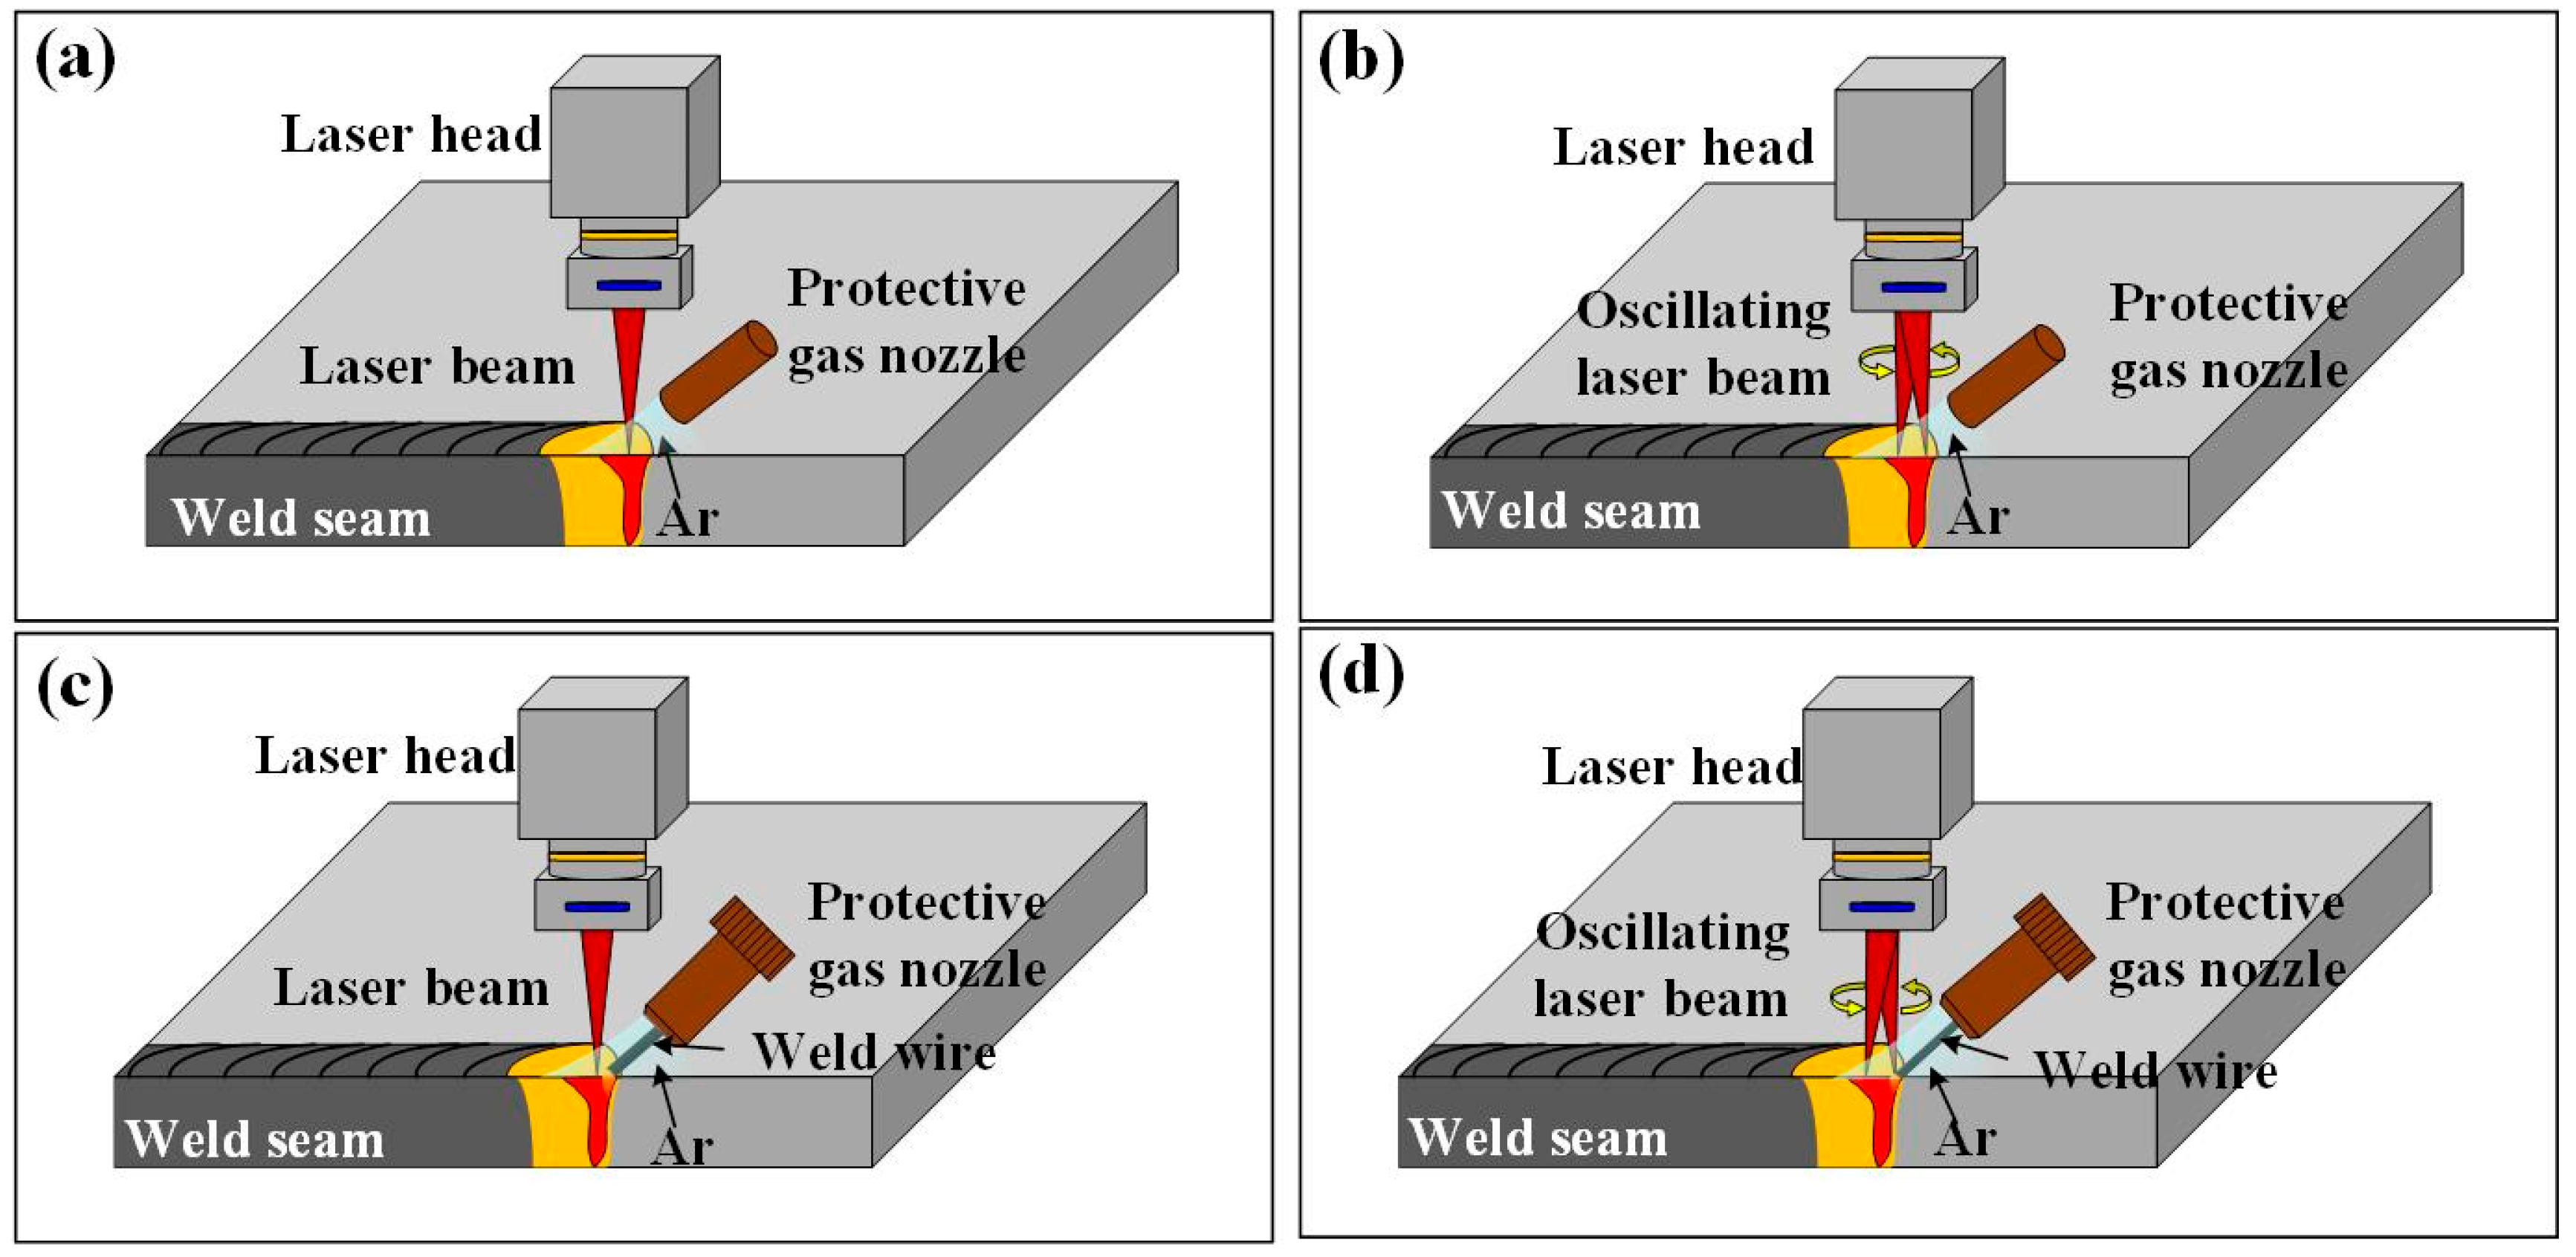
Schematic diagram of laser welding: (a) laser autogenous welding; (b) oscillating laser welding; (c) laser wire-filling welding; (d) oscillating laser wire-filling welding.
Figure 3.
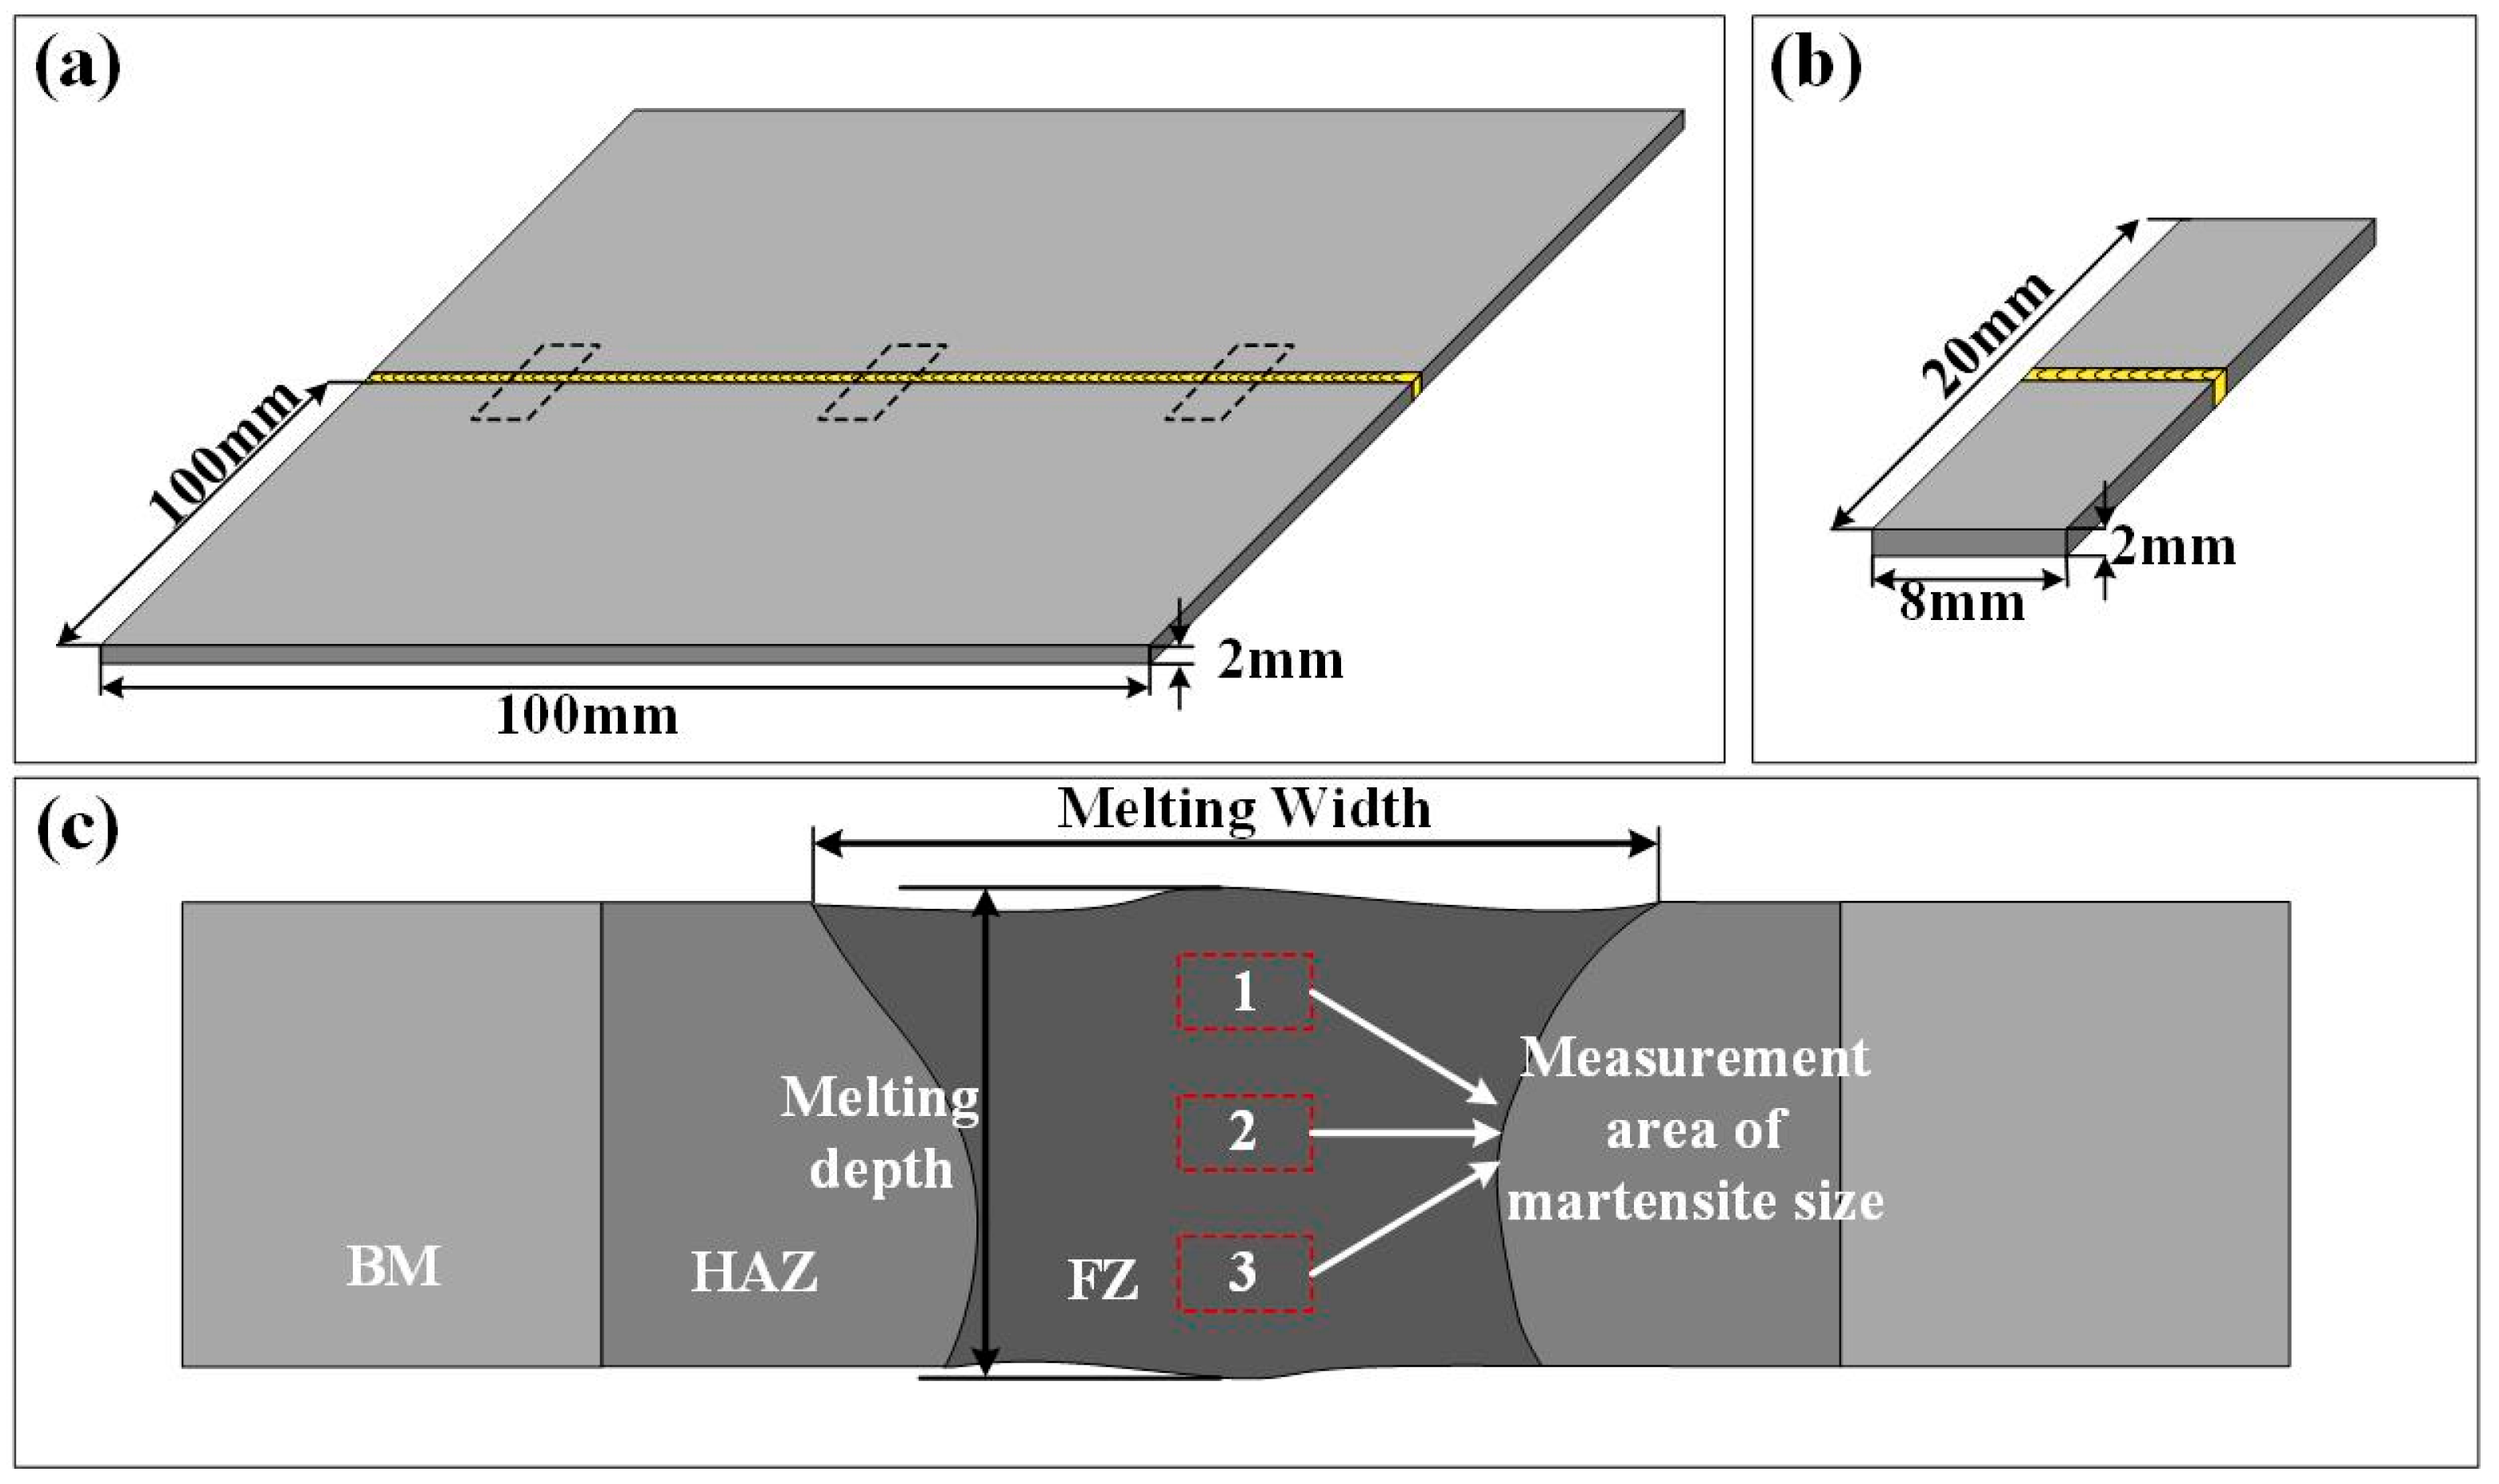
Schematic diagram of metallographic sample selection: (a) location of sample selection; (b) dimensions of metallographic specimens; (c) schematic diagram for measuring microstructure characteristics.
Figure 4.
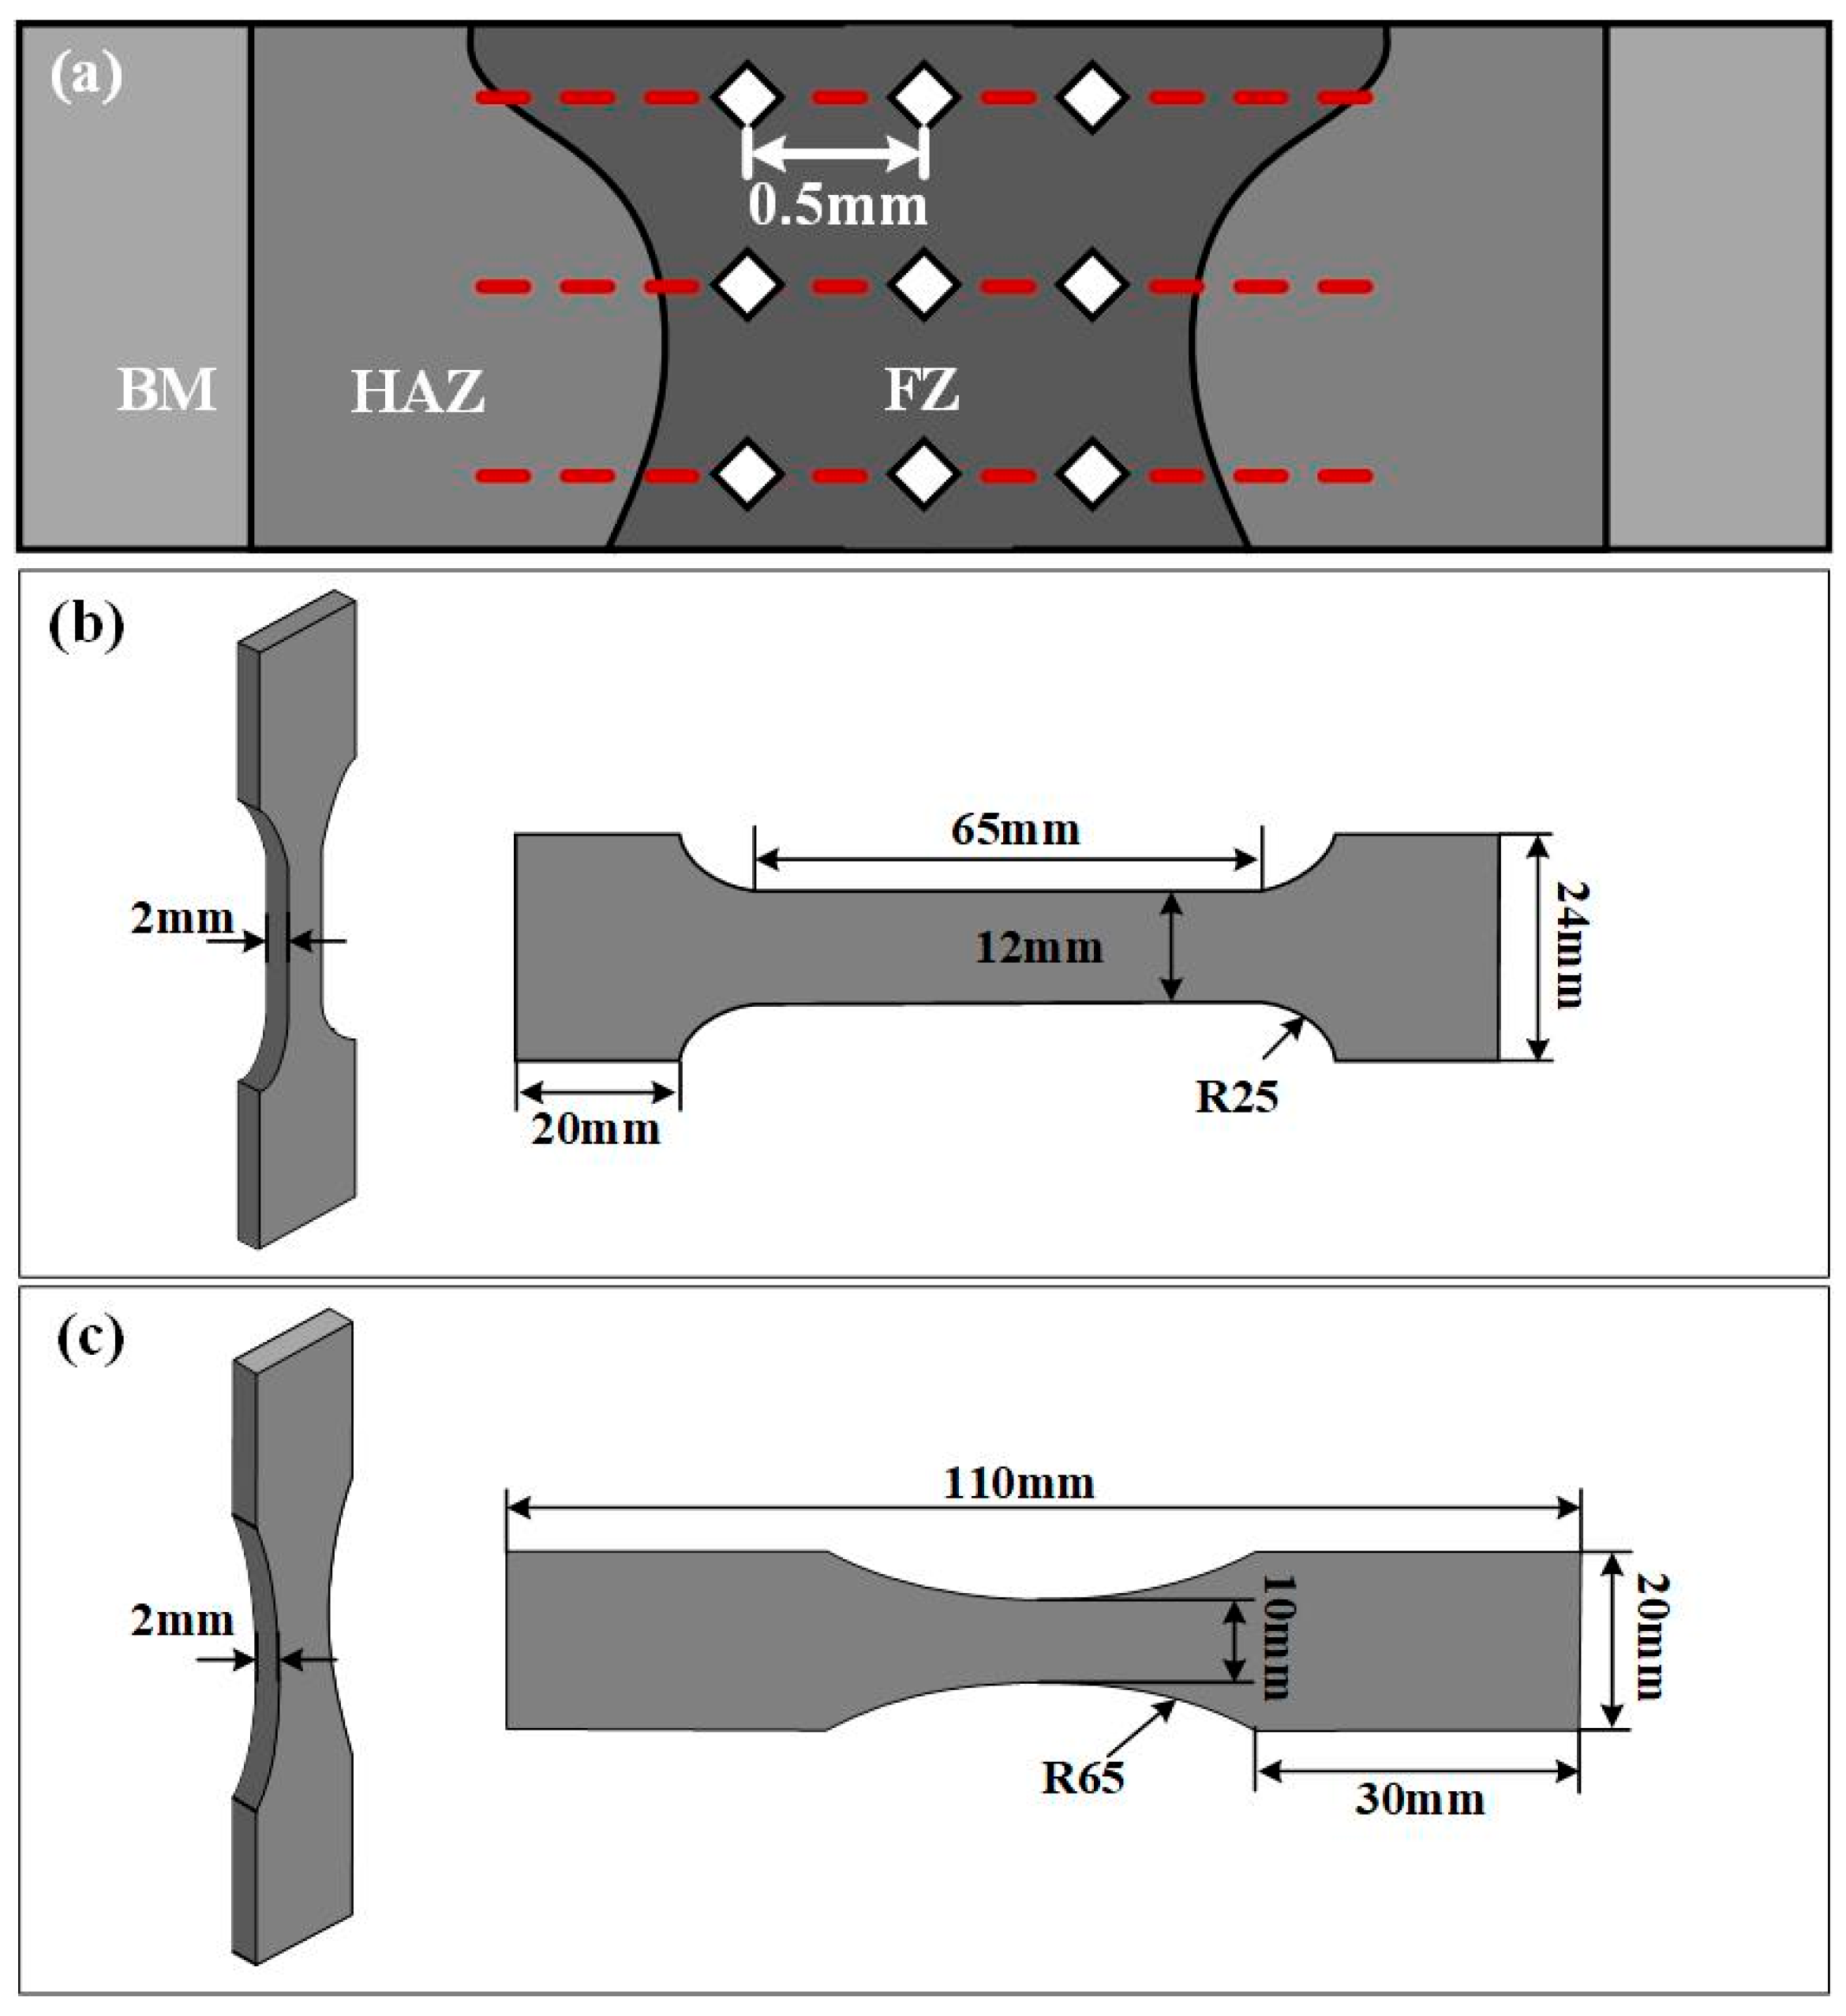
Schematic diagram of mechanical performance testing: (a) microhardness testing points; (b) tensile specimen size; (c) fatigue specimen size.
Figure 5.
Cross-sectional morphology of laser-welded joints for Ti6Al4V alloy: (a,b) laser autogenous weld; (c,d) oscillating laser weld (0.3 mm gap); (e,f) laser wire-filling welding (0.4 mm gap); (g,h) oscillating laser wire-filling welding (0.5 mm gap).
Figure 6.
Microstructures and martensite length under different laser welding for Ti6Al4V alloy: (a,b) laser autogenous weld; (c,d) oscillating laser weld; (e,f) laser wire-filling welding; (g,h) oscillating laser wire-filling welding.
Figure 7.
Mechanical properties of welded joints as a function of martensite length and depth-width ratio: (a) microhardness with varying martensite length; (b) microhardness with varying depth-width ratio; (c) tensile strength with varying martensite length; (d) tensile strength with varying depth-width ratio; (e) fatigue life with varying martensite length; (f) fatigue life with varying depth-width ratio.
Figure 8.
The construction of the BP-WC network.
Figure 9.
The BP-WC network structure.
Figure 10.
“Process parameters–microstructure” BP model’s prediction results and error.
Figure 11.
Prediction errors of the “microstructure–mechanical properties” model.
Figure 12.
Inverse derivation results of the “mechanical properties–microstructure–process parameters” BP inverse model: (a) inverse derivation results of “mechanical properties–microstructure”; (b) inverse derivation results of “microstructure–process parameters”.
Figure 13.
Flowchart of the differential evolution algorithm for optimizing the BP neural network model.
Figure 14.
Loss function of BP neural network model for Ti6Al4V alloy laser welding with different numbers of hidden neurons: (a) BP forward model; (b) BP reverse engineering model.
Figure 15.
Inverse derivation results of the “mechanical properties–microstructure–process parameters” BP-WC inverse model: (a) inverse derivation results of “mechanical properties–microstructure”; (b) inverse derivation results of “microstructure–process parameters”.
Figure 16.
Comparison of prediction results and errors of the optimized “process parameters–microstructure” BP model.
Figure 17.
Prediction errors of the optimized “microstructure–mechanical properties” BP model.
Figure 18.
The optimized BP reverse engineering model.
Figure 19.
Optimized BP-WC reverse engineering model.
Figure 20.
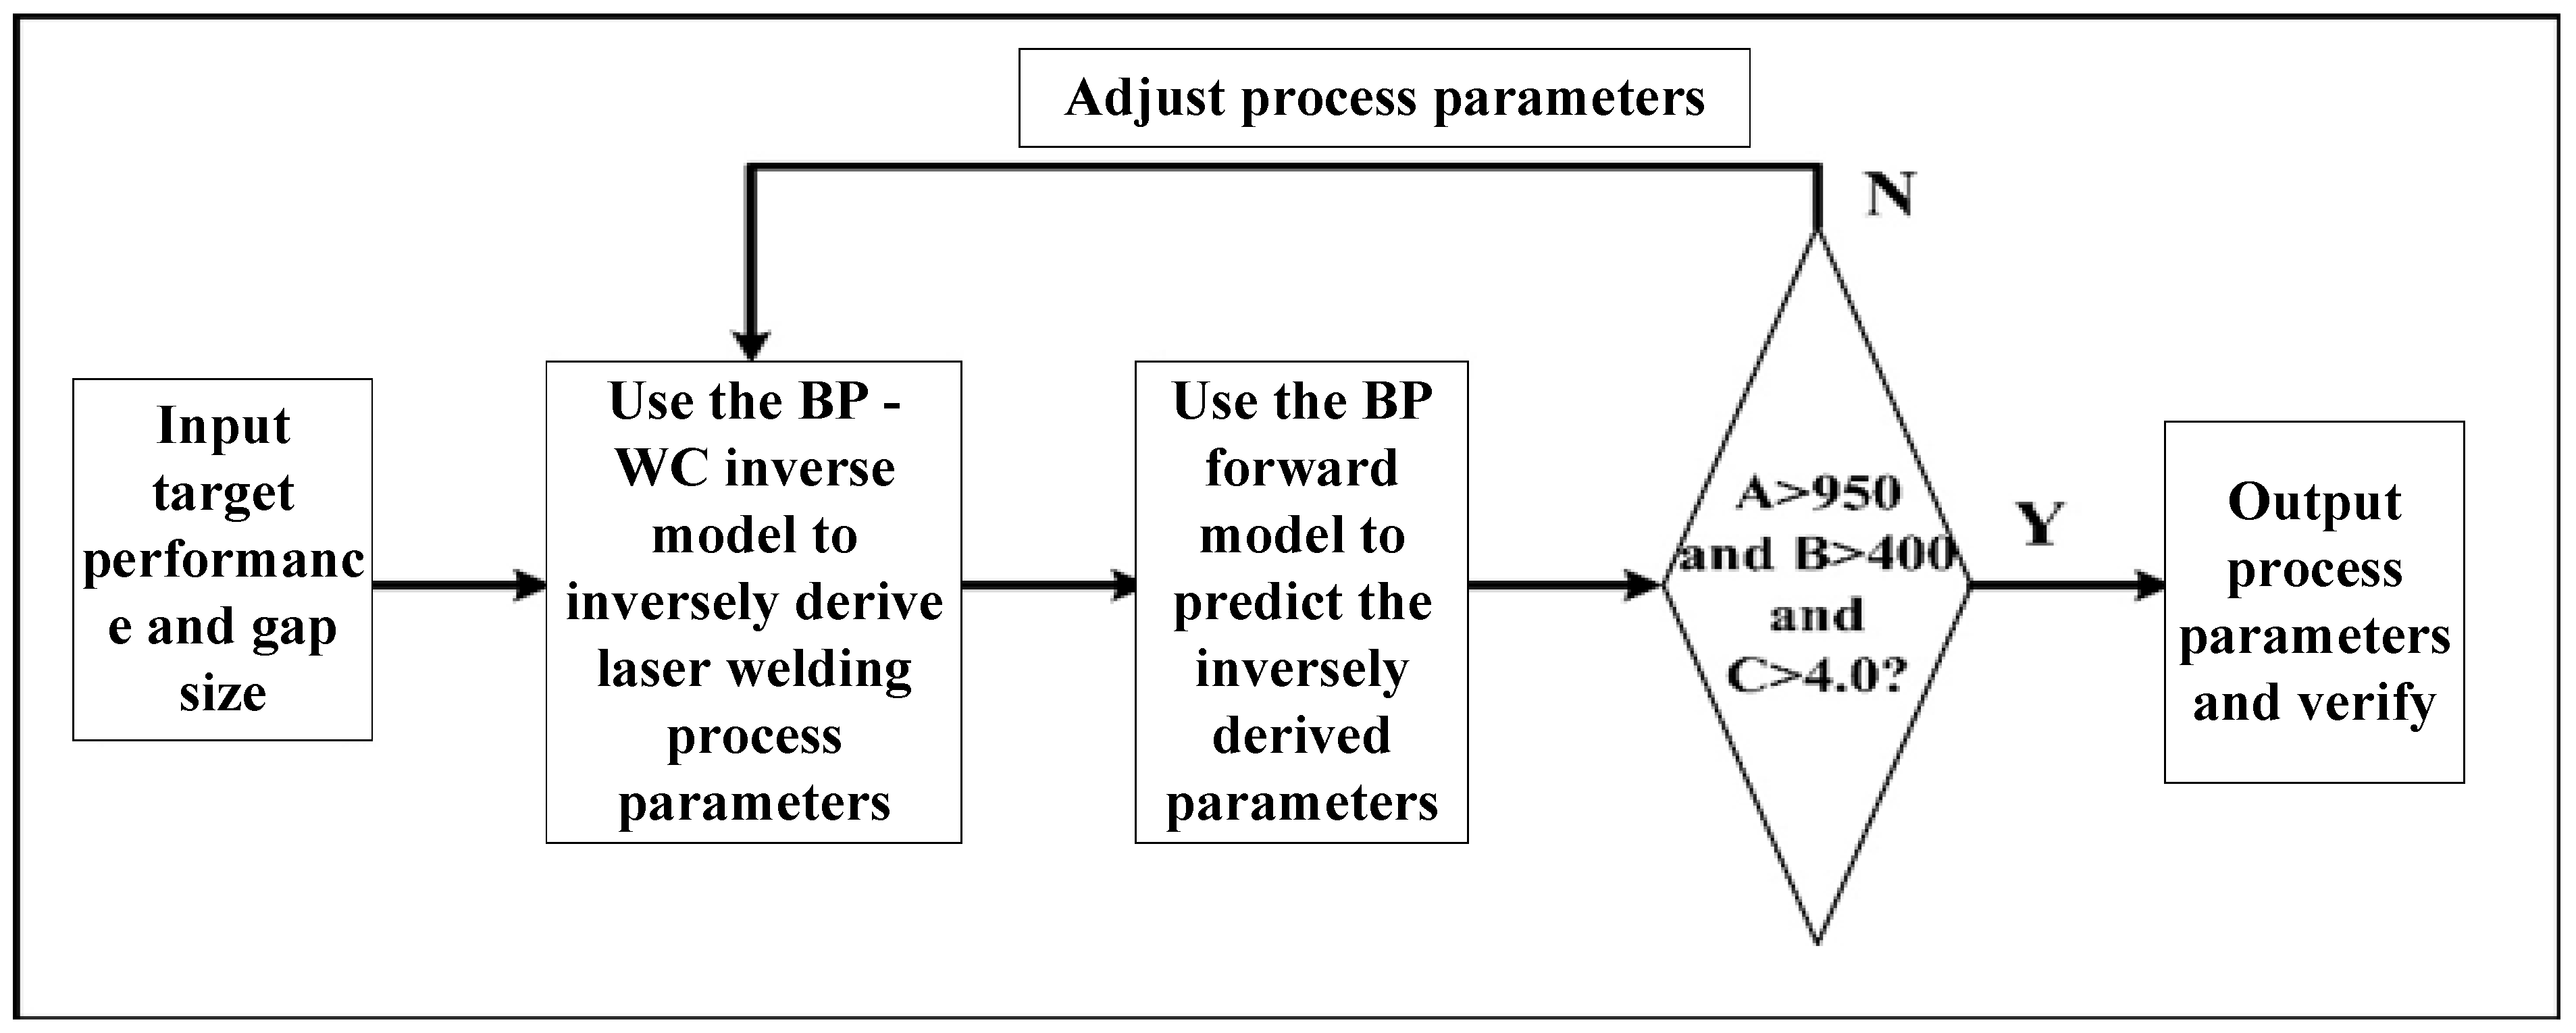
Flowchart of process parameters’ inverse derivation output.
Figure 21.
Cross-sectional morphology and microstructure of laser-welded joints based on inversely derived parameters: (a) cross-sectional morphology of Sample 1; (b) cross-sectional morphology of Sample 2.
Figure 22.
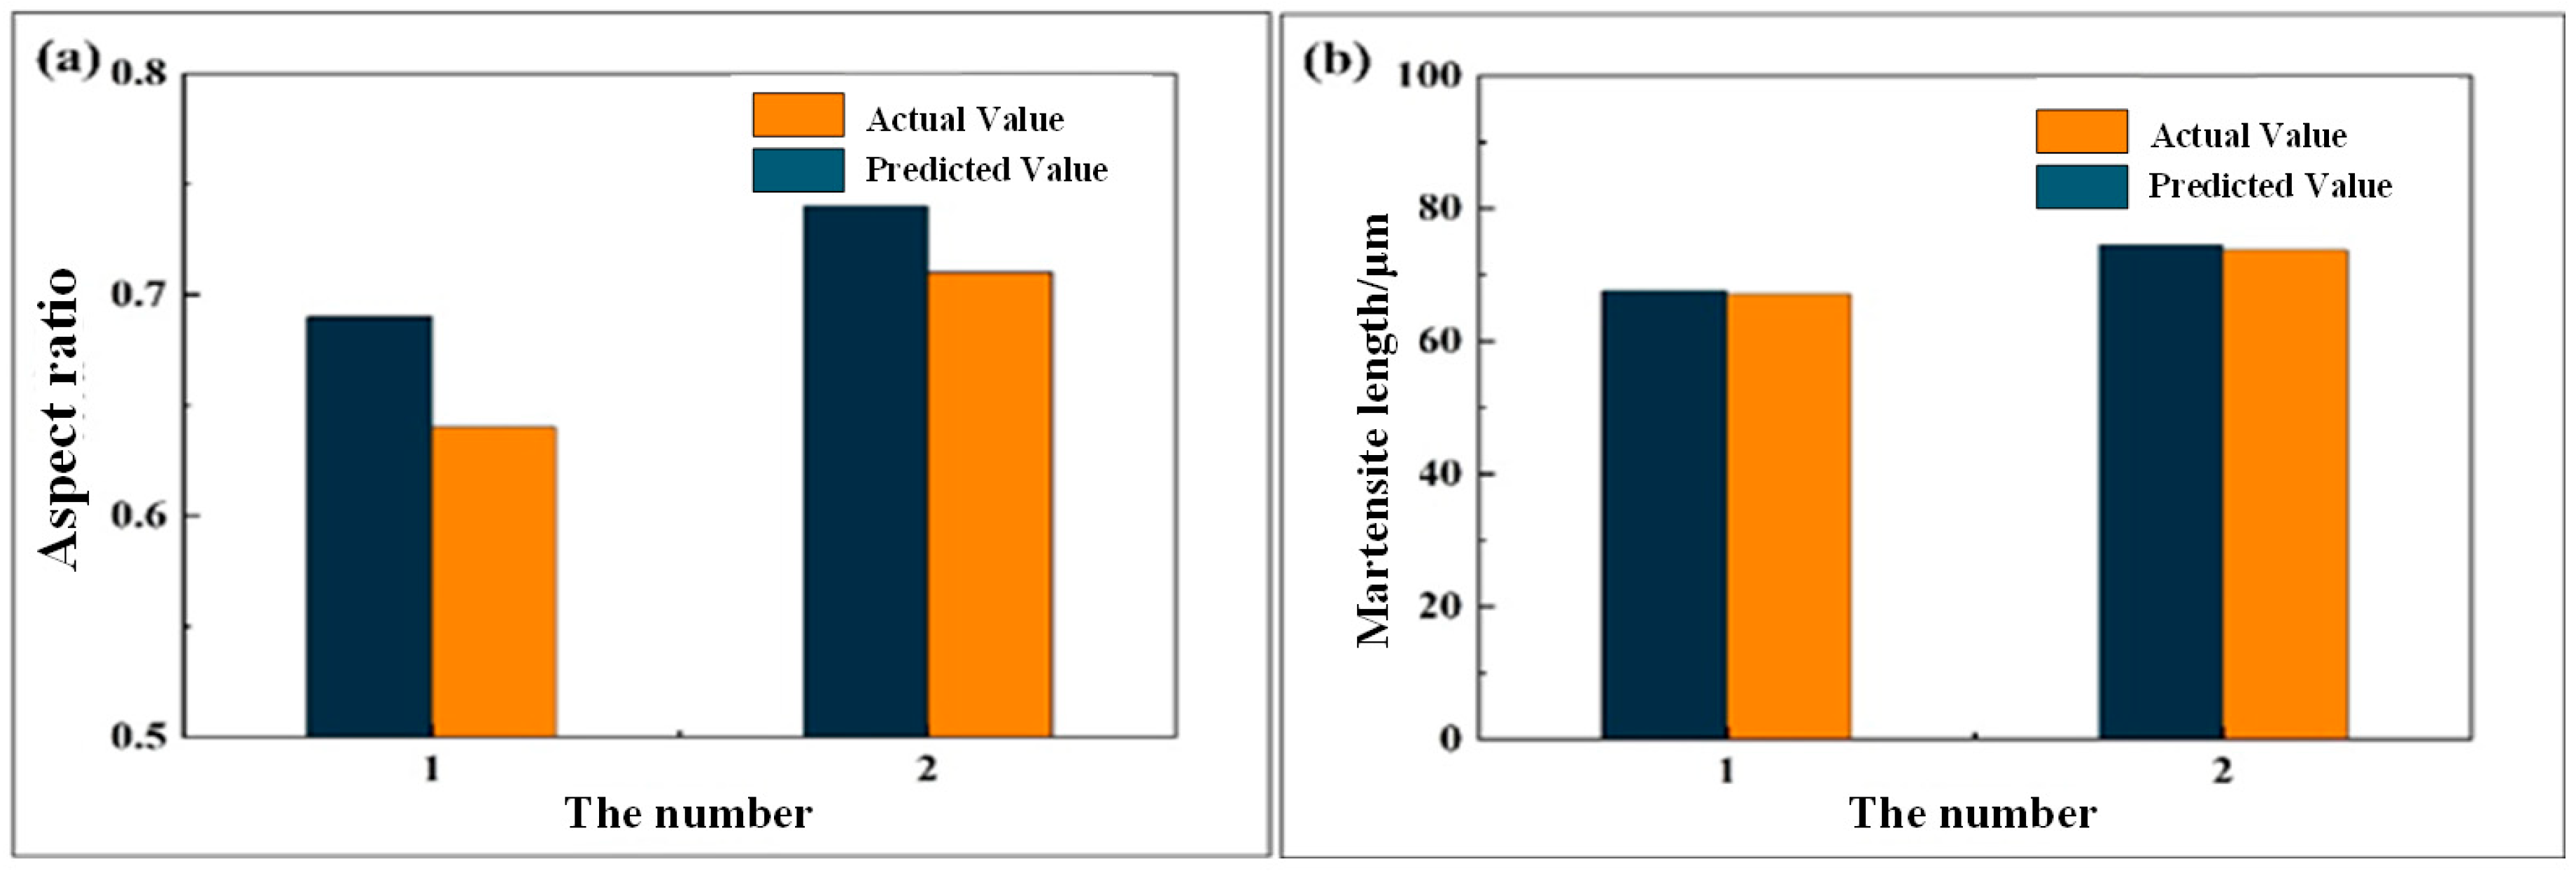
Comparison between predicted results of microstructure of test pieces and real data: (a) martensite length; (b) depth-to-width ratio.
Figure 23.
Comparison between predicted results of mechanical properties of test pieces and real data: (a) microhardness; (b) tensile strength; (c) fatigue life.
Table 1.
Chemical composition of Ti6Al4V alloy (wt.%).
| Al | V | Fe | C | N | H | O | Ti |
|---|
| 5.5–6.75 | 3.5–4.5 | 0.30 | 0.08 | 0.05 | 0.015 | 0.20 | Bal. |
Table 2.
Parameter table for laser welding of Ti6Al4V alloy.
| Sample No. | Gap (mm) | Defocus Amount (mm) | Laser Power (W) | Welding Speed (m/min) | Scanning Amplitude (mm) | Wire Feeding Speed (m/min) |
|---|
| 1–20 | 0.0 | 0–2 | 1800–2200 | 2.0–2.2 | 0.0 | 0.00 |
| 21–34 | 0.1–0.5 | 0–3 | 1540–1900 | 1.5–1.8 | 0–1.2 | 0.00 |
| 35–46 | 0.2–0.5 | 1–3 | 1600–1900 | 1.6–1.8 | 0.0 | 1.44–1.68 |
| 47–56 | 0.3–0.5 | 3–4 | 1600–1900 | 1.5–1.8 | 1.2 | 1.56–1.68 |
Table 3.
Prediction errors of microstructure characteristics by the forward calculation model.
| Specimen No. | Predicted Value of Martensite Length (μm) | Actual Value of Martensite Length (μm) | Prediction Error of Martensite Length (%) | Predicted Value of Depth-to-Width Ratio | Actual Value of Depth-to-Width Ratio | Prediction Error of Depth-to-Width Ratio (%) |
|---|
| 1 | 67.6 | 67 | 0.90 | 0.69 | 0.64 | 7.81 |
| 2 | 74.5 | 73.6 | 1.09 | 0.74 | 0.71 | 4.23 |
Table 4.
Prediction errors of mechanical properties by the forward calculation model.
| Specimen No. | Predicted Microhardness (HV10) | Actual Microhardness (HV10) | Microhardness Error (%) | Predicted Tensile Strength (MPa) | Actual Tensile Strength (MPa) | Tensile Strength Error (%) | Predicted Fatigue Life (105 Cycles) | Actual Fatigue Life (105 Cycles) | Fatigue Life Error (%) |
|---|
| 1 | 401.8 | 405.7 | 0.96 | 994.8 | 963.9 | 3.21 | 4.15 | 4.05 | 2.47 |
| 2 | 401.2 | 411.2 | 2.43 | 976 | 995.1 | 1.92 | 4.1 | 4.17 | 1.68 |
| Disclaimer/Publisher’s Note: The statements, opinions and data contained in all publications are solely those of the individual author(s) and contributor(s) and not of MDPI and/or the editor(s). MDPI and/or the editor(s) disclaim responsibility for any injury to people or property resulting from any ideas, methods, instructions or products referred to in the content. |
© 2025 by the authors. Licensee MDPI, Basel, Switzerland. This article is an open access article distributed under the terms and conditions of the Creative Commons Attribution (CC BY) license (https://creativecommons.org/licenses/by/4.0/).

