Article

Cyclic HCP<->FCC Phase Transformation Crystallography in Pure Cobalt

1
National Engineering Research Center for Key Materials of Integrated Circuits, China GRINM Group Co., Ltd., Beijing 100088, China
2
GRIKIN Advanced Materials Co., Ltd., Beijing 102200, China
3
School of Materials Science and Engineering, University of Science and Technology Beijing, Beijing 100083, China
*
Authors to whom correspondence should be addressed.
Metals 2025, 15(9), 947; https://doi.org/10.3390/met15090947
Submission received: 30 June 2025 / Revised: 22 August 2025 / Accepted: 25 August 2025 / Published: 26 August 2025
(This article belongs to the Special Issue Thermodynamics and Kinetics Analysis of Metallic Material)

Abstract

The phase transformations between HCP and FCC structures are among the most important transformations in metallic materials. The memory effect during cyclic transformation around the transus temperature in pure cobalt was investigated using the in situ electron backscatter diffraction (EBSD) technique. The crystallographic variants of orientation were systematically derived and compared with the observations. Texture memory effect was observed at both room and high temperatures, and a notable variant selection was observed, with the microstructure being preserved after cyclic heat treatment. Based on EBSD observations, the transformation mechanism is explained based on nucleation from a crystallographic perspective. Restricted nucleation of the transformation variants by grain boundaries is proposed to explain the observed phenomena, and these proposals could be extended to similar transformation systems.

1. Introduction

Cobalt (Co) and its alloys are widely used due to their exceptional magnetic properties, high-temperature stability, corrosion resistance, etc. [1,2,3,4,5], in applications such as superalloys, cermet alloys, biomaterials, conductors in microelectronics, etc. These applications are closely linked to its crystallographic features, i.e., anisotropic properties, making a fundamental understanding of its phase transformation behavior essential for optimizing material design and its properties.
Cobalt undergoes a reversible martensitic phase transformation between the face-centered cubic (FCC) and hexagonal close-packed (HCP) structures upon cooling from or heating above 420 °C [6,7]. This transformation follows the Shoji–Nishiyama orientation relationship (OR) between the FCC and HCP phase: (0001)HCP//{111}FCC and <2-1-10>HCP//<−101>FCC [8]. Similar transformation behavior is widely found in cobalt alloy, high-entropy alloys, TRIP steels, etc. [1,3,9,10]. Due to the orientation relationship, the crystallographic features, such as texture, are largely affected by the microstructure before the transformation [11,12,13], and the properties thereby. Moreover, during the phase transformation, equivalent orientation variants are formed due to the crystallographic symmetries of the matrix and weaken the anisotropic properties of the materials as if all the variants appeared with equal frequency [14]. However, crystallographic defects, including dislocations, grain boundaries, secondary phase, etc., constrain the transformation behavior during the transformation process, which is known as variant selection [14,15,16]. In steel, the “Double K-S” model is proposed for variant selection at grain boundaries during fcc/bcc transformation [17], where the product keeps the K-S orientation relationship with the neighboring two grains, while the “Double Burgers” model is proposed for bcc/hcp transformation in titanium, zirconium alloys, etc. [14]. The transformation texture can be rationalized based on these models from a statistical perspective. However, the texture or orientation memory phenomenon is often found during cyclic phase transformations [13,17,18,19,20], raising questions about the underlying crystallographic constraints during subsequent heating and cooling processes based on the high-temperature microstructure and its transformation product. To the best of the authors’ knowledge, there have been no reports or discussions on transformation crystallography, especially regarding variant selection during cyclic transformation.
Previous investigations into phase transformations have primarily relied on post-transformation characterization methods, such as reconstruction based on electron backscatter diffraction (EBSD) data at low temperature [21,22,23,24], high-temperature statistical approaches like in situ X-ray diffraction (XRD) [19,20,25,26], etc. While these techniques provide valuable insights, they lack direct evidence of high-temperature microstructures and dynamic transformation processes, including variant nucleation and growth. Therefore, in situ observation of these transformations is crucial to elucidate the crystallographic mechanisms governing phase transformations, such as in situ EBSD [18,27,28] and high-temperature transmission electron microscopy (TEM) [29,30]. In this study, high-purity cobalt (Co) was selected as the model material for this study because the phase transformation temperature is sufficiently low to permit in situ observation via EBSD.
This study aims to systematically analyze the crystallographic relationships during cyclic phase transformations in high-purity Co through in situ EBSD experiments, comparing experimental observations with theoretical predictions to reveal the fundamental mechanisms of the memory effect and the role of transformation crystallography. It provides further understanding of variant selection and grain boundary effects in Co.

2. Materials and Methods

High-purity Co (99.999%, 5N) was adopted in this study. The initial microstructure of Co was formed by hot rolling above 500 °C, followed by warm rolling at 350 °C with 15% strain. After being annealed at this temperature for 24 h, the material recrystallized to develop a strong {0001} basal texture. The sample was ground and polished at 20 V for 40 s with perchloric acid and alcohol solution (9:1 in volume). The in situ electron backscatter diffraction (EBSD) observation was carried out by MINI-HT1000 EBSD (Zhejiang QiYue Technology Co., Ltd., Zhejiang, China) equipped in a scanning electron microscope (ZEISS Gemini 2, ZEISS Group, Jena, Germany) with the EBSD system (Oxford Symmetry2, Oxford Instruments, Abingdon, UK). The scanning step for EBSD is 2.5 µm, and the EBSD data were analyzed using Aztec Crystal 2.1 and PTCLab 1.5 [31]. The pole figure (PF) was applied to show the recrystallization texture and also the orientation relationships between the FCC and HCP phases observed in this study. The orientation relationship was identified by allowing for a deviation angle of up to 5° from the given theoretical orientation relationship. The transformation temperature of pure Co is reported around 420 °C [7], and two HCP<->FCC transformation cycles around this temperature were involved during the in situ EBSD observations.

3. Results

3.1. In Situ Observation

The temperature profile applied during the experiment is illustrated in Figure 1, which features two consecutive heating and cooling cycles. The numbered points along the curve indicate the specific temperatures at which in situ EBSD scans were acquired. Figure 2 presents the corresponding crystallographic orientation data necessary for a detailed analysis of phase transformation at the grain scale. The left column of Figure 2 shows orientation maps captured at critical temperatures marked in Figure 1 at the 1st, 3rd, 4th, 5th, and 10th points, respectively. The right column complements these with the corresponding phase distribution maps, where the HCP phase is colored in green and the FCC phase in red. The microstructures captured at the selected observation points in Figure 1 are representative of the typical evolution during the two transformation cycles. The crystallographic orientations, in particular, exhibit notable discrepancies when compared to the results presented here.
The initial microstructure, presented in Figure 2a, consisted predominantly of HCP grains. As indicated in the corresponding {0001} pole figure (inset), a significant portion of these grains exhibited a strong basal orientation, highlighted in red in Figure 2a according to the color by inverse pole figure inserted. Upon heating to approximately 500 °C (corresponding to the third observation point in the thermal profile shown in Figure 1), the majority of the original HCP phase underwent a complete transformation into the FCC phase, as clearly depicted in the orientation and phase maps of Figure 2c,d, respectively. Subsequent cooling to the fourth point in Figure 1 promoted the reverse transformation, during which the FCC phase converted back into HCP, which is evident in the microstructural evolution shown in Figure 2e,f. A further heating cycle to the fifth point in Figure 1 again triggered the HCP→FCC transformation (Figure 2g,h). Finally, upon cooling to the 10th point, the material underwent an FCC→HCP reversion, resulting in the final microstructure illustrated in Figure 2i,j.
During the cyclic heat treatment, a noticeable degree of grain growth occurred within the HCP phase, as evidenced by an increase in average grain size from 51 μm to 65.8 μm. Nevertheless, a comparative analysis between the initial (Figure 2a), intermediate (Figure 2e), and final (Figure 2i) microstructures reveals that the overall crystallographic orientation of the HCP grains remained essentially unchanged throughout the entire process. This retention of crystallographic texture is a clear evidence of the orientation memory effect. Interestingly, a comparable memory effect was also observed in the FCC grains at elevated temperatures. This suggests that the phenomenon is not exclusive to the transformation during cooling but also plays a significant role in the overall memory effect during subsequent thermal cycling. The underlying mechanism for the crystallographic features during cooling or heating will be analyzed later.
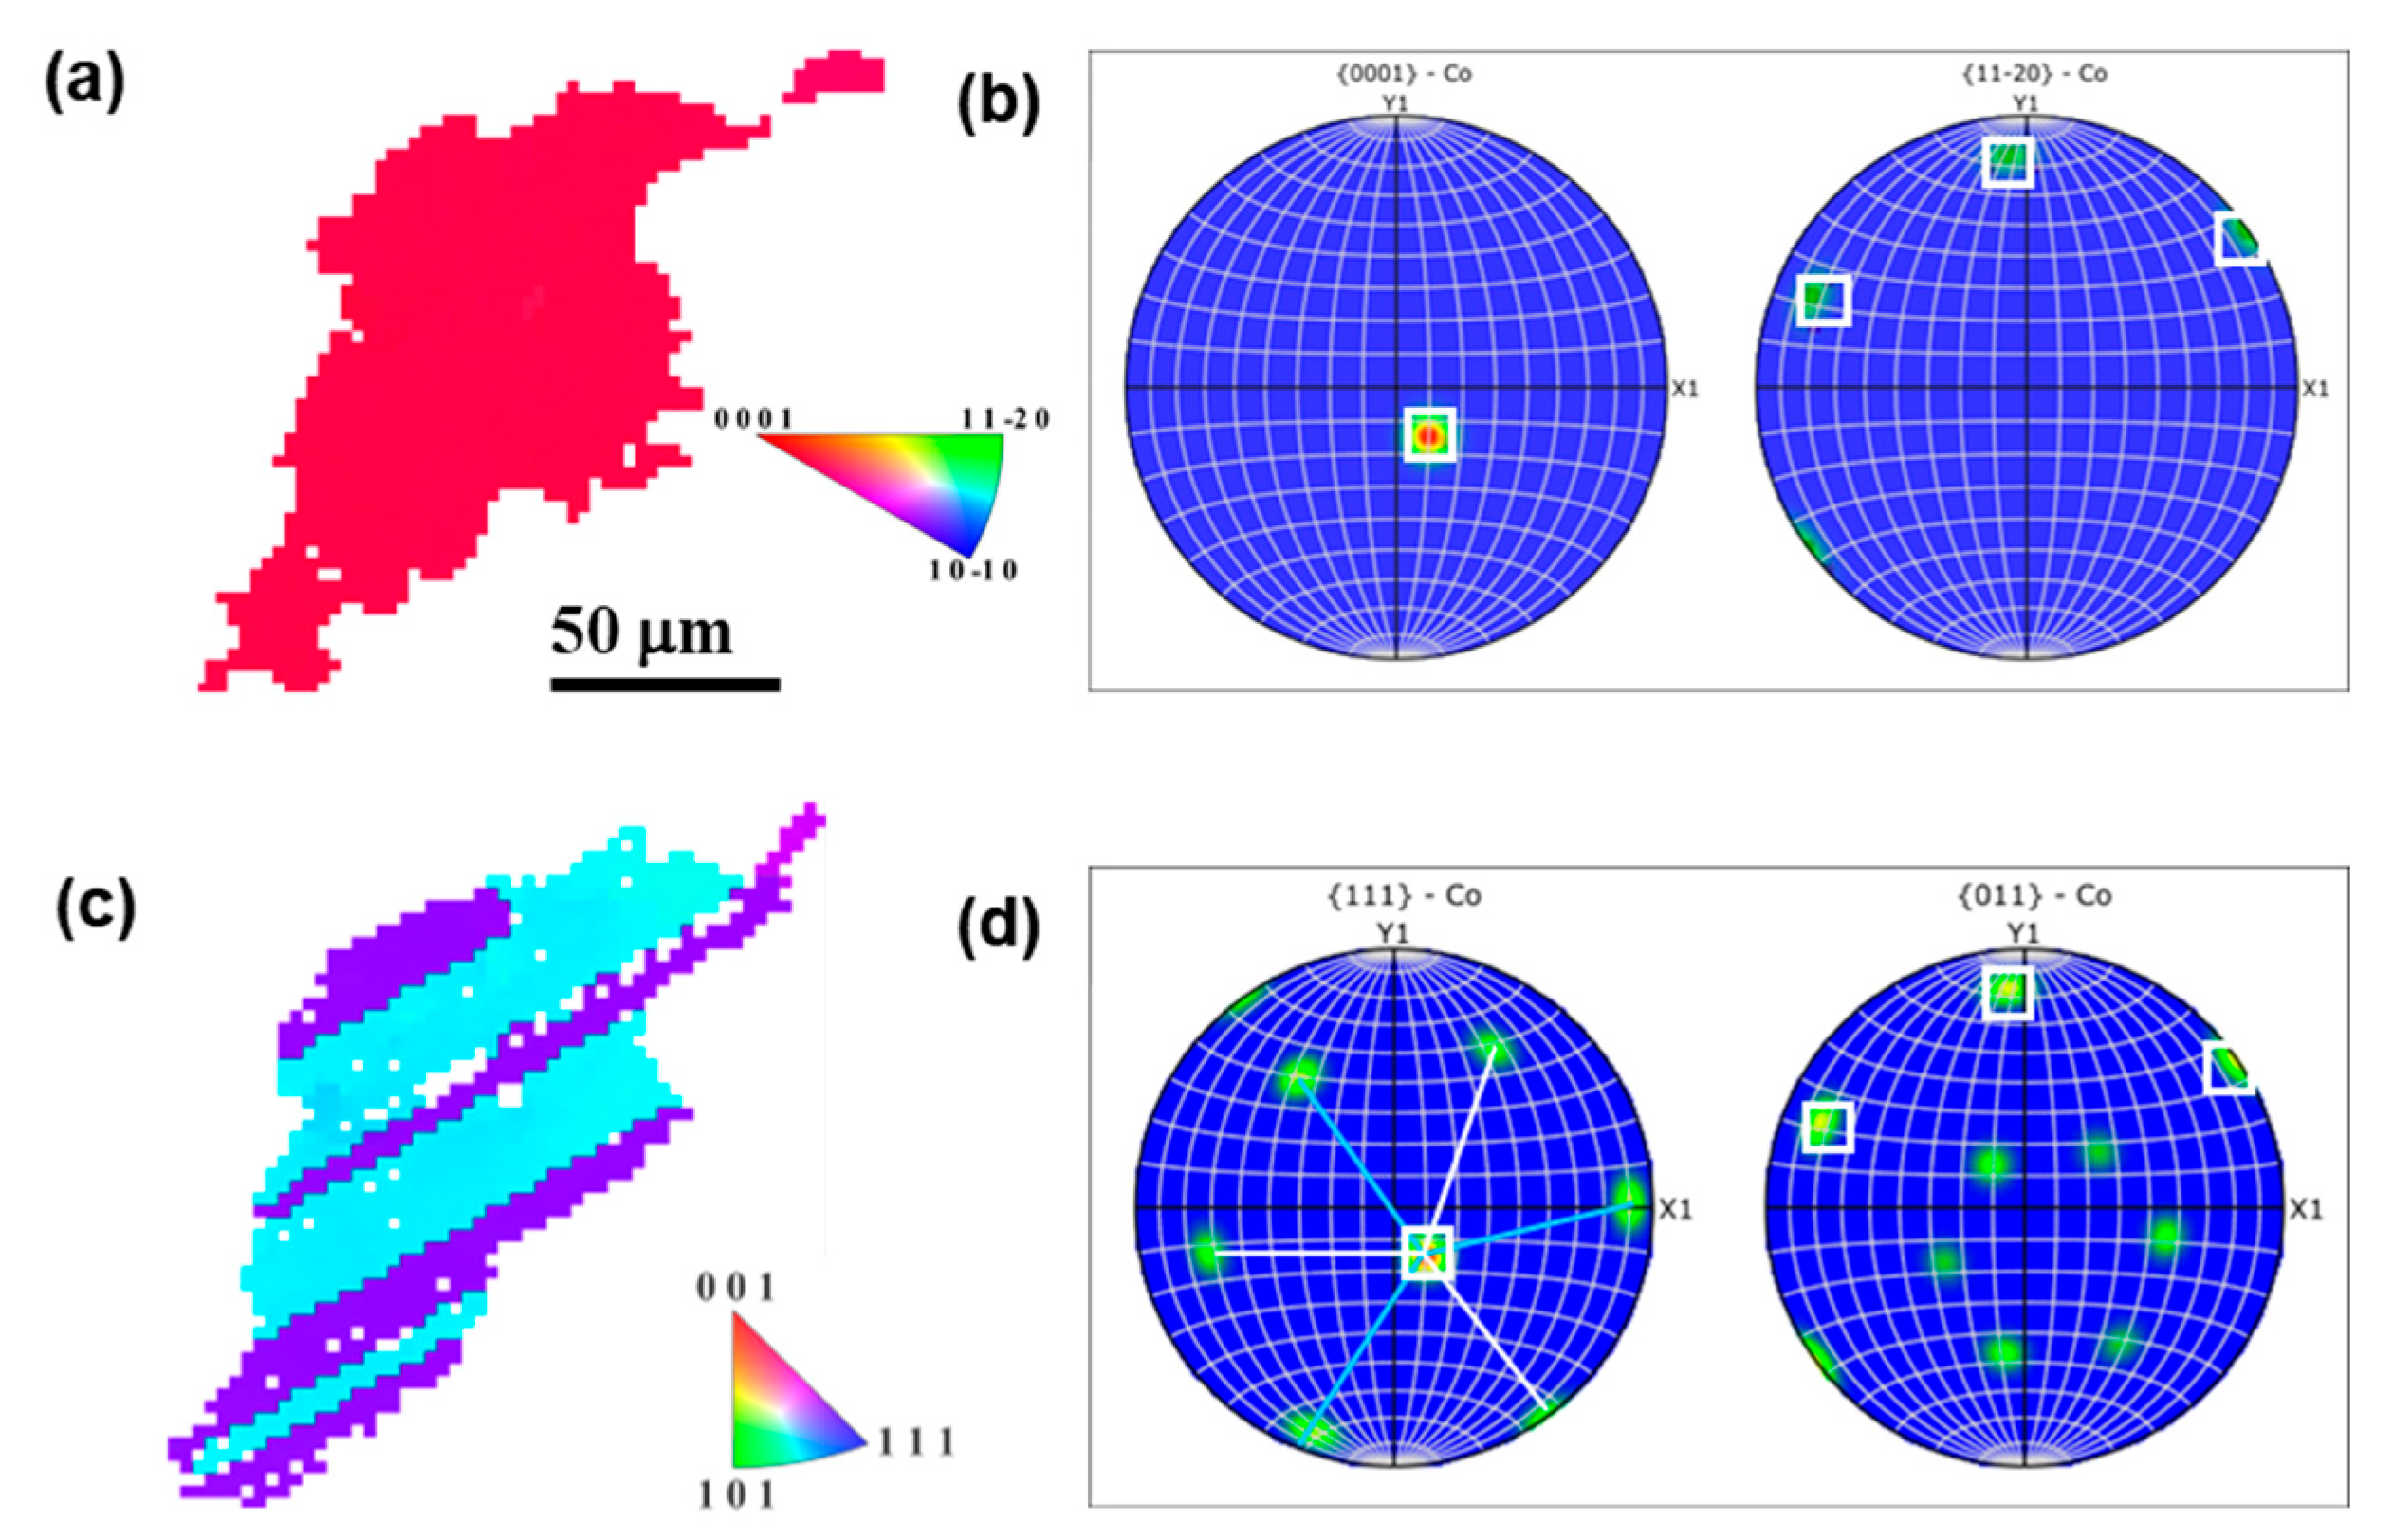
Figure 3 shows the orientation relationship between HCP and FCC grains randomly taken from Figure 2a,c. According to the pole figures, the orientation relationship between two phases exhibits the Shoji–Nishiyama orientation relationship, which is often reported between the FCC and HCP phases [8]:
{111}FCC//{0001}HCP
<−101>FCC//<2-1-10>HCP
with the interface parallel to {111}FCC//{0001}HCP, due to the similar atomic distribution in the interface layer, to reduce the transformation energy barrier [32,33]. The parallel relationship is marked in Figure 3b,d. In addition, {111} twinned FCC grains in Figure 3c,d are formed during the HCP->FCC transformation.
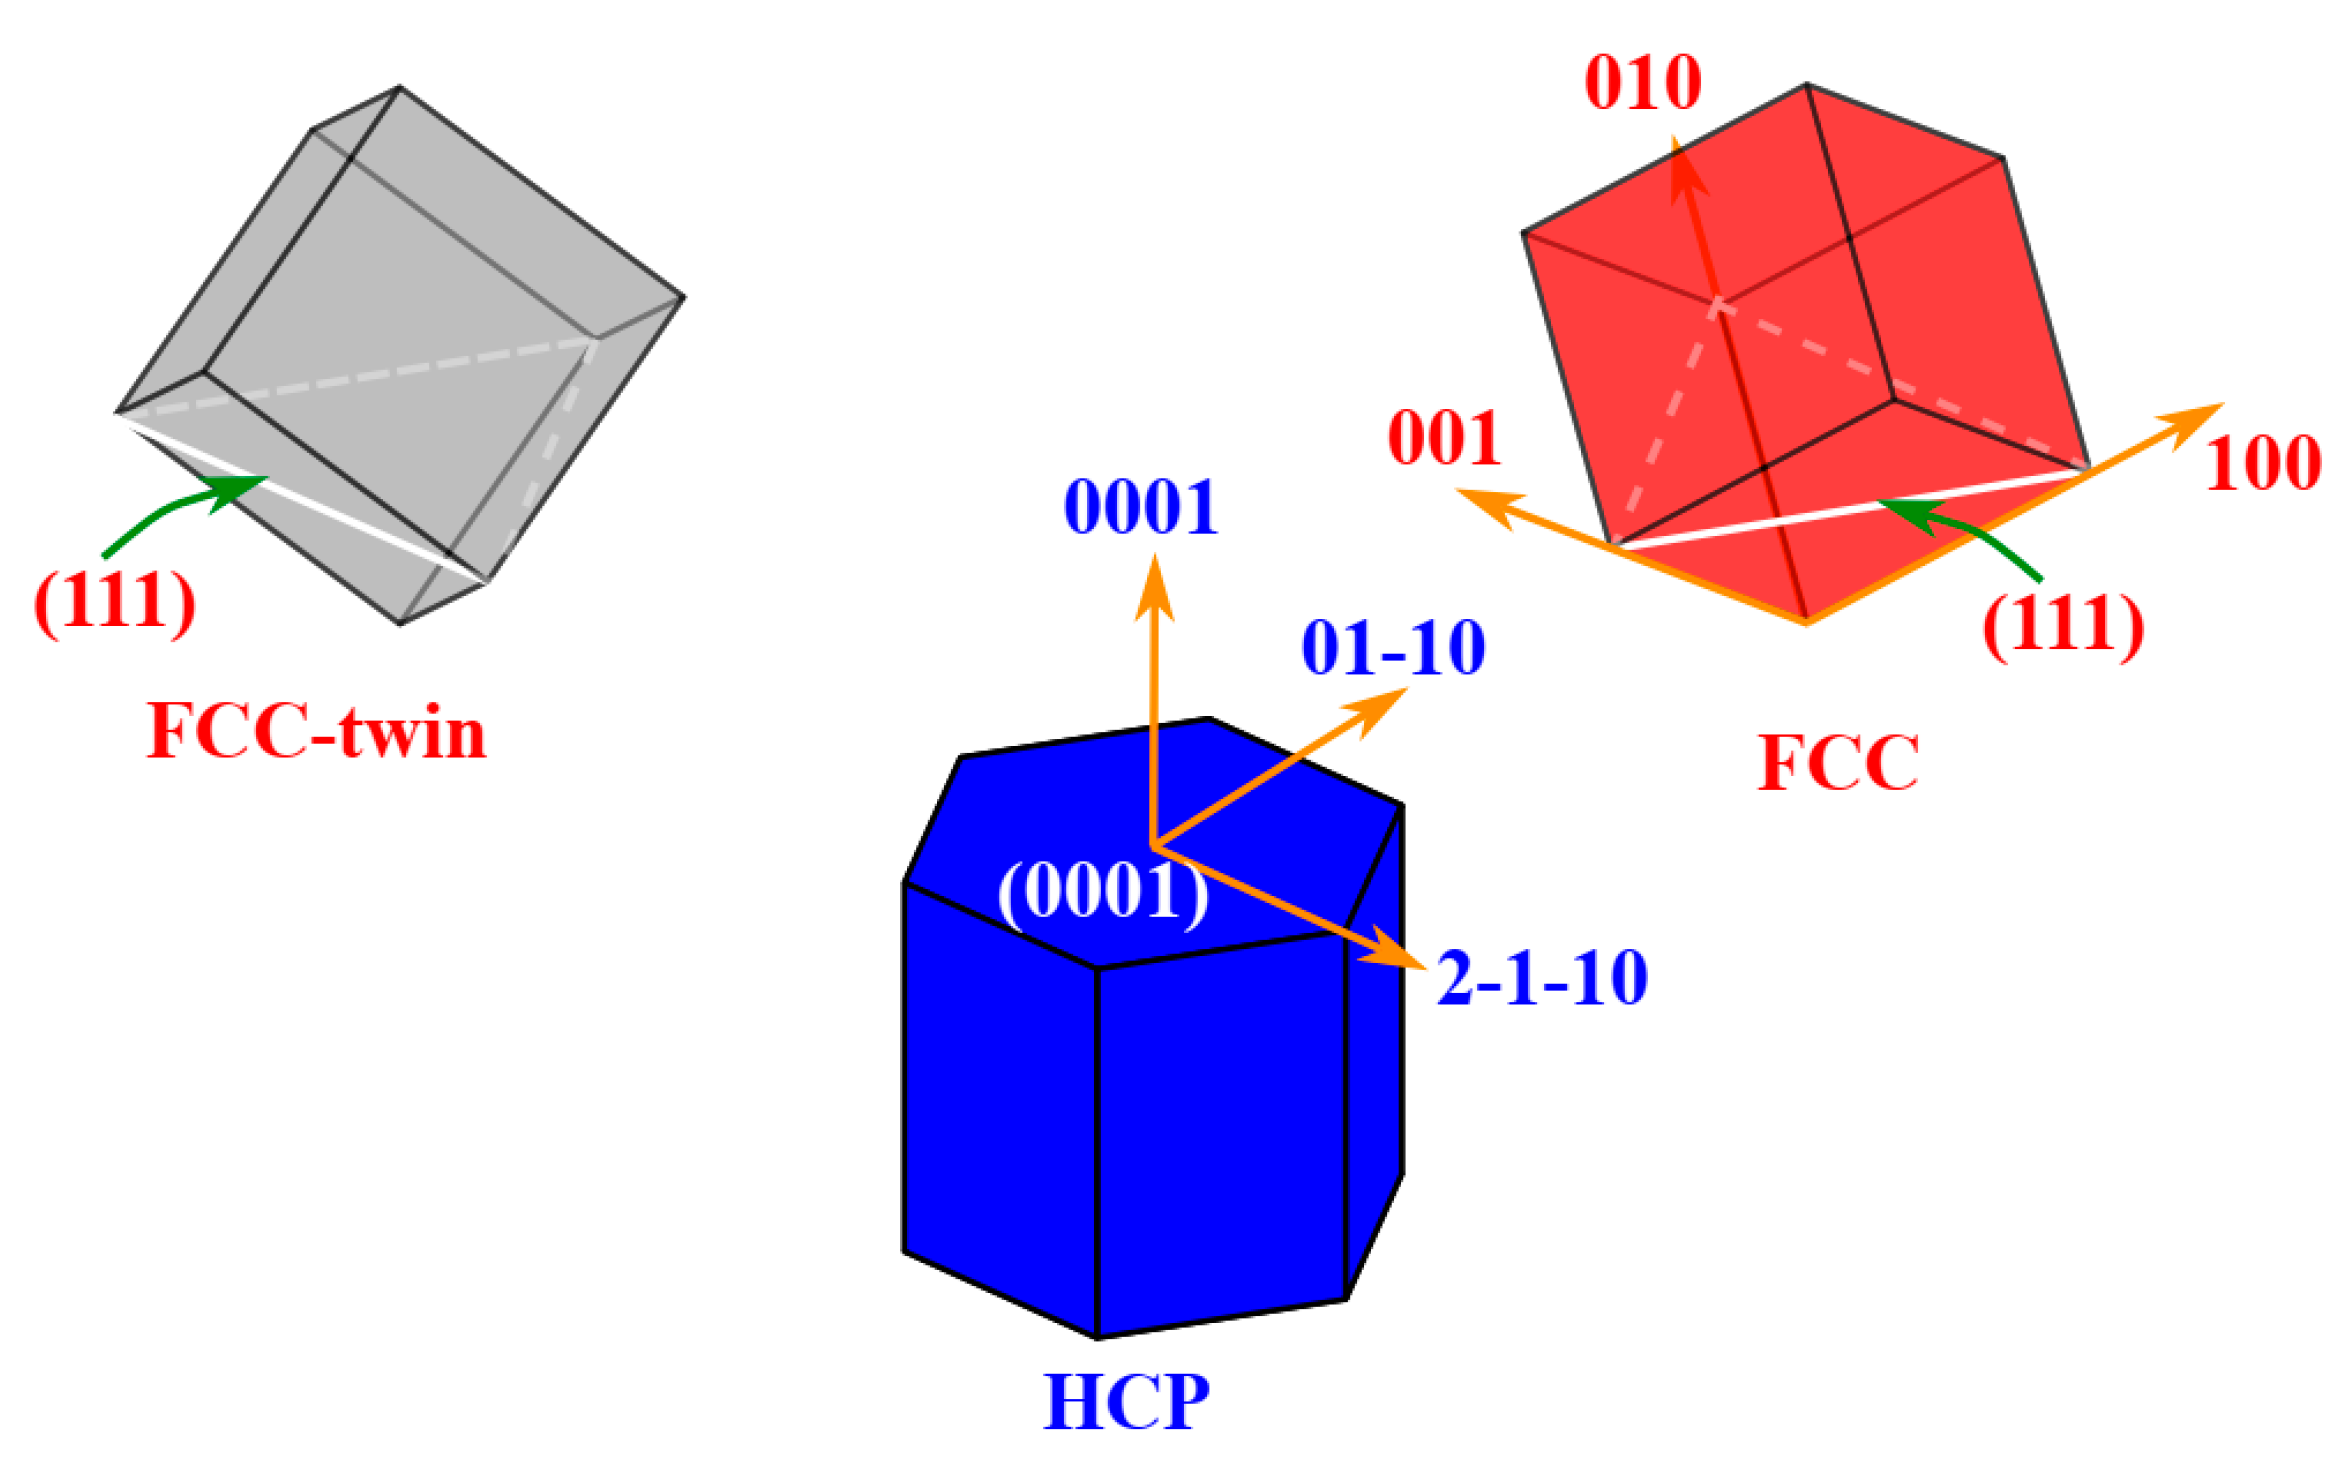
The Shoji–Nishiyama (S-N) orientation relationship between the HCP and FCC phases is schematically illustrated in Figure 4. For the purpose of quantitative analysis, an orthogonal coordinate system defined within each crystal—rather than the standard crystallographic coordinate systems—is employed in subsequent calculations. This orthogonal reference frame, as visually identified in Figure 4, facilitates the mathematical treatment of the orientation transformation. Within this defined orthogonal coordinate system, the orientation matrix describing the transformation from the HCP to the FCC structure can be derived based on the parallel plane and direction relationships stated in Equation (1) as
M h c p f c c = 0.7071 0.40825 0.57735 0 0.81649 0.57735 0.7071 0.40825 0.57735
or this rotation matrix can be transformed to Euler angles in Bunge convention as (120.0, 54.7, 45.0) in degrees. Accordingly, the orientation matrix for transformation from FCC to HCP is the inverse of the matrix in Equation (2), i.e.:
M f c c h c p = 0.7071 0 0.7071 0.40825 0.81649 0.57735 0.57735 0.57735 0.57735 .
The orientation matrix expressed by the matrix facilitates the crystallographic calculation and helps to rationalize the crystallographic feature observed by EBSD, such as the orientation variant, as shown below.

3.2. Orientation Variants

Due to the crystal symmetries, there exist equivalent crystallographic directions or planes in the matrix or products. Since orientation relationships are typically expressed through the parallelism between specific crystallographic planes or directions as in Equation (1), substituting equivalent planes/directions in the orientation relationship expression will generate multiple crystallographically equivalent orientation relationships, known as orientation relationship variants. The FCC variants generated from an HCP crystal according to the Shoji–Nishiyama orientation relationship are shown in Table 1, and there are two variants. The variant can also be generated by the two-fold symmetry operation around <2-1-10> or two-fold symmetry operation around [0001] in HCP. In general, the orientation variants MjF can be systematically found by the symmetry operations Sihcp as
MiF = Mhcp->fccSihcp
where S is the symmetry operation matrix, the superscript “hcp” means the symmetry in the HCP crystal, and the subscript is the ith symmetry operation. The maximum number of variants is equal to the order of the matrix’s rotation group [15], for example, if the matrix is an FCC structure (rotation group, 432), the order of 432 is 24, while the rotation group for the HCP structure is 622, and the order of the group is 12 [34]. When the symmetry operations of both the parent and product phases (in this case, HCP and FCC) coincide under a given OR, no new distinct orientation variants are generated by those symmetry elements. In the present study, although the HCP structure possesses 12 rotational symmetry operations, most of these operations coincide with symmetries of the FCC lattice under the Shoji–Nishiyama OR. As a result, only two FCC variants, designated F1 and F2 (see Table 1), are produced. This reduction arises due to the two-fold rotational symmetry around the HCP matrix direction [2-1-10] in the HCP matrix. These two FCC variants, F1 and F2, exhibit a twin relationship characterized by parallel {111} planes. The spatial arrangement between the FCC variants and the parent HCP matrix is illustrated schematically in Figure 2, where the twin interface between the FCC variants is indicated by white dashed lines in the cubic FCC lattices. The presence of such transformation twins within a single prior grain is experimentally confirmed in Figure 3a,c, which show a distinct lamellar morphology. The twin boundary in Figure 3c is identified as a {111}-type twin, confirmed by the fact that one of the {111} pole directions is normal to the lamellar interface plane.
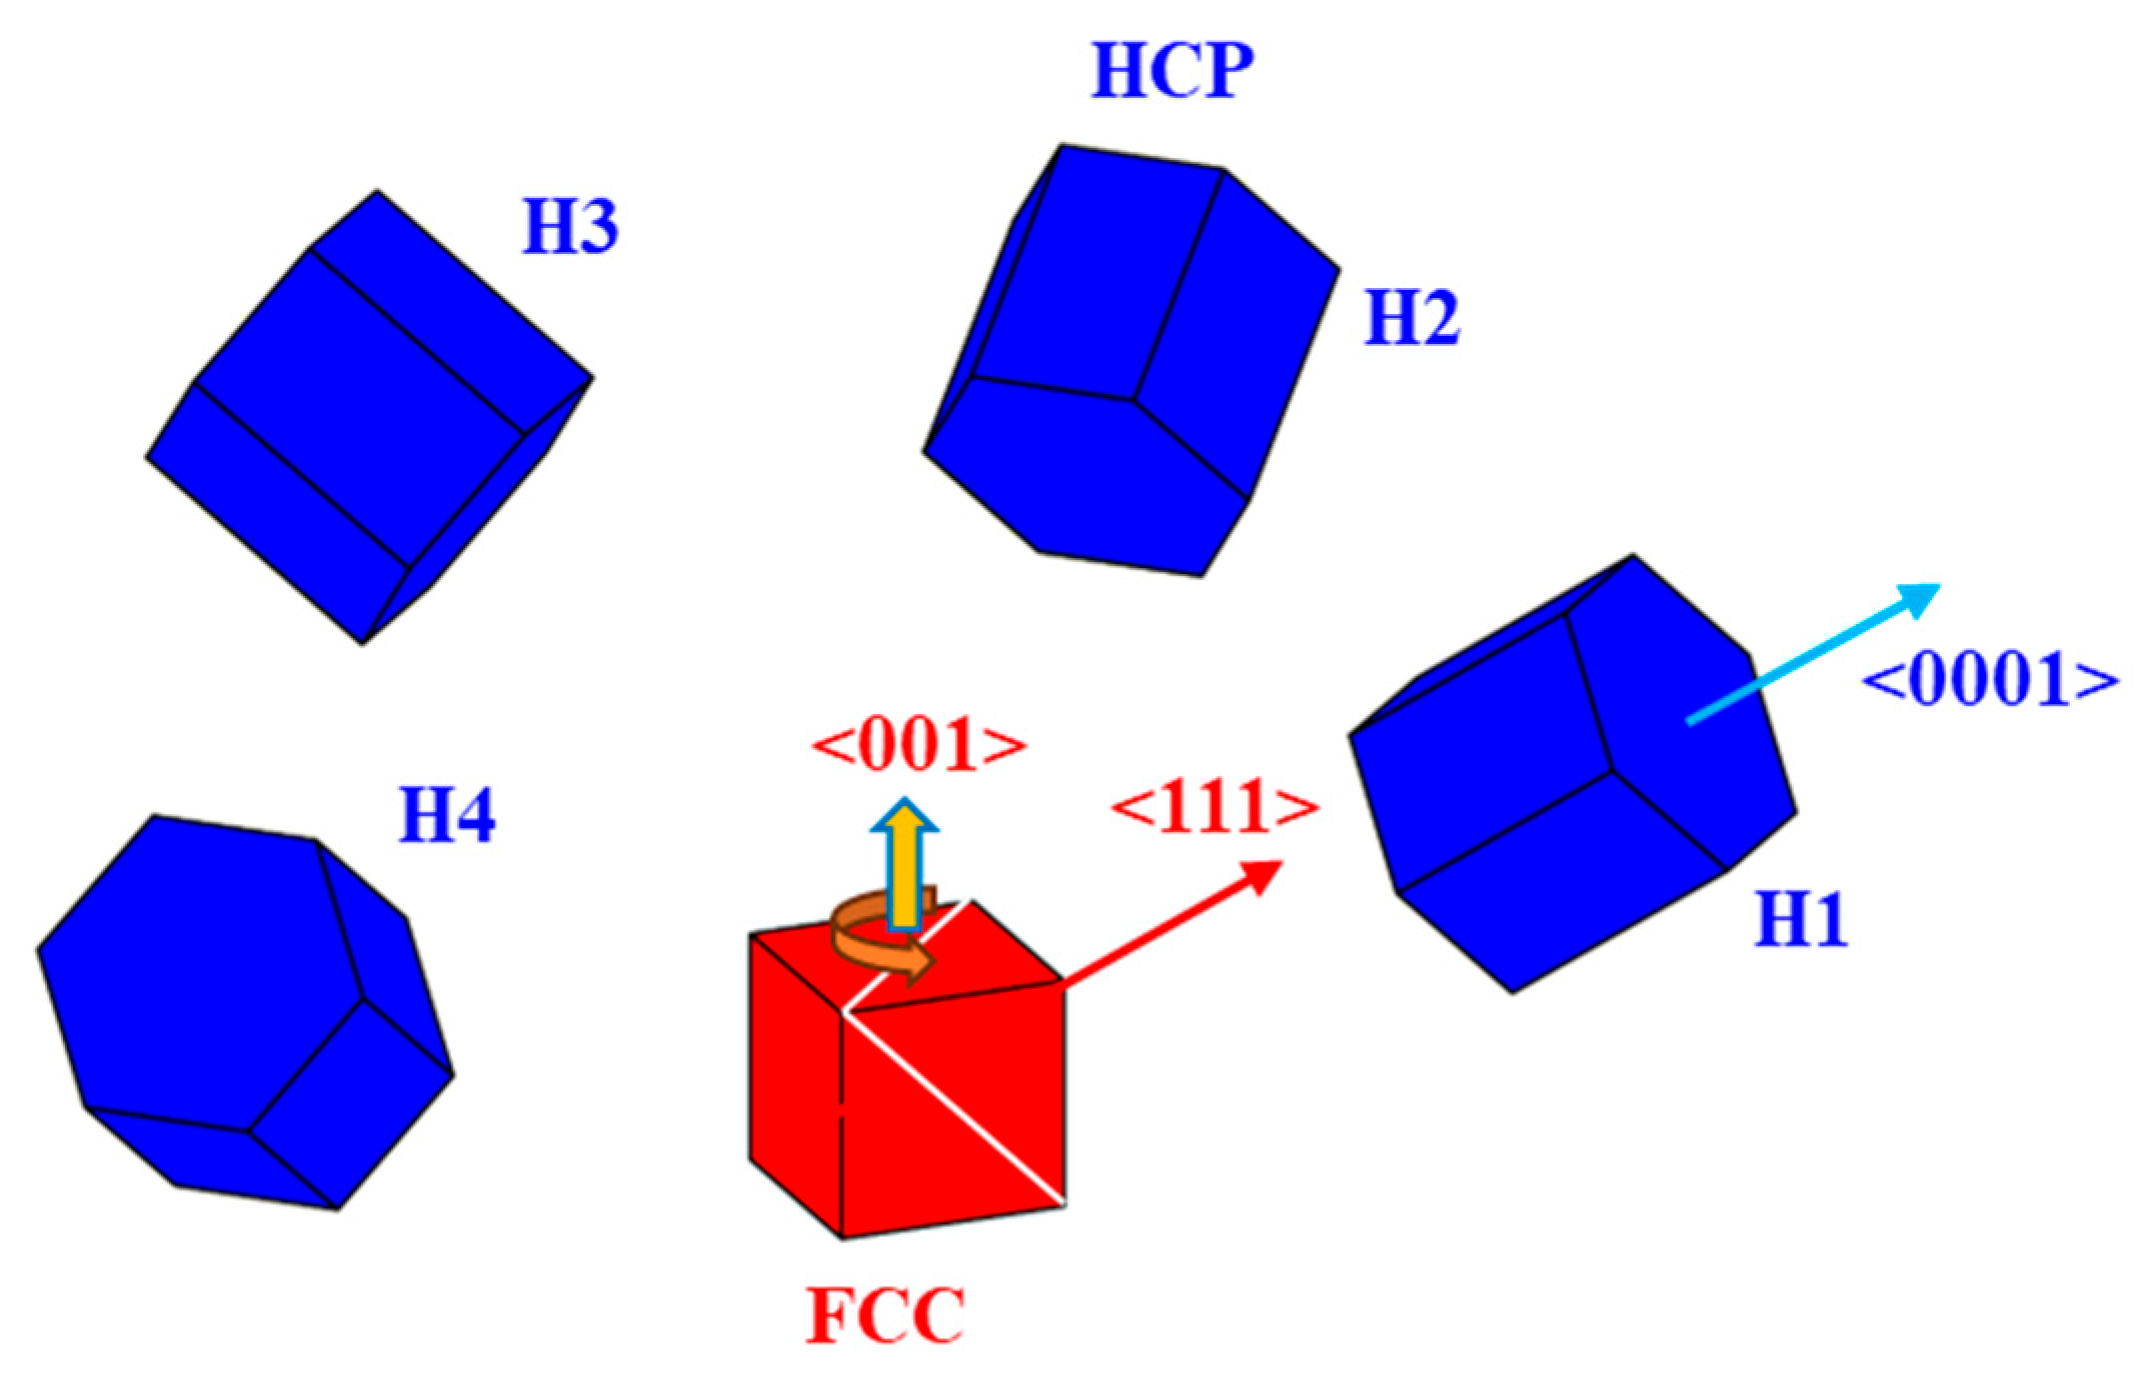
After further cooling, the transformed FCC crystals will transform to HCP according to the Shoji–Nishiyama orientation relationship. One FCC crystal will transform to four HCP variants with
MjH = Mfcc->hcpSjfcc
where the symmetry operation matrix is shown in the last column of Table 2, also with explicit expression of the OR in the parallelism of Miller indices. The four possible HCP variants, as predicted by the four-fold symmetry operations inherent in the FCC crystal structure, are schematically illustrated in Figure 5. However, in contrast to previous reports [7], the experimental observations in this study reveal that only one dominant HCP variant forms during the reverse FCC→HCP transformation. This is clearly demonstrated by the microstructural evolution from Figure 2c,e and from Figure 2g,i, where a single variant is consistently selected. This distinct behavior provides strong evidence of variant selection occurring during phase transformation. The detailed mechanisms underlying this selective nucleation and growth process are discussed in a later section.

4. Discussion

4.1. Transformation Sequence

During the cyclic HCP->FCC->HCP phase transformation, various transformation variants can be generated based on previous orientations. With a combination of Equations (4) and (5), the orientation matrix due to HCP->FCC->HCP transformation cycle can be obtained by
MijH = MiFMjH(MiF)−1
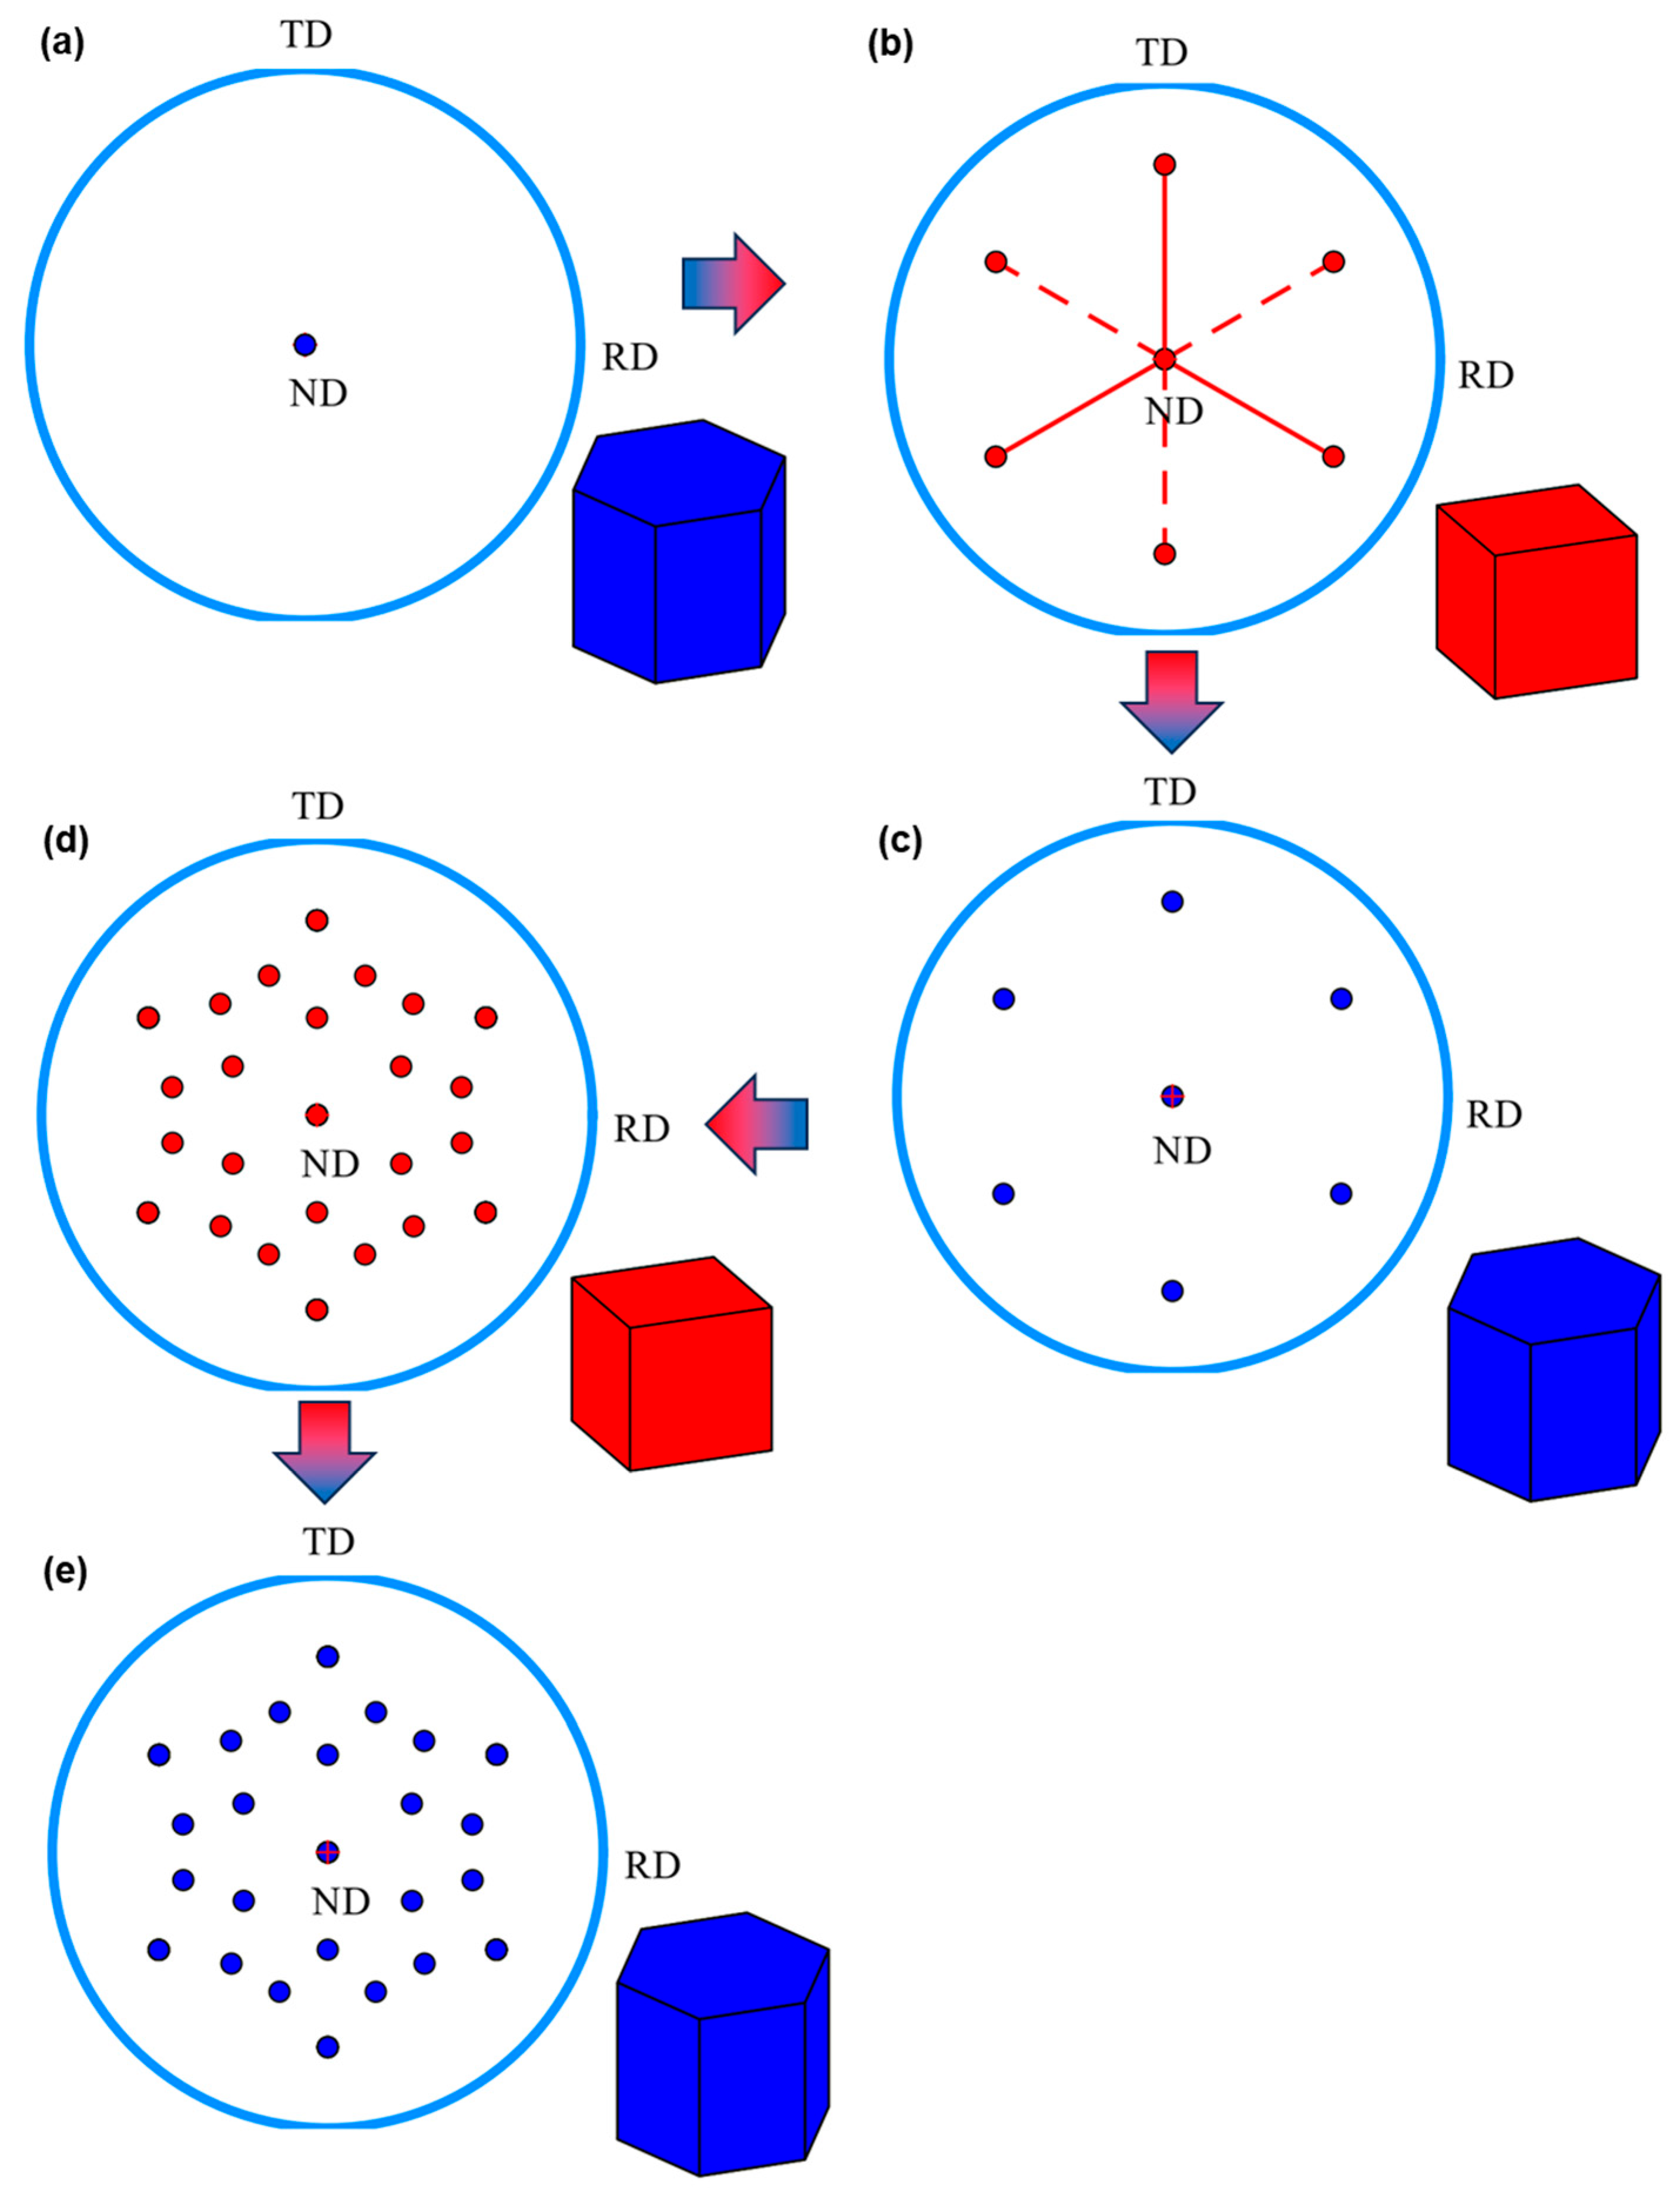
The theoretical evolution of crystallographic orientations throughout the cyclic phase transformations is sequentially presented in Figure 6a–e. Consider an initial HCP grain with Euler angles (0°, 0°, 0°). Upon heating, it transforms into two FCC variants that share a twin orientation relationship, as illustrated in Figure 6b and consistent with the previous discussion. During subsequent cooling, each of these FCC grains can potentially give rise to four distinct HCP variants according to the Shoji–Nishiyama orientation relationship, leading to the configuration shown in Figure 6c. The next heating step transforms each of these HCP variants back into two twin-related FCC grains (Figure 6d), and a final cooling step results in the orientation distribution shown in Figure 6e.
By comparing the orientation distributions in Figure 6a,c,e, it can be deduced that a single initial HCP grain would theoretically produce 7 distinct HCP orientations after one full thermal cycle (including the original orientation), and this number would increase to 25 after two cycles. This rapid multiplication implies that, in the absence of variant selection, an increasing number of HCP variants would be generated with each successive cycle.
A similar analysis can be applied starting from an initial FCC orientation. If an FCC grain with Euler angles (0°, 0°, 0°) is selected as the starting point, the predicted orientation products after two transformation cycles are displayed in Figure 7. Without variant selection, a variety of orientations would occur, although their distribution in the pole figure remains constrained by the underlying crystal symmetries of both phases.
In contrast to this predicted multiplication, the experimental results in Figure 2 show a strong orientation memory effect rather than progressive diversification. This clear discrepancy indicates that significant crystallographic constraints or pronounced variant selection must be operative during the cyclic transformations, actively suppressing the theoretical number of variants and preserving orientation stability across multiple cycles.

4.2. Variant Selection

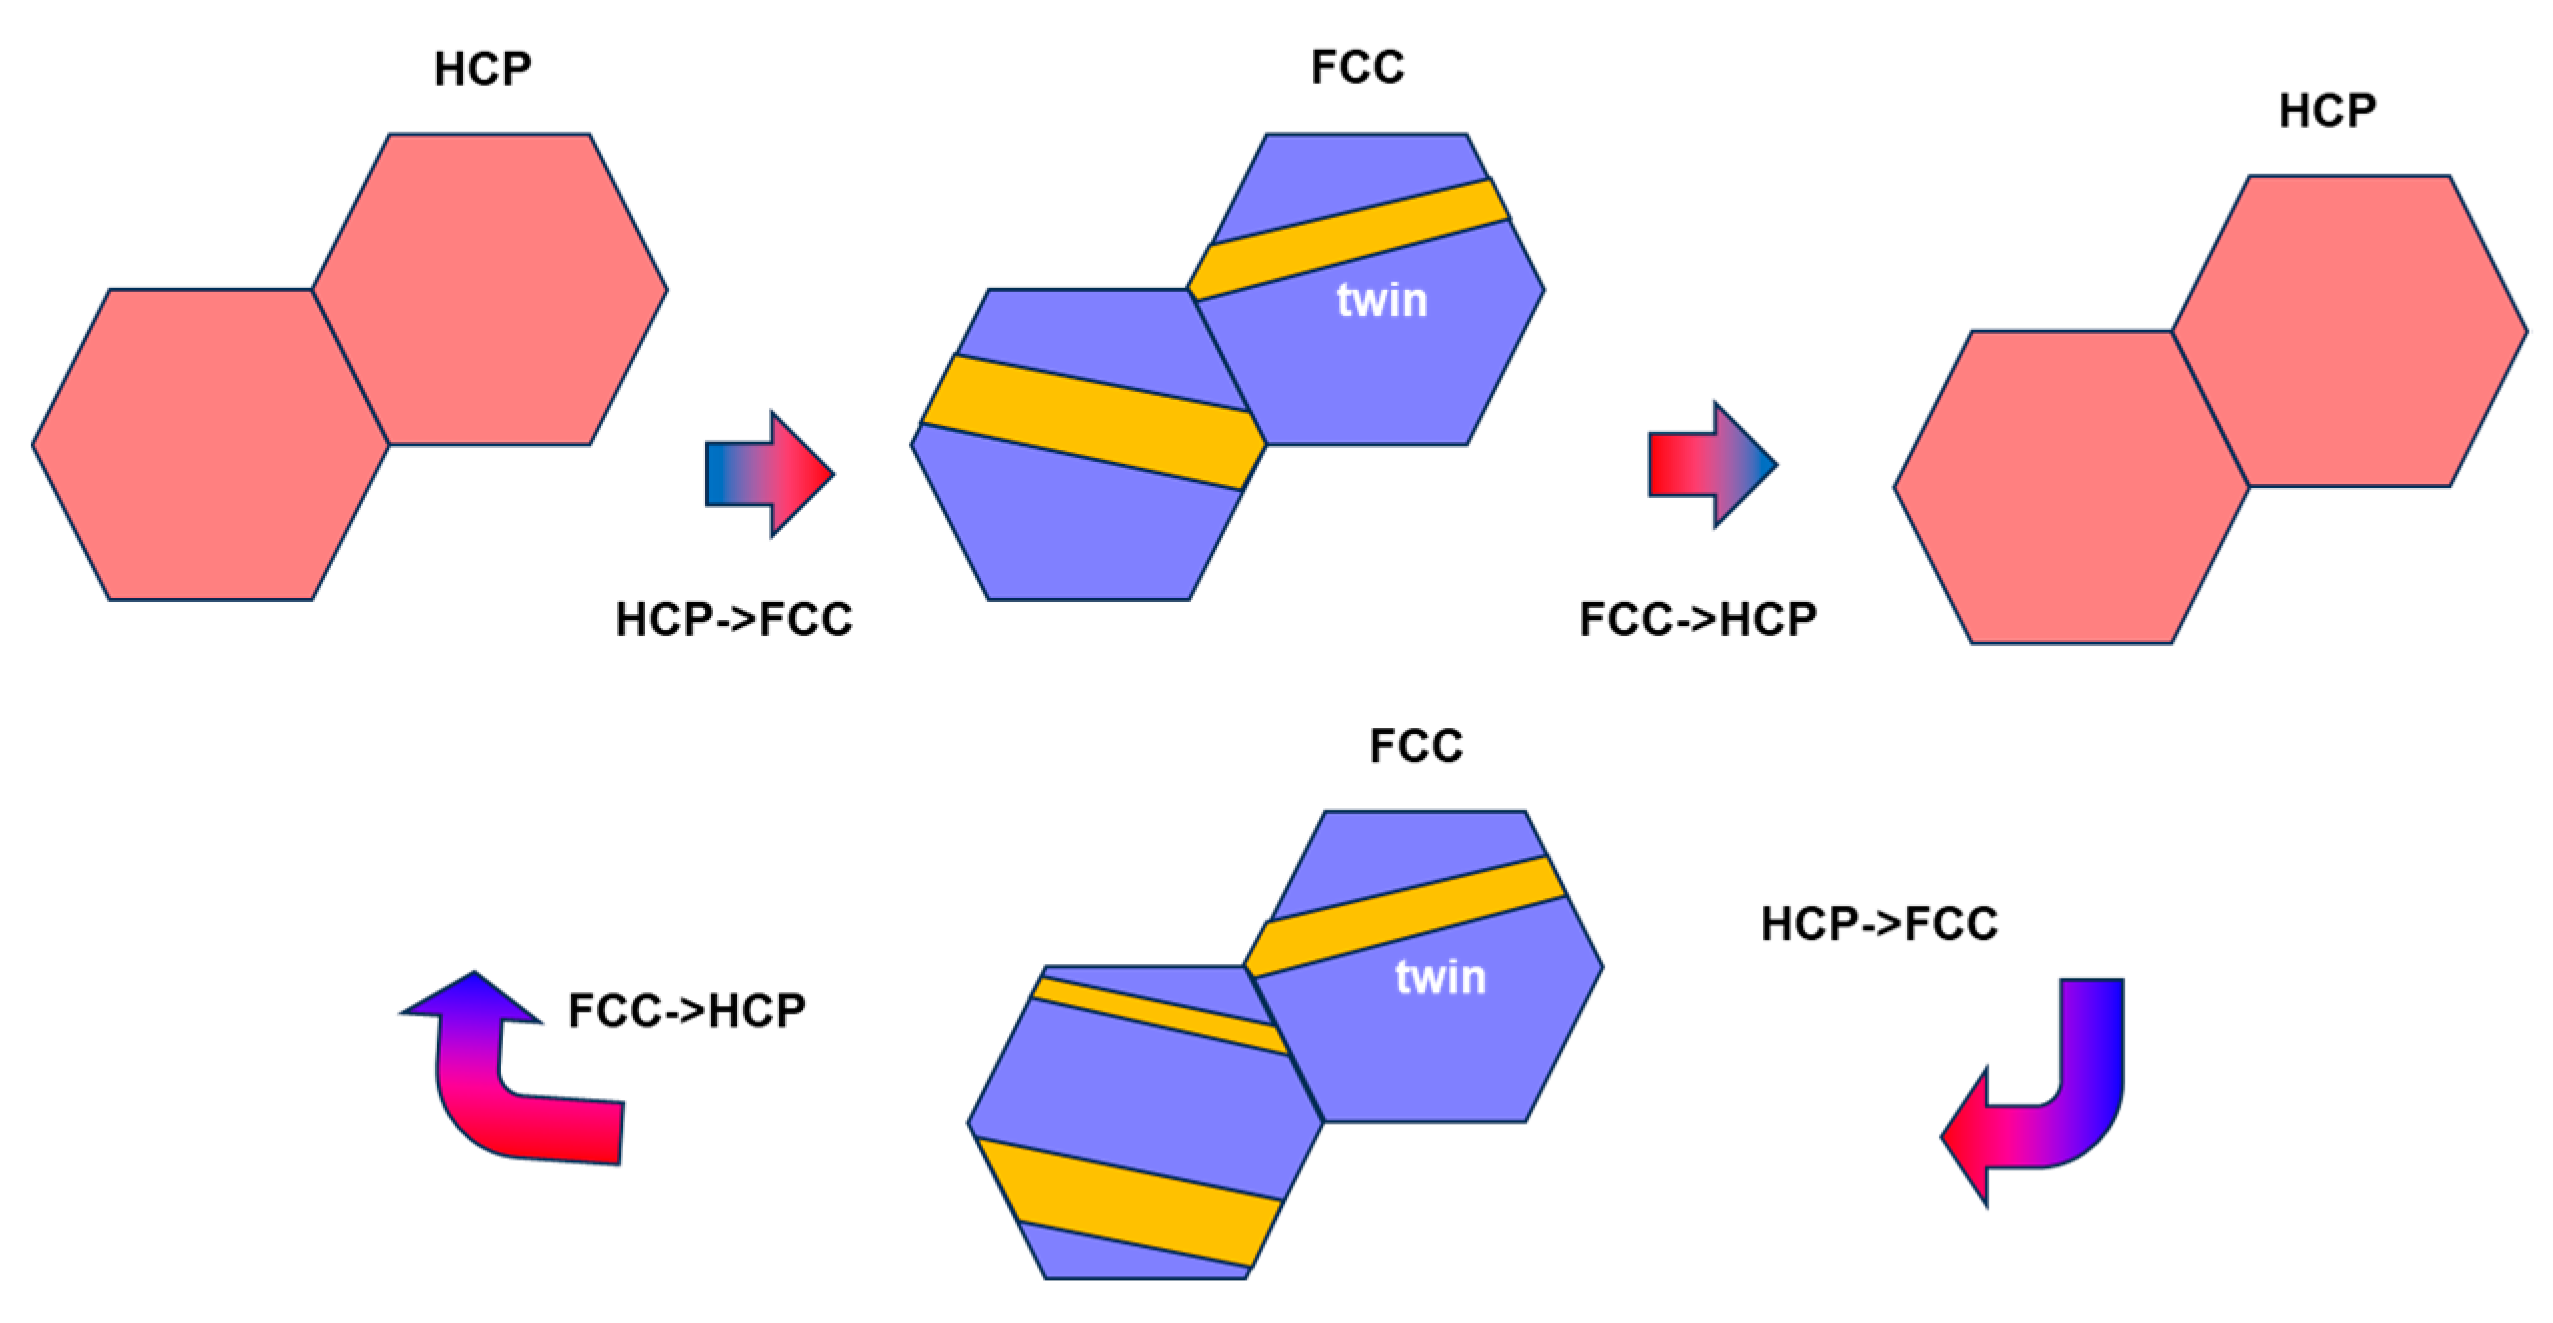
The present work demonstrates in situ observation of the phase transformation of Co with a strong initial {0001} texture, and the texture memory effect is observed at both low and high temperatures (Figure 2). The preservation of {0001} texture can be easily rationalized as schematically illustrated in Figure 8. During HCP→FCC transformation, two twin-related FCC variants are formed, both of which maintain near-Shoji–Nishiyama orientation relationships with adjacent, similarly oriented {0001} HCP grains. Notably, this transformation process occurs without the need for variant selection among the FCC orientations. These twin-related FCC variants subsequently impose strong crystallographic constraints on the nucleation of HCP grains during the cooling-induced FCC→HCP transformation. As a result, they facilitate the regeneration of both the original {0001} texture. Upon reheating, HCP transforms into twin-related FCC grains, and these new FCC grains do not necessarily form in the exact same spatial locations as in previous cycles, as evidenced in Figure 2c,g. This suggests that the twin-related FCC grains nucleate somewhat randomly from the boundaries of the original HCP grains. Clarifying the precise nucleation mechanism will require further investigation at the atomic scale. Nevertheless, once formed, these twin-related FCC grains continue to restrict the formation and crystallographic orientations of the resulting HCP grains in subsequent transformations. This self-reinforcing cycle of crystallographic constraints effectively maintains texture stability over multiple thermal cycles.

4.3. Reconstruction Based on EBSD Scans

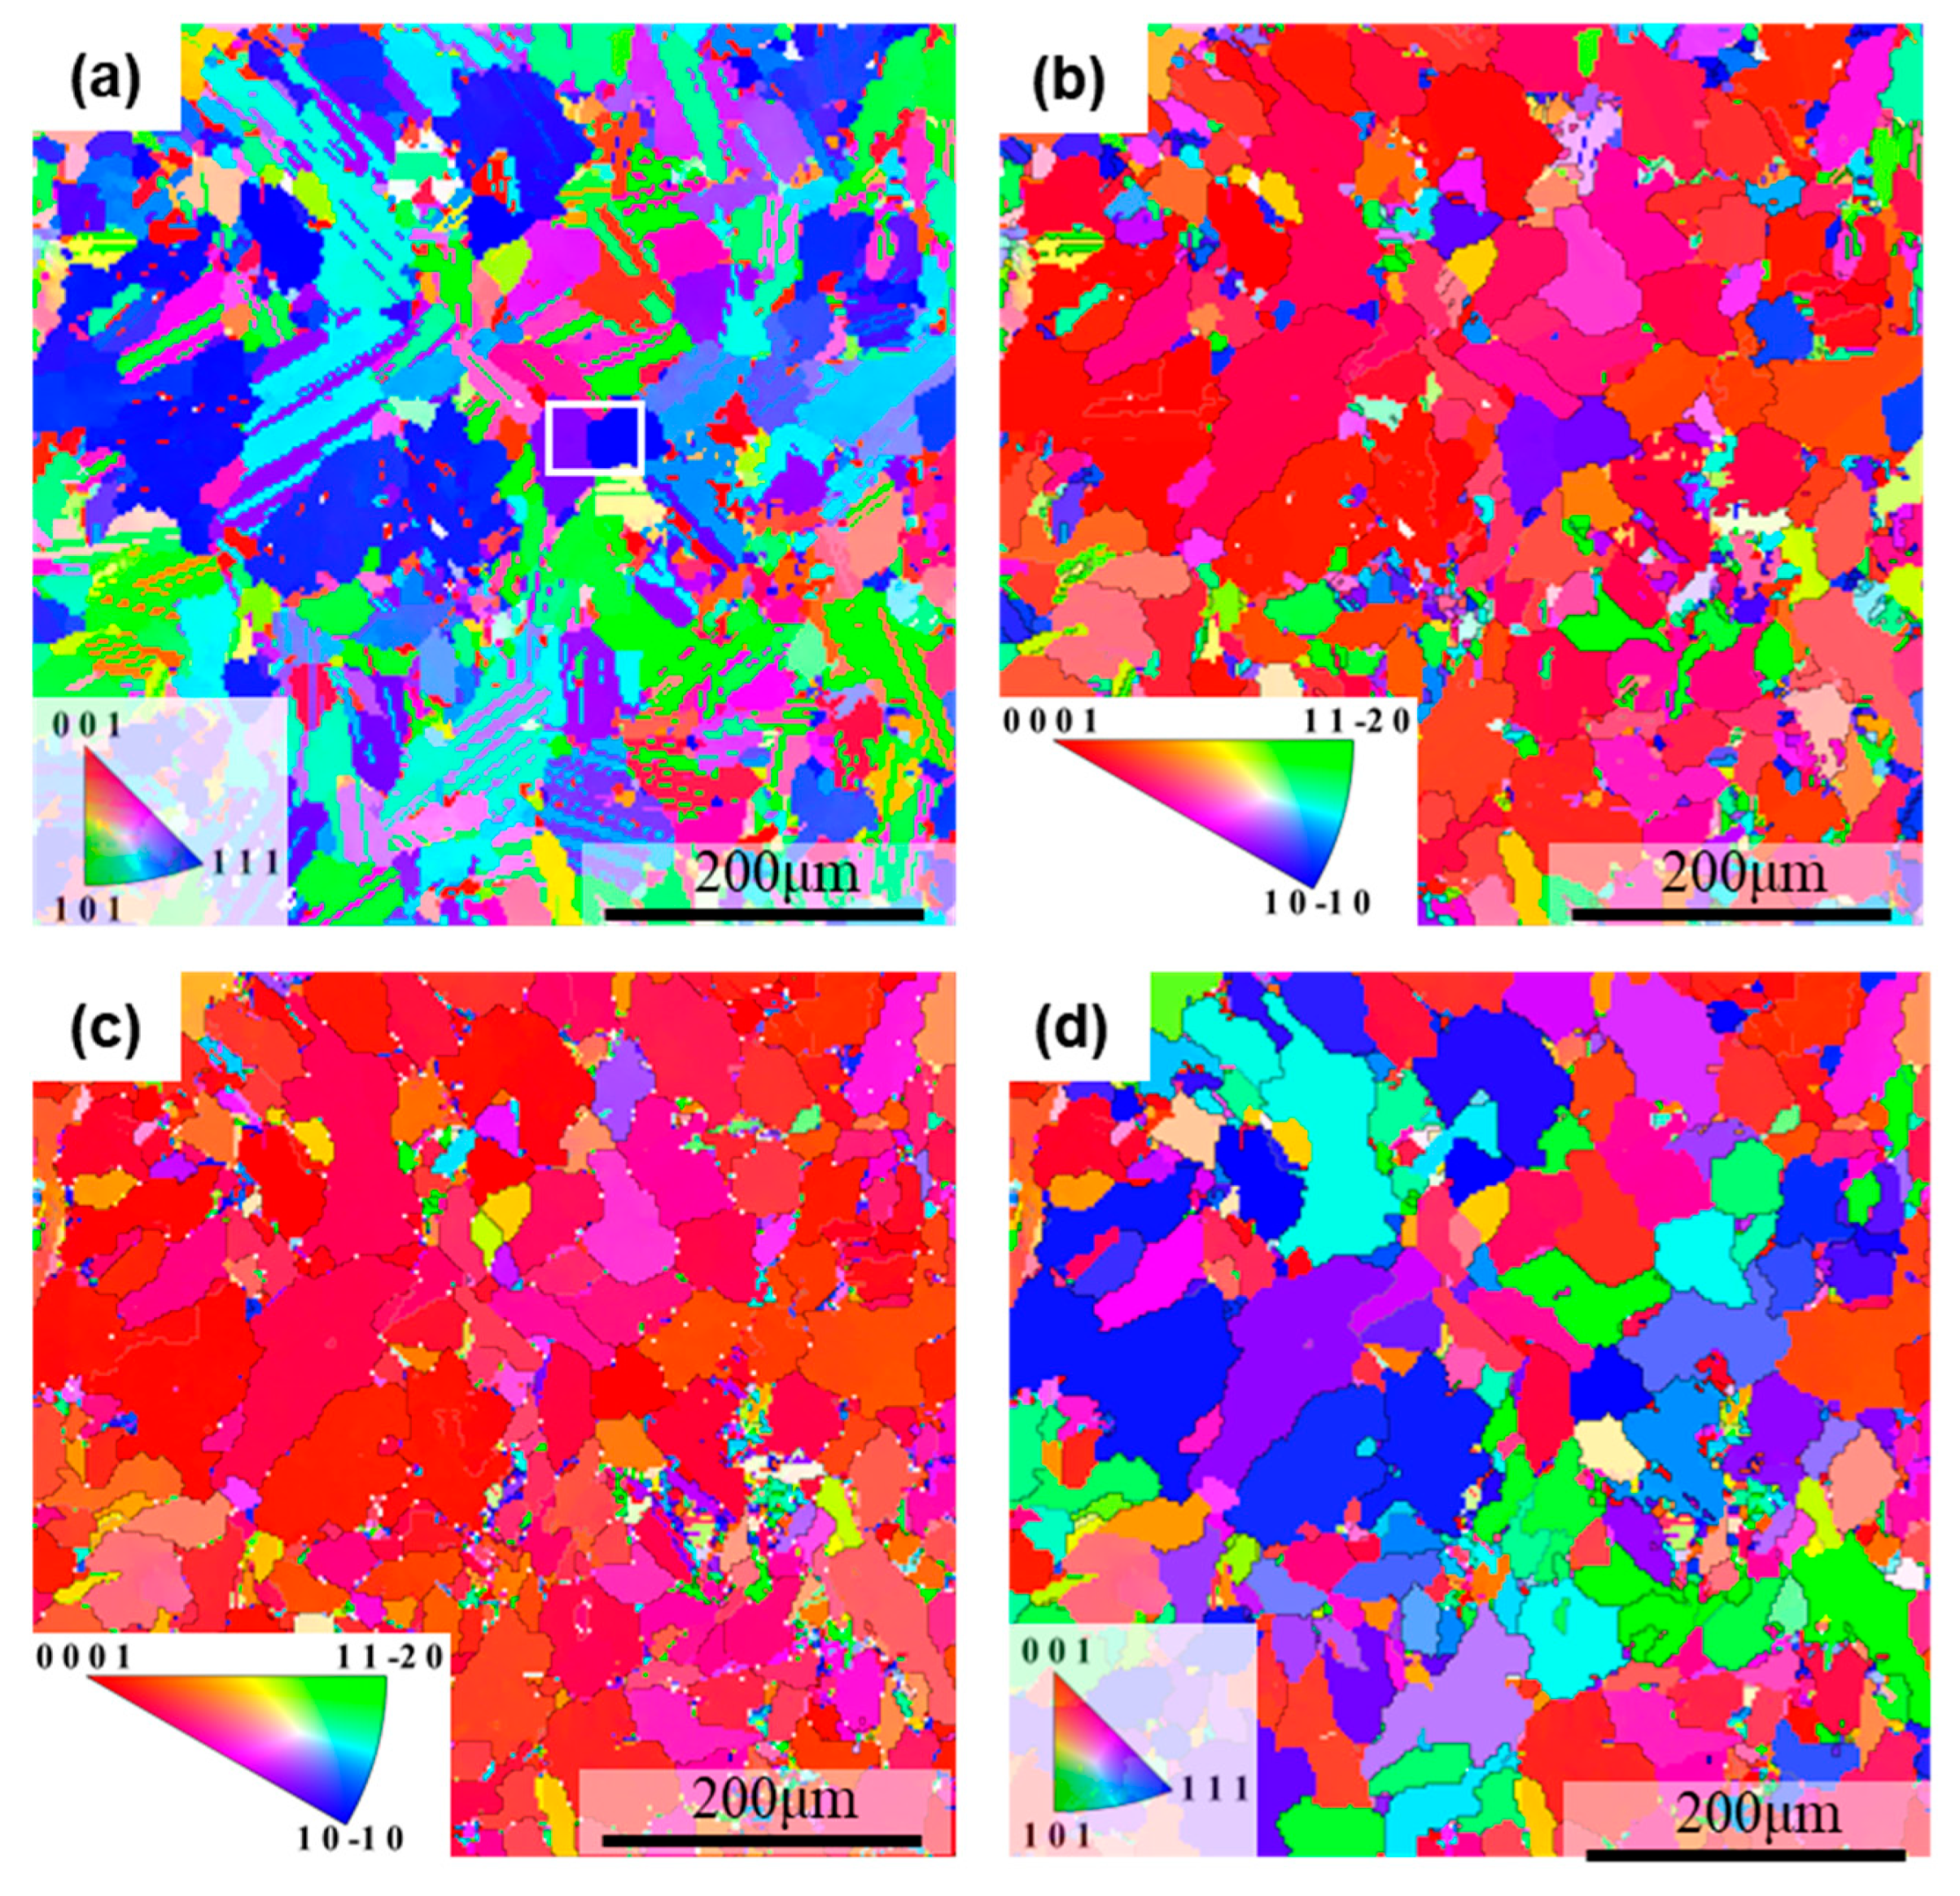
The constraint of variants for phase transformation is similar to the reconstruction of the parent orientation based on the variants of the transformation products [21,22,23,24]. One may consider adopting this method to reproduce the transformation orientations if prior orientations are known. Figure 9 presents the reconstructed results as verification. Based on the FCC orientations in Figure 9a and the Shoji–Nishiyama orientation relationship, the reconstructed HCP orientation results are shown in Figure 9b, which closely resemble the in situ EBSD results in Figure 9c. Indeed, most orientations have been reproduced, except in regions with fewer FCC variants, such as twin pairs within the grains (indicated by a rectangle in Figure 9a). The reconstruction method cannot fully restore the prior orientations, as more variants are required for reliable reconstruction. Furthermore, using the HCP orientations in Figure 9c and the Shoji–Nishiyama orientation relationship, the FCC orientations resulting from the HCP→FCC transformation were also reconstructed, as shown in Figure 9d. The orientations in Figure 9d are similar to those in Figure 9a, except that the FCC twin orientations could not be reproduced. As in the reconstruction method, nucleation of only one variant and its growth will occur, predicting a single FCC orientation rather than a twin FCC structure. Therefore, the reconstruction method in its present state cannot be applied to study the texture memory effect without careful consideration. A recent study has also demonstrated this phenomenon and highlighted the value of the in situ EBSD method in providing essential information [35].

4.4. Modification of Texture Memory

In this work, texture memory is observed during multiple cyclic heat treatments. Slight grain growth occurs during the cyclic treatment. If the grain size changes excessively, for instance, due to abnormal growth [36], the resulting HCP orientation depends on the abnormal grains, which is usually different from the initial texture. This means that if the initial microstructure before transformation is altered, the final texture memory will not be preserved. Potential methods for deliberately modifying the initial state include introducing deformation into the initial HCP or FCC phases at high temperature, or promoting abnormal grain growth in FCC grains, among others. Such interventions would influence both the nucleation of transformation variants and the process of variant selection, thereby inducing corresponding alterations in the crystallographic orientations of the resulting transformation products.

5. Conclusions

The in situ EBSD technique was employed to investigate the crystallography of phase transformation during cyclic heat treatment around the phase transformation temperature in high-purity cobalt. The experimental observations of crystallographic features were compared with theoretical predictions. The texture memory effect was observed over multiple phase transformation cycles, with the orientation relationship between HCP and FCC phases consistently following the classical Shoji–Nishiyama relation. Therefore, the reproducible orientation relationship is the key to the texture memory effect. Although numerous orientation variants could theoretically be generated under the assumption of equiprobable variant formation, variant selection was also identified to play an important role in the texture memory effect. Furthermore, the reconstruction of the parent phase based on product orientations revealed constraints among multiple variants; only partial reproduction of the in situ experimental results was achieved, indicating limitations in the reconstruction method for reproducing the microstructure.

Author Contributions

Conceptualization, X.G.; Methodology, G.X., Q.Q., Z.S. and X.G.; Formal analysis, Y.H., J.H., Z.Z., G.X. and X.G.; Investigation, Y.H.; Resources, Z.Z., G.X., Q.Q., J.L. and Z.S.; Data curation, Y.H.; Writing—original draft, Y.H. and X.G.; Writing—review and editing, J.H., J.L., Z.S. and X.G.; Supervision, J.H., J.L. and X.G.; Project administration, Q.Q. All authors have read and agreed to the published version of the manuscript.

Funding

This research was funded by National Key R&D Program of China (No. 2022YFB3504403).

Data Availability Statement

The raw data supporting the conclusions of this article will be made available by the authors on request.

Conflicts of Interest

Y.H., J.H., Z.Z., G.X., Q.Q., J.L., Z.S. were employed by China GRINM Group Co., Ltd. and GRIKIN Advanced Materials Co., Ltd. The remaining author declares that the research was conducted in the absence of any commercial or financial relationships that could be construed as a potential conflict of interest.

References

  1. Sato, J.; Omori, T.; Oikawa, K.; Ohnuma, I.; Kainuma, R.; Ishida, K. Cobalt-base high-temperature alloys. Science 2006, 312, 90–91. [Google Scholar] [CrossRef]
  2. Wu, C.; Han, J.-H.; Shi, X.; Koli, D.R.; Penigalapati, D. Cobalt CMP development for 7nm logic device. ECS Trans. 2017, 77, 93. [Google Scholar] [CrossRef]
  3. Dutta, S.; Beyne, S.; Gupta, A.; Kundu, S.; Van Elshocht, S.; Bender, H.; Jamieson, G.; Vandervorst, W.; Bömmels, J.; Wilson, C.J. Sub-100 nm2 cobalt interconnects. IEEE Electron Device Lett. 2018, 39, 731–734. [Google Scholar] [CrossRef]
  4. Dee, K.C.; Puleo, D.A.; Bizios, R. An Introduction to Tissue-Biomaterial Interactions; John Wiley & Sons: Hoboken, NJ, USA, 2003. [Google Scholar]
  5. Ye, X.; Xiang, C.; Nie, H.; Lei, H.; Du, Y.; Xing, W.; Luo, J.; Yu, Z. Facet-dependent interfacial segregation behavior of V-doped WC-Co cemented carbides. Ceram. Int. 2022, 48, 11251–11256. [Google Scholar] [CrossRef]
  6. Christian, J.W. A theory of the transformation in pure cobalt. Proceedings of the Royal Society of London. Ser. A. Math. Phys. Sci. 1951, 206, 51–64. [Google Scholar] [CrossRef]
  7. He, J.-J.; Xu, G.-J.; Wang, X.-Q.; Luo, J.-F.; Liu, D.; Li, Y.-J.; Gu, X.-F. Origin of misorientations for fcc→hcp transformation in pure cobalt and its in-situ validation. Trans. Nonferrous Met. Soc. China 2025, 35, 1532–1542. [Google Scholar] [CrossRef]
  8. Nishiyama, Z. Martensitic Transformation; Elsevier: Amsterdam, The Netherlands, 1978. [Google Scholar]
  9. Liu, W.; An, X.; Jiang, W.; Ni, S.; Song, M. Microstructural evolution of a polycrystalline cobalt during tensile deformation. Mater. Sci. Eng. A 2021, 826, 141970. [Google Scholar] [CrossRef]
  10. Zhu, E.; Zhang, J.; Guo, S.; Yang, X.; Zhang, X.; Yang, J. Effect of Co on morphology and preparation of in situ synthesis of WC-Co composite powders. Mater. Res. Express 2019, 6, 086522. [Google Scholar] [CrossRef]
  11. Kestens, L.A.I.; Pirgazi, H. Texture formation in metal alloys with cubic crystal structures. Mater. Sci. Technol. 2016, 32, 1303–1315. [Google Scholar] [CrossRef]
  12. Kestens, L.; Jonas, J.J. Transformation and Recrystallization Textures Associated with Steel Processing. Metalwork. Bulk Form. 2005, 14A, 685–700. [Google Scholar] [CrossRef]
  13. Huang, Y.; Gu, X.; He, J.; Luo, J.; Zhu, Z.; Xu, G. Revealing the Impact of Initial Textures on Orientation Memory Effect During HCP → FCC → HCP Transformation in High-Purity Cobalt. JOM 2025, 77, 2836–2843. [Google Scholar] [CrossRef]
  14. Furuhara, T.; Maki, T. Variant selection in heterogeneous nucleation on defects in diffusional phase transformation and precipitation. Mater. Sci. Eng. A 2001, 312, 145–154. [Google Scholar] [CrossRef]
  15. Cayron, C. The transformation matrices (distortion, orientation, correspondence), their continuous forms and their variants. Acta Crystallogr. A 2019, 75, 411–437. [Google Scholar] [CrossRef]
  16. Wei, Z.; Yang, P.; Gu, X.; Onuki, Y.; Sato, S. Transformation textures in pure titanium: Texture memory vs surface effect. Mater. Charact. 2020, 164, 110359. [Google Scholar] [CrossRef]
  17. Tomida, T.; Wakita, M.; Yasuyama, M.; Sugaya, S.; Tomota, Y.; Vogel, S.C. Memory effects of transformation textures in steel and its prediction by the double Kurdjumov–Sachs relation. Acta Mater. 2013, 61, 2828–2839. [Google Scholar] [CrossRef]
  18. Seward, G.G.E.; Celotto, S.; Prior, D.J.; Wheeler, J.; Pond, R.C. In situ SEM-EBSD observations of the hcp to bcc phase transformation in commercially pure titanium. Acta Mater. 2004, 52, 821–832. [Google Scholar] [CrossRef]
  19. Daymond, M.R.; Holt, R.A.; Cai, S.; Mosbrucker, P.; Vogel, S.C. Texture inheritance and variant selection through an hcp–bcc–hcp phase transformation. Acta Mater. 2010, 58, 4053–4066. [Google Scholar] [CrossRef]
  20. Lonardelli, I.; Gey, N.; Wenk, H.R.; Humbert, M.; Vogel, S.C.; Lutterotti, L. In situ observation of texture evolution during α → β and β → α phase transformations in titanium alloys investigated by neutron diffraction. Acta Mater. 2007, 55, 5718–5727. [Google Scholar] [CrossRef]
  21. Gey, N.; Humbert, M. Characterization of the variant selection occurring during the α→β→α phase transformations of a cold rolled titanium sheet. Acta Mater. 2002, 50, 277–287. [Google Scholar] [CrossRef]
  22. Miyamoto, G.; Iwata, N.; Takayama, N.; Furuhara, T. Mapping the parent austenite orientation reconstructed from the orientation of martensite by EBSD and its application to ausformed martensite. Acta Mater. 2010, 58, 6393–6403. [Google Scholar] [CrossRef]
  23. Cayron, C. ARPGE: A computer program to automatically reconstruct the parent grains from electron backscatter diffraction data. J. Appl. Crystallogr. 2007, 40, 1183–1188. [Google Scholar] [CrossRef]
  24. Huang, C.-Y.; Ni, H.-C.; Yen, H.-W. New protocol for orientation reconstruction from martensite to austenite in steels. Materialia 2020, 9, 100554. [Google Scholar] [CrossRef]
  25. Jourdan, C.; Gastaldi, J.; Grange, G. In situ study of the titanium phase transformation. Phase Transit. 1991, 31, 137–143. [Google Scholar] [CrossRef]
  26. Ball, J.A.D.; Davis, C.; Slater, C.; Vashishtha, H.; Said, M.; Hébrard, L.; Steinhilber, F.; Wright, J.P.; Connolley, T.; Michalik, S.; et al. Grain-level effects on in-situ deformation-induced phase transformations in a complex-phase steel using 3DXRD and EBSD. Acta Mater. 2024, 265, 119608. [Google Scholar] [CrossRef]
  27. Guo, J.; Li, M.; Yao, Y.; Jiang, R.; Wang, Z.; Piao, Z.; Li, Y.; Ke, P. In-situ high-temperature scanning electron microscopy study of phase transformation and variant selection phenomena in TC21 titanium alloy. J. Alloys Compd. 2025, 1026, 180386. [Google Scholar] [CrossRef]
  28. Bondarev, A.; Sreenivasa Rao, P.; Isavand, S.; O’Dowd, N. Revealing the reverse austenite and martensite transformation pathways in P91 steel through in situ MEMS-heating EBSD investigations. Mater. Today Commun. 2025, 43, 111753. [Google Scholar] [CrossRef]
  29. Zhang, J.-Y.; Zhang, Y.-S.; Mompiou, F.; Zhang, W.-Z. Structures and migrations of interfaces between β precipitates and α′ matrix in a Ti-2.6 wt% Mo alloy. Acta Mater. 2024, 281, 120429. [Google Scholar] [CrossRef]
  30. Zhou, X.; Kumar, S.; Zhang, S.; Chen, X.; Gault, B.; Dehm, G.; Hickel, T.; Raabe, D. Boron triggers grain boundary structural transformation in steel. Nat. Commun. 2025, 16, 6927. [Google Scholar] [CrossRef] [PubMed]
  31. Gu, X.-F.; Furuhara, T.; Zhang, W.-Z. PTCLab: Free and open-source software for calculating phase transformation crystallography. J. Appl. Crystallogr. 2016, 49, 1099–1106. [Google Scholar] [CrossRef]
  32. Christian, J.W. The Theory of Transformation in Metals and Alloys; Pergamon Press: Oxford, UK, 2002. [Google Scholar]
  33. Farabi, E.; Haghdadi, N.; Czettl, C.; Pachlhofer, J.; Rohrer, G.S.; Ringer, S.P.; Primig, S. On the fcc to hcp transformation in a Co-Ru alloy: Variant selection and intervariant boundary character. Scr. Mater. 2024, 248, 116127. [Google Scholar] [CrossRef]
  34. Aroyo, M.I. International Tables for Crystallography, Volume A: Space-Group Symmetry, 6th ed.; Springer: Dordrecht, The Netherlands, 2017. [Google Scholar]
  35. Fekih, M.; Ostormujof, T.M.; Germain, L.; Piette, M.; Sornin, D.; Gey, N. High temperature EBSD experiment versus crystallographic reconstruction to study phase transformation induced microstructures—Application examples for steels. Mater. Charact. 2025, 228, 115427. [Google Scholar] [CrossRef]
  36. Huang, Y.; He, J.; Gu, X.; Xu, G.; Qi, Q.; Luo, J. In situ EBSD study on the abnormal grain growth phenomenon in high-purity cobalt. J. Mater. Sci. 2024, 59, 18698–18711. [Google Scholar] [CrossRef]
Figure 1. Temperature–time profile for the in situ EBSD heat treatment cycles. The numbered markers represent EBSD observation points. Points #1, #4, and #10 were measured near room temperature, which is well below the transformation temperature of pure Co, while the remaining points were measured above it.
Metals 15 00947 g001
Figure 2. Orientation mapping and phase mapping for the in situ EBSD test, (a,b) room temperature at 1st point, (c,d) 493 °C at 3rd point, (e,f) 84 °C at 4th point, (g,h) 467 °C at 5th point, (i,j) 91 °C at 10th point in Figure 1. (a,c,e,g,i) orientation mapping; the insert is the pole figure for {0001} in hcp (a,e,i) and {111} in fcc (c,g); (b,d,f,h) corresponding phase mapping (green: HCP; red: FCC) for orientation mapping in the left column.
Metals 15 00947 g002
Figure 3. Orientations and pole figures for (a,b) HCP and (c,d) FCC grain selected from Figure 2a,c, respectively. The microstructures in (a,c) are color-coded according to the corresponding inverse pole figures (IPFs) inserted alongside them.
Metals 15 00947 g003
Figure 4. A schematic diagram of two distinct FCC crystallographic variants formed from a single parent HCP grain via phase transformation following the Shoji–Nishiyama orientation relationship. The parallel {0001}//{111} planes are shown in the figure, in addition to the orthogonal coordinate system for further calculation.
Metals 15 00947 g004
Figure 5. Schematic diagram of four HCP variants from an HCP crystal according to the Shoji–Nishiyama orientation relationship; the generator is the four-fold symmetry around <001> in the FCC structure.
Metals 15 00947 g005
Figure 6. The pole figures of orientation variants after HCP->FCC->HCP->FCC->HCP transformation cycles: (a) {0001} pole figure for initial cube orientation of HCP and the poles shown in blue color, (b) {111} pole figure of FCC variants after HCP -> FCC and the poles shown in red color, (c) {0001} pole figure of hcp variants after FCC->HCP from (b), (d) {111} pole figure of FCC variants after HCP -> FCC from (c), (e) {0001} pole figure of hcp variants after FCC->HCP from (d).
Metals 15 00947 g006
Figure 7. The pole figures of orientation variants after FCC->HCP->FCC->HCP->FCC transformation cycle: (a) {111} pole figure for initial cube orientation of FCC and the poles shown in red color, (b) {0001} pole figure of HCP variants after FCC->HCP and the poles shown in blue color, (c) {111} pole figure of FCC variants after HCP -> FCC from (b), (d) {0001} pole figure of 5 variants after FCC->HCP from (c), (e) {111} pole figure of FCC variants after HCP->FCC from (d).
Metals 15 00947 g007
Figure 8. Schematic diagram of the orientations and microstructure evolution during the cyclic phase transformations. Initial HCP grains with {0001} orientation are shown in red and those transformed to {111}-oriented FCC grains are in blue with twins shown in orange inside the grains.
Metals 15 00947 g008
Figure 9. Original orientation and reconstructed orientation based on the EBSD scan. (a) Orientation mapping in Figure 2c, (b) reconstructed HCP grain orientation based on Shoji–Nishiyama relationship from FCC->HCP, (c) orientation heated up from (a), (d) reconstructed FCC grain orientation based on Shoji–Nishiyama relationship from HCP->FCC. The EBSD mappings are color-coded according to the corresponding inverse pole figures (IPFs) inserted alongside them.
Metals 15 00947 g009
Table 1. Two crystallographic variants of the Shoji–Nishiyama orientation relationship [8] due to HCP symmetries.
No.Close-Packed PlanesClose-Packed DirectionsSymmetry Operations in HCP
F1(0001)h//(111)f[2-1-10]h//[−101]f 1 0 0 0 1 0 0 0 1
F2(0001)h//(-1-1-1)f[2-1-10]h//[−101]f 1 0 0 0 1 0 0 0 1
Table 2. Four crystallographic variants of the Shoji–Nishiyama orientation relationship [8] due to FCC symmetries.
No.Close-Packed PlanesClose-Packed DirectionsSymmetry Operations in FCC
H1(111)f//(0001)h[−101]f//[2-1-10]h 1 0 0 0 1 0 0 0 1
H2(−111)f//(0001)h[101]f//[2-1-10]h 0 1 0 1 0 0 0 0 1
H3(1-11)f//(0001)h[011]f//[2-1-10]h 1 0 0 0 1 0 0 0 1
H4(11-1)f//(0001)h[−110]f//[2-1-10]h 0 1 0 1 0 0 0 0 1
Disclaimer/Publisher’s Note: The statements, opinions and data contained in all publications are solely those of the individual author(s) and contributor(s) and not of MDPI and/or the editor(s). MDPI and/or the editor(s) disclaim responsibility for any injury to people or property resulting from any ideas, methods, instructions or products referred to in the content.