Abstract
To capture the complex metallic spatter and melt pool behavior during the rapid interaction between the laser and metal material, high-speed cameras are applied to record the laser powder bed fusion process and generate a large volume of image data. In this study, four deep learning algorithms are applied: YOLOv5, Fast R-CNN, RetinaNet, and EfficientDet. They are trained by the recorded videos to learn and extract information on spatter and melt pool behavior during the laser powder bed fusion process. The well-trained models achieved high accuracy and low loss, demonstrating strong capability in accurately detecting and tracking spatter and melt pool dynamics. A stability index is proposed and calculated based on the melt pool length change rate. Greater index value reflects a more stable melt pool. We found that more spatters were detected for the unstable melt pool, while fewer spatters were found for the stable melt pool. The spatter’s size can affect its initial ejection speed, and large spatters are ejected slowly while small spatters are ejected rapidly. In addition, more than 58% of detected spatters have their initial ejection angle in the range of 60–120. These findings provide a better understanding of spatter and melt pool dynamics and behavior, uncover the influence of melt pool stability on spatter formation, and demonstrate the correlation between the spatter size and its initial ejection speed. This work will contribute to the extraction of important information from high-speed recorded videos for additive manufacturing to reduce waste, lower cost, enhance part quality, and increase process reliability.
1. Introduction
Additive Manufacturing (AM) has revolutionized the production of complex geometries and customized parts across various industries, including aerospace, biomedical, and automotive [1,2]. Among the diverse AM techniques, Laser Powder Bed Fusion (LPBF) stands out due to its ability to produce high-density components with intricate designs from a wide range of metallic materials [3]. In LPBF, a high-power laser selectively melts successive layers of metallic powder according to a 3D model, building the part layer by layer [1]. Despite its widespread adoption and significant advantages, the LPBF process is inherently complex and susceptible to various defects that can compromise the mechanical properties and structural integrity of the final part. These defects, such as porosity, lack of fusion, and keyholing, are often directly linked to instabilities in the melt pool dynamics and the generation of spatters during the laser–material interaction [4,5].
The melt pool, a transient melt region formed by the laser’s interaction with the powder bed, is a critical indicator of process stability and part quality. Its geometry and stability directly influence the solidification microstructure and the mechanical properties [2,3]. Similarly, spatters, which are melted or partially melted particles ejected from the melt pool, represent material loss and can lead to defects like surface roughness, entrapped defects, and even cause damage to optical components [6,7,8,9,10]. Two primary driving forces [6,7,8,11], surface tension force and vapor recoil force, and their effect on spatter formation and behavior are discussed in our previous work [12]. Understanding and controlling the behavior of both the melt pool and spatters is essential for achieving consistent part quality and advancing the LPBF process to its full potential. Multiple techniques have been applied to capture and record the melt pool and spatter behavior during LPBF processes, such as high-speed cameras [13,14,15], X-ray imaging [16,17], pyrometers [18], thermography [18,19], and photodiodes [20,21]. These methods provide valuable insights with a large volume of recorded data. Traditional data analysis methods based on human visual detection, scientists’ experiences, and easy image analysis tools [22] are limited in processing such a large volume of monitored data involving the dynamic nature of the melt pool and spatter phenomena. Therefore, highly accurate and computationally efficient analytical methods are needed to extract meaningful information from the acquired data.
Machine learning (ML) and deep learning (DL) have shown their advantages in data-driven analysis, offering powerful capabilities for pattern recognition, prediction, and real-time decision-making, and have demonstrated remarkable success in diverse fields, including medical imaging, autonomous driving, and industrial inspection [23,24,25,26,27]. Significant effort has been made to apply ML and DL methods to analyze LPBF-monitored data and investigate melt pool morphology [28], deposited track width and height [29], tensile strength [30], local porosity [31,32], track quality (balling, lack of fusion, conduction, and keyhole mode) [33,34,35], surface roughness [36], and quality assurance [37,38]. In addition, DL algorithms have shown great advantages in spatter and melt pool analysis using high-speed cameras. For example, two CNNs (convolutional neural networks) are employed to segment and track the spatter amount and ejection angle [7,13,39,40]. It was found that the spatter generation and ejection angle are different between the keyhole and conduction modes [13]. The proposed neural network-based image segmentation method in the literature [39] can extract about 80% of spatters. In addition, image labelling YOLOv4 algorithms are applied to detect spatter characteristics, including number, size, speed, ejection angle, and landing area [41]. After spatter detection, Deep SORT has been applied to track the motion of spatters, such as spatter velocity [42]. Not only for spatters, but the information of the melt pool can also be extracted from the recorded videos using ML and DL methods. For example, a BoW (Bag of Words) ML technique is applied to extract the features from the recorded videos and classify the detected melt pool into different categories, including desirable, under-melting, keyhole porosity, severe keyholing, and balling [28]. A CNN-based image analysis method was employed to detect the melt pool position and scanning directions [43], melt pool geometry [44], and melt pool cross-section morphology [45]. The temperature distribution, temperature gradient, and cooling rate are measured by a coaxial melt pool measurement system and analyzed by genetic algorithms and neural network algorithms [46]. Although the above-mentioned work has applied ML and DL methods to extract the characteristics of spatters and melt pools separately, very little work combines spatter and melt pool behavior analysis using high-speed camera recorded videos and DL methods. More importantly, the influence of melt pool stability on spatter behavior, as captured in high-speed recorded videos, remains insufficiently understood.
This study aims to apply four advanced DL techniques to analyze melt pool and spatter behavior using high-speed recorded videos. In addition, the stability of the melt pool is evaluated, and its influence on the spatter’s behavior is also investigated. These four DL algorithms show great performance and high accuracy in spatter and melt pool detection and tracking. The findings of this study provide a framework for researchers to apply four DL algorithms to analyze high-speed video data, enabling the detection and tracking of spatter and melt pool behaviors, and elucidating the impact of melt pool stability on spatter formation during the LPBF process. Moreover, the insights gained from this research will contribute to the intelligent monitoring and control strategies for LPBF, ultimately leading to enhanced part quality, reduced waste, and increased process reliability.
2. Materials and Methods
2.1. Laser Powder Bed Fusion Experimental Setup with High-Speed Camera
In this study, the LPBF experiments are performed using an EOS M290 system equipped with a high-speed optical camera (Photron FASTCAM NOVA S12, Photron USA, Inc., San Diego, CA, USA). The setup employs an Ytterbium fiber laser with a maximum power of 500 W and a wavelength of 1060 , operating in an argon (Ar) atmosphere at room temperature. The laser beam is focused to a diameter of 80 on the powder bed. An ultra-high-strength martensitic steel powder (AF9629) with a particle size range of 6–90 and a median diameter (D50) of 28.2 is used for the experiments [45,46]. A high-speed camera is positioned at a 45° angle relative to the horizontal plane of the object. The high-speed imaging system, integrating a pulsed high-power diode laser light source (CAVILUX, CAVITAR LTD, Tampere, Finland) with a lens system, enables the visualization of metallic spatter dynamics and melt pool geometry during the LPBF process. The high-speed camera is set at 30,000 frames per second (fps), with a time step of 0.033 , 2.5 times optical zoom, an exposure time of 0.66 , providing a view of 896 × 496 pixels. Within the camera’s focal region, the spatial resolution is 1.9 per pixel [12]. According to our previous work on the process maps tested by experiments and simulation [47,48], in the optimized region where no defects are found, we select two process conditions and investigate the spatter behavior and melt pool stability. The selected two LPBF process conditions are in Table 1.

Table 1.
LPBF experimental test process parameters for video recording.
2.2. Deep Learning Algorithms for Image Analysis
2.2.1. Dataset Preparation and Labelling
The recorded videos during the LPBF experimental tests are analyzed for spatter and melt pool behavior. The recorded images are separated into training (70%) and testing (30%) datasets, shown in Table 2. A combined 3569 images are used to train each DL algorithm. The well-trained algorithms are tested by testing datasets of 777 and 752 images for Tests 1 and 2, separately.

Table 2.
Image data separation for four deep learning algorithm training and testing.
To label the image data, a home-based Python 3.12 script is generated to label the recorded images by identifying the regions for spatters and the melt pool. Depending on the recorded images in this work, the noise signal is reduced by filtering out contours with areas under 50 pixels or aspect ratios above 3.0. There may still be some noise signals remaining in the images that cannot be totally filtered out. Based on the grayscale values for each pixel, a threshold value is applied to identify the bright regions for spatters and melt pools, and then OpenCV’s cv2.findContours function is applied to extract external contours. The largest valid contour in each image is labeled as the melt pool, with remaining contours identified as spatters. Bounding boxes are generated using cv2.boundingRect. In addition, COCO-style JSON annotations are created, including image ID, category ID, bounding box coordinates, and contour area. Annotations are compiled into the training image dataset. To improve the DL models’ robustness and generalization, data augmentation is applied to the image dataset, including resizing, horizontal flipping, random brightness adjustment, and Gaussian noise injection. The processed image dataset with annotations is converted into different formats as DL algorithms require, for example, normalized .txt files for the YOLOv5 algorithm, and COCO-style JSON files for the other three DL algorithms.
2.2.2. Four Deep Learning (DL) Algorithms for Detection
Four DL algorithms with state-of-the-art object detection architectures are applied to detect and track the melt pool and spatters using the recorded image sequences. These four algorithms are YOLOv5, Fast R-CNN, RetinaNet, and EfficientDet [23,49]. Here, we briefly explain and compare their structures, below and in Figure 1.
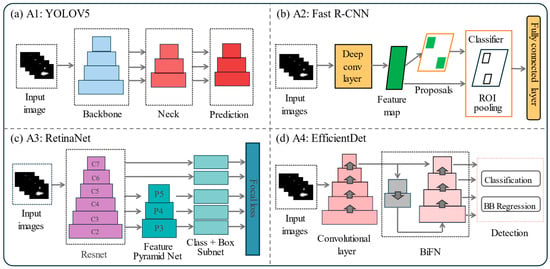
Figure 1.
Schematic illustration of the four deep learning algorithms used in this study (Adapted from Refs. [23,49]). (a) YOLOv5; (b) Fast R-CNN; (c) RetinaNet; (d) EfficientDet.
- (1)
- Algorithm 1: YOLOv5
YOLOv5 (You Only Look Once version 5) is a single-stage detection architecture. The input image is passed through a series of convolutional layers to extract features, followed by a pyramid pooling and feature concatenation. The network directly predicts bounding boxes and class scores from the full image in a single forward pass. The model is lightweight, optimized using anchor boxes and augmentation, and is ideal for real-time, high recording frequency applications due to its minimal latency.
- (2)
- Algorithm 2: Fast R-CNN
Fast R-CNN is a two-stage detector. A deep convolutional neural network extracts feature maps from the input image. Then, a region proposal network (RPN) suggests possible object regions, which are refined using region of interest (ROI) pooling. These regions are classified, and their bounding boxes are adjusted via fully connected layers. As shown in the architecture, the branching from the ROI layer into classification and regression heads introduces more precise, yet slower detection compared to single-stage detectors.
- (3)
- Algorithm 3: RetinaNet
RetinaNet enhances the performance of single-stage detectors by combining feature pyramid networks (FPNs) with a novel focal loss function. The image is processed through a backbone network that generates multi-scale features (C2 to C7). These are transformed into a pyramid (P3 to P5), which enables detection at different object scales. The architecture supports real-time inference while maintaining high precision.
- (4)
- Algorithm 4: EfficientDet
EfficientDet has a scalable and efficient architecture, using EfficientDet itself as the backbone and a bidirectional feature pyramid network (BiFN) for feature fusion. The architecture applies a good balance to network depth, width, and resolution. As shown in the diagram, features from different layers are merged via a two-way pathway and passed to detection heads. The design reduces model size and computation, making EfficientDet suitable for deployment on edge devices without compromising accuracy.
2.2.3. Spatter and Melt Pool Tracking Mechanism
To analyze the behavior of spatters and melt pool across high-speed image sequences, a robust object tracking mechanism is implemented. The goal of this stage is to assign consistent object IDs to detected spatters and track their motion, speed, and displacement across consecutive frames. The tracking system is built on top of object detection outputs generated by four deep learning algorithms. Each model outputs bounding boxes, class labels (spatter or melt pool), and confidence scores per frame. These detection results serve as inputs to the tracking algorithm. In addition, the Deep SORT algorithm is employed to track the multiple rapid moving spatters. The Deep SORT algorithm is good at multi object tracking [50,51], and it consists of four main components: a Kalman filter for motion prediction, a CNN-based appearance extractor for generating feature vectors, a data association algorithm (using motion and appearance) via the Hungarian method, and a track management system to initialize, update, and remove object tracks across frames. Every new spatter detection is assigned a unique ID when first observed. This ID remains consistent across frames as long as the object is successfully matched. If a spatter disappears or exits the frame, its ID is retired and not reassigned. The centroid (center of the bounding box) of each spatter is calculated in every frame. The Euclidean displacement between consecutive centroids is used to estimate the spatter’s motion, such as ejection speed and angle.
Compared to the rapid moving spatters, the melt pool is a comparatively large and stable area. It is tracked using a simplified approach that relies on either its bounding box or segmentation mask, which is updated frame-by-frame by identifying the maximum overlapping region or maintaining mask continuity. Important melt pool characteristics, including area, width, and centroid displacement, are measured over time for melt pool stability analysis. The steps for detection and tracking using four DL algorithms are explained by the flowchart in Figure 2.
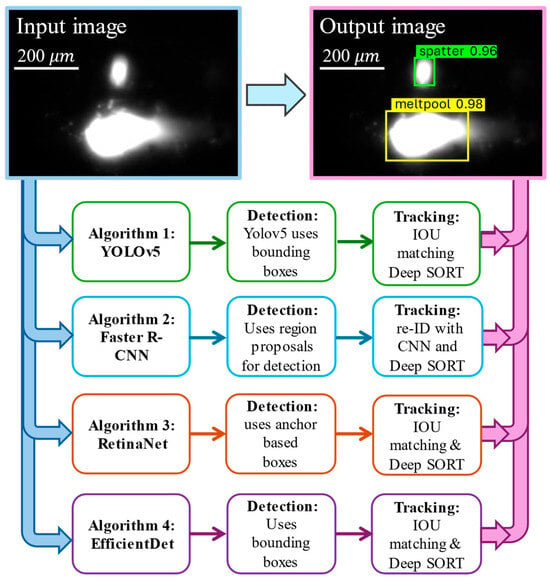
Figure 2.
Applying four deep learning algorithms for melt pool and spatter detection and tracking using the LPBF experimental recorded videos. The numbers ‘0.96’ and ‘0.98’ are the confidence scores for spatter and melt pool detection and tracking.
2.2.4. Post-Processing for Spatter and Melt Pool Information Extraction
Followed by spatter and melt pool detection and tracking, a post-processing stage is implemented to extract the information for spatters and melt pools for quantitative analysis. These include the spatter count, diameter, ejection speed, ejection angle, and melt pool length. All of these can be calculated based on the detected information for spatters and melt pool, the spatial resolution (1.9 /pixel), time step (, ), scanning direction, and other LPBF experimental conditions.
3. Results and Discussion
3.1. Deep Learning Algorithms’ Performance in Detection and Tracking
First, four DL algorithms are trained by recorded images during the LPBF experiment tests. The well-trained YOLOv5 algorithm with high accuracy and minimum loss, shown in Figure 3, can accurately detect the region and track the motion of the spatters and melt pool at different time steps. Similar training is needed for other algorithms. The training results for all four algorithms are summarized in Table 3. The training results are presented using Precision (), Recall (), mean Average Precision (mAP) at 0.5, and mAP at 0.5:0.95 as the evaluation metrics for the training image dataset, explained in Table 2. The calculations for precision () and recall () are explained in Equations (1) and (2) [52]. Precision indicates, among all the spatters and melt pools detected by the algorithms, how many of them are correct. Recall suggests, among all the actual spatters or melt pools present in the images, how many of them the model can successfully detect. The mAP at a 0.5 score shows how well the model can find spatters and melt pools and draw bounding boxes around them that match the actual objects’ boxes with at least a 50% area of overlapping. Similarly, the mAP at 0.5:0.95 score measures how accurately the model can detect and outline the spatters and melt pools with a 50–95% area of overlapping between the predicted bounding boxes and the actual ones. A higher score of mAP at 0.5 and mAP at 0.5:0.95 suggests the algorithm is good at spatter and melt pool detection and can draw bounding boxes that closely fit their true shapes and positions [52].
where True Positives () refer to cases where the model correctly identifies and localizes an actual spatter or melt pool. False Positives () occur when the model incorrectly identifies a region as a spatter or melt pool when none exists. False Negatives () represent instances where the model fails to detect a spatter or melt pool that is present in the image.
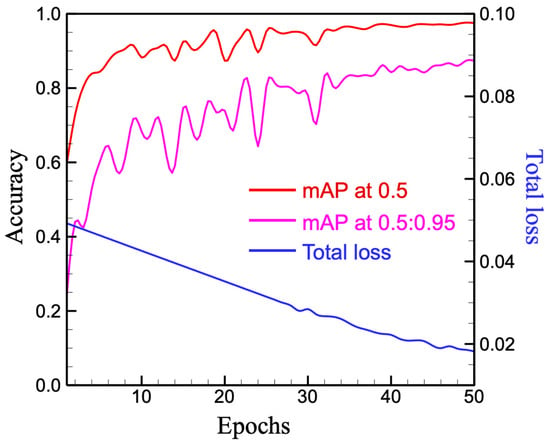
Figure 3.
Accuracy and loss for image data training using the YOLOv5 algorithm.

Table 3.
The performance of four deep learning algorithms on training and testing image data. The volume of image data for training and testing is explained in Table 2.
Only the well-trained algorithms are processed for the further testing stage. The training and testing time using four DL algorithms for the testing image dataset (Table 2) is available in Table 3. According to the performance of four algorithms in the training and testing datasets in Table 3, the YOLOv5 algorithm has the shortest training time with acceptable accuracy of , , and mAP values. On the other hand, the RetinaNet algorithm is preferred when the highest accuracy is desired, and more training time is allowed. The remaining two algorithms, Faster R-CNN and EfficientDet, are suboptimal.
3.2. Melt Pool and Spatter Tracking and Detection
These well-trained algorithms are then applied to the testing dataset to detect and track the dynamics of the spatter and melt pool over time, as exemplified by the image sequence in Figure 4. The melt pool is marked by the yellow box, while the spatters are marked by green boxes. In addition, the same spatters detected at different time steps are given the same ID number until they disappear from the image, such as the spatter shown in Figure 4b–e. Similarly, a newly detected later spatter () has a new ID number (Figure 4f). It is important to mention that, when the spatters are first detected, such as the spatter 1 at time and spatter 2 at time, their ejection speed and angle are called ‘initial ejection speed’ and ‘initial ejection angle’, respectively [53]. There may be some very small particles in the recorded images, which can be noise signals or tiny particles that are too small to be detected and are ignored in this work.
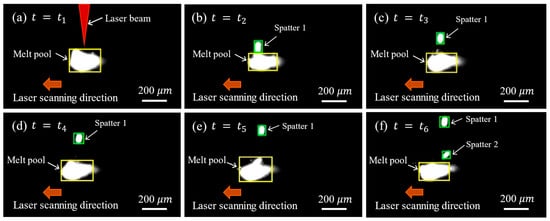
Figure 4.
The deep learning algorithm detected melt pool and spatters at different time steps. The calculated confidence score for the detected melt pool and spatter is in the range of 0.92–0.98. Subfigures (a–f) follow the time sequence of .
3.3. Spatter Formation and Amount
According to the detected spatters in Figure 4, the size and number of the detected spatters for the two LPBF tests are plotted in Figure 5 using four different DL algorithms. The spatter size is determined by the detected spatter region size and the spatial resolution. Comparing the distribution of detected spatter size and count in Figure 5, there is a small difference among the four algorithms, and this difference may be caused by the algorithms’ structure and accuracy. In general, all four algorithms show a similar distribution of spatter size and count for the two tests, and more spatters are detected in Test 1 compared to those in Test 2. In addition, most of the detected spatters have a size no larger than 50 . Only a very few spatters are detected with a size larger than 50 .
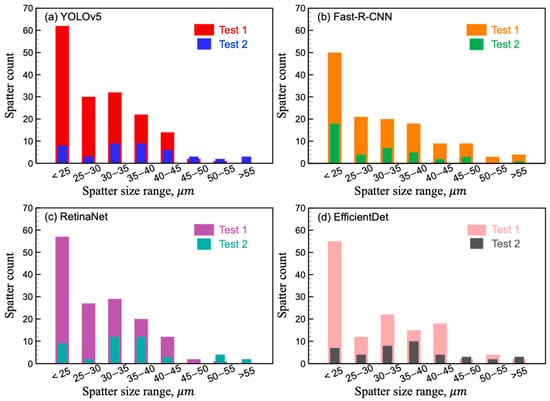
Figure 5.
Detected spatter amount and size distribution for Tests 1 and 2 using four deep learning algorithms: (a) YOLOv5; (b) Fast-R-CNN; (c) RetinaNet; and (d) EfficientDet.
3.4. Spatter Initial Ejection Angle
As mentioned before, when the spatters are first-time detected, such as spatter 1 at time and spatter 2 at time in Figure 4, the ejection angle is called the ‘initial ejection angle’. The initial ejection angle is defined depending on the scanning direction due to the LPBF experiments setting up as continuous linear scanning with two alternate scanning directions, left-to-right (L-R) and right-to-left (R-L), shown in Figure 6a and Figure 6b, respectively. The center locations of the spatters and melt pools are identified at different time steps. The direction is defined along the melt pool’s tail direction and through the pool center. The positive ejection angle is identified if the detected continuously moving spatter is above the melt pool region; otherwise, the ejection angle is negative. Therefore, the range of all possible initial ejection angles is [, ]. For example, some spatters and initial ejection angles are shown in Figure 6a,b. The detected initial ejection angles for all spatters in Tests 1 and 2 using four DL algorithms are plotted in Figure 7 and explained below.

Figure 6.
Spatter initial ejection angle definition for (a) left-to-right (L-R) direction, and (b) right-to-left (R-L) direction for the LPBF experiments.
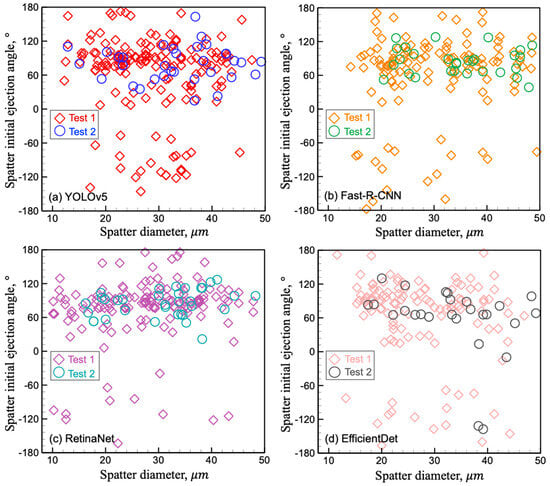
Figure 7.
Detected spatter initial ejection angle and size distribution for Tests 1 and 2 using four algorithms: (a) YOLOv5; (b) Fast-R-CNN; (c) RetinaNet; and (d) EfficientDet.
As shown in Figure 7, for Tests 1 and 2, the spatter’s initial ejection angles are widely distributed in the range of [, ] detected by four DL algorithms. Compared to Test 1, fewer spatters are detected in Test 2, which agrees well with previous results seen in Figure 5. Comparing Figure 7a–d, there are some differences between the detected initial ejection angles for Tests 1 and 2 using four different algorithms. This may be caused by the difference in the structure, detection, and tracking mechanisms of these four algorithms, as discussed in Section 2.2. In addition, for all the detected ejection angles for both tests in Figure 7a–d, there are many spatters aggregated in the initial ejection angle of [, ]. This may indicate the most likely ejection angle for spatters and the most sensitive region within the melt pool. To better understand this, we count the number of spatters which have their initial ejection angles within the range of [, ] and calculate the percentage of these spatters for the total amount of detected spatters. The results are plotted in Figure 8. In Figure 8, both Tests 1 and 2 have more than 58% of spatters with ejection angle in the range of [, ]. Compared to Test 1, Test 2 shows a much higher percentage of spatters with the initial ejection angle in the range of [, ]. This angle range [, ] indicates the high-susceptible region within the melt pool and high chance for spatter generation. For all detected spatters, their initial ejection speeds are calculated and explained below.
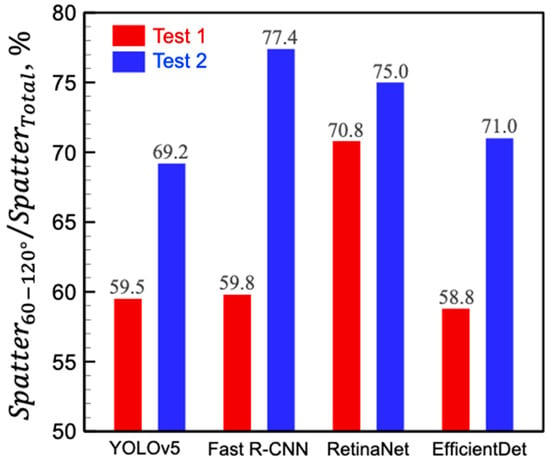
Figure 8.
The distribution of the percentage for spatters with initial ejection angle in the range of 60–120 from the total amount of detected spatters using four deep learning algorithms for Tests 1 and 2.
3.5. Spatter Initial Ejection Speed
Besides the spatters’ initial ejection angle, the initial ejection speed also matters. The spatter initial ejection speed is calculated as the ratio of the travel distance of the same spatter at two consequence images (the first-time and second-time detected images) and the time step (). The initial ejection speeds of all detected spatters are plotted with the spatter size in Figure 9 using four DL algorithms. It is important to notice that, since the spatter’s initial ejection speed depends on the positions of at least two continuous image sequences and time steps, some spatters are only detected in one image frame and rapidly move out of view, and the initial ejection speed of these types of spatter is not detectable. Therefore, the detected spatter amount in Figure 9 is slightly less than that in Figure 5. For example, in Figure 5a, the total detected spatter amount for Tests 1 and 2 using the YOLOv5 algorithm is 163 and 43, respectively. However, in Figure 9a, only 78 and 24 continuously moving spatters are detected by the YOLOv5 algorithm for Tests 1 and 2, respectively. Similarly, compared to the total detected spatter amount in Figure 5c–d, a smaller number of continuously moving spatters is detected with initial ejection speed using the other three DL algorithms for both Tests 1 and 2 (see Figure 9c,d). Comparing the distribution of spatter initial ejection speed and size, it is obvious that, for both Tests 1 and 2, the big spatters have a slow initial ejection speed while the small spatters are ejected rapidly, which agrees well with our previous results [53]. This can be explained by the two primarily driving forces, surface tension force and vapor recoil force [12]. Once the LPBF process parameters are determined, the values of these two forces can be estimated. If the vapor recoil force is greater than the surface tension force, the metal liquid near the melt pool top surface tends to be expelled out of the pool. The small spatter is ejected rapidly, while the large-sized spatter is ejected slowly; this phenomenon follows momentum conservation [54].
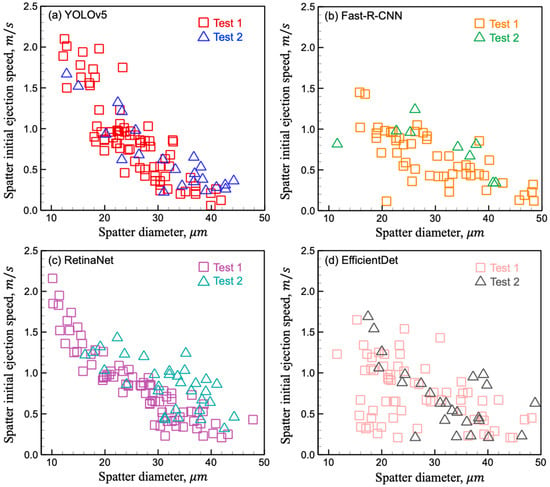
Figure 9.
Detected spatter initial ejection speed and size distribution for Tests 1 and 2 using four deep learning algorithms: (a) YOLOv5; (b) Fast-R-CNN; (c) RetinaNet; and (d) EfficientDet.
3.6. Melt Pool Geometry and Stability
The information regarding the melt pool is extracted using the four DL algorithms, using the recorded videos for Tests 1 and 2. The detected melt pool length is plotted with recording time and shown in Figure 10. The scanning direction is right-to-left (R-L) during the recording time of 0–2000 , while the opposite scanning direction is applied (left-to-right, L-R) at the recording time of 2000–4000 , as shown in Figure 10a. All four DL methods show that the detected melt pool length of Test 2 is generally greater than that of Test 1. For both Tests 1 and 2, comparing two different scanning directions, the detected melt pool length is not a constant value due to the process instability and metal liquid fluctuation. In addition, compared to the scanning direction left to right (L-R), the detected melt pool along the scanning direction right-to-left (R-L) is more stable.
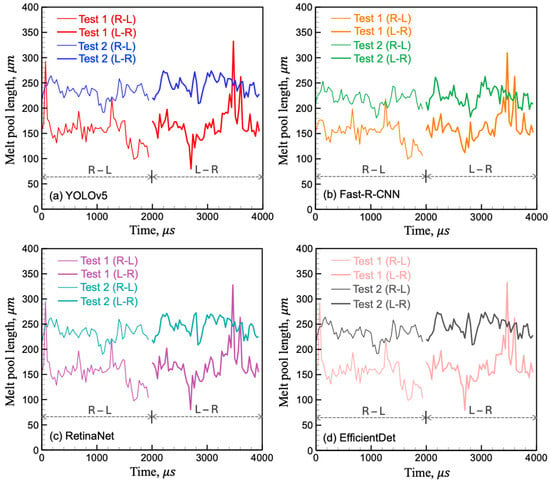
Figure 10.
Distribution of the detected melt pool length with time for Tests 1 and 2 using four deep learning algorithms: (a) YOLOv5; (b) Fast-R-CNN; (c) RetinaNet; and (d) EfficientDet.
To better compare the melt pool stability, the melt pool length change rate () is calculated (Equation (3)) and plotted in Figure 11. A high value for the calculated melt pool length change rate indicates the detected melt pool is unstable. Among the four subfigures in Figure 11, it is obvious that the melt pool length change rate for Test 1 has some high peaks with values higher than 3.0, while the plot for Test 2 is much more stable with small values. Figure 11 shows that the melt pool for Test 2 is more stable than that for Test 1:s
where ‘’ represents the melt pool length change rate at time ‘’. ‘’ and ‘’ are the detected melt pool length at time of and , respectively. The time step () is calculated based on the recording frequency, micron seconds ().
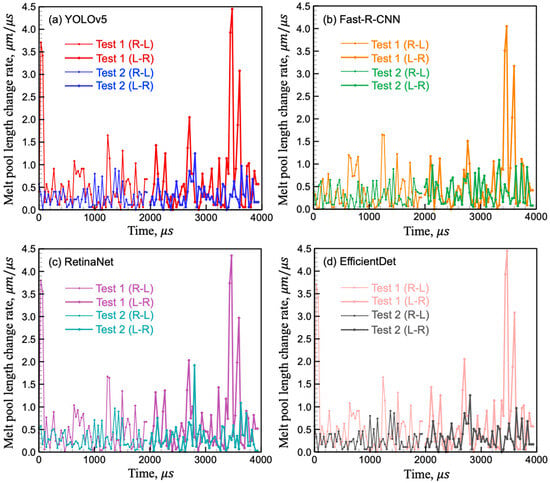
Figure 11.
Distribution of the calculated melt pool length change rate () with time for Tests 1 and 2 using four deep learning algorithms: (a) YOLOv5; (b) Fast-R-CNN; (c) RetinaNet; and (d) EfficientDet.
To provide a quantitative comparison of the melt pool stability, we propose a melt pool stability index (, see Equation (4)) using the standard deviation () of the detected melt pool length change rate for two LPBF tests [53]. Since a small value of the standard deviation of the melt pool change rate indicates a stable melt pool, a larger value of the stability index () represents a more stable melt pool:
where ‘’ and ‘’ are the detected melt pool lengths at time ‘ and the mean value of the detected melt pool change rate. ‘’ is the recorded image number. For example, since a high-speed camera is set at 30,000 fps, a total of 59 frames of images is recorded during the recording time of 0–2000 when the scanning direction is right-to-left (R-L). ‘’ represents the 59 times detected melt pool length change rate, ‘’ is the average of these 59 times calculated melt pool length change rate, and ‘’ is equal to 59. The same calculation is applied for the other scanning direction.
The calculated melt pool stability indices () for Tests 1 and 2 under different scanning directions are provided in Table 4. A higher value of ‘’ indicates a more stable melt pool. Comparing Tests 1 and 2, the values of ‘’ for Test 2 are much larger than those for Test 1, indicating that Test 2 has a more stable melt pool. Compared to Test 2, the higher linear energy input in Test 1 is more likely to generate higher temperature field with prominent vapor recoil force, resulting in more spatters and an unstable melt pool. In addition, the calculated melt pool stability index using four different DL algorithms indicate that, for both Tests 1 and 2, the melt pool with a right-to-left (R-L) scanning direction is more stable compared to that with a left-to-right scanning direction (L-R). In this work, the shielding gas blowing direction is perpendicular to the scanning directions. A possible reason is that the complex gas flow due to the rapid laser scanning, shielding gas, and pressure change near the fusion region may affect the melt pool length and stability.

Table 4.
The calculated melt pool stability index () for Tests 1 and 2, left to right (L-R) and right to left (R-L) directions, using four deep learning algorithms. A larger value of the stability index () represents a more stable melt pool.
3.7. Correlation Between Melt Pool Stability and Spatters
Based on the observed spatter behavior and melt pool dynamics, Test 2 exhibits a stable melt pool with fewer detected spatters, whereas Test 1 shows an unstable melt pool accompanied by a higher spatter count. These results suggest a clear correlation between melt pool stability and spatter formation. A stable melt pool can significantly reduce spatter formation. Unlike previous studies that primarily focus on the underlying driving forces behind spatter generation [12,22,55], this work offers a novel perspective by investigating the critical influence of melt pool stability on spatter formation and behavior.
4. Conclusions
In this work, four deep learning algorithms, YOLOv5, Fast R-CNN, RetinaNet, and EfficientDet, are applied to detect and track melt pool and spatter1 behavior using recorded videos during the laser powder bed fusion process. Spatter size, count, initial ejection angle, initial ejection speed, melt pool length and stability are investigated. The main findings are summarized below.
- (1)
- The stability of the melt pool is quantified by the stability index based on the melt pool length change rate. A stable melt pool shows a high stability index, indicating small fluctuations, whereas an unstable melt pool is characterized by a small stability index, reflecting a great variability.
- (2)
- Melt pool stability significantly affects the spatter formation. More spatters are detected for the LPBF process with unstable melt pools, whereas stable melt pools generate fewer spatters.
- (3)
- Ejected spatters exhibit a broad range of sizes, and their initial ejection velocity is strongly influenced by this variation. Large spatters tend to be ejected slowly, while small ones are expelled from the melt pool rapidly.
- (4)
- The initial ejection angle of spatters is defined within a range of −180 to 180. Our results reveal that over 58% of all detected spatters are ejected within the specific range of 60° to 120°, indicating a highly susceptible region within the melt pool and a pronounced spatter initial ejection direction.
- (5)
- Among four deep learning algorithms, YOLOv5 offers the shortest training time with acceptable accuracy, while RetinaNet provides the highest accuracy at the cost of longer training time. Faster R-CNN and EfficientDet are less optimal.
Author Contributions
Conceptualization, Y.D.; Methodology, D.G. and Y.D.; Software, D.G.; Formal analysis, D.G.; Data curation, A.E.; Writing—original draft, D.G.; Writing—review and editing, A.E. and Y.D.; Supervision, Y.D.; Funding acquisition, Y.D. All authors have read and agreed to the published version of the manuscript.
Funding
This research is supported by Dr. Yang Du’s startup funding.
Data Availability Statement
The original contributions presented in this study are included in the article. Further inquiries can be directed to the corresponding author.
Acknowledgments
Thanks to the Elwany group’s support in providing the recorded high-speed videos investigated in this work.
Conflicts of Interest
The authors declare no conflicts of interest.
References
- Mukherjee, T.; DebRoy, T. Theory and Practice of Additive Manufacturing; John Wiley & Sons: Hoboken, NJ, USA, 2023; Available online: https://www.wiley.com/en-us/Theory+and+Practice+of+Additive+Manufacturing-p-9781394202270 (accessed on 23 June 2025).
- Tan, C.; Li, R.; Su, J.; Du, D.; Du, Y.; Attard, B.; Chew, Y.; Zhang, H.; Lavernia, E.J.; Fautrelle, Y.; et al. Review on field assisted metal additive manufacturing. Int. J. Mach. Tools Manuf. 2023, 189, 104032. [Google Scholar] [CrossRef]
- DebRoy, T.; Wei, H.L.; Zuback, J.S.; Mukherjee, T.; Elmer, J.W.; Milewski, J.O.; Beese, A.M.; Wilson-Heid, A.D.; De, A.; Zhang, W. Additive manufacturing of metallic components–process, structure and properties. Prog. Mater. Sci. 2018, 92, 112–224. [Google Scholar] [CrossRef]
- Chowdhury, S.; Yadaiah, N.; Prakash, C.; Ramakrishna, S.; Dixit, S.; Gupta, L.R.; Buddhi, D. Laser powder bed fusion: A state-of-the-art review of the technology, materials, properties & defects, and numerical modelling. J. Mater. Res. Technol. 2022, 20, 2109–2172. [Google Scholar] [CrossRef]
- Grasso, M.; Colosimo, B.M. Process defects and in situ monitoring methods in metal powder bed fusion: A review. Meas. Sci. Technol. 2017, 28, 044005. [Google Scholar] [CrossRef]
- Young, Z.A.; Guo, Q.; Parab, N.D.; Zhao, C.; Qu, M.; Escano, L.I.; Fezzaa, K.; Everhart, W.; Sun, T.; Chen, L. Types of spatter and their features and formation mechanisms in laser powder bed fusion additive manufacturing process. Addit. Manuf. 2020, 36, 101438. [Google Scholar] [CrossRef]
- Li, Z.; Li, H.; Yin, J.; Li, Y.; Nie, Z.; Li, X.; You, D.; Guan, K.; Duan, W.; Cao, L.; et al. A review of spatter in laser powder bed fusion additive manufacturing: In situ detection, generation, effects, and countermeasures. Micromachines 2022, 13, 1366. [Google Scholar] [CrossRef]
- Khairallah, S.A.; Anderson, A.T.; Rubenchik, A.; King, W.E. Laser powder-bed fusion additive manufacturing: Physics of complex melt flow and formation mechanisms of pores, spatter, and denudation zones. Acta Mater. 2016, 108, 36–45. [Google Scholar] [CrossRef]
- Khairallah, S.A.; Martin, A.A.; Lee, J.R.; Guss, G.; Calta, N.P.; Hammons, J.A.; Nielsen, M.H.; Chaput, K.; Schwalbach, E.; Shah, M.N.; et al. Controlling interdependent meso-nanosecond dynamics and defect generation in metal 3D printing. Science 2020, 368, 660–665. [Google Scholar] [CrossRef]
- Patel, S.; Chen, H.; Vlasea, M.; Zou, Y. The influence of beam focus during laser powder bed fusion of a high reflectivity aluminium alloy-AlSi10Mg. Addit. Manuf. 2022, 59, 103112. [Google Scholar] [CrossRef]
- Yang, T.; Liu, T.; Liao, W.; MacDonald, E.; Wei, H.; Zhang, C.; Chen, X.; Zhang, K. Laser powder bed fusion of AlSi10Mg: Influence of energy intensities on spatter and porosity evolution, microstructure and mechanical properties. J. Alloys Compd. 2020, 849, 156300. [Google Scholar] [CrossRef]
- Du, Y.; Pestka, S.A.; Elwany, A. Control of spatter due to liquid metal expulsion in additive manufacturing. Addit. Manuf. 2025, 104, 104773. [Google Scholar] [CrossRef]
- Gobert, C.; Diewald, E.; Beuth, J.L. Spatter detection and tracking in high-speed video observations of laser powder bed fusion. Rapid Prototyp. J. 2025, 31, 393–408. [Google Scholar] [CrossRef]
- Zheng, H.; Li, H.; Lang, L.; Gong, S.; Ge, Y. Effects of scan speed on vapor plume behavior and spatter generation in laser powder bed fusion additive manufacturing. J. Manuf. Process. 2018, 36, 60–67. [Google Scholar] [CrossRef]
- Repossini, G.; Laguzza, V.; Grasso, M.; Colosimo, B.M. On the use of spatter signature for in-situ monitoring of Laser Powder Bed Fusion. Addit. Manuf. 2017, 16, 35–48. [Google Scholar] [CrossRef]
- Guo, Q.; Zhao, C.; Escano, L.I.; Young, Z.; Xiong, L.; Fezzaa, K.; Everhart, W.; Brown, B.; Sun, T.; Chen, L. Transient dynamics of powder spattering in laser powder bed fusion additive manufacturing process revealed by in-situ high-speed high-energy x-ray imaging. Acta Mater. 2018, 151, 169–180. [Google Scholar] [CrossRef]
- Liu, S.; Sun, Z.; Yan, Z.; Su, N.; Li, K.; Shi, G.; Wei, B.; Yang, G. In-situ X-ray imaging reveals the effect of spatter on single melt track at high layer thickness during laser powder bed melting. Opt. Laser Technol. 2025, 187, 112717. [Google Scholar] [CrossRef]
- Yakout, M.; Phillips, I.; Elbestawi, M.A.; Fang, Q. In-situ monitoring and detection of spatter agglomeration and delamination during laser-based powder bed fusion of Invar 36. Opt. Laser Technol. 2021, 136, 106741. [Google Scholar] [CrossRef]
- Zhang, H.; Vallabh, C.K.P.; Zhao, X. Influence of spattering on in-process layer surface roughness during laser powder bed fusion. J. Manuf. Process. 2023, 104, 289–306. [Google Scholar] [CrossRef]
- Jayasinghe, S.; Paoletti, P.; Sutcliffe, C.; Dardis, J.; Jones, N.; Green, P.L. Automatic quality assessments of laser powder bed fusion builds from photodiode sensor measurements. Prog. Addit. Manuf. 2022, 7, 143–160. [Google Scholar] [CrossRef]
- Taherkhani, K.; Sheydaeian, E.; Eischer, C.; Otto, M.; Toyserkani, E. Development of a defect-detection platform using photodiode signals collected from the melt pool of laser powder-bed fusion. Addit. Manuf. 2021, 46, 102152. [Google Scholar] [CrossRef]
- Yin, J.; Wang, D.; Yang, L.; Wei, H.; Dong, P.; Ke, L.; Wang, G.; Zhu, H.; Zeng, X. Correlation between forming quality and spatter dynamics in laser powder bed fusion. Addit. Manuf. 2020, 31, 100958. [Google Scholar] [CrossRef]
- LeCun, Y.; Bengio, Y.; Hinton, G. Deep learning. Nature 2015, 521, 436–444. [Google Scholar] [CrossRef]
- Jordan, M.I.; Mitchell, T.M. Machine learning: Trends, perspectives, and prospects. Science 2015, 349, 255–260. [Google Scholar] [CrossRef]
- Litjens, G.; Kooi, T.; Bejnordi, B.E.; Setio, A.A.A.; Ciompi, F.; Ghafoorian, M.; Van Der Laak, J.A.; Van Ginneken, B.; Sánchez, C.I. A survey on deep learning in medical image analysis. Med. Image Anal. 2017, 42, 60–88. [Google Scholar] [CrossRef]
- Razzak, M.I.; Naz, S.; Zaib, A. Deep learning for medical image processing: Overview, challenges and the future. In Classification in BioApps: Automation of Decision Making; Springer: Berlin/Heidelberg, Germany, 2017; pp. 323–350. [Google Scholar] [CrossRef]
- Du, Y.; Mukherjee, T.; DebRoy, T. Conditions for void formation in friction stir welding from machine learning. Npj Comput. Mater. 2019, 5, 68. [Google Scholar] [CrossRef]
- Scime, L.; Beuth, J. Using machine learning to identify in-situ melt pool signatures indicative of flaw formation in a laser powder bed fusion additive manufacturing process. Addit. Manuf. 2019, 25, 151–165. [Google Scholar] [CrossRef]
- Yuan, B.; Guss, G.M.; Wilson, A.C.; Hau-Riege, S.P.; DePond, P.J.; McMains, S.; Matthews, M.J.; Giera, B. Machine-learning-based monitoring of laser powder bed fusion. Adv. Mater. Technol. 2018, 3, 1800136. [Google Scholar] [CrossRef]
- Okaro, I.A.; Jayasinghe, S.; Sutcliffe, C.; Black, K.; Paoletti, P.; Green, P.L. Automatic fault detection for laser powder-bed fusion using semi-supervised machine learning. Addit. Manuf. 2019, 27, 42–53. [Google Scholar] [CrossRef]
- Feng, S.; Chen, Z.; Bircher, B.; Ji, Z.; Nyborg, L.; Bigot, S. Predicting laser powder bed fusion defects through in-process monitoring data and machine learning. Mater. Des. 2022, 222, 111115. [Google Scholar] [CrossRef]
- Estalaki, S.M.; Lough, C.S.; Landers, R.G.; Kinzel, E.C.; Luo, T. Predicting defects in laser powder bed fusion using in-situ thermal imaging data and machine learning. Addit. Manuf. 2022, 58, 103008. [Google Scholar] [CrossRef]
- Du, Y.; Mukherjee, T.; DebRoy, T. Physics-informed machine learning and mechanistic modeling of additive manufacturing to reduce defects. Appl. Mater. Today 2021, 24, 101123. [Google Scholar] [CrossRef]
- Pandiyan, V.; Masinelli, G.; Claire, N.; Le-Quang, T.; Hamidi-Nasab, M.; de Formanoir, C.; Esmaeilzadeh, R.; Goel, S.; Marone, F.; Logé, R.; et al. Deep learning-based monitoring of laser powder bed fusion process on variable time-scales using heterogeneous sensing and operando X-ray radiography guidance. Addit. Manuf. 2022, 58, 103007. [Google Scholar] [CrossRef]
- Gaikwad, A.; Williams, R.J.; de Winton, H.; Bevans, B.D.; Smoqi, Z.; Rao, P.; Hooper, P.A. Multi phenomena melt pool sensor data fusion for enhanced process monitoring of laser powder bed fusion additive manufacturing. Mater. Des. 2022, 221, 110919. [Google Scholar] [CrossRef]
- Toorandaz, S.; Taherkhani, K.; Liravi, F.; Toyserkani, E. A novel machine learning-based approach for in-situ surface roughness prediction in laser powder-bed fusion. Addit. Manuf. 2024, 91, 104354. [Google Scholar] [CrossRef]
- Li, K.; Ma, R.; Qin, Y.; Gong, N.; Wu, J.; Wen, P.; Tan, S.; Zhang, D.Z.; Murr, L.E.; Luo, J. A review of the multi-dimensional application of machine learning to improve the integrated intelligence of laser powder bed fusion. J. Mater. Process. Technol. 2023, 318, 118032. [Google Scholar] [CrossRef]
- Taherkhani, K.; Ero, O.; Liravi, F.; Toorandaz, S.; Toyserkani, E. On the application of in-situ monitoring systems and machine learning algorithms for developing quality assurance platforms in laser powder bed fusion: A review. J. Manuf. Process. 2023, 99, 848–897. [Google Scholar] [CrossRef]
- Tan, Z.; Fang, Q.; Li, H.; Liu, S.; Zhu, W.; Yang, D. Neural network based image segmentation for spatter extraction during laser-based powder bed fusion processing. Opt. Laser Technol. 2020, 130, 106347. [Google Scholar] [CrossRef]
- Mi, J.; Zhang, Y.; Li, H.; Shen, S.; Yang, Y.; Song, C.; Zhou, X.; Duan, Y.; Lu, J.; Mai, H. In-situ monitoring laser based directed energy deposition process with deep convolutional neural network. J. Intell. Manuf. 2023, 34, 683–693. [Google Scholar] [CrossRef]
- Chebil, G.; Bettebghor, D.; Renollet, Y.; Lapouge, P.; Davoine, C.; Thomas, M.; Favier, V.; Schneider, M. Deep learning object detection for optical monitoring of spatters in L-PBF. J. Mater. Process. Technol. 2023, 319, 118063. [Google Scholar] [CrossRef]
- Cai, W.; Shu, L.; Geng, S.; Zhou, Q.; Cao, L. Real-time tracking method for motion spatter in high-power laser welding of stainless steel plate based on a lightweight deep learning model. Expert Syst. Appl. 2024, 254, 124386. [Google Scholar] [CrossRef]
- Kim, J.; Yang, Z.; Ko, H.; Cho, H.; Lu, Y. Deep learning-based data registration of melt-pool-monitoring images for laser powder bed fusion additive manufacturing. J. Manuf. Syst. 2023, 68, 117–129. [Google Scholar] [CrossRef]
- Yang, Z.; Lu, Y.; Yeung, H.; Krishnamurty, S. Investigation of deep learning for real-time melt pool classification in additive manufacturing. In Proceedings of the 2019 IEEE 15th International Conference on Automation Science and Engineering (CASE), Vancouver, BC, Canada, 22–26 August 2019; IEEE: Piscataway, NJ, USA, 2019; pp. 640–647. [Google Scholar] [CrossRef]
- Wang, H.; Li, B.; Zhang, S.; Xuan, F. Traditional machine learning and deep learning for predicting melt-pool cross-sectional morphology of laser powder bed fusion additive manufacturing with thermographic monitoring. J. Intell. Manuf. 2025, 36, 2079–2104. [Google Scholar] [CrossRef]
- Ma, H.; Mao, Z.; Feng, W.; Yang, Y.; Hao, C.; Zhou, J.; Liu, S.; Xie, H.; Guo, G.; Liu, Z. Online in-situ monitoring of melt pool characteristic based on a single high-speed camera in laser powder bed fusion process. Appl. Therm. Eng. 2022, 211, 118515. [Google Scholar] [CrossRef]
- Seede, R.; Shoukr, D.; Zhang, B.; Whitt, A.; Gibbons, S.; Flater, P.; Elwany, A.; Arroyave, R.; Karaman, I. An ultra-high strength martensitic steel fabricated using selective laser melting additive manufacturing: Densification, microstructure, and mechanical properties. Acta Mater. 2020, 186, 199–214. [Google Scholar] [CrossRef]
- Vaughan, M.W.; Elverud, M.; Ye, J.; Seede, R.; Gibbons, S.; Flater, P.; Gaskey, B.; Arroyave, R.; Elwany, A.; Karaman, I. Development of a process optimization framework for fabricating fully dense advanced high strength steels using laser directed energy deposition. Addit. Manuf. 2023, 67, 103489. [Google Scholar] [CrossRef]
- Kelleher, J.D. Deep Learning; MIT Press: Cambridge, MA, USA, 2019. [Google Scholar]
- Parico, A.I.B.; Ahamed, T. Real time pear fruit detection and counting using YOLOv4 models and deep SORT. Sensors 2021, 21, 4803. [Google Scholar] [CrossRef]
- Yang, D.; Miao, C.; Liu, Y.; Wang, Y.; Zheng, Y. Improved foreign object tracking algorithm in coal for belt conveyor gangue selection robot with YOLOv7 and DeepSORT. Measurement 2024, 228, 114180. [Google Scholar] [CrossRef]
- Sun, H.; Liu, T.; Wang, J.; Zhai, D.; Yu, J. Evaluation of two deep learning-based approaches for detecting weeds growing in cabbage. Pest Manag. Sci. 2024, 80, 2817–2826. [Google Scholar] [CrossRef]
- Gadde, D.; Elwany, A.; Du, Y. Spatter behavior and melt pool stability analysis for laser powder bed fusion additive manufacturing. In Proceedings of the ASME 2025 20th International Manufacturing Science and Engineering Conference, Greenville, SC, USA, 23–27 June 2025. MSEC2025-155670. [Google Scholar]
- Cen, W.; Liu, Y.; Yan, H.; Zhou, Z.; Zhou, Z.; Shang, X.; Chen, S.; Long, Y. Modeling and simulation of the effect of scan strategy on spatter movement in laser powder bed fusion. Int. J. Adv. Manuf. Tech. 2024, 132, 3567–3578. [Google Scholar] [CrossRef]
- Du, Y.; Mukherjee, T.; Finch, N.; De, A.; DebRoy, T. High-throughput screening of surface roughness during additive manufacturing. J. Manuf. Process. 2022, 81, 65–77. [Google Scholar] [CrossRef]
Disclaimer/Publisher’s Note: The statements, opinions and data contained in all publications are solely those of the individual author(s) and contributor(s) and not of MDPI and/or the editor(s). MDPI and/or the editor(s) disclaim responsibility for any injury to people or property resulting from any ideas, methods, instructions or products referred to in the content. |
© 2025 by the authors. Licensee MDPI, Basel, Switzerland. This article is an open access article distributed under the terms and conditions of the Creative Commons Attribution (CC BY) license (https://creativecommons.org/licenses/by/4.0/).