Abstract
To reveal its influence on quasicrystal structure analysis, multiple diffraction effects in a basic Co-rich decagonal Al-Co-Ni quasicrystal have been investigated in-house and with synchrotron radiation. Two weak reflections were chosen as the main reflections in the in-house measurements, and 40° -scans of one main reflection have been performed with synchrotron radiation. As well as being known for periodic crystals and the icosahedral quasicrystal, it is also observed for this decagonal quasicrystal that the intensity of the main reflection may significantly increase if the simultaneous and the coupling reflections are both strong. The occurrence of multiple diffraction events during collection of a full data set as well as the -scans measurements have been studied based on an average structure model and the kinematical multiple diffraction theory. The present experimental and simulation efforts on the effects of multiple diffraction suggest that it is insufficient on its own to explain the discrepancy in weak-reflection intensities; alternative explanations like the phasonic disorder should be paid more attention in future.
1. Introduction
Multiple diffraction (MD) happens when two or more diffraction beams are simultaneously excited, i.e., two or more reciprocal lattice points lie simultaneously on the Ewald sphere. Figure 1 demonstrates the geometry of multiple diffraction. O is the origin of the reciprocal lattice, C is the center of the Ewald sphere, and the circle shown here is the intersection of the plane drawing the figure with the Ewald sphere. represents the direction of the incident beam, and and represent the direction of reflected beams. The diffraction vector OP lies in the plane, while OH lies out of the plane. When the crystal rotates around the primary vector OP (the so-called scan), the reciprocal lattice point H may also touch the surface of the Ewald sphere. When it happens, the reflected beam by the diffraction wave vector OH can also serve as a primary beam for diffraction wave vector HP, letting another diffraction beam be excited in the same direction of , hence resulting in the redistribution of the total amount of intensity. Strictly speaking, multiple diffraction has two effects: if the primary reflection P (also called main reflection; hereafter a single bold letter is used to indicate the reflection throughout this paper) is a forbidden or weak reflection and both the second excited reflection H (called simultaneous or operative reflection) and the corresponding P-H (called coupling or cooperative reflection) are strong, the intensity of the primary reflection will be enhanced; such an effect is the so-called Umweganregung.On the other hand, if P is a strong reflection and both H and P-H are weak, its intensity will decrease, which is defined as Aufhellung. Our interest in multiple diffraction is restricted to Umweganregung in the case of weak reflections.
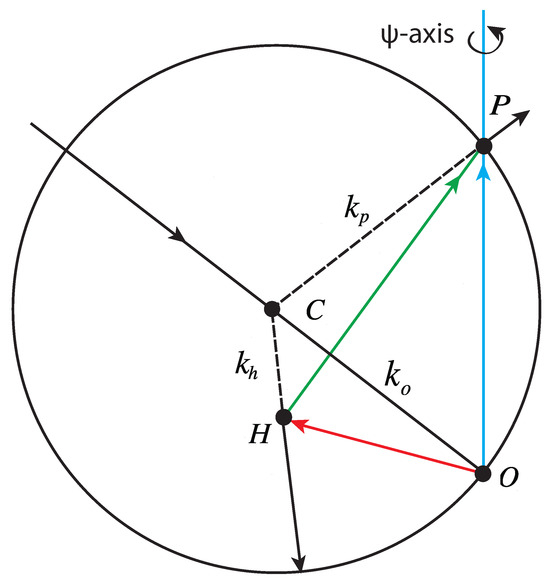
Figure 1.
Multiple diffraction in reciprocal space in the Ewald construction.
For quasicrystals, multiple diffraction is unavoidable when collecting large data sets owing to the infinite and dense reciprocal lattice points. It is expected to seriously influence weak Bragg intensities, which are crucial for the determination of their structures, and the poor fit of weak reflections during structure refinement has once been attributed to the effect of multiple diffraction [1]. In the past, only very few works focused on the multiple diffraction phenomena in decagonal quasicrystals. For example, Eisenhower et al. studied the issue of centrosymmetry on three similar d-quasicrystals with synchrotron radiation ( = 1.63 Å) and a point detector [2]. To the best of our knowledge, no work attempted to investigate their effect on the quality of the data set and consequently on the structure refinement. As we pointed out recently, if the data set contains a large dynamic range of intensities, properly correcting these artifacts is necessary [3]; otherwise, it can deteriorate the quality of a refined structure model significantly Steurer [4] and Takakura et al. [5] have also reported their study on MD effects in an icosahedral Al-Cu-Ru quasicrystal by -scan measurements of a (3 3 1 1 3) reflection along a 3-fold axis, and it is revealed that the variation in the intensity shows no 3-fold symmetry. As far as we know, there is neither further experimental evidence on the MD effects in quasicrystals since then, nor any works correcting or evaluating their effect during the structural refinement [6,7]. Generally speaking, restricted by the physical dynamical range of the charge-coupled device (CCD) detector and the uncertainties introduced by the data processing procedure in practice, it is still an open question to what degree weak reflections are affected by this effect. Concerning the MD effects, which are often considered to be responsible for the bias between calculated and measured for some peaks, reflections appearing as a tail [8,9,10] and it is certainly necessary to study the MD events in routine diffraction experiments as well as the special -scan measurements. In this article, we report the results of studying the MD effects in a basic Co-rich decagonal Al-Co-Ni quasicrystal [11,12], in order to estimate the occurring possibility of significant MD events for weak reflections, and their effect on the diffraction data quality and structure refinement of quasicrystals. The occurrence of MD events during -scans has been simulated based on an average structure model [11] and the kinematical MD theory [13] and compared with the measurements. The reliability of such a simple approach has been confirmed by comparing those simulated -scans diffraction patterns by a modified version of the UMWEG program [14]. Then, the simple approach has been used to investigate the occurrence of MD events in a collected full data set for the first time. The rest of this article is organized as follows: in Section 2, the experimental and data processing will be briefly described; in Section 3, theoretical aspects of simulating -scan measurements as well as MD events in a full data set will be outlined; in Section 4, the simulation results and discussions of the MD events on the diffraction data quality and structure refinement of quasicrystals will be demonstrated and followed by concluding remarks in Section 5.
2. Experimental and Data Processing
The composition of the sample is Al72.5Co18.5Ni9, and its detailed preparation procedure can be found elsewhere [11]. The size of the samples used for the in-house and synchrotron radiation measurements was about 100 µm and 20 µm, respectively. The in-house measurements have been performed with a four-circle diffractometer equipped with a CCD (Xcalibur, Oxford Diffraction, Oxfordshire, UK 50 kV, 40 mA, graphite monochromatized Mo radiation). The synchrotron radiation (SR) was carried out at the Swiss-Norwegian beamlines (SNBL, BM01A) at ESRF, Grenoble. This bending-magnet beamline was installed with parallel-beam optics—that is, a double Si(111) monochromator. The wavelength of the monochromatic beam was tuned to be = 0.7000 Åwith an energy resolution of /≈ 1.4 × 10⁻⁴.
Two individual MD events are measured by performing --scans as described before [3] in-house to estimate the maximum amplitude that the reflected intensity of some weak reflections can reach when affected by multiple diffraction. A wide range of scans has been carried out with SR in order to estimate the occurring frequency of MD events. In-house, two main reflections, P1 = (2 1 0 1 0) and P2 = ( 1 0 1 0), were selected by adding two corresponding strong reflections (1 1 1 1 0) and (1 0 0 0), as well as (0 1 0 0 0) and ( 0 0 1 0), respectively. The MD event is expected to occur in a range of 0.2° (the FWHM is 0.1°) on account of the beam divergence and crystal perfection by some pilot measurements, so the step size of the scan is set to be 0.01°. To compensate for small misalignment of the sample, at each step of , an scan (11 steps, in total 0.1°) was performed around the theoretical value. The exposure time was set to be 30 s per - step to achieve a reliable intensity I of the main reflection during the - scan. When H1 = ( 1 0 0 0) and H2 = ( 0 0 1 0) serve as operating reflections for P1 and P2, one of their excited values of were predicted to be 10.90° and 2.45°, respectively. These operating reflections are considered to be excited when their length satisfies ≤ (1.0 ± 0.05%) 1/. All these calculations are based on the geometry of a 4-circle kappa diffractometer and azimuthal angles as described in detail by Meyer [15], which are carried out by a self-written program. Although theoretically an operating reflection will be excited at least two times if carrying out 360° -scans, restricted by the geometry of the 4-circle diffractometer, it is impossible to measure each corresponding MD event. At SNBL/ESRF Grenoble, the high flux of the beam allowed the measurement of a wide -scan from 0 to 40° with a step size of 0.01° for P2 = ( 1 0 1 0). At each step of , a 0.5° scan has been carried out. A small program has been developed to read out the pixel counts by applying a circle mask on the frame at each step.
For a full data set, all data collection and data processing were performed using the software package CrysAlisPro (Version 1.171. 32. 24, Oxford Diffraction, 2009). It needs to emphasize that the three-dimensional lattice parameters used to index the data sets are a = 3.9888(12) Å, b = 3.9891(11) Å, c = 4.0645(11) Å, and = 90.01(2)°, = 90.00(2)°, = 107.99(3)° in the BL-scheme [16], which is equivalent to a1−4 = 3.989 Å, a5 = 4.065 Å in S-scheme [17], as well as a1−4 = 2.884 Å and a5 = 4.065 Å by the five-dimensional description in the YI-scheme [18]. In this article, the S-scheme is used to index the data sets and to describe the -scans of multiple diffraction measurements for its convenience, and the YI-scheme is used only to describe the average structure model. The transform matrix for the indices from the S-scheme to the YI-scheme is:
It was found that the integration is very sensitive to lattice parameters. To distinguish the uncertainties of integrated intensities introduced by the data processing and those introduced by MD effects, 10 cycles of integration have been repeated to check the robustness of the integration procedure. In these 10 cycles of integration, the output lattice parameters were directly used for the following cycle. At last, the median value of 10 integrated intensities (before absorption correction and outlier rejection) for each reflection has been used when checking the MD effects.
It is found that the lattice parameters are quite stable during these 10 cycles of integration; the maximum variance of these six lattice parameters is 0.022%. There are 17,332 reflections in total (the physical and perpendicular resolutions are 1.60 Å−1 and 1.50 Å−1, respectively). Among them, there are 608 reflections with a larger standard deviation of integration than that of counting statistics, i.e., values output by the CrysAlisPro package. These 608 reflections, including both strong and weak reflections, thus special attention will be paid to them when checking the MD events in these data sets later on.
3. Theoretical Background
3.1. Simulation of -Scan Measurements
3.1.1. Simple Approach
The algorithm used here is similar to that developed in our previous work [3]. Assuming that the structure factor of the primary reflection is very weak compared to those of operating and cooperating reflections and that the Lorenz and polarization factors are neglected, the intensity change is given by Rossmanith [13]:
where is a coefficient; and are the structure factors for the operative and cooperative reflections, respectively; the summation runs over all the involved operative and cooperative reflections. The purpose of such simulation is to check out if the algorithm is sufficient and reliable to predict the observed MD peaks in a semi-quantitative way. In all calculations, the following aspects were considered for comparison with experimental results: (a) A reflection is considered to be compared to another reflection if its intensity is more than 100 times larger, and a reflection is considered to be compared to another if its intensity is less than 0.01 times that of the latter. (b) The Bragg reflections list is generated by five Miller indices hklmn, with maximum and minimum value 8 and −8, respectively, and the length of each selected diffraction vector in the physical and perpendicular space is less than 1.60 Å−1 and 1.70 Å−1, respectively. In total, there are 52,663 reflections. (c) The coefficient in Equation (2) was calculated to be and using Expression (2) by the observed SR umweganregung peaks A and B (see Figure 2) and the integrated intensities of involved reflections, respectively. (Take peak A as an example; as the reflected intensity changes from 205 to 256, see Figure 2a, so = . From the integration results, the integrated intensities of the main, operative, and cooperative reflections of peak A are 7(1) × 102, 3.0(1) × 105, and 1.12(3) × 105, respectively. Using Expression (2), one can easily obtain = . Note that the integrated intensity of the strongest reflection in the full data set (0 1 1 1 1) is not available owing to the limited dynamic range of the CCD). It needs to emphasize that the summation of pixel counts deeply depends on the center and size of the mask. It has been tested that for peak A, may change from to when the center of the mask changes. In this case, the coefficient in Equation (2) will double to . The in-house observed umweganregung peaks (see Figure 3) have also been used to crosscheck the reliability of the coefficient , which results in . Finally, the coefficient in Equation (2) was determined to be = , i.e., the upper limit of all these calculated values, in the purpose of not missing any significant umweganregung peak in the simulation. (d) To decide whether a reflection is simultaneously excited or not when performing a -scan, the Ewald sphere can be regarded as two limiting spheres, with radius and . And considering this, the thickness of the Ewald sphere is set to be 0.05% (1/). There are 155,806 reflections included in the calculation, as some reflections may appear several times owing to the assumed thickness of the Ewald sphere. (e) When one reflection is excited at several steps (the step size is 0.01°), its absolute structure factor is assumed to reach maximum value at the median step and be equally distributed among other steps. All the theoretical structure factors are calculated by the average structure model for the basic Co-rich decagonal Al-Co-Ni quasicrystal (see reference [11]) and its ideal version before refinement was used. The R value are wR = 24.4% and R = 30.9% for 811 unique reflections based on one full collected data set with a unit weighting scheme, i.e., = 24.4%, where summation runs over all the unique reflections. As its value is dominated by strong reflections, it implies the calculated structure factors are reliable for strong reflections.
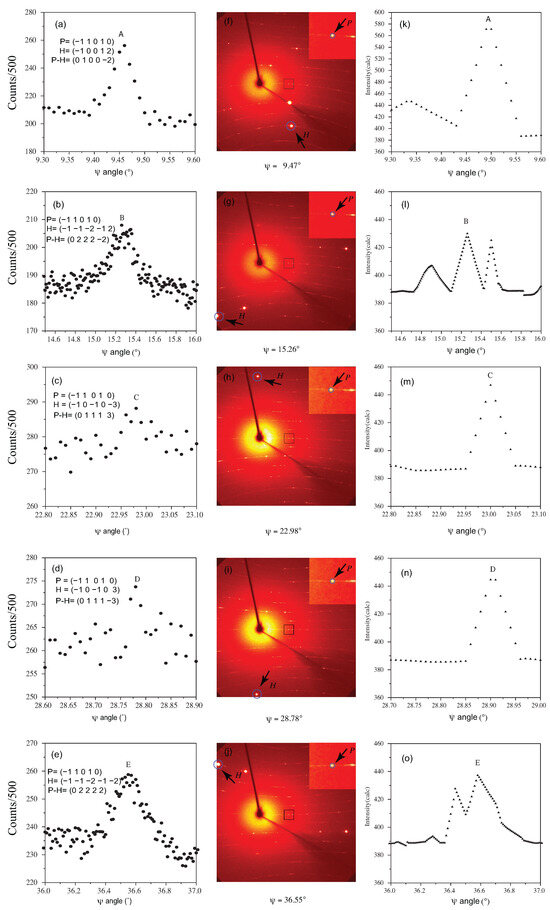
Figure 2.
Significant multiple diffraction peaks of primary reflection (−1 1 0 1 0) during a 40° of -scans. From the measurements, these peaks are located at (a) 9.47° (peak A), (b) 15.26° (peak B), (c) 22.98° (peak C), (d) 28.78° (peak D), and (e) 36.55° (peak E); from the simulation by the simple approach introduced in the text, they are located at (k) 9.495° (peak A), (l) 15.26° (peak B), (m) 23.00° (peak C), (n) 28.905° (peak D), and (o) 36.58° (peak E). Figure (f–j) demonstrates the appearance of corresponding main and operating reflections on the diffraction frames. The marked zones that contain the main reflection are shown enlarged in the insert figures.
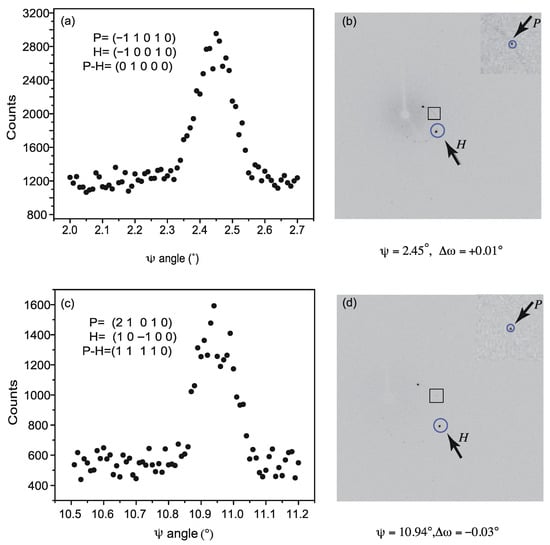
Figure 3.
Intensity of a weak reflection as a function of the azimuthal angle. At the peak, the main contributing simultaneous reflection is (a) H = ( 1 0 1 0) and (c) H = (1 0 0 0). The relative positions of the involved reflections at the peak are shown by CCD images right to them, (b,d), respectively.
To estimate the reliability of the idealized model, the integrated intensities themselves are used as reference, which results in R = 8.3% based on the same data set, i.e., = 8.3%, where i runs over all unique reflections. It can be deduced that the maximum uncertainty of in Equation (2) is , implying that the ideal model is quite reliable.
3.1.2. Complicated Approach
As we will see, all the significant MD events can be predicted by the simple approach. However, it does not consider the polarization and the Lorenz effect, nor the size of the sample, the beam divergence, wavelength spread, and mosaic spread. In order to check its reliability, a complicated bottom-up approach has been applied to simulate the -scans diffraction pattern. By modifying the UMWEG program, Version 2003 [13], which can simulate the MD patterns of periodic crystals, now it is also applicable to quasicrystals as well. In the modified version, the structure factors and their phases are calculated from the mentioned ideal average structure model of basic Co-rich decagonal Al-Co-Ni. The absorption effect has been neglected by setting the coefficients of absorption to be zero. The polarization of the beam is 95% in the horizontal plane and 5% in the vertical diffracting plane. Similarly to that of traditional crystals, the peak width of the -scan diffraction pattern of quasicrystals depends on the radius r of the sample, the wavelength spread , the beam divergence , and the mosaic spread . The exact expression could be found elsewhere [19]. The individual contributions of these parameters to the FWHM have been intensively tested. Owing to the uncertainties of measurement and summation of pixel counts, the actual FWHM should be larger than 0.05°, as deduced from peak C. However, it should be less than 0.2° suggested by peak B and peak D because they are attributed to several individual peaks, as we will see later. It is found that when the radius of the mosaic block is less than 1000 Å, i.e., greater than 0.001, its contribution to the FWHM is more than 0.2°. Therefore, should be less than 0.001. It has also been calculated that when the mosaic spread equals 0.1°, its contribution to the FWHM is 0.12°. In the present simulations, = 0.0007 and the mosaic spread = 0.01° were used. The beam divergence and adopted by Thorkildsen et. al. [20,21] were used as well. The FWHM is calculated to be less than 0.17° by these parameters.
3.2. Simulation of MD Events in a Collected Full Data Set
Theoretically, one can collect a data set of a quasicrystal by performing one or several -scan measurements for several reflections. However, in practice, the most popular strategy is to collect by combining several runs with a special angle settings. On the one hand, it adds the complexity of the simulation of MD events, as there is no available approach to simulate the MD events during scans. On the other hand, it provides another way of extracting weak reflections, which may be significantly affected by MD effects, from the full data set. From integration results, one knows the maximum integrated intensity of each reflection appears on a certain diffraction frame. It is well known that the profiles of some strong reflections may span over several diffraction frames, which implies that they may affect weak reflections on several diffraction frames. However, by checking some selected strong reflections, the profiles of these strong reflections are very sharp, and the integrated intensities reduce by at least 50% in the neighboring two diffraction frames to the one that has the maximum integrated intensity (the oscillation angle of -scans is 0.2°). Therefore, it is sufficient to consider those reflections that appear simultaneously on the same as well as on the neighboring two diffraction frames when simulating MD events. As demonstrated in the following section, the simple approach introduced above is sufficient and quite reliable to predict significant MD events. Thus, one can also apply it to determine the significant MD events in the collected full data set. The difference is that, according to the integration resulting file, the whole involved reflections are already available, and there is no need to predict when these reflections touch the Ewald sphere. In case of missing some significant MD events, the coefficient = has also been adopted. The summation runs over all the operating reflections that have theoretical intensities 100 times that of the main reflection in the neighboring two diffraction frames and the corresponding cooperative reflections. All the theoretical structure factors are calculated by the average structure model as well.
4. Results and Discussion
4.1. ψ-Scan Multiple Diffraction Pattern
Figure 3a,c shows some results of in-house -scans measurement. Significant multiple diffraction peaks are observed where expected, with only a small bias of the theoretical angle setting. Each black point represents the maximum of the 11-step scan. According to the CCD frames, in both cases two strong simultaneous reflections appear, (Figure 3b,d), but only one of them contributes mainly to the observed peaks, as the intensity of the cooperating reflection corresponding to the other simultaneous reflection is weak. The positions of the primary reflections and main contributing simultaneous reflections are indicated by arrows. From Figure 3a,c, one can see that the maximum value of the intensity is about three times the original intensity. The enhancement seems smaller than that reported by Eisenhower et al. [2] for a similar decagonal quasicrystal Al72.5Co16.5Ni11. It may be attributed to the large wavelength ( = 1.63 Å) used in their experiments by synchrotron radiation, resulting in the area of the Ewald sphere in the present situation being 5.42 times that of theirs or more likely the longer wavelength used by Eisenhower gives stronger scattering power (proportional to ), giving stronger MD effects. More reflections are included in the interaction, which may remove some energy from the strong operating and cooperating reflection. Indeed, many weak reflections except the primary reflection can be clearly seen on the CCD images. Note that the primary reflections ( 1 0 1 0) and (2 1 0 1 0) on Figure 3a,c, respectively, are equivalent reflections. The measured intensity should have comparable intensities. However, the intensity of the latter is obviously smaller than the former. It is because during the measurement for the reflection (2 1 0 1 0), the distance of the CCD detector was set to 100 mm by accident instead of 60 mm by default.
Figure 4a shows the 40° of -scans of one primary reflection ( 1 0 1 0). The step size of the -scan is 0.01°. At each specific angle, an scan with a width of 0.5° was performed. The value of was calculated by the known orientation matrix and the standard angle setting at = 0. The counts show vertically integrated around the center of the reciprocal point of vector ( 1 0 1 0) by applying a mask with a radius of five . The jump in the intensity around 22° is caused by the refilling of electrons in the storage ring. Five peaks can be clearly seen in Figure 4a. All these five peaks are reproduced by simulation as shown in Figure 4b by the simple approach. The operating and cooperating reflections and the corresponding theoretical intensities of these peaks are listed in Table 1.
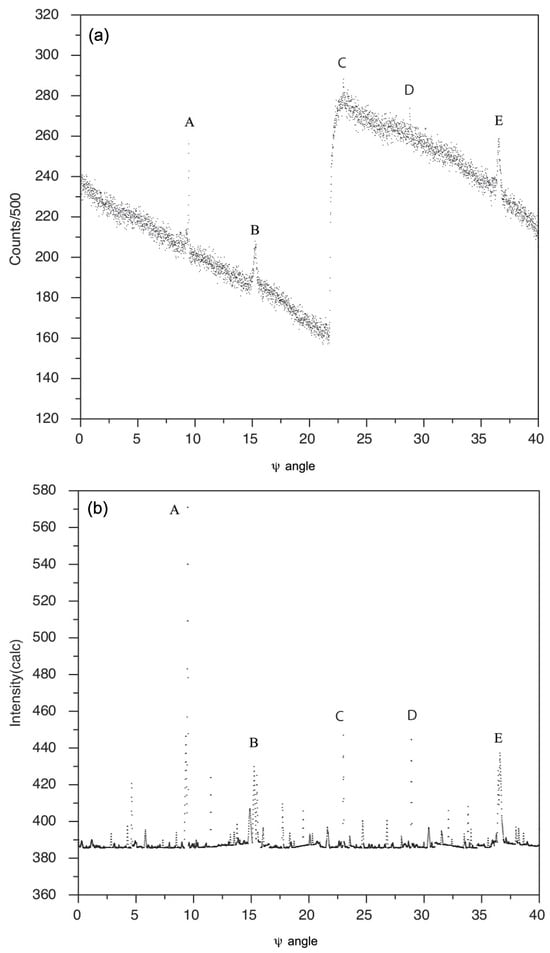
Figure 4.
Intensity variation in primary reflection ( 1 0 1 0) during a 40° of -scans, (a) experimental measurements and (b) simulation results by the simple approach.

Table 1.
The main contributing strong operating and cooperating reflections of the MD peaks during the 40° scans around primary reflection ( 1 0 1 0), the theoretical intensity of the main reflection is 385.6.
Note that peak A is the strongest of the five peaks because both its operating and cooperating reflections are strong reflections, and the product of their intensities has the largest value. The intensity variation in peaks B and E, C, and D are the same, and the diffraction pattern is symmetric at angle 25.92°. From the simulation, one can easily find that it is caused by the symmetry of the related operating and cooperating reflections. From the -scans measurements and the semi-quantitative simulation results, we may conclude that only a small number of reflections are affected by multiple diffraction. For example, by simulation, for the primary reflections ( 1 0 1 0) there are 72 of 4000 positions (40°, step size 0.01°) whose intensity is enhanced by 10%, i.e., from 385.6 to 424.2. Figure 4a also suggests that most affected positions are saturated in the background.
In order to crosscheck the reliability of the simple approach, the bottom-up complicated approach has been applied to simulate the -scans diffraction pattern and to check out if the peaks are really caused by those operating and cooperating reflections listed in Table 1. It needs to be emphasized that all the experimental measurements are performed after refining the instrument model. From the refined instrument model, we know that the primary beam is misaligned 0.81°. This parameter is very important in simulating the position of MD peaks, as such offset was not considered by UMWEG. Figure 5 shows the simulated and measured diffraction pattern after correction of the 0.81° of -shift. The enlarged parts of peak A, peak B, and peak C are shown in Figure 6, Figure 7, and Figure 8, respectively. From these 3 figures, it is obvious that peak A, peak B, and peak E are all caused by the overlay of several MD peaks, and there is a mirror at 25.91°. At the theoretical positions of peak C (and peak D), there are no other strong MD peaks around. It is confirmed that the contributing operating reflections of these five peaks are exactly the same as predicted by the simple approach, as shown in Table 1. Therefore, the quantitative results suggest that the qualitative results are also very reliable, as the five peaks can be found successfully as well.
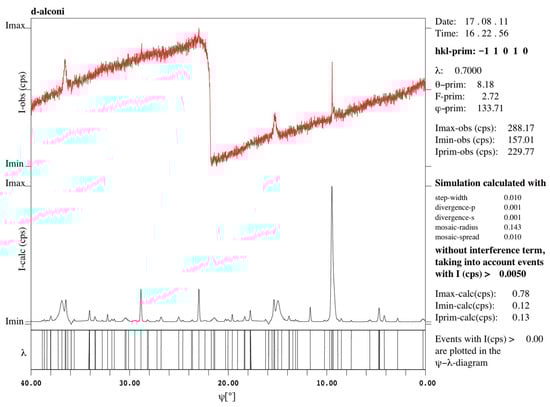
Figure 5.
Simulated -scans without considering the interference term and including the - diagrams. The measured -scans are included and A 0.81° -shift has been corrected according to the refined instrument model.
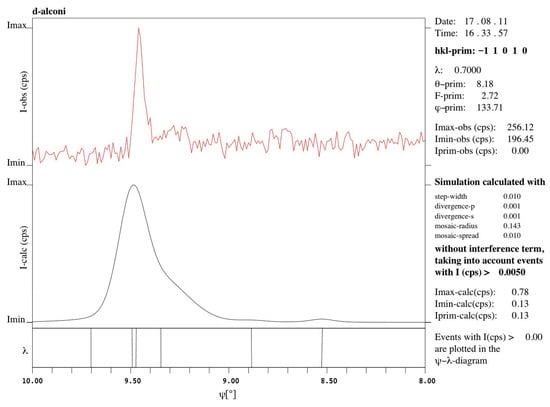
Figure 6.
Enlarged peak A of the simulated -scans without considering the interference term and including the - diagrams. It is mainly composed of three individual MD peaks locating at 9.346°, 9.473°, and 9.492°. The maximum of the peak locates at 9.492°.
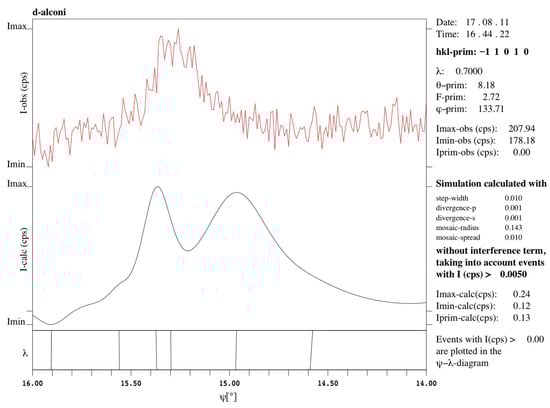
Figure 7.
Enlarged peak B of simulated -scans without considering the interference term and including the - diagrams. It is mainly composed of four individual MD peaks locating at 14.967°, 15.298°, 15.371°, and 15.560°. The maximum of the peak locates at 14.967°.
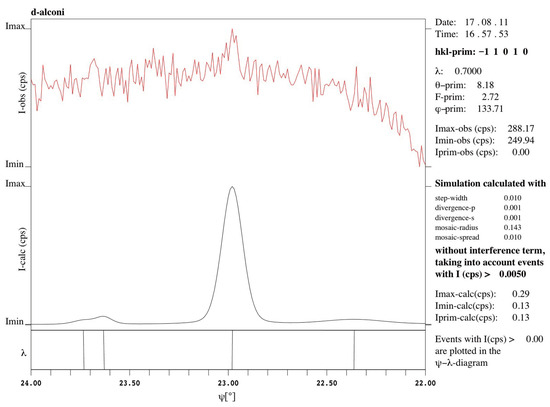
Figure 8.
Enlarged peak C of simulated -scans without considering the interference term and including the - diagrams. It is mainly attributed to a single MD peak locating at 22.980°.
4.2. Effect of Multiple Diffraction on the Quality of the One Full Data Set
From the simulation results of the simple and the complicated approaches, it suggests that although the simple approach is based on a simple assumption, it is still sufficient and reliable to predict significant MD events. The latter is of vital importance when evaluating the MD effects on the diffraction data quality of quasicrystals. By the most pessimistic assumptions discussed in Section 3.2, one can figure out all the candidate weak reflections that could be potentially affected by MD effects when collecting the full data set. These weak reflections are selected when they satisfy the following:
and
where is the amount of enhanced intensity calculated by Expression (2), and and are the integrated intensity and its corresponding standard deviation of a primary reflection, respectively. is the median value of integrated intensity of all the equivalent reflections, including the primary reflection. Both values of 1 and 2 have been tested for ; however, it is found that = 2 is more reasonable. It needs to be noted that these weak reflections that are contaminated by MD effects cannot be automatically rejected before empirical absorption fitting, as the default value is = 12 [22].
It is finally found that there are only 22 candidates of weak reflections among 17,332 reflections that satisfy both Expressions (3) and (4) during the collecting of the full data set. When comparing them with their equivalent reflections before and after absorption and outlier rejection, it is found that only seven and eight reflections, respectively, have the maximum integrated intensities among their equivalent reflections, which strongly suggests that they are affected by MD effects. There are some weak reflections that satisfy the criteria, but they do not have the maximum integrated intensity among their equivalent reflections, implying the MD effect is not the only source of strengthening weak reflections. The effect of these 10 reflections on the diffraction data quality of the whole data set can be evaluated by the widespread statistic factor as follows:
Here, means the intensity of an individual reflection, and means the average intensity of a group of equivalent reflections labeled by i. The summation runs over the whole reflections, and please note that 10/mmm Laue group is applied to check the equivalent reflections, and only those reflections with redundancy no less than three are considered in the present calculation. It is not surprising that the change of is negligible when rejecting these 22 reflections.
The eight reflections that satisfy Expressions (3) and (4) and have the maximum integrated intensities among their equivalent reflections are listed in Table 2 with their main contributing operating and cooperating reflections. In most cases, not only one operating reflection strengthens the main reflection, and the operating reflection does not have to be on the same frame as the main reflection. For instance, operating reflection (0 1 1 0 1) on frame (1, 215) contributes 272.8 of the total MD effect of 393.4 (69.3%), there is another operating reflection (1 3 3 1 1) on frame (1, 217) that also contributes 105.7. On the other hand, even if there are several strong operating reflections that appear on the same diffraction frame as the main reflection, if the operating and cooperating reflections are not both strong, they still contribute little to the MD effect; e.g., there are two strong operating reflections (0) and on frame (2, 549), but only the latter contributes mainly to the MD effect (93.6%).
Table 2.
Some weak reflections significantly affected by MD effects during collecting the full data set and their main contributing operating and cooperating reflections.
Finally, let us check the MD effects on the structure refinement of quasicrystals. It is found that the calculated structure factors are larger than the observed ones for the equivalent reflections of 5 out of these 12 reflections, suggesting that the MD effect is not the main reason for the poor fit of weak reflections in the refinement of quasicrystals where the observed structure factors are always larger than the calculated ones.
5. Conclusions
Multiple diffraction effects can significantly strengthen the intensity of the weak reflections in a basic Co-rich decagonal Al-Co-Ni quasicrystal as well as in an i-quasicrystal, as demonstrated by in-house and synchrotron radiation -scan measurements. By comparing simulation results of MD peaks and observed scan diffraction patterns, it reveals that a simple version of kinematical diffraction theory is sufficient and reliable to predict significant MD events. For the first time, the MD events in a complete collected data set have been investigated, and the results suggest that their occurring frequency is quite low. The intensities of weak reflections themselves that are affected by MD effects may be very significant (satisfy the proposed criteria Expressions (4) and (5)); however, their effects on the diffraction data quality are negligible after absorption correction and averaging of equivalent reflections. It is also confirmed that the MD effect is not responsible for the poor fit of weak reflections in the refinement of quasicrystals. The present work supports the previous idea that the number of reflections so strongly affected by the MD effect is not large enough to explain the typical bias for some weak reflection [23].
Funding
This research was funded by the National Natural Science Foundation of China (Grant Nos. 52173231 and U23A20537) as well as the Swiss National Science Foundation under Grant SNF200020-121568.
Data Availability Statement
The original contributions presented in this study are included in the article. Further inquiries can be directed to the corresponding author.
Acknowledgments
The author is indebted to Walter Steurer, who initiated the project on the effect of multiple diffraction during refinement of quasicrystal structures more than 15 years ago. The author also gratefully acknowledges Angelica Strutz for providing the sample and the ideal average structure model and Thomas Weber, Elizabeth Rossmanith, and Arkadiy Simonov for useful discussions during that time. The staff of the Swiss-Norwegian beamline (SNBL) at ESRF is acknowledged for the beamline time provided. The author is also grateful for the valuable comments and remarks from three anonymous referees that have polished the present work so much.
Conflicts of Interest
The author declares no conflicts of interest.
Abbreviations
The following abbreviations are used in this manuscript:
| MD | multiple diffraction |
| i | icosahedral |
| d | decagonal |
| H | simultaneous reflection |
| P-H | coupling reflection |
| SR | synchrotron radiation |
| CCD | charge-coupled device |
| SNBL | Swiss-Norwegian beamlines |
| SXRD | single-crystal X-ray diffraction |
References
- Takakura, H.; Gómez, C.P.; Yamamoto, A.; De Bossieu, M.; Tsai, A.P. Atomic structure of the binary icosahedral Yb–Cd quasicrystal. Nat. Mater. 2007, 6, 58–63. [Google Scholar] [CrossRef] [PubMed]
- Eisenhower, R.; Colella, R.; Grushko, B. Multiple-beam x-ray-diffraction studies of decagonal quasicrystals. Phys. Rev. B 1998, 57, 8218. [Google Scholar] [CrossRef]
- Fan, C.Z.; Weber, T.; Deloudi, S.; Steurer, W. Multiple diffraction in an icosahedral Al-Cu-Fe quasicrystal. Phil. Mag. 2011, 19–21, 2528–2535. [Google Scholar] [CrossRef]
- Steurer, W. Quasicrystal structure and growth models: Discussion of the status quo and the still open questions. J. Physics Conf. Ser. 2017, 809, 012001. [Google Scholar] [CrossRef]
- Takakura, H.; Mizuno, R. Multiple Diffraction in an Icosahedral Al-Cu-Rh Quasicrystal: X-Ray Experiment and Simulation. Mater. Struct. 2015, 22, 281. [Google Scholar]
- Strzalka, R.; Buganski, I.; Kuczera, P.; Pytlik, L.; Wolny, J. Atomic Structure of Decagonal Al-Cu-Rh Quasicrystal–Revisited. Crystals 2019, 9, 78. [Google Scholar] [CrossRef]
- Buganski, I.; Strzalka, R.; Wolny, J. Phason-flips refinement of and multiple-scattering correction for the d-AlCuRh quasicrystal. Acta. Cryst. 2019, A75, 352–361. [Google Scholar] [CrossRef]
- Buganski, I.; Strzalka, R.; Wolny, J.A. new approach to phason disorder for a decagonal quasicrystal: The moment series expansion of the tiling distribution function for AlCuRh. J. Appl. Cryst 2020, 53, 904–913. [Google Scholar] [CrossRef]
- Buganski, I.; Bindi, L. Insight into the structure of decagonite—The extraterrestrial decagonal quasicrystal. IUCrJ 2021, 8, 87–101. [Google Scholar] [CrossRef]
- Buganski, I.; Strzalka, R.; Wolny, J. The physical space model of the Tsai-type quasi-crystal. Acta. Cryst. 2024, B80, 1–10. [Google Scholar]
- Strutz, A.; Yamamoto, A.; Steurer, W. Basic Co-rich decagonal Al-Co-Ni: Average structure. Phys. Rev. B 2009, 80, 184102. [Google Scholar] [CrossRef]
- Strutz, A.; Yamamoto, A.; Steurer, W. Basic Co-rich decagonal Al-Co-Ni: Superstructure. Phys. Rev. B 2010, 82, 064107. [Google Scholar] [CrossRef]
- Rossmanith, E. Comparison of an Umweganregung pattern, measured on an automatic single-crystal diffractometer, with calculated patterns. Acta. Cryst. A 1986, 42, 344–348. [Google Scholar] [CrossRef]
- Rossmanith, E. UMWEG: A program for the calculation and graphical representation of multiple-diffraction patterns. J. Appl. Cryst. 2003, 36, 1467. [Google Scholar] [CrossRef]
- Meyer, M. Construction of a Multi-Purpose X-Ray CCD Detector and Its Implementation on a 4-Circle Kappa Goniometer. Ph.D. Thesis, EPFL, Lausanne, Switzerland, 1998. [Google Scholar]
- Busing, W.; Levy, H. Angle calculations for 3-and 4-circle X-ray and neutron diffractometers. Acta. Cryst 1967, 22, 457–464. [Google Scholar] [CrossRef]
- Steurer, W. Twenty years of structure research on quasicrystals. Part I. Pentagonal, octagonal, decagonal and dodecagonal quasicrystals. Z. Krist. 2004, 219, 391–446. [Google Scholar] [CrossRef]
- Ishihara, K.; Yamamoto, A. Penrose patterns and related structures. I. Superstructure and generalized Penrose patterns. Acta Cryst. 1988, A44, 508–516. [Google Scholar] [CrossRef]
- Rossmanith, E. Kinematical multiple diffraction: The width of ψ-scan intensity profiles. Acta. Cryst. A 2007, 63, 251–256. [Google Scholar] [CrossRef]
- Thorkildsen, G.; Mathiesen, R.H.; Larsen, H.B. Angle calculations for a six-circle κ diffractometer. J. Appl. Cryst. 1999, 32, 943–950. [Google Scholar] [CrossRef]
- Thorkildsen, G.; Larsen, H.B.; Weckert, E.; Mo, F.; Mathiesen, R.H. Three-beam resonant X-ray diffraction in germanium—Laue transmission cases. J. Appl. Cryst. 2005, 61, 460–470. [Google Scholar]
- Blessing, R. Outlier treatment in data merging. J. Appl. Cryst. 1997, 30, 421–426. [Google Scholar] [CrossRef]
- Kuczera, P.; Wolny, J.; Steurer, W. Comparative structural study of decagonal quasicrystals in the systems Al–Cu–Me (Me = Co, Rh, Ir). Acta. Cryst. 2012, B68, 578–589. [Google Scholar] [CrossRef] [PubMed]


Disclaimer/Publisher’s Note: The statements, opinions and data contained in all publications are solely those of the individual author(s) and contributor(s) and not of MDPI and/or the editor(s). MDPI and/or the editor(s) disclaim responsibility for any injury to people or property resulting from any ideas, methods, instructions or products referred to in the content. |
© 2025 by the author. Licensee MDPI, Basel, Switzerland. This article is an open access article distributed under the terms and conditions of the Creative Commons Attribution (CC BY) license (https://creativecommons.org/licenses/by/4.0/).