Abstract
In the design and manufacturing of pressure vessels, the quality of welded joints and their operational safety are critical considerations. Weld quality classification is closely linked to its impact on fatigue performance. In this study, aluminum alloy welds with varying levels of porosity were produced by adjusting welding parameters, and X-ray inspection was used to assess porosity levels. Representative welds corresponding to different quality grades were selected to fabricate fatigue specimens, and their fatigue lives were determined. The influence of quality grades on the residual fatigue life of aluminum alloy welded sheets was systematically analyzed. The results indicate that, under identical loading conditions, the fatigue life of specimens with defects is significantly reduced compared to defect-free specimens. This reduction becomes more pronounced as the quality grade decreases—corresponding to an increase in circular hole defects. Specifically, for 5083 aluminum alloy, transitioning from Grade I to Grade III results in fatigue life reductions of approximately 25%, 35%, and 50%, respectively.
1. Introduction
Aluminum alloys are widely used to fabricate pressure vessels’ air separation and aerospace, due to their advantageous combination of lightweight properties, high tensile strength, and corrosion resistance under low temperature [,]. With the requirement of high internal pressure and large capacity, it is urgent to develop pressure vessels made from aluminum alloys with thick walls. During the manufacture, aluminum alloy weld is inescapable, which is the weakness of pressure vessels compared with the base material. The integrity of welds in aluminum alloy structures is pivotal to ensuring the safe operation of pressure vessels. Incorrect welding procedure or poor technique may produce imperfections, leading to premature failure in service, such as lack of fusion, incomplete penetration, cracks, porosity, slag inclusions, etc. [,,]. These imperfections are to be expected to an extent.
Welding defects can be grouped into groups according to ISO 6520-1 []. It is necessary to decide which imperfections are acceptable—those which do not reduce the rate of conformity of characteristics of welded joints with requirements and expectations of users and other interested parties, that is, they do not reduce the quality of a welded structure []. Therefore, quality levels are used to characterize the acceptability of this imperfection for the application in which the product will be used by defining a list of types of imperfections with their sizes, quantity, and significance. Standards are applicable for certain welding processes, joint types, and material thickness ranges. Standard ISO 5817 [] for steels, nickel, titanium, and their alloys and ISO 10042 [] for aluminum and alloys defines three quality levels, B, C, and D, in which quality level B corresponds to the highest requirement on the finished weld. However, numerous studies [] have shown that the link between the existing weld quality classes and static strength or fatigue performance is not consistent. Hobbacher and Kassner [] have reviewed both the existing IIW Recommendations and experimental data in order to establish the link between ISO 5817 and welds which have fatigue strength consistent with the IIW Recommendations []. In as-welded joints, the fatigue strength is defined with the help of fatigue classes, FATs. The fatigue class, FAT, is defined as the stress range at 2 million cycles for a certain survival probability. Aluminum butt weld adopts fa71 fatigue grade.
Within the welding domain, the occurrence of various defects is a common consequence of welding process intricacies. The magnitude and placement of these imperfections invariably compromise the fatigue resistance of welded components [,,]. Notably, Wang et al. [] delved into the fatigue characteristics of 5083 aluminum alloy welded joints, revealing that fatigue longevity could be preserved at an impressive 95% of the base metal’s endurance, sans any discernible initiation of surface defects. Ammar’s investigation [] focused on the influence of pore dimensions on aluminum alloy fatigue life. Their findings suggest that up to a certain threshold, pore size exerts negligible impact on fatigue longevity. However, beyond a critical dimension of 0.5 mm, larger pore sizes precipitate increasingly substantial reductions in fatigue endurance. Likewise, Duckworth et al. [] identified a similar threshold phenomenon in aluminum alloy butt joints housing inclusions. Post-threshold breach, the escalation in inclusion size correlates directly with a commensurate decline in fatigue life relative to the base material. The study by GAO [] and colleagues factored in the influence of porosity dimensions when formulating stress-life equations, thus providing an initial quantification of porosity’s detrimental effect on fatigue endurance. Notably, pores serve as preferred sites for crack initiation, precipitating significant deterioration in fatigue performance [,]. Furthermore, empirical evidence underscores the disproportionately deleterious impact of surface circular hole defects on casting fatigue life vis-à-vis internal defects [,,]. Concurrently, pore existence has been implicated as a primary catalyst for internal stress concentration [], interlayer hardness differentials [], and alterations in principal shear stress []. Presently, the grading of circular hole defects in welded joints primarily hinges on quantifying defect quantity, with scant research attention directed toward elucidating the correlation between defect quantity and joint fatigue life.
In pursuit of assessing the impact of quality grade stratification of circular hole defects on the fatigue life of aluminum alloy, a weld test specimen comprising aluminum alloy with deliberately induced defects was fabricated. Subsequently, rigorous quality assessment and grading procedures were executed on the test specimen. Following this, fatigue life testing of the weld specimen with varying degrees of porosity was conducted, thereby yielding comprehensive fatigue life data across differing porosity levels.
At present, aluminum alloy thick wall pressure vessels are widely used under high pressure and large capacity conditions, but the influence mechanism of welding defects on their fatigue life has not been systematically quantified. Although the existing international standards provide the classification of defect acceptance, the correlation between them and fatigue performance is lack of consistency verification, especially as the synergistic effect of the number, size, and distribution of pore defects on fatigue life is still unclear. The existing studies mostly focus on the isolated analysis of single defect type or size, fail to comprehensively consider the coexistence of multiple defects in actual welding, and lack a quantitative evaluation system based on the mapping relationship between defect classification and fatigue life. Therefore, carrying out systematic fatigue tests on controllable defect specimens and establishing the corresponding relationship between defect quality grade and fatigue life can not only fill the gap of existing standards in the correlation of fatigue performance, but also provide key data support for welding process optimization, defect tolerance formulation, and safety assessment in engineering practice, which is of great engineering significance to improve the reliability design and life prediction accuracy of high-pressure vessels.
2. Materials and Methods
2.1. Welding Process
For 5083 aluminum–magnesium alloy, gas tungsten arc welding (GTAW) is utilized as the predominant welding technique [,]. GTAW involves shielding the weld area with an inert gas, typically argon or helium, while employing a tungsten electrode to establish the arc and fuse the base metals together, thereby facilitating the joining process. In this study, the butt joints of aluminum–magnesium alloy sheets were primarily welded using argon as the shielding gas in GTAW. During the welding procedure, alternating current (AC) is employed to effectively eliminate surface oxides, although this process presents a susceptibility to defects such as porosity and inclusions.
To ensure the quality of argon arc welding, maintaining an adequate welding speed is imperative []. This not only prevents the metal from reacting with oxygen at elevated temperatures but also necessitates a swift flow of protective gas. The primary disparity among butt joints, as dictated by the experiment’s requirements for different levels of porosity, lies in the prevalence of circular hole defects within the joint. Throughout the welding process, variations in welding speed and adjustments to the protective gas flow rate can significantly impact welding quality, yielding welded plates of varying grades. Parameters corresponding to different welding grades are detailed in Table 1. However, given the inherent limitations of this control method in precisely regulating the occurrence of circular hole defects within the welded joint, a preemptive strategy involves welding multiple plates. Ultimately, the selection of welded plates aligning best with the prescribed quality grade specifications is accomplished through meticulous X-ray inspection.

Table 1.
Welding grade parameter.
2.2. Radiographic Inspection
The X-ray non-destructive testing method stands as a prevalent technique within the realm of non-destructive testing. It facilitates transmission-based detection across pressure vessels, capturing images to glean intricate insights into the internal fabric of materials. This method meticulously discerns the location, dimensions, and nature of defects present [,,]. Primarily, its application finds resonance within the domain of pressure vessel welding, particularly emphasizing butt joints or corner joints along pipelines and pivotal connection points [].
Weld circular defect refers to the circular hole or cavity formed in the welding process, which is a common defect in the weld. Circular defects are usually caused by pores or inclusions and can negatively affect the strength and tightness of welded structures [,]. Therefore, for pressure vessel applications, circular hole defects in welds need to be detected and evaluated in a timely manner.
During the testing phase, weld components were extracted from 5 mm thick aluminum alloy plates to fabricate test specimens. Subsequently, aluminum plates with the thickness of 5 mm were sectioned to yield test blocks conducive to X-ray detection. Figure 1 illustrates the segmented test blocks, with weld seams meticulously polished. Complying with relevant standards and guided by photo results, the evaluation area for welded joint assessment is established at 10 mm × 10 mm for metals with thicknesses below 20 mm. The standard specimen used for fatigue testing is precisely collected and processed from the centerline position of the weld seam of the above-mentioned test block to ensure that its gauge length fully includes the weld metal within the evaluation area.
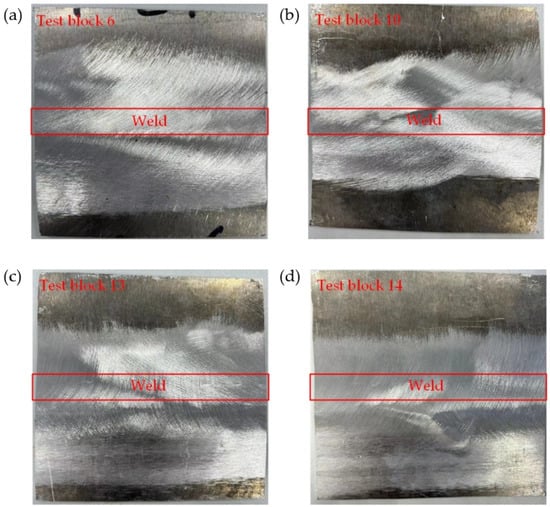
Figure 1.
X-ray test blocks: (a) Test block 6. (b) Test block 10. (c) Test block 13. (d) Test block 14.
X-ray test was carried out on aluminum alloy welded sheet. Each X-ray photograph is 300 mm × 100 mm in size and contains X-ray inspection information for 3 test blocks. The X-ray detection results are shown in Figure 2, which shows the X-ray detection of the test block. Through the analysis of these test results, the internal structure and possible defects of the test block can be more deeply understood, which provides an important reference for the subsequent fatigue test and fatigue performance evaluation.
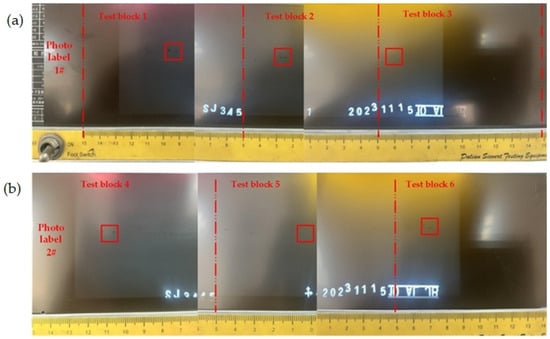
Figure 2.
X-ray results: (a) Photo label 1. (b) Photo label 2.
The X-ray test results are shown in Table 2 with the number of round holes for different test blocks. The evaluation area of 10 mm × 10 mm is used in the detection process, and the circular hole defects with a diameter of about 1 mm are counted as effective defects. Since the evaluation area is 100 mm2 and the circular hole defect area is approximately 1 mm2, the number of circular hole defects can also be expressed as the porosity of circular holes in the evaluation area. It should be noted that the three test blocks are all cut from the same aluminum plate, which ensures that the cold and hot processing method of the material, the surface roughness of the sample, and other factors will not have additional influence on the fatigue test results. This consistency sampling method is helpful to eliminate the interference of external factors to the test results and ensure the accuracy and reliability of the test.

Table 2.
Quality classification of aluminum plate by X-ray inspection.
2.3. Experimental Material
According to the results of X-ray non-destructive testing, six test blocks numbered 1, 2, 3, 4, 5, and 7 with different porosities were selected for fatigue sample preparation. The sample size was shown in Figure 3a. Some typical samples are shown in Figure 3b. The samples were cut from the selected three quality grade test blocks by wire cutting, respectively. The length of the sample pieces was 100 mm, the thickness was 5 mm, and the width of the clamping end was 25 mm. The cut sample is polished with sandpaper to obtain a mirror surface.
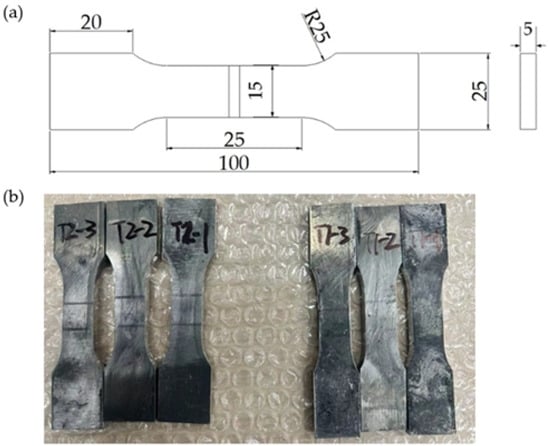
Figure 3.
Fatigue specimen size and physical drawing: (a) Fatigue specimen size (mm). (b) Physical drawing of fatigue specimen.
2.4. Design of the Fatigue Test
Fatigue tests were carried out by constant amplitude load to investigate the influence of porosities on the fatigue life. Fatigue life test was carried out using MTS Criterion Model 42 fatigue testing machine (MTS Systems, Eden Prairie, MN, USA). According to the S-N curve of 5083 aluminum alloy and the sample size, two load levels are selected with the maximum load of 100 MPa and 150.6 MPa. The loading frequency is controlled with 20 Hz with a sine wave. The stress ratio is −1.
The relationship curve between displacement or strain and the number of cycles serves as a crucial tool for comprehending material fatigue behavior in fatigue testing. In the low cycle range, the curve typically exhibits rapid growth, signifying an escalating increase in displacement or strain with cycle number. This surge mirrors the material’s early cycle’s significant deformation and strain accumulation. With continued cycles, the curve may stabilize or plateau, indicating a diminishing strain growth rate, often reaching a steady state. This phase, termed the fatigue phase, illustrates the material’s stable deformation behavior post-cyclic-loading. However, beyond a specific cycle threshold lies the fatigue life point, where the curve sharply ascends. Here, the material experiences a dramatic surge in displacement or strain growth, culminating in failure. This pivotal juncture signifies the exhaustion of the material’s fatigue life, rendering it incapable of enduring further loading cycles while upholding structural integrity.
3. Results
3.1. Fatigue Test Results
Generally, the residual fatigue life of samples with different porosities under different stress is shown in Figure 4. It can be seen that the porosities have serious influence on the fatigue life. By comparing the decline cycles of the fatigue life, it can be found that the fatigue life of the sample with different porosity presents a gradient decline.
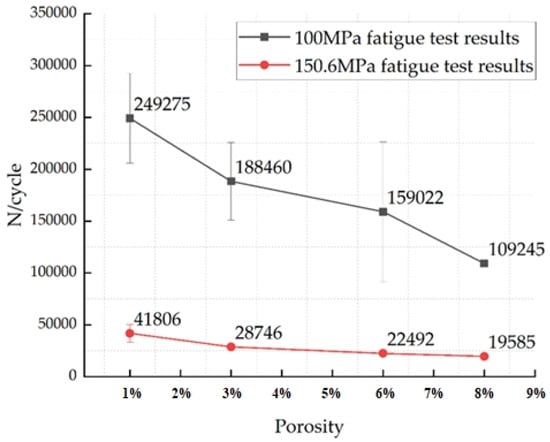
Figure 4.
Residual fatigue life of samples of different quality grades.
At the stress of 100 MPa, the decline fatigue life of the sample with 3% porosity is about three times that of the sample with 1% porosity, and the decline fatigue life of the sample with 6% porosity is about six times that of the sample with 1% porosity, which is also obtained. At 150.6 MPa, the relation of multiples is 1.3 and 2.6. Through careful observation, it becomes evident that the fatigue life of the material exhibits a notable decrease with increasing porosity, ranging from 1% to 8%. Particularly noteworthy is the distinct gradient gap observed among fatigue lives at porosity ratios of 1%, 3%, and 6%, underscoring the substantial impact of minor porosity variations on material fatigue properties. Furthermore, a comparative analysis was conducted between two distinct stress ranges: 100 MPa and 150.6 MPa. The findings reveal a significant order of magnitude difference between these stress ranges. This underscores the profound influence of varying stress levels, even under identical porosity conditions, on the fatigue behavior of the material.
It can be calculated by dividing the reduced fatigue life of samples with different porosity by the cyclic fatigue limit without circular hole defects at the same stress, and the remaining fatigue life of samples with different porosity (1%, 3%, 6%) is reduced by about 25%, 35%, 50% compared with the remaining fatigue life without circular hole defects. Compared with defect-free joints, the weld bead with a porosity of 3% has lost 35% of its expected fatigue life. This means that the safety margin and operational reliability of welded components are significantly reduced.
From the perspective of qualitative applicability, the proposed values indicate the need for strict interpretation of porosity acceptance criteria. The data shows that reaching the upper limit of the universal standard (3%) for porosity level will have a serious impact and lead to a significant decrease in lifespan. This means that for welded joints designed to withstand cyclic loads, pursuing the lowest achievable porosity is crucial to ensure longevity and reliability, rather than just adhering to the maximum allowable limit.
3.2. Fractography Analysis
The fracture morphology exhibited varying characteristics with different levels of porosity, as depicted in Figure 5. Figure 5a,b illustrate the sample representing 1% porosity (designated as T4-1 and T2-1, respectively). In Figure 5b, circular hole defects are evident near the edge, while in subgraph (a), although more defects are present, the small circular holes appear negligible due to their minute size. Notably, specimen T2-1 displays a rugged fracture surface with protrusions and depressions of varying depths, indicating potential stress concentration and crack propagation during fracture. In contrast, the concave and convex structures observed in Figure 5a are relatively minor, contributing to a lower fatigue life performance compared to specimen T4-1. Figure 5c clearly delineates the fracture morphology of the sample with 1% porosity (denoted as T1-1). Here, a circular hole with a diameter of less than 1 mm is visible, accompanied by a noticeable protrusion nearby. Interestingly, a significant tensile texture is observed on the left half of the sample, suggesting that fatigue fracture initiated near the circular hole defect. Moving to Figure 5d, the fracture morphology of a sample with 3% porosity (labeled T4-2) is depicted. Figure 5e,f present the morphology of samples with 6% and 8% porosity, denoted as T6-3 and T2-3, respectively. Despite a 2% difference in defect count between Figure 5e,f, the residual fatigue life results of these samples are comparable. Additionally, the fracture mechanism initiates at the largest circular hole defect and propagates to the surrounding region in the 6–8% porosity range, indicating similar effects on fatigue life. This analysis underscores the influence of porosity on fracture morphology and fatigue behavior, highlighting the critical role of defect size and distribution in material performance under cyclic loading conditions.
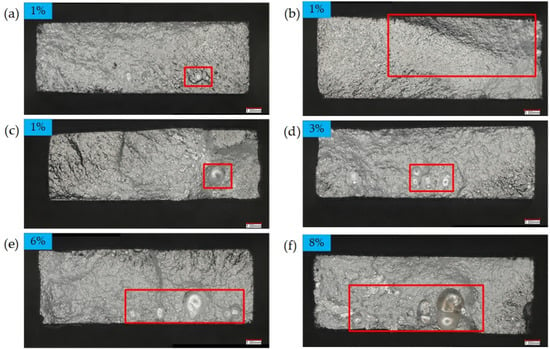
Figure 5.
Fatigue fracture morphology with different porosity: (a) 1%; (b) 1%; (c) 1%; (d) 3%; (e) 6%; (f) 8%.
The fracture surface revealed numerous minute circular hole defects. Despite their exclusion from statistical analysis due to their small size, an increase in their quantity would notably impact the material’s fatigue life. Despite their small size, these circular hole defects can initiate fatigue cracks under cyclic loading conditions. Research indicates that such defects induce stress concentration and generate stress concentration factors in their vicinity, thereby facilitating crack propagation and eventual fatigue failure of the material.
4. Discussion
4.1. Comparison with ISO FAT
In accordance with the guidelines by the International Institute of Welding (IIW) and the International Organization for Standardization (ISO) , a fatigue analysis was conducted on test results involving varying levels of porosity. The Fatigue Assessment Curve (FAT) rating, which indicates the characteristic fatigue strength value and signifies distinct survival probabilities, was utilized while considering the impact of residual stress within the weld-affected area of the specimens. By determining the FAT grade for samples exhibiting different levels of porosity, the fatigue resistance of aluminum alloy samples with varying numbers of circular hole defects was examined. Different FAT grade curves are mainly related to weld shape, stress range and conforming defects. In this paper, other factors such as welding process, weld shape, and pretreatment are guaranteed, and the relationship between different porosity defects and FAT grade curve is mainly studied.
As shown in Figure 6, under 100 MPa stress, the fatigue properties of the sample with porosity (1%) meet the FAT50 standard, aligning with the S-N curve specifications for aluminum alloy design recommended by IIW. Similarly, samples featuring porosity levels of 3%, 6%, and 8% displayed fatigue outcomes that approximate FAT45, FAT40, and FAT36, respectively. It is evident that the correlation between the FAT grade under 100 MPa does not hold at 150.6 MPa, demonstrating that the stress range exerts a significant influence on the fatigue life grade. Nevertheless, the four porosities still conform to the gradient grades of FAT. Notably, an inverse relationship was observed between the level of porosity and the corresponding S-N design curve grade—as porosity increased, the associated curve grade diminished. Through this comprehensive analysis, it can be inferred that the quality assessment of aluminum and aluminum alloy equipment can be categorized based on the four porosity levels scrutinized in this study.
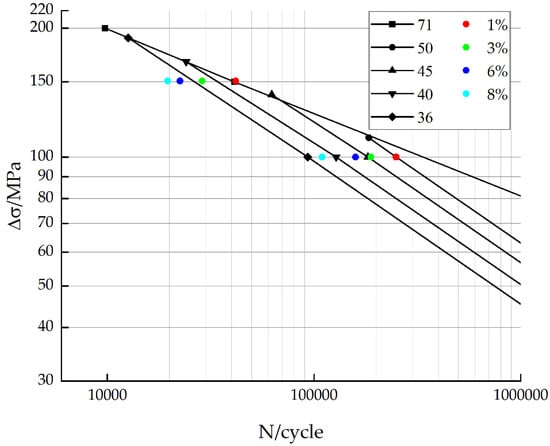
Figure 6.
Fatigue resistance S-N curves for aluminum.
4.2. Effect of Defect Area on Fatigue Life
The Japanese standard addresses the fatigue strength of structures containing defects, focusing primarily on test results conducted on steel plate butt joints. These joints are categorized into three levels: the first level pertains to equipment subjected to cyclic loads, requiring consideration of fatigue strength; the second level involves equipment capable of enduring cyclic loads without requiring residual height grinding; and the third level includes equipment where strength considerations are unnecessary.
These three levels correspond to defect rates of 1%, 3%, and 6%, respectively. The fatigue strengths corresponding to these defect rates are 75%, 55%, and 45%, compared to the strength in defect-free conditions. In the study, the fatigue strengths of three types of porosity examined were found to be 75%, 65%, and 50% relative to the strength without defects, aligning closely with standard results.
4.3. Thickness Correction
When determining the various quality grades of aluminum alloys, the influence of thickness must be considered. According to the IIW standard, the FAT rating of the component is regulated by the thickness correlation coefficient f(t). The coefficient is calculated using Equation (1), where the tref defaults to 25 mm. teff is determined according to the size of the welded structure, specifically, it is related to the length and width of the welded structure. If the length of a member is less than half of its thickness, teff is equal to its thickness. Conversely, if the length is greater than or equal to twice the thickness, teff is calculated as the thickness plus half of the larger size. In the formula, the index n is the thickness correction index, which is related to the welded structure, and 0.2 is taken in this study . The results show that when the thickness of aluminum alloy reaches 80 mm~120 mm, the FAT grade of different porosity decreases by one level. The characteristic fatigue strength of the sample with 1% porosity is FAT50 at 25 mm and decreases to FAT45 after considering the thickness. At this time, the porosity of aluminum alloy above 80 mm is 3%, 6%, and 8%.
Assuming the reference fatigue class, FAT, for 25 mm equals to the FAT from the test results listed in Table 3. The corrected fatigue class, FAT, varied with thickness are shown in Figure 7. It can be seen that the fatigue class, FAT, will decrease with the increase in thickness. For the aluminum alloy weld with thickness of 120 mm, the fatigue class, FAT, can be only 51.88 MPa without any porosity and 16.31 MPa for the porosity of 8%.

Table 3.
Quality level under different porosity.
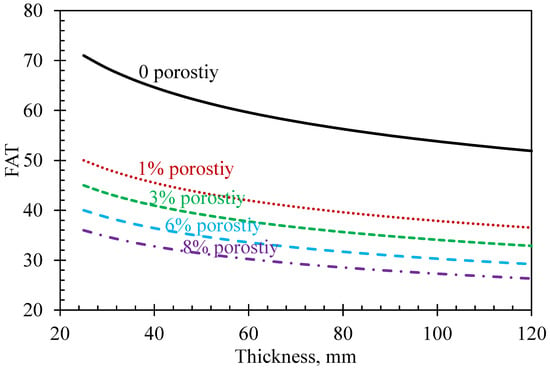
Figure 7.
The fatigue class, FAT, with thickness.
A change in thickness causes a change in volume, with larger objects having more surface area and internal areas to cover and detect. As a result, more time and resources are required during NDT to cover the entire volume and ensure that all critical sites are adequately examined [].
According to the above analysis, for aluminum alloy castings below 80 mm, in the three cases of 1%, 3%, and 6% porosity, consider the quality classification of non-destructive testing boards and equipment. For castings thicker than 80 mm, the porosity of 3%, 6%, and 8% is used, and the evaluation area is changed from the original 10 mm × 10 mm to 10 mm × 30 mm []. The recommended number of allowable circular defects for welded joints of aluminum alloys of different thicknesses is shown in Table 4.

Table 4.
Maximum number of round holes allowed for different quality grades.
5. Conclusions
(1) By comparing the fatigue test results of different porosity with those without defects, it is found that the fatigue life of the workpiece with 1%, 3%, and 6% porosity is about 25%, 35%, and 50% lower than that of the workpiece without defects.
(2) The fatigue test results across different levels of porosity were compared against the S-N design curve for aluminum alloy. It was observed that aluminum alloy with 1% porosity exhibited a characteristic fatigue strength corresponding to FAT50. As porosity increased, the FAT grade decreased by one grade. Moreover, considering the influence of thickness on the classification, it was noted that the FAT grade also decreased with increasing thickness.
(3) Combined with the results of X-ray detection, the acceptable hole defect area of 1%, 3%, and 6% in the evaluation area can be considered in the different classifications of circular hole defects to set the number of circular hole defects that can be included in different quality grades (I~III).
Author Contributions
Conceptualization, Y.L. and Y.Y.; Data curation, Z.Z.; Funding acquisition, Y.L.; Methodology, Z.Z. and G.C.; Project administration, Y.L.; Supervision, Y.Y.; Validation, G.C.; Writing—original draft, Z.Z. and G.C.; Writing—review and editing, Y.L. All authors have read and agreed to the published version of the manuscript.
Funding
This project was supported by the National Natural Science Foundation of China (52375161).
Data Availability Statement
The original contributions presented in this study are included in the article. Further inquiries can be directed to the corresponding author.
Conflicts of Interest
The authors declare that they have no known competing financial interests or personal relationships that could have appeared to influence the work reported in this paper.
References
- Sivaraman, P.; Prabhu, M.K.; Nithyanandhan, T.; Razzaq, M.M.; Kousik, K.; Abraham, D.D. Development of aluminum based AA 2014 and AA 7075 dissimilar metals for aerospace applications. Mater. Today Proc. 2021, 37, 522–526. [Google Scholar] [CrossRef]
- Liu, F.; Zheng, J.X.; Chen, X.; Xu, X.S.; Chen, B. Study on corrosion resistance of artificially aged 7075 aluminium alloy by using Cs-corrected STEM. Trans. Nonferrous Met. Soc. China 2022, 32, 2828–2837. [Google Scholar] [CrossRef]
- Sinha, A.K.; Pramanik, S.; Yagati, K.P. Effect of interlayer time interval on GTAW based wire arc additive manufacturing of 2319 aluminium alloy. Sadhana 2023, 48, 122. [Google Scholar] [CrossRef]
- Li, C.; Goekelma, M.; Dang, T.; Huang, J.; Huang, C.; Li, J.; Friedrich, B. Assessment of melt cleanliness of secondary 5000 aluminum alloy via non-metallic inclusions characterization. Met. Mater Trans. B 2023, 54, 578–592. [Google Scholar] [CrossRef]
- Liu, F.; Wang, H.; Meng, X.; Tan, C.; Chen, B.; Song, X. Effect of magnetic field orientation on suppressing porosity in steady-magnetic-field-assisted aluminum alloy deep-penetration laser welding. J. Mater. Process. Technol. 2022, 304, 117569. [Google Scholar] [CrossRef]
- ISO 6520-1:2019; Welding and Allied Processes—Classification of Geometric Imperfections in Metallic Materials—Part 1: Fusion welding. International Organization for Standardization: Geneva, Switzerland, 2019.
- European Welding Federation. Quality Management in Welded Fabrication; Woodhead Publishing: Cambridge, UK, 2023. [Google Scholar]
- ISO 5817:2014; Welding—Fusion-Welded Joints in Steel, Nickel, Titanium and Their Alloys (Beam Welding Excluded)—Quality Levels for Imperfections. International Organization for Standardization: Geneva, Switzerland, 2014.
- ISO 10042:2018; Welding—Arc-Welded Joints in Aluminium and Its Alloys—Quality Levels for Imperfections. ISO: Geneva, Switzerland, 2018.
- International Institute of Welding (IIW). IIW Guidelines on Weld Quality in Relationship to Fatigue Strength; Springer International Publishing: Cham, Switzerland, 2016. [Google Scholar]
- Hobbacher, A.F. Recommendations for Fatigue Design of Welded Joints and Components, 2nd ed.; Springer: Cham, Switzerland, 2016. [Google Scholar]
- Lin, S.; Deng, Y.-L.; Tang, J.-G.; Deng, S.-H.; Lin, H.-Q.; Ye, L.-Y.; Zhang, X.-M. Microstructures and fatigue behavior of metal-inert-gas-welded joints for extruded Al-Mg-Si alloy. Mater. Sci. Eng. A 2019, 745, 63–73. [Google Scholar] [CrossRef]
- Osmond, P.; Le, V.-D.; Morel, F.; Bellett, D.; Saintier, N. Effect of porosity on the fatigue strength of cast aluminium alloys: From the specimen to the structure. Procedia Eng. 2018, 213, 630–643. [Google Scholar] [CrossRef]
- Lattanzi, L.; Fabrizi, A.; Fortini, A.; Merlin, M.; Timelli, G. Effects of microstructure and casting defects on the fatigue behavior of the high-pressure die-cast AlSi9Cu3(Fe)alloy. Procedia Struct. Integr. 2017, 7, 505–512. [Google Scholar] [CrossRef]
- Wang, B.B.; Xue, P.; Xiao, B.L.; Wang, W.G.; Liu, Y.D.; Ma, Z.Y. Achieving equal fatigue strength to base material in a friction stir welded 5083-H19 aluminium alloy joint. Sci. Technol. Weld. Join. 2020, 25, 81–88. [Google Scholar] [CrossRef]
- Ammar, H.R.; Samuel, A.M.; Samuel, F.H. Effect of casting imperfections on the fatigue life of 319-F and A356-T6 Al–Si casting alloys. Mater. Sci. Eng. A 2008, 473, 65–75. [Google Scholar] [CrossRef]
- Duckworth, W.; Ineson, E. The effects of externally introduced alumina particles on the fatigue life of En24 steel, clean steel. Iron Steel Inst. Spec. Rep. 1963, 77, 87–103. [Google Scholar]
- Gao, Y.X.; Yi, J.Z.; Lee, P.D.; Lindley, T.C. The effect of porosity on the fatigue life of cast aluminium-silicon alloys. Fatig. Fract. Eng. Mater. Struct. 2004, 27, 559–570. [Google Scholar] [CrossRef]
- Xie, C.; Wu, S.; Yu, Y.; Zhang, H.; Hu, Y.; Zhang, M.; Wang, G. Defect-correlated fatigue resistance of additively manufactured Al-Mg4.5Mn alloy with in situ micro-rolling. J. Mater. Process. Technol. 2021, 291, 117039. [Google Scholar] [CrossRef]
- He, C.; Wei, J.; Li, Y.; Zhang, Z.; Tian, N.; Qin, G.; Zuo, L. Improvement of microstructure and fatigue performance of wire-arc additive manufactured 4043 aluminum alloy assisted by interlayer friction stir processing. J. Mater. Sci. Technol. 2023, 133, 183–194. [Google Scholar] [CrossRef]
- Muhammad, M.; Nezhadfar, P.D.; Thompson, S.; Saharan, A.; Phan, N.; Shamsaei, N. A comparative investigation on the microstructure and mechanical properties of additively manufactured aluminum alloys. Int. J. Fatigue 2021, 146, 106165. [Google Scholar] [CrossRef]
- Yang, S.; Hu, W.; Li, J.; Meng, Q.; Zhan, Z. Fatigue tests and damage model development on Al-Si-Mg aluminum alloys with low-velocity impact pit. Int. J. Fatigue 2021, 153, 106466. [Google Scholar] [CrossRef]
- Rotella, A.; Nadot, Y.; Piellard, M.; Augustin, R.; Fleuriot, M. Influence of defect morphology and position on the fatigue limit of cast Al alloy: 3D characterization by X-ray microtomography of natural and artificial defects. Mater. Sci. Eng. A-Struct. Mater. Prop. Microstruct. Process. 2020, 785, 139347. [Google Scholar] [CrossRef]
- Liu, D.; Wu, D.; Wang, R.; Shi, J.; Niu, F.; Ma, G. Formation mechanism of Al-Zn-Mg-Cu alloy fabricated by laser-arc hybrid additive manufacturing: Microstructure evaluation and mechanical properties. Addit. Manuf. 2022, 50, 102554. [Google Scholar] [CrossRef]
- Zhang, Z.; Ma, Z.; He, S.; Song, G.; Liu, L. Effect of laser power on the microstructure and mechanical properties of 2319-Al fabricated by wire-based additive manufacturing. J. Mater. Eng. Perform. 2021, 30, 6640–6649. [Google Scholar] [CrossRef]
- Fang, X.; Chen, G.; Yang, J.; Xie, Y.; Huang, K.; Lu, B. Wire and arc additive manufacturing of high-strength Al-Zn-Mg aluminum alloy. Front. Mater. 2021, 8, 656429. [Google Scholar] [CrossRef]
- Vivek Pamarthi, V.; Sun, T.; Das, A.; Franciosa, P. Tailoring the weld microstructure to prevent solidification cracking in remote laser welding of AA6005 aluminium alloys using adjustable ringmode beam. J. Mater. Res. Technol. 2023, 25, 7154–7168. [Google Scholar] [CrossRef]
- Tian, Z.; Chen, S.; Wang, Y.; Tao, W.; Ye, X.; Ren, W.; Yang, S. Dynamic laser welding hot cracking behavior and mechanism of new structural material Ni e 28W e 6Cr alloy for molten salt reactor. J. Mater. Res. Technol. 2023, 25, 3022–3036. [Google Scholar] [CrossRef]
- Soysal, T.; Kou, S. A simple test for solidification cracking susceptibility and filler metal effect. Weld. J. 2017, 96, 389–401. [Google Scholar]
- Ou, X.; Chen, X.; Xu, X.; Xie, L.; Chen, X.; Hong, Z.; Bai, H.; Liu, X.; Chen, Q.; Li, L.; et al. Recent development in X-ray imaging technology: Future and challenges. Research 2021, 2021, 9892152. [Google Scholar] [CrossRef]
- ASTM E505-22; Standard Reference Radiographs for Inspection of Aluminum and Magnesium Die Castings. ASTM International: West Conshohocken, PA, USA, 2022; pp. 1–3.
- ASTM E2422-17; Standard Digital Reference Images for Inspection of Aluminum Castings. ASTM International: West Conshohocken, PA, USA, 2017; pp. 1–5.
- ASTM. ASTM Compass [WWW Document]. 2021. Available online: https://compass.astm.org/ (accessed on 5 March 2022).
- Ai, Y.; Liu, J.; Ye, C.; Cheng, J. Influence of oscillation parameters on energy distributions and dynamic behaviors during laser welding of aluminum alloy T-joints assisted with solder patch. Int. J. Therm. Sci. 2024, 201, 108953. [Google Scholar] [CrossRef]
- Li, S.; Mi, G.; Wang, C. A study on laser beam oscillating welding characteristics for the 5083 aluminum alloy: Morphology, microstructure and mechanical properties. J. Manuf. Process. 2020, 53, 12–20. [Google Scholar] [CrossRef]
- ASTM A370-19; Standard Test Methods and Definitions for Mechanical Testing of Steel Products. ASTM International: West Conshohocken, PA, USA, 2019.
- ASTM E114/E114M-15(2020); Standard Practice for Ultrasonic Pulse-Echo Straight-Beam Examination by the Contact Method. ASTM International: West Conshohocken, PA, USA, 2020.
Disclaimer/Publisher’s Note: The statements, opinions and data contained in all publications are solely those of the individual author(s) and contributor(s) and not of MDPI and/or the editor(s). MDPI and/or the editor(s) disclaim responsibility for any injury to people or property resulting from any ideas, methods, instructions or products referred to in the content. |
© 2025 by the authors. Licensee MDPI, Basel, Switzerland. This article is an open access article distributed under the terms and conditions of the Creative Commons Attribution (CC BY) license (https://creativecommons.org/licenses/by/4.0/).