Abstract
To achieve lightweight objectives in the aerospace sector, this paper systematically investigates the influence of unit cell topology on the quasi-static mechanical properties of Al-Mg-Sc-Zr alloy lattice structures fabricated by Selective Laser Melting (SLM). A comparative analysis of the mechanical response and failure mechanisms of eight distinct unit cell topologies was conducted through a combination of quasi-static compression and tensile experiments, finite element (FE) simulation, and fractography via Scanning Electron Microscopy (SEM). The results demonstrate that the mechanical performance is highly dependent on the unit cell topology. Under compression, the structures exhibited a layer-by-layer collapse, whereas under tension, they failed through sequential fracture of multiple struts initiated by stress concentration. Finite element simulations effectively predicted the general trends of the mechanical behavior; however, the actual strength and ductility of the SLM-fabricated specimens were lower than the simulated values due to intrinsic process-induced defects such as pores and lack of fusion. Analysis using the Maxwell index revealed that stretching-dominated structures possess superior specific modulus and specific strength compared to bending-dominated ones. Furthermore, among structures with similar Maxwell indices, those incorporating vertical struts demonstrated higher load-bearing efficiency. This study provides significant experimental and theoretical foundations for the design and application of high-performance lattice materials in lightweight structures.
1. Introduction
With the increasing demand for innovation-driven development and reduced energy consumption in the aerospace field, lightweight technology has become one of the key approaches to achieving these goals. By selecting lightweight materials, optimizing structures, and improving manufacturing processes, lightweight technology significantly reduces structural weight while ensuring performance. Lattice structures, as microstructures with periodic architectures, have attracted significant attention in the automotive, medical, and aerospace sectors due to their advantages such as light weight, high specific strength, and high energy absorption efficiency. Evans et al. [1] clearly defined the concept of lattice structures in 2001 and categorized them into truss-based lattice structures and triply periodic minimal surface (TPMS) structures. Based on their failure modes, lattice structures can be classified into bending-dominated and stretching-dominated types. Stretching-dominated structures resist external loads through axial tension and compression of the members, offering higher stiffness and strength, while bending-dominated structures are more prone to energy absorption. The Maxwell index (M) proposed by Deshpande [2] can be used to determine the failure mode of lattice structures: M < 0 indicates bending-dominated, and M ≥ 0 indicates stretching-dominated.
In terms of materials, Al-Mg-Sc-Zr alloy, as a new type of lightweight and high-strength material, can refine grains and enhance mechanical properties by forming Al3(Sc, Zr) phases through the addition of Sc and Zr elements [3,4]. This type of alloy has become a potential choice for lightweight components in aerospace applications. The fabrication of lattice structures was traditionally limited by difficulties in controlling process parameters. However, the emergence of additive manufacturing technology, particularly Selective Laser Melting (SLM), has overcome these bottlenecks. SLM technology enables high-precision forming of complex lattice structures by melting powder materials layer by layer, but the process is prone to defects such as pores and lack of fusion, which affect mechanical performance [5,6,7,8]. Despite these challenges, SLM offers distinct advantages in implementation simplicity, cost-effectiveness, and reduced production time compared to other additive manufacturing processes [9]. Furthermore, SLM effectively leverages the lightweight characteristics of materials such as the Al-Mg-Sc-Zr alloy and the design freedom inherent to additive manufacturing to produce complex, high-performance, and ultra-lightweight components that are not feasible with conventional manufacturing techniques [10]. It is also noteworthy that titanium or titanium alloy parts fabricated via SLM typically exhibit superior mechanical properties compared to those made from aluminum alloys. Therefore, SLM technology has been widely applied in the aerospace field. For example, the lattice structure satellite support bracket developed by Northwestern Polytechnical University achieved a 17% weight reduction and a 25% improvement in dynamic performance [11], demonstrating its advantages in lightweight applications.
1.1. Progress in Numerical Simulation Research on Metal Lattice Structures
To reduce the experimental cost and cycle time of lattice structures, numerical simulation has become an important research method. Finite element analysis software (such as ABAQUS) can effectively simulate the complex mechanical behavior of lattice structures, and its analysis process includes three stages: pre-processing, calculation, and post-processing. The simulation models of lattice structures mainly include beam-element-based and solid-element-based models: beam-element models are computationally efficient but struggle to capture the complex interactions at the intersections of members; solid-element models have high accuracy but require substantial computational resources.
In terms of material constitutive models, the Johnson–Cook (J-C) model is widely used in the simulation of metal lattice structures due to its consideration of strain hardening, strain rate strengthening, and thermal softening effects [12]. The parameters of this model need to be determined experimentally, and scholars have conducted J-C parameter fitting for various materials (such as 6008 aluminum alloy, 45 steel, etc.) [13,14,15,16,17].
1.2. Research Progress of Mechanical Properties of Lattice Structures
Under compressive loading, the stress–strain curve of lattice structures typically consists of three stages: elastic deformation, plastic plateau, and densification. This behavior is influenced by the competition between failure mechanisms such as compressive failure, bending failure, and fracture failure [18]. For instance, Li et al. [19] observed a similar curve in 316L stainless steel lattice structures. Under tensile loading, lattice structures exhibit four stages: elastic deformation, nonlinear elastic deformation, plastic deformation, and yield failure. However, they possess high brittleness, with the failure strain often being less than 5%. Li et al. [20] pointed out that the tensile strength of AlSi10Mg lattice structures has a linear relationship with the rod diameter. The mechanical property evaluation of lattice structures relies on the assumption of macroscopic properties when the number of unit cells is sufficiently large, and commonly uses experimental data from compression, tension, and bending tests.
Process parameters of SLM, such as laser power and scanning speed, directly affect the microstructure, which in turn influences the mechanical properties [21,22,23,24]. Giganto et al. [25] found that the laser scanning strategy is a key factor determining the mechanical properties of 17-4PH stainless steel parts fabricated by SLM. Li et al. [20] found that the AlSi10Mg lattice structure exhibits an increase in porosity and a decrease in compressive performance under either low or high laser energy density. Zhang et al. [26] improved the energy absorption capacity of the TC4 lattice structure by 27.1% through solution treatment, which is attributed to the transformation of the fracture mechanism from brittle to ductile. Meanwhile, post-processing treatments for SLM also significantly influence the material properties [27,28]. Leo et al. [29] discovered that heat treatment can modulate the matrix strength to lay the foundation for dynamic response.
The unit cell topology is a core factor influencing the mechanical properties of lattice structures. Common unit cells such as BCC, FCC, and TPMS (Triply Periodic Minimal Surface) exhibit distinct characteristics: Tian et al. [30] compared octahedral lattice structures and found that the octahedral type has the highest compressive strength; Maskery et al. [31] pointed out that the difference in elastic modulus among TPMS structures can reach 10 times; Habib et al. [32] demonstrated through Maxwell index analysis that stretch-dominated structures possess high stiffness, while bend-dominated structures exhibit excellent energy absorption performance.
Relative density (defined as the ratio of the apparent density of a lattice structure to the density of its base material) is a critical design parameter. Ahmadi et al. [33] clearly stated in their research that the compressive properties of lattice structures fabricated via SLM (Selective Laser Melting) additive manufacturing are highly dependent on relative density. Patek et al. [34] further elaborated on the underlying mechanism: the adjustment of relative density is essentially achieved by changing the rod diameter. An increase in rod diameter directly enhances the bending resistance and buckling resistance of individual struts, thereby significantly influencing the mechanical behavior and failure mode of the entire lattice structure. This viewpoint was verified by the experimental study conducted by Crupi et al. [35], who found that increasing the rod diameter (i.e., increasing the relative density) can simultaneously improve the compressive strength and compressive modulus of the lattice structure.
Defects induced by SLM—such as struts that are excessively thick, overly thin, or bent—are randomly distributed and can significantly alter mechanical behavior. Defects in SLM-fabricated lattice structures are primarily categorized into three types: strut dimensional deviations (excessive thickness or thinness), strut bending deformation, and surface-adhered powder, as well as internal pores. These defects are characterized by diversity and random distribution. Lei et al. [36] employed X-ray microcomputed tomography (μ-CT) to accurately acquire the true three-dimensional geometric information of struts in BCC and BCCZ lattice structures. Their results confirmed that the spatial distribution of these defects is random rather than uniform, which greatly increases the difficulty of predicting mechanical properties.
Liu et al. [37] demonstrated in their research that the quasi-static compression failure mechanism of octahedral and rhombohedral hexahedral lattice structures fabricated by Selective Laser Sintering (SLS) is simultaneously affected by the coupling effect of unit cell topology and random geometric defects. These defects significantly reduce the effective load-bearing area of the structure and cause local stress concentrations, which act as the origin of crack initiation. As a result, the actual strength and stiffness of the lattice structure are generally lower than the simulation predictions of the ideal model. For example, a strut with local bending or reduced diameter will experience buckling or fracture prior to other struts, thereby triggering a cascading failure of the entire structure and altering its expected deformation mode.
1.3. Purpose of This Study
This study provides significant insights into the lightweight design of lattice structures for aerospace applications by systematically evaluating the role of cell topology in the quasi-static mechanical behavior of additively manufactured Al-Mg-Sc-Zr alloys. Key findings demonstrate that stretching-dominated structures, identified via Maxwell index analysis, offer superior specific modulus and strength compared to bending-dominated ones, with vertical struts enhancing stability. The integration of experimental tests, finite element simulations, and fracture analysis underscores the impact of manufacturing defects like pores on performance, offering a theoretical basis for optimizing lattice designs in weight-critical sectors.
2. Materials and Methods
2.1. Material Design and Manufacturing
Under two different loading conditions—quasi-static compression and quasi-static tension—lattice structures exhibit distinct mechanical behaviors, and the influence of load type on mechanical properties is affected by the unit cell type. The 8 types of unit cells shown in Figure 1 were used as the basic library of initial unit cell topology, and the mechanical properties of the lattice structures corresponding to different unit cell topologies were obtained through experimental testing. Table 1 lists the strut diameter and density information of all unit cells. Among these parameters, the apparent density () of the lattice material is defined as the ratio of the core mass to the spatial volume it occupies; the relative density () is the ratio of the apparent density to the density of the base material ( = 2.7 g/cm3).
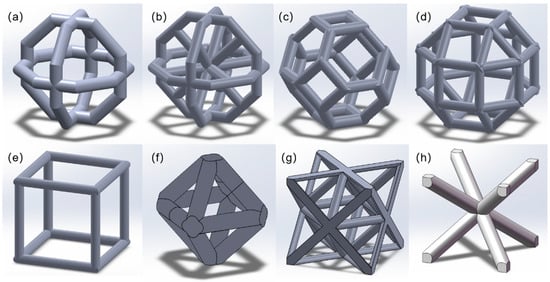
Figure 1.
The 8 types of unit cells used to investigate the mechanical properties of different unit cell topologies: (a) #1; (b) #2; (c) #3: Cubic Kelvin unit cell; (d) #4: Small rhombicuboctahedral type; (e) #5: Cubic type; (f) #6; (g) #7: Octet truss type (octet); (h) #8: BCC.

Table 1.
Rod diameter and density information for 8 cell topologies.
Figure 2 and Figure 3 show photographs of lattice structure specimens subjected to compression and tensile tests, respectively. All specimens were fabricated using the SLM method. The lattice structure specimens for quasi-static compression tests comprised cores with a three-dimensional repeat pattern of 4 × 4 × 4, along with 1mm-thick panels attached to the upper and lower end faces of the cores. The panels were incorporated to prevent core failure due to uneven stress distribution, and their inclusion had a negligible effect on the lattice structure’s mechanical properties. Individual unit cell dimensions were 10 mm × 10 mm × 10 mm, with the overall lattice structure measuring 40 mm × 40 mm × 40 mm. Due to the hollow nature of the lattice structure in quasi-static tensile tests, its density is non-uniform. If fixtures were directly clamped onto the lattice structure, the clamped lattice sections would undergo severe deformation during tensile loading and fracture prematurely. Therefore, a solid structure capable of being clamped was designed. Each sample, including its lattice core, facing panels, and solid gripping features, was integrated into a single build using SLM. The naming convention for quasi-static compression specimens is 1-X, while that for quasi-static tensile specimens is 2-X, where X denotes the cell number.
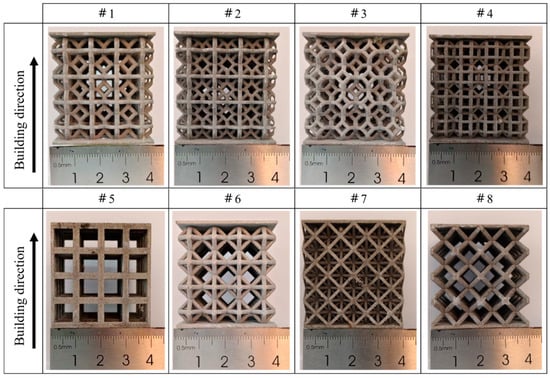
Figure 2.
Lattice Structure Compression Specimen.
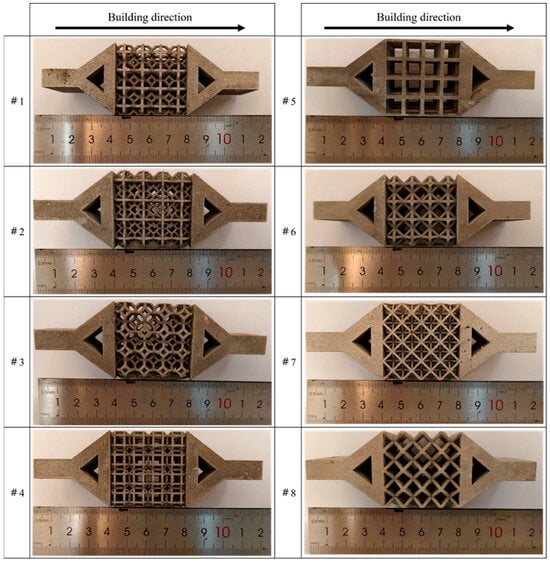
Figure 3.
Lattice-structured tensile specimen.
The specimen is an Al-Mg-Sc-Zr lattice structure produced by the FS271 equipment of Huashu High-Tech Co., Ltd. (Changsha, China). The process utilized Al-Mg-Sc-Zr alloy powder particles with a particle size range of 15–53 μm. The powder composition is presented in Table 2. The key process parameters included a laser power of 440 W, scanning speed of 1200 mm/s, hatch spacing of 120 μm, layer thickness of 40 μm, and a stripe scanning strategy with a 67° rotation between consecutive layers. Following fabrication, the sample underwent heat treatment at 352 °C for 4 h to eliminate microstructural anisotropy in the matrix material. Through systematic parameter optimization, the implemented process parameters effectively prevent lack-of-fusion defects caused by insufficient energy density and keyhole porosity resulting from excessive energy input, achieving a maximum relative density exceeding 99.5%. This is corroborated by metallographic analysis of the printed material, like Figure 4b, which reveals no significant defects in the specimen. Meanwhile, aging at 325 °C for 4 h enables the Al-Mg-Sc-Zr alloy to attain a peak hardness of 160 HV, attributable to the precipitation of finely dispersed (2–5 nm), coherent precipitates with the highest number density. Elevated temperatures lead to noticeable coarsening of these precipitates and consequent degradation of properties, thus establishing the 325 °C/4 h treatment as the optimal regimen.

Table 2.
Primary Elements and Their Mass Fractions in Al-Mg-Sc-Zr Alloy.
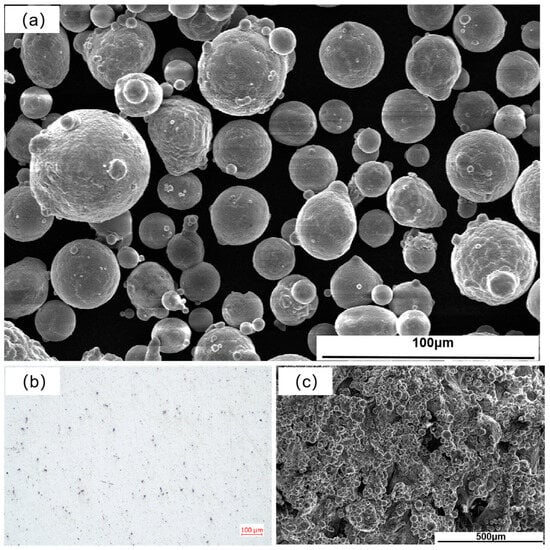
Figure 4.
Microstructural morphology of the Al-Mg-Sc-Zr alloy: (a) SEM image of the metal powder; (b) Metallograph of the bulk material; (c) Surface morphology of the strut.
2.2. Test Method
Quasi-static compression and tensile tests on lattice structures were conducted on an Instron 5985 universal testing machine (Instron, Norwood, MA, USA), with a loading strain rate of 0.001/s specified in accordance with GB/T 7314-2017 [38] and GB/T 228.1-2021 [39]. During quasi-static compression testing of lattice structures, a camera simultaneously recorded the deformation process, as shown in Figure 5. During loading, the upper indenter moved downward to compress the specimen while the lower indenter remained stationary. All specimens were loaded to full consolidation. For quasi-static tensile tests on lattice structures, an Instron 2663-821 video extensometer (Instron, Norwood, MA, USA) simultaneously recorded engineering strain. Tests employed axial tension, with the lattice structure’s clamping ends secured in the testing machine’s grips, positioning the specimen lengthwise perpendicular to the horizontal plane. Testing concluded upon material fracture. The experimental setup is shown in Figure 6.
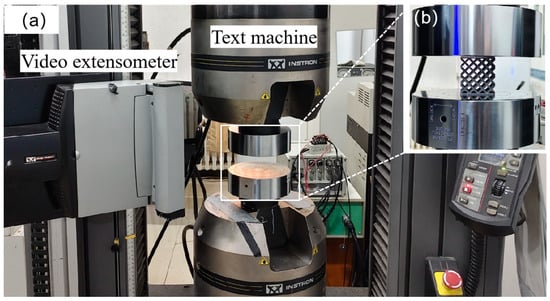
Figure 5.
Quasi-static compression test setup for lattice structures: (a) Overall view of the universal testing machine without specimen; (b) Close-up view with specimen positioned.
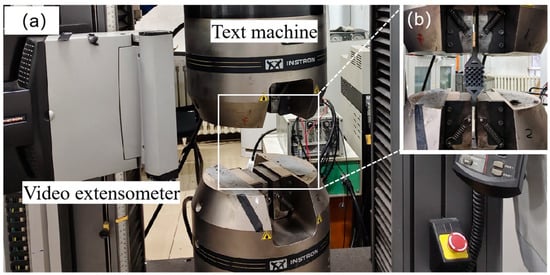
Figure 6.
Quasi-static Tensile Testing Apparatus for Lattice Structures: (a) Overall view of the universal testing machine without specimen; (b) Close-up view with specimen positioned.
Engineering stress–strain curves are extracted via the signal acquisition equipment integrated with the universal testing machine. These engineering stress–strain curves must be converted to true stress–strain curves through calculation during the fitting process of the Johnson–Cook model parameters, using the following formula:
where denotes true strain, denotes engineering strain, denotes true stress, and denotes engineering stress.
Three independent specimens were fabricated and tested for each unit cell type to ensure the statistical reliability of the results. All stress–strain curves were plotted based on the average data obtained from the three repeated experiments. The experimental results indicate excellent reproducibility among the specimens, with deviations in key mechanical parameters controlled within 5%.
2.3. Numerical Simulation Method
To gain a more comprehensive understanding of the stress state of specimens during quasi-static compression and quasi-static tensile processes, ABAQUS/Explicit finite element analysis was employed to numerically simulate the mechanical behavior of various lattice structures. The density, elastic modulus, and Poisson’s ratio of the Al-Mg-Sc-Zr alloy were 2.7 g/cm3, 70 GPa, and 0.33, respectively. First, the Johnson–Cook constitutive parameters for the SLM-fabricated Al-Mg-Sc-Zr alloy were determined. Using the Abaqus/CAE (2018) software’s Dynamics Analysis module, numerical simulations were conducted for quasi-static compression and quasi-static tensile tests on the lattice structures.
A representative finite element model of the lattice structure is shown in Figure 7. The quasi-static compression test simulation process involved creating reference points RP1 and RP2 at the centers of the upper and lower end faces, respectively. A displacement boundary condition was applied at reference point RP2 along the Z-axis, restricting degrees of freedom in other directions, while reference point RP1 was fully fixed. The lattice structure finite element model was discretized using tetrahedral (Tet) meshes. The optimal element size was determined through systematic mesh convergence studies, ultimately adopting a universal mesh size of 0.15 mm.
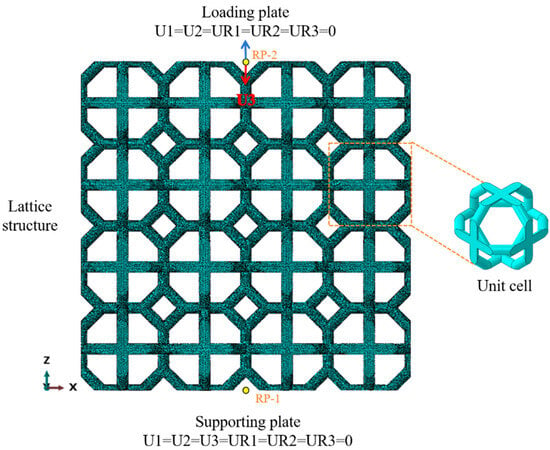
Figure 7.
Finite Element Model Diagram: Taking cell #1 as an example, the red arrows indicate the loading direction for quasi-static compression simulation tests, while the blue arrows indicate the loading direction for quasi-static tension simulation tests.
The Johnson–Cook model is a viscoplastic model derived from experimental data and widely applicable to metals. It is extensively used in the analysis of finite element problems, yielding excellent simulation results. The Johnson–Cook flow stress equation is expressed as follows:
In the equation, A represents the quasi-static yield strength of the material; B and n are strain hardening exponents; C is the strain rate sensitivity coefficient; m is the temperature sensitivity coefficient of the material; is stress; is the equivalent plastic strain; is the dimensionless plastic strain rate, where is the dynamic strain rate and = 0.001/s is the reference strain rate; T is the instantaneous material temperature; Tr is the room temperature; Tm is the material melting point.
To determine the constitutive parameters, quasi-static compression tests and dynamic compression tests were conducted on SLM-manufactured Al-Mg-Sc-Zr alloy specimens per the specifications in Figure 8a, while high-temperature compression tests were performed on specimens per the specifications in Figure 8b. The obtained parameters are shown in Table 3. To assess the difference in mechanical properties between the vertical (V) and horizontal (H) directions of the substrate, specimens were machined according to Figure 8 and subjected to quasi-static tensile tests. Table 4 presents the tensile test results for the V-specimen and H-specimen. The results indicate minimal variation in mechanical properties between the vertical and horizontal directions of the substrate. Since the specimens were solely loaded along their build direction, the potential anisotropy of the lattice structures is not discussed here and will be addressed in future studies.
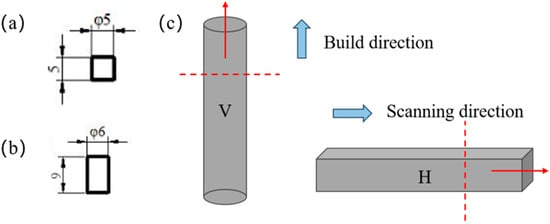
Figure 8.
Schematic of specimen machining dimensions and orientation: (a) Specimens for quasi-static compression and dynamic compression tests; (b) Specimens for high-temperature compression tests; (c) Bulk materials prepared parallel (V) and perpendicular (H) to the print growth direction for testing matrix material properties.

Table 3.
Material Parameters for SLM Preparation of Al-Mg-Sc-Zr Alloy.

Table 4.
Comparison of Tensile Mechanical Properties for V Specimens and H Specimens.
3. Results and Discussion
3.1. Effect of Cell Topology on the Compressive Mechanical Properties of Lattice Structures
3.1.1. Compression Test Results and Simulation Results
The stress–strain curves corresponding to lattice structures with eight different unit cell topologies are shown in Figure 9. The engineering stress and strain for the lattice structures during testing were acquired directly from the signal acquisition system of the Instron 5985 universal testing machine. The results indicate that the shapes of the engineering stress–strain curves for lattice structures with different unit cell topologies exhibit significant differences, demonstrating that the unit cell topology has a significant impact on their mechanical properties.
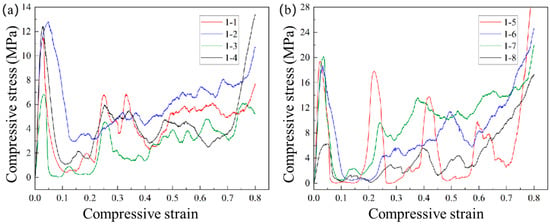
Figure 9.
Stress–strain curves from quasi-static compression tests on eight different cell topologies: (a) Stress-strain curves for test specimens 1-1 through 1-4; (b) Stress-strain curves for test specimens 1-5 through 1-8.
As shown in Figure 9, SLM-fabricated lattice structures exhibit distinct elastic deformation and densification stages in their compressive stress–strain curves. Between these stages, most specimens display multiple peaks below the initial peak stress, with the number of peaks generally matching the number of structural layers. As the bar fractures, the lattice structure experiences significant strength loss, causing pronounced fluctuations in the stress–strain curve between the elastic deformation and densification stages. Following densification, the structure’s compressive behavior gradually approaches that of bulk materials, with stress levels rising accordingly.
Under quasi-static compression conditions, the mechanical properties of lattice structures are typically evaluated using elastic modulus and yield strength. By extracting the slope of the elastic segment and the first stress peak from the quasi-static compression stress–strain curve, the elastic modulus and compressive strength of the lattice structure can be determined, respectively. The corresponding results are shown in Table 5.

Table 5.
Compressive modulus and compressive strength of 8 different lattice structures.
Figure 10 shows the comparison between the results obtained from the ABAQUS finite element simulation and experimental data. In the simulation results, the displacement at the reference point and the applied force were output. The stress of the lattice structure in the simulation was calculated as the displacement at the reference point divided by the model height, while the strain was defined as the applied force divided by the load-bearing area. Upon comparing the simulated and experimental curves, it is observed that the simulated curves typically exhibit a longer plastic deformation stage and higher failure strain than the experimental curves. In contrast, the experimental curves often show a tendency to exhibit a steep drop without a plateau section.
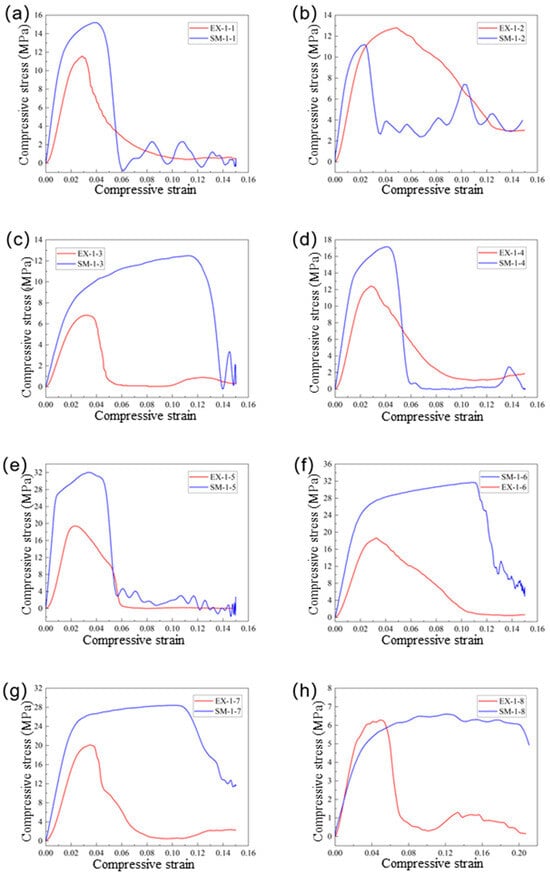
Figure 10.
Comparison of stress–strain curves from compression simulations and experimental stress–strain curves for eight cell topologies: (a) 1-1; (b) 1-2; (c) 1-3; (d) 1-4; (e) 1-5; (f) 1-6; (g) 1-7; (h) 1-8.
This discrepancy primarily stems from defects present in the actual printed specimens, such as pores, unfused powder, and inclusions, as shown in Figure 11. These defects significantly reduce the sample’s strength and hinder the material’s ability to undergo plastic deformation, leading to rapid fracture failure due to defect concentration before substantial plastic deformation can occur.

Figure 11.
Defects in SLM-fabricated lattice materials: (a) Unmelted particles on the rod surface; (b) Circular porosity in the fracture zone of the rod; (c) Particle inclusions within the rod.
To investigate the fracture mechanism of the lattice structure in depth, scanning electron microscopy (SEM) observations were conducted on the fracture surfaces of the rods after compression testing, with results shown in Figure 12. Numerous pores and ductile pits were visible on the fracture surfaces, indicating ductile fracture. No distinct crack radiating source was observed macroscopically, primarily because the lattice structure fractured instantaneously under extremely high loading. Cracks nucleated simultaneously at multiple locations, making it impossible to identify a single crack origin. All specimen fracture surfaces exhibited a composite morphology composed of rough zones and shear planes. Since fracture characteristics were similar across all eight cells, cell #4 is used here as an example to illustrate its microstructural details. The red-framed area in Figure 12d indicates the rough zone. Its high-magnification morphology (Figure 12d’) reveals tear ridges and ductile pits, characteristic of ductile fracture. The presence of tear ridges confirms that the rod experienced extremely high loads prior to fracture. Figure 12d’’ is an enlarged view of the green box in Figure 12d’, revealing fine, densely distributed ductile dimples around the pores. The pores exhibit distinct cracks, indicating that, as stress concentration points, they underwent significant plastic deformation, forming numerous ductile dimples. This manifests macroscopically as a rough surface. At this stage, the fracture is dominated by normal stress. Figure 12d’’’ presents an enlarged view of the blue box in Figure 12d. Here, the ductile dimples predominantly exhibit parabolic shear dimples. These dimples appear shallow and flat due to elongation along the shear direction, indicating a shear stress-dominated fracture mechanism. Comprehensive analysis indicates that a fracture in lattice-structured members results from the coupling of normal stress and shear stress. The fracture process can be described as follows: under compressive loading, cracks first initiate within the internal pore regions. Due to the widespread distribution of pores, multiple crack origins exist on the fracture surface, resulting in no discernible crack propagation path. Concurrently, the fracture surface experiences shear stress during fracture, ultimately forming a mixed fracture surface morphology where a rough zone and a shear plane coexist.
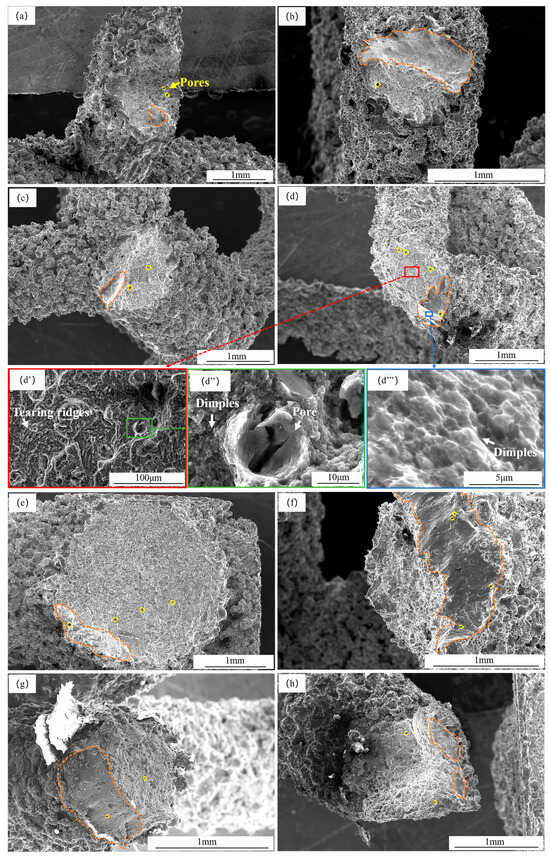
Figure 12.
Microstructures of compression fracture surfaces: (a) 1-1; (b) 1-2; (c) 1-3; (d) 1-4; (d’) Magnified image of the rough surface region of fracture 1-4; (d’’) Magnified image of pores in the rough surface area of fracture 1-4; (d’’’) Magnified image of the shear plane on the fracture surface of 1-4; (e) 1-5; (f) 1-6; (g) 1-7; (h) 1-8; Pores on the fracture surface are indicated by yellow circles, and orange areas denote shear planes.
3.1.2. Analysis Based on the Maxwell Index
When relative densities are similar, the mechanical properties of lattice structures are significantly influenced by the topology of unit cells. The mechanism by which unit cell topologies affect the mechanical properties of lattice structures is relatively complex. To quantify these characteristics, the deformation failure characteristics of unit cell topologies are empirically determined using the Maxwell index. In his paper, Deshpande employs the Maxwell parameter to assess the failure modes of lattice structures. Its expression is:
where b represents the number of structural members and j denotes the number of nodes. If M < 0, the number of members at the node is insufficient to balance external forces without inducing unbalanced moments, leading to bending stresses in the members and resulting in bending-dominated failure. If M ≥ 0, external loads are balanced through axial tension and compression of the members, preventing bending at the node; thus, these structures exhibit tension-dominated behavior. Generally, when subjected to external loads, cells with tensile-dominant failure modes exhibit greater stability, superior stiffness, and enhanced strength, thereby providing better load-bearing capacity.
Calculate the Maxwell indices for the lattice structures featuring the eight distinct cell topologies mentioned earlier. Assuming the lattice structure contains a sufficiently large number of cells n—i.e., neglecting the boundaries of the superstructure material—it can be considered that nodes or edges at the vertices, edges, and faces of a single cell are shared by multiple surrounding cells. Following a method analogous to calculating atomic counts in single units within material crystallography, the number of nodes j0 and the number of members b0 per cell are determined. Substituting it into Equation (5) yields:
When the number of unit cells is sufficiently large, the constant 6 in the Maxwell index formula can be neglected. Furthermore, since the eight superstructure materials share the same number of unit cells, the single-unit Maxwell index M is defined as follows for this study (all Maxwell indices mentioned below refer to the single-unit Maxwell index):
Table 6 presents the Maxwell index calculations for lattice structures with eight distinct cell topologies, alongside their specific modulus and specific strength values. The introduction of specific modulus and specific strength aims to eliminate the influence of minor differences in relative density among the eight lattice structures on mechanical property comparisons. The formulas for calculating specific modulus and specific strength are as follows:

Table 6.
Maxwell index and compression ratio performance data for lattice structures of 8 cell topologies.
In the equation, and represent the specific modulus and specific strength, respectively; E and denote the elastic modulus and compressive strength; is the apparent density of the lattice structure.
Figure 13a,b, respectively, show the relationship between the compressive strength and specific modulus of the lattice structure and the Maxwell exponent. As seen in the figures, for unit cells without vertical rods, both the specific modulus and specific strength of the superstructure material increase with rising Maxwell index. This trend also holds for unit cells with vertical rods. However, at comparable Maxwell indices, unit cells with vertical rods exhibit higher specific modulus and specific strength than those without vertical rods. Therefore, the qualitative relationship between cell topology and the specific modulus/specific strength of the superstructure material can be described as follows: both the specific modulus and specific strength of the superstructure material increase with the rise in the Maxwell index of the cell topology and the improvement in the stability of the cell truss structure. For cells with similar Maxwell indices, superstructures containing vertical rods exhibit superior specific properties compared to those without vertical rods.
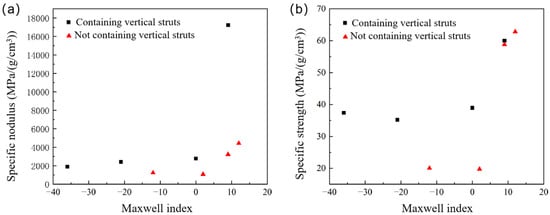
Figure 13.
Relationship between Maxwell index and the compressive modulus and specific strength: (a) The relationship between the specific modulus and the Maxwell index; (b) The relationship between the specific strength and the Maxwell index.
3.2. Effect of Cellular Element Topology on Tensile Mechanical Properties of Lattice Structures
3.2.1. Tensile Test Results and Simulation Results
Figure 14 displays the stress–strain curves for eight types of cellular lattice structures under quasi-static tensile conditions. During the initial loading phase, specimen deformation approaches elastic deformation. As the load increases, deformation gradually shifts toward plastic deformation, progressively intensifying until specimen failure occurs. The curve first exhibits an ascending phase as lattice structural members enter the initial tensile stage, where stress increases with elongation before fracture. After reaching a peak, the curve enters a descending phase. Experimental observations reveal that stress concentration points within the lattice structure begin to fracture sequentially, causing the internal stresses generated by stretching to decrease rapidly. Consequently, the overall strength of the lattice structure diminishes, resulting in a continuous decline in overall stress with increasing elongation during the descending phase. After reaching its peak, if all nodes on the fracture surface separate completely simultaneously, the stress drops directly to zero. The stress–strain curves indicate that SLM-printed lattice structures exhibit significant brittleness, with most structures showing engineering strains below 5%. The tensile elastic modulus and tensile strength extracted for each lattice structure are shown in Table 7.
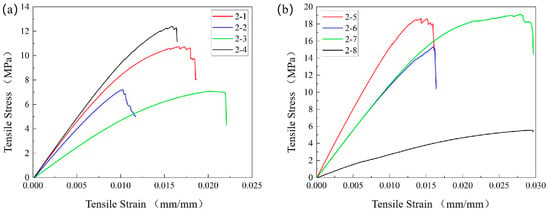
Figure 14.
Quasi-static stress–strain curves for eight different cell topologies: (a) Stress-strain curves for test specimens 2-1 through 2-4; (b) Stress-strain curves for test specimens 2-5 through 2-8.

Table 7.
Tensile Modulus and Tensile Strength of 8 Different Lattice Structures.
Comparing the stress–strain curves in Figure 10 and Figure 14 reveals that compression specimens generally exhibit superior plasticity compared to tensile specimens. Observation of fracture surfaces, as shown in Figure 15, confirms this: compression fracture surfaces feature more large-scale ductile dimples, and these dimples occupy a larger proportion of the entire fracture area, indicating better plastic deformation characteristics in compression specimens. The fracture surfaces exhibit numerous pores surrounded by dense yet fine dimples. This morphology indicates that significant plastic deformation had already occurred within the material prior to compressive fracture, demonstrating a certain capacity for plastic deformation. Consequently, compressive strength is higher than tensile strength.
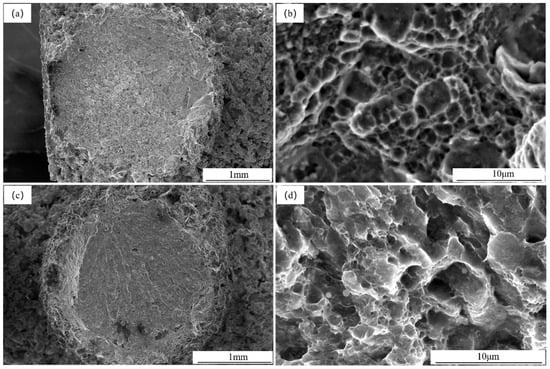
Figure 15.
Fracture surface morphology and ductile pits in compression and tensile tests of #5: (a) Fracture surface 1-5; (b) Ductile pits on fracture surface 1-5; (c) Fracture surface 2-5; (d) Ductile pits on fracture surface 2-5.
Figure 16 shows the comparison of stress–strain curves between experimental and simulated results for eight lattice structures under tensile loading. Similar to the compression case, the simulated curves also exhibit a more pronounced yield plateau. A detailed analysis of the failure mechanism reveals that stress concentration induced by porosity in the specimens often leads to successive fractures of multiple adjacent members. This failure mode causes the stress–strain curve to decline rapidly after reaching its peak, resulting in a small failure strain. In contrast, simulations, based on the assumption of a homogeneous continuum, concentrate failure primarily at isolated nodes or members, forming a progressive failure path.
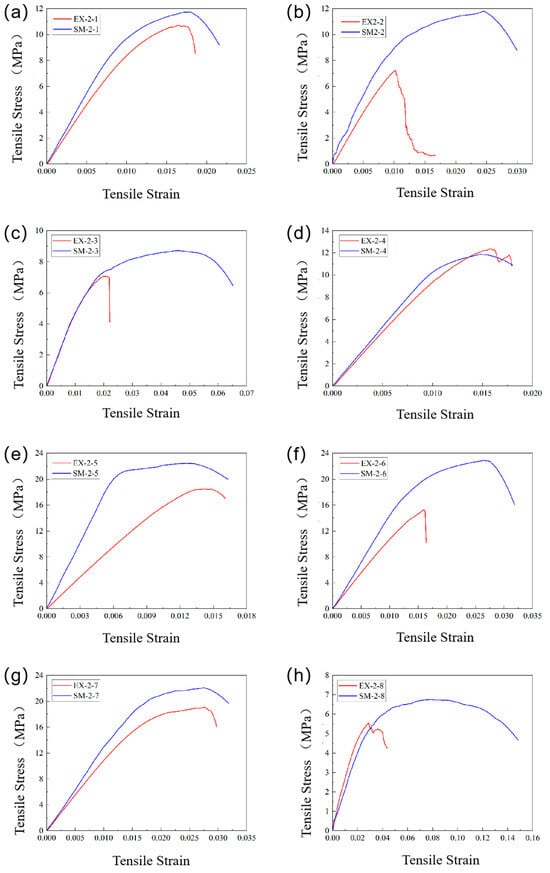
Figure 16.
Comparison of Stress–Strain Curves from Tensile Simulation and Experimental Data for Eight Cellular Lattice Topologies: (a) 1-1; (b) 1-2; (c) 1-3; (d) 1-4; (e) 1-5; (f) 1-6; (g) 1-7; (h) 1-8.
Compared to compression fracture surfaces, fewer shear planes were observed in tensile fracture surfaces, appearing only in small quantities on specimens #3, #4, and #8. The microstructure of these shear zones was identical to that in compression fracture surfaces, exhibiting shallow, flat shear dimples. In contrast, the roughened areas contained larger and more numerous dimples. The tensile fracture surface comprises multiple rough planes oriented in various directions, all covered with abundant ductile pits. Numerous circular pores surrounded by shallow ductile pits are also visible. Based on the widespread ductile pits in the fracture morphology, it can be inferred that the specimens should exhibit significant failure strain. However, as shown in Figure 15, the actual failure strain did not exceed 3%. Further analysis of the microstructure in Figure 17 reveals that this phenomenon is attributed to the presence of numerous micro-voids within the material. Although a large number of dimples were observed on the fracture surface, indicating the material’s inherent plastic potential, the actual fracture strain was lower than expected. The primary cause was identified as the intrinsic defects introduced by the SLM process. Under tensile loading, these defects acted as stress concentration points and crack initiation sites, leading to premature crack nucleation and propagation. Consequently, the material exhibited macroscopically brittle fracture behavior. Taking Specimen #5 as an example, Figure 17e’ shows a magnified image at the junction between a plane inclined at approximately 45° and a plane perpendicular to the tensile direction. Numerous dimples are visible on both planes, with tear edges clearly discernible on the plane perpendicular to the tensile direction. Further magnification in Figure 17e’’ reveals that the dimple sizes in both regions are comparable, indicating that despite differing stress orientations on the rough surfaces, their final morphologies are quite similar. Since Specimen #5 possesses the largest bar dimensions among all lattice units, its crack initiation and propagation paths are particularly pronounced. Figure 17e’’’ presents a magnified image of the crack initiation site, revealing numerous pores in this region. This further confirms that pores provide favorable conditions for crack nucleationshallow dimples are also visible. The widespread presence of dimples in the fracture morphology suggests the specimens should exhibit significant failure strain.
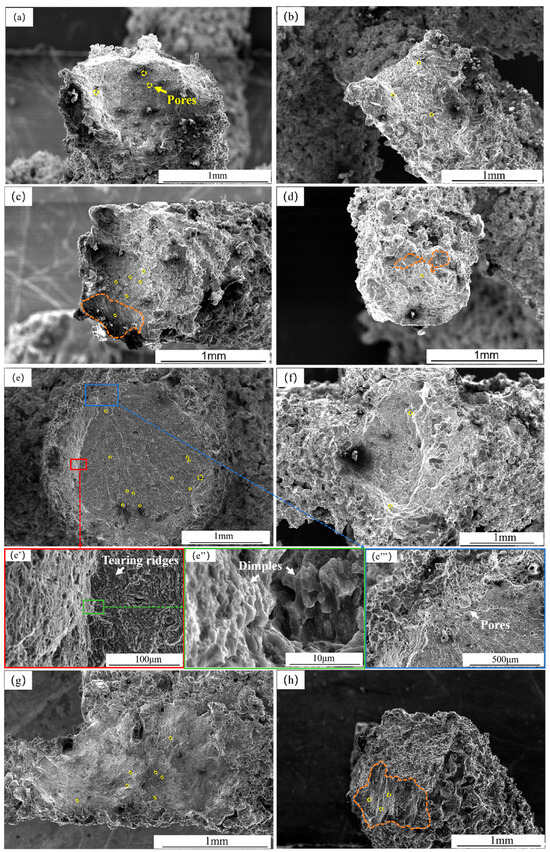
Figure 17.
Microstructures of tensile fracture surfaces: (a) 2-1; (b) 2-2; (c) 2-3; (d) 2-4; (e) 2-5; (e’) Magnified view of the junction between different planes on the fracture surface of 2-5; (e’’) Magnified view of the junction between different planes on the fracture surface of 2-5; (e’’’) Magnified view of the crack origin on the fracture surface of 2-5; (f) 2-6; (g) 2-7; (h) 2-8; The yellow circles indicate pores on the fracture surface, and the orange regions represent shear planes.
3.2.2. Analysis Based on the Maxwell Index
The Maxwell indices along with the tensile-specific modulus and strength of the lattice structures are presented in Table 8. Figure 18a,b show the relationship between the tensile specific strength and specific modulus of the lattice structure and the Maxwell index, respectively. Compared to parameters obtained from compression tests, the same pattern emerges in tensile tests: both the specific modulus and specific strength of the superstructure material increase with rising Maxwell’s index. Additionally, at similar Maxwell’s indices, unit cells containing vertical rods exhibit higher specific modulus and specific strength than those without vertical rods.

Table 8.
Maxwell indices and tensile ratio properties of lattice structures with 8 different cell topologies.
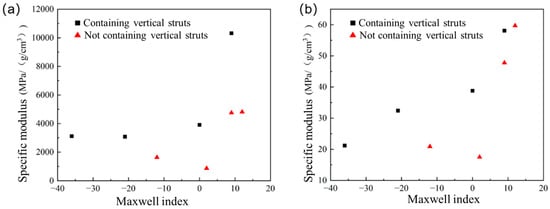
Figure 18.
Relationship between Maxwell’s exponent and tensile modulus and specific strength: (a) The relationship between the specific modulus and the Maxwell index; (b) The relationship between the specific strength and the Maxwell index.
4. Conclusions
This study fabricated eight Al-Mg-Sc-Zr alloy lattice structures with distinct unit cell topologies using selective laser melting technology. Systematic quasi-static compression and tensile tests were conducted, combined with finite element simulations and fracture analysis, to systematically investigate the influence mechanism of unit cell topology on the mechanical properties of lattice structures. The following key conclusions were drawn:
- (1)
- Under quasi-static compression loading, lattice structures exhibit failure through layer-by-layer collapse followed by densification. Under quasi-static tensile loading, however, the structures display higher brittleness characteristics, with failure strains generally below 5%. Failure originates from rapid successive fractures of rod phases at stress concentration points, causing stress–strain curves to exhibit abrupt drops after reaching peak values.
- (2)
- Finite element simulations effectively predict the mechanical response of lattice structures. The trends in stress–strain curves from simulations and experiments are generally consistent, though differences exist in the plastic stage and failure strain. Simulated curves typically exhibit longer yield plateaus and larger failure strains, while experimental curves show earlier fracture due to defects like voids and unfused regions introduced during SLM fabrication.
- (3)
- The mechanical properties of lattice structures are fundamentally governed by their cell topology, as explained by the load-bearing mechanisms characterized by the Maxwell index. Stretching-dominated topologies (M ≥ 0), which utilize efficient axial loading of struts, exhibit superior specific modulus and strength, whereas bending-dominated topologies (M < 0) fail through less efficient bending moments. Moreover, an increase in the Maxwell index generally enhances both specific modulus and strength. It is also noteworthy that for topologies with similar Maxwell indices, the incorporation of vertical struts significantly improves structural stability, leading to higher specific modulus and strength under both compression and tension.
- (4)
- Fracture analysis indicates that lattice structures exhibit ductile fracture behavior under both compressive and tensile loading. Compressive fractures feature larger and more widespread ductile dimples, demonstrating superior plasticity. Under tensile loading, defects such as pores inherent to the SLM process readily act as crack initiation sites, leading to fracture at relatively low strains. Consequently, despite the presence of dimpled features characteristic of plastic fracture on the fracture surface, the material exhibits a pronounced tendency for macroscopically brittle failure.
Author Contributions
Conceptualization, J.L., Z.Y., Y.G., Z.L. and Y.W.; Methodology, J.L., Z.Y., Y.G., Z.L. and Y.W.; Investigation, J.L. and Y.W.; Resources, Y.W., Y.G. and Z.Y.; Writing—original draft, J.L.; Visualization, J.L.; Supervision, Z.L., Y.G., Z.Y. and Y.W.; Project administration, Z.L., Y.G., Z.Y. and Y.W.; Funding acquisition, Z.L., Y.G. and Z.Y. All authors have read and agreed to the published version of the manuscript.
Funding
The authors gratefully acknowledge the financial support of this work by the National Key Laboratory Foundation of Science and Technology on Materials under Shock and Impact “WDZC2024-1”.
Data Availability Statement
The original contributions presented in this study are included in the article. Further inquiries can be directed to the corresponding author.
Conflicts of Interest
Authors Zhiwei Luo, Yanwu Guo and Zhenyu Yan were employed by Capital Aerospace Machinery Corporation Limited. The remaining authors declare that the research was conducted in the absence of any commercial or financial relationships that could be construed as a potential conflict of interest.
References
- Evans, A.G.; Hutchinson, J.W.; Fleck, N.A.; Ashby, M.F.; Wadley, H.N.G. The topological design of multifunctional cellular metals. Prog. Mater. Sci. 2001, 46, 309–327. [Google Scholar] [CrossRef]
- Deshpande, V.S.; Fleck, N.A.; Ashby, M.F. Effective properties of the octet-truss lattice material. J. Mech. Phys. Solids 2001, 49, 1747–1769. [Google Scholar] [CrossRef]
- Ekaputra, C.N.; Weiss, D.; Mogonye, J.-E.; Dunand, D.C. Eutectic, precipitation-strengthened alloy via laser fusion of blends of Al-7Ce-10Mg (wt.%), Zr, and Sc powders. Acta Mater. 2023, 246, 118676. [Google Scholar] [CrossRef]
- Kendig, K.L.; Miracle, D.B. Strengthening mechanisms of an Al-Mg-Sc-Zr alloy. Acta Mater. 2002, 50, 4165–4175. [Google Scholar] [CrossRef]
- Panwisawas, C.; Tang, Y.T.; Reed, R.C. Metal 3D printing as a disruptive technology for superalloys. Nat. Commun. 2020, 11, 2327. [Google Scholar] [CrossRef]
- Wang, M.; Yan, H.; Zhang, P. Particulate-reinforced Al-based metal matrix composites fabricated by selective laser melting: A comprehension review. Opt. Laser Technol. 2024, 176, 110918. [Google Scholar] [CrossRef]
- Wang, X.; Lu, Q.; Zhang, P. A review on the simulation of selective laser melting AlSi10Mg. Opt. Laser Technol. 2024, 174, 110500. [Google Scholar] [CrossRef]
- Wang, T.S.; Hua, Z.M.; Yang, Y. Macro-/micro-structures and mechanical properties of magnesium alloys based on additive manufacturing: A review. J. Mater. Sci. 2024, 59, 9908–9940. [Google Scholar] [CrossRef]
- Soni, N.; Renna, G.; Leo, P. Advancements in Metal Processing Additive Technologies: Selective Laser Melting (SLM). Metals 2024, 14, 1081. [Google Scholar] [CrossRef]
- Capasso, I.; Andreacola, F.R.; Brando, G. Additive Manufacturing of Metal Materials for Construction Engineering: An Overview on Technologies and Applications. Metals 2024, 14, 1033. [Google Scholar] [CrossRef]
- Zhu, J.; Zhou, H.; Wang, C.; Zhou, L.; Yuan, S.; Zhang, W. A review of topology optimization for additive manufacturing: Status and challenges. Chin. J. Aeronaut. 2021, 34, 91–110. [Google Scholar] [CrossRef]
- Johnson, G.R.; Cook, W.H. Fracture characteristics of three metals subjected to various strains, strain rates, temperatures and pressures. Eng. Fract. Mech. 1985, 21, 31–48. [Google Scholar] [CrossRef]
- Senthil, K.; Iqbal, M.A.; Chandel, P.S.; Gupta, N.K. Study of the constitutive behavior of 7075-T651 aluminum alloy. Int. J. Impact Eng. 2017, 108, 171–190. [Google Scholar] [CrossRef]
- Nahshon, K.; Pontin, M.G.; Evans, A.G.; Hutchinson, J.W.; Zok, F.W. Dynamic shear rupture of steel plates. J. Mech. Mater. Struct. 2007, 2, 2049–2066. [Google Scholar] [CrossRef]
- Dey, S.; Børvik, T.; Hopperstad, O.S.; Leinum, J.R.; Langseth, M. The effect of target strength on the perforation of steel plates using three different projectile nose shapes. Int. J. Impact Eng. 2004, 30, 1005–1038. [Google Scholar] [CrossRef]
- Iqbal, M.A.; Senthil, K.; Sharma, P.; Gupta, N.K. An investigation of the constitutive behavior of Armox 500T steel and armor piercing incendiary projectile material. Int. J. Impact Eng. 2016, 96, 146–164. [Google Scholar] [CrossRef]
- Seo, S.; Min, O.; Yang, H. Constitutive equation for Ti–6Al–4V at high temperatures measured using the SHPB technique. Int. J. Impact Eng. 2005, 31, 735–754. [Google Scholar] [CrossRef]
- Ostos, J.B.; Rinaldi, R.G.; Hammetter, C.M.; Stucky, G.D.; Zok, F.W.; Jacobsen, A.J. Deformation stabilization of lattice structures via foam addition. Acta Mater. 2012, 60, 6476–6485. [Google Scholar] [CrossRef]
- Li, P.; Wang, Z.; Petrinic, N.; Siviour, C.R. Deformation behaviour of stainless steel microlattice structures by selective laser melting. Mater. Sci. Eng. A 2014, 614, 116–121. [Google Scholar] [CrossRef]
- Li, D.; Zhang, X.; Qin, R.; Xu, J.; Yue, D.; Chen, B. Influence of processing parameters on AlSi10Mg lattice structure during selective laser melting: Manufacturing defects, thermal behavior and compression properties. Opt. Laser Technol. 2023, 161, 109182. [Google Scholar] [CrossRef]
- Leo, P.; Antonio, D.P.; Teresa, P.; Michele, N. Al-Si10-Mg Manufactured by Selective Laser Melting: Microstructure Sensitivity to Close Values of the Heat Input. Metals 2023, 13, 590. [Google Scholar] [CrossRef]
- Tong, M.; Zhang, H.; Chen, C.; Hao, J.; Chen, Z.; Wang, F. Influence of laser power and scanning speed on microstructure evolutions and mechanical properties of the SLM fabricated Al–Mg–Mn–Sc–Zr alloy. J. Mater. Res. Technol. 2024, 33, 5018–5029. [Google Scholar] [CrossRef]
- Sghaier, T.A.M.; Sahlaoui, H.; Sallem, H.; Rech, J. Selective Laser Melting of Stainless-Steel: A Review of Process, Microstructure, Mechanical Properties and Post-Processing treatments. Int. J. Mater. Form. 2023, 16, 41. [Google Scholar] [CrossRef]
- Huang, M.; Yang, B.; Zhou, Y.; Guan, X.; Wang, Y.; Liao, Z. Effect of Processing Parameters on Tensile Properties and Microstructure of Selective Laser Melted AlSi10Mg Alloy. J. Mater. Eng. Perform. 2024, 34, 6001–6014. [Google Scholar] [CrossRef]
- Sara, G.; Susana, M.P.; Joaquín, B. Impact of the laser scanning strategy on the quality of 17-4PH stainless steel parts manufactured by selective laser melting. J. Mater. Res. Technol. 2022, 20, 2734–2747. [Google Scholar] [CrossRef]
- Zhang, M.; Yang, Y.; Wang, D.; Xiao, Z.; Song, C.; Weng, C. Effect of heat treatment on the microstructure and mechanical properties of Ti6Al4V gradient structures manufactured by selective laser melting. Mater. Sci. Eng. A 2018, 736, 288–297. [Google Scholar] [CrossRef]
- Khosravani, M.R.; Ayatollahi, M.R.; Reinicke, T. Effects of post-processing techniques on the mechanical characterization of additively manufactured parts. J. Manuf. Process. 2023, 107, 98–114. [Google Scholar] [CrossRef]
- Gautam, P.; Nag, A.; Hajnyš, J.; Měsíček, J.; Petrů, J. Investigating the impact of post-processing techniques on surface morphology and wettability of Inconel 718 components fabricated via selective laser melting. Eng. Sci. Technol. Int. J. 2025, 68, 102105. [Google Scholar] [CrossRef]
- Leo, P.; Riccardo, N.; Joaquin, B.; Sonia, B.; Claudio, M. Precipitation hardening stainless steel samples processed by additive manufacturing: Process parameters and thermo mechanical treatments effects on microstructure and corrosion resistance. Opt. Laser Technol. 2022, 156, 108547. [Google Scholar] [CrossRef]
- Tian, C.; Li, X.; Zhang, S.; Guo, G.; Ziegler, S.; Schleifenbaum, J.H.; Wang, L.; Rong, Y. Porous structure design and fabrication of metal-bonded diamond grinding wheel based on selective laser melting (SLM). Int. J. Adv. Manuf. Technol. 2019, 100, 1451–1462. [Google Scholar] [CrossRef]
- Maskery, I.; Aremu, A.O.; Parry, L.; Wildman, R.D.; Tuck, C.J.; Ashcroft, I.A. Effective design and simulation of surface-based lattice structures featuring volume fraction and cell type grading. Mater. Des. 2018, 155, 220–232. [Google Scholar] [CrossRef]
- Habib, F.N.; Iovenitti, P.; Masood, S.H.; Nikzad, M. Fabrication of polymeric lattice structures for optimum energy absorption using Multi Jet Fusion technology. Mater. Des. 2018, 155, 86–98. [Google Scholar] [CrossRef]
- Ahmadi, S.M.; Yavari, S.A.; Wauthle, R.; Pouran, B.; Schrooten, J.; Weinans, H.; Zadpoor, A.A. Additively Manufactured Open-Cell Porous Biomaterials Made from Six Different Space-Filling Unit Cells: The Mechanical and Morphological Properties. Materials 2015, 8, 1871–1896. [Google Scholar] [CrossRef]
- Płatek, P.; Sienkiewicz, J.; Janiszewski, J.; Jiang, F. Investigations on Mechanical Properties of Lattice Structures with Different Values of Relative Density Made from 316L by Selective Laser Melting (SLM). Materials 2020, 13, 2204. [Google Scholar] [CrossRef] [PubMed]
- Crupi, V.; Kara, E.; Epasto, G.; Guglielmino, E.; Aykul, H. Static behavior of lattice structures produced via direct metal laser sintering technology. Mater. Des. 2017, 135, 246–256. [Google Scholar] [CrossRef]
- Lei, H.; Li, C.; Meng, J.; Zhou, H.; Liu, Y.; Zhang, X.; Wang, P.; Fang, D. Evaluation of compressive properties of SLM-fabricated multi-layer lattice structures by experimental test and μ-CT-based finite element analysis. Mater. Des. 2019, 169, 107685. [Google Scholar] [CrossRef]
- Liu, L.; Kamm, P.; García-Moreno, F.; Banhart, J.; Pasini, D. Elastic and failure response of imperfect three-dimensional metallic lattices: The role of geometric defects induced by Selective Laser Melting. J. Mech. Phys. Solids 2017, 107, 160–184. [Google Scholar] [CrossRef]
- GB/T 7314-2017; Metallic Materials—Compression Test Method at Room Temperature. Standards Press of China: Beijing, China, 2017.
- GB/T 228.1-2021; Metallic Materials—Tensile Testing—Part 1: Method of Test at Room Temperature. Standards Press of China: Beijing, China, 2021.
Disclaimer/Publisher’s Note: The statements, opinions and data contained in all publications are solely those of the individual author(s) and contributor(s) and not of MDPI and/or the editor(s). MDPI and/or the editor(s) disclaim responsibility for any injury to people or property resulting from any ideas, methods, instructions or products referred to in the content. |
© 2025 by the authors. Licensee MDPI, Basel, Switzerland. This article is an open access article distributed under the terms and conditions of the Creative Commons Attribution (CC BY) license (https://creativecommons.org/licenses/by/4.0/).