You are currently viewing a new version of our website. To view the old version click .
Metals
  • Article
  • Open Access

17 November 2025

Reproducible Thermo-Fluid–Solid-Coupled Modeling of Wet Milling of Al6061: Parametric Influence and Surface Integrity Assessment

,
,
,
and
1
Fujian Key Laboratory of Intelligent Processing Technology and Equipment, Fuzhou 350100, China
2
School of Mechanical & Automotive Engineering, Fujian University of Technology, Fuzhou 350118, China
3
School of Education and Foreign Languages, Wuhan Donghu College, Wuhan 430212, China
4
School of Mechanical Science and Engineering, Huazhong University of Science and Technology, Wuhan 430079, China
Metals2025, 15(11), 1256;https://doi.org/10.3390/met15111256 
(registering DOI)

Abstract

Wet milling of aluminum alloys involves complex interactions among thermal, fluid, and mechanical fields that strongly affect cutting temperature, stress distribution, and surface integrity. To achieve reproducible and physics-based predictions of these coupled phenomena, this study develops a three-dimensional thermo–fluid–solid-coupled Eulerian–Lagrangian (CEL) framework for the wet milling of Al6061. The model system in this study evaluated the effects of milling cutter feed rate and spindle speed, feed per tooth of the milling cutter, axial cutting depth, and coolant flow rate on equivalent stress and peak milling temperature., as well as their correlation with surface roughness metrics (Ra, Sa). Simulation results reveal that higher feed rates significantly raise Tpeak (+12.9%) while reducing σeq (−22.7%) and deteriorating surface quality (Ra +104.2%, Sa +29.9%). Increasing spindle speed lowers both Tpeak (−2.2%) and σeq (−8.5%) and improves surface finish (Ra −39.3%, Sa −16.6%). A greater depth of cut amplifies mechanical and thermal loads, increasing Tpeak (+10.3%) and σeq (+17%). Enhanced coolant flow reduces Tpeak (−23.5%) and σeq (−6.1%) and markedly improves surface quality (Ra −88.8%, Sa −51.3%). Research findings indicate that coolant coverage is the dominant factor determining surface integrity. Although experimental data for Tpeak and σeq were not directly validated, this framework clearly articulates modeling assumptions, quantifies parameter sensitivities, and provides a reproducible methodology for future experimental-numerical verification.

1. Introduction

Aluminum alloys possess numerous outstanding properties, such as combining exceptional strength with lightweight characteristics, along with excellent corrosion resistance and superior ductility. Consequently, they are widely used in industries including construction, aerospace equipment, automotive, and electronics [,,,]. Its mass percentage composition is as follows: Mn 0.04, Zn 0.06, Cr 0.07, Ti 0.10, Cu 0.22, Fe 0.28, Si 0.76, Mg 0.92; the remainder is aluminum. After heat treatment, the precipitation of intermetallic compounds enhances the material’s strength []. Although their presence enhances the mechanical properties of 6000 series alloys [], they also introduce drawbacks such as negatively impacting surface quality during machining, reducing corrosion resistance [], and may cause scratches, dents, and microcracks []. Milling is a widely adopted and efficient machining process []; however, excessively high temperatures generate significant heat, which compromises the stability of the processing. Such temperatures may induce thermal stress, significantly deteriorating surface quality. Surface flatness exhibits a significant response when changes occur in rotational speed, cutting depth, feed rate, and coolant flow. During machining, most of the energy is converted into heat, which is conducted through the resulting machining debris or the machining equipment. Typically, temperatures generated during machining remain stable between 250 °C and 400 °C []. For AL6061 aluminum alloy, these internal precipitates can affect the surface quality of the workpiece during machining and also alter its material properties. Preliminary research indicates that cutting fluids serve dual functions of cooling and lubrication, thereby extending tool life. Their properties and application methods are adjusted according to specific conditions. This prevents thermal deformation issues within components and enhances workpiece surface quality. Extensive research indicates that surface integrity plays a critical role in part performance and fatigue life [,,], have not thoroughly examined these effects, the presence of precipitates is pivotal to the stock removal mechanism and chip generation in ultraprecision milling. In this context, cutting fluid serves an essential function by effectively lowering the milling temperature and removing chips generated during the cutting process.
At present, extensive research has been conducted both domestically and internationally on modeling the temperature field during cutting and grinding processes for typical materials such as superalloys and aluminum alloys. Han Zhao [] performed numerical simulations and experimental comparisons of the temperature field distribution in superalloys under various grinding parameters, with a particular focus on how grinding speed, feed rate, and depth of cut affect grinding heat. However, the model did not account for the microscopic heat conduction mechanisms at the abrasive-workpiece interface or the dynamic thermal regulation effect of coolant. Li Mengjie et al. [] analyzed the influence of cutting parameters on the cutting temperature of 7150-T6 aluminum alloy by combining the Johnson–Cook constitutive model with orthogonal experimental design. Nevertheless, the extensive simplifications in the model led to significant deviations between simulation and experimental results. As for the cooling effect during milling, most studies adopt convective heat transfer coefficients as thermal boundary conditions, which can significantly reduce computational cost. Among these, the heat transfer coefficient serves as the dominant parameter, typically determined through semi-empirical relationships or experimental regression methods []. However, such correlations are typically established under controlled laboratory conditions and struggle to accurately capture the transient fluid dynamics of coolants in complex real-world machining scenarios, such as jet impacts and vortex formation. Hui Liu [] proposed a numerical simulation approach based on the Coupled Eulerian–Lagrangian (CEL) method to investigate the thermodynamic effects of coolant flow on the cutting zone during metal machining. However, the method could not accurately capture the complex three-dimensional flow behavior under high-pressure injection. Moreover, the CEL model treated the boundary layer too simplistically, leading to overestimated heat transfer coefficients and cooling effects. Sharif Al-Sufyani [] proposed an analytical model to quantify the heat generation within the shear zone during grinding and its distribution characteristics along the shear plane, focusing on how different coolant delivery methods influence heat generation during milling. However, the use of idealized assumptions limits the model’s accuracy under complex machining conditions. Shuailing Lan [] constructed a heat source model for realistic grinding contact zones using a temperature matching method, emphasizing the temperature field distribution at various depths within the workpiece. By integrating finite element simulation with experimental data, the accuracy of temperature prediction was significantly improved. However, the model neglected convective heat transfer and the dynamic regulation effect of coolant on heat source distribution, which restricted its applicability under cooling conditions.
Despite extensive research on milling temperature modeling, three limitations remain: (1) it is difficult to characterize the transient interaction between the coolant jet and the surface (impingement, rebound, partial wetting) in high-speed wet milling, leading to uncertainty in temperature prediction; (2) existing CEL studies rarely disclose a reproducible modeling workflow (including explicit treatment of the coolant and details of the Eulerian–Lagrangian coupling) and lack numerical verification; and (3) within a unified design space, The relative effects of cutting oil flow rate, feed per tooth of the milling cutter, spindle speed, axial depth of cut, and cutting oil flow rate on Tpeak and σeq have not yet been fully quantified. This study employs the CEL method within a computational fluid dynamics (CFD) framework [] to establish a dynamic interaction model for simulating the interaction between cutting tools and coolant []. Meanwhile, to correspond to the numerically predicted temperature field and near-surface equivalent-stress response, we conduct trend-level characterization of surface topography and roughness to indirectly observe how process parameters affect near-surface thermo–fluid–solid interactions. The observed trends are consistent with the simulation results, indicating that the model provides a reasonable description of the thermo–fluid–solid coupling process (this work does not include direct experimental validation of temperature or σeq). The quantitative relationships between process parameters and temperature/σeq can inform the optimization of milling cooling strategies and nozzle orientation and provides a data-driven foundation for managing temperature and optimizing surface properties during precision machining.

2. Methodology

2.1. CEL Method

We employ a coupled Eulerian–Lagrangian solution strategy to address strongly nonlinear deformation and flow. The coolant is defined in the Eulerian domain, while the tool and workpiece are defined in the Lagrangian domain, coupled via a contact surface, Flow behavior of coolant within the Eulerian domain show in Figure 1. Solve the momentum and energy conservation equations in Eulerian domains, as well as the mass of the fluid. The Lagrangian domain solves the solid’s temperature and stress fields. Pressure-dependent thermal conduction contact properties are set at the interface, calculating heat flux based on temperature difference and contact pressure. During explicit time integration, the Euler–Lagrange interface synchronously updates temperature, stress, and energy exchange to obtain transient heat flux and mass transfer at the fluid-solid interface.
Figure 1. Flow behavior of coolant within the Eulerian domain.
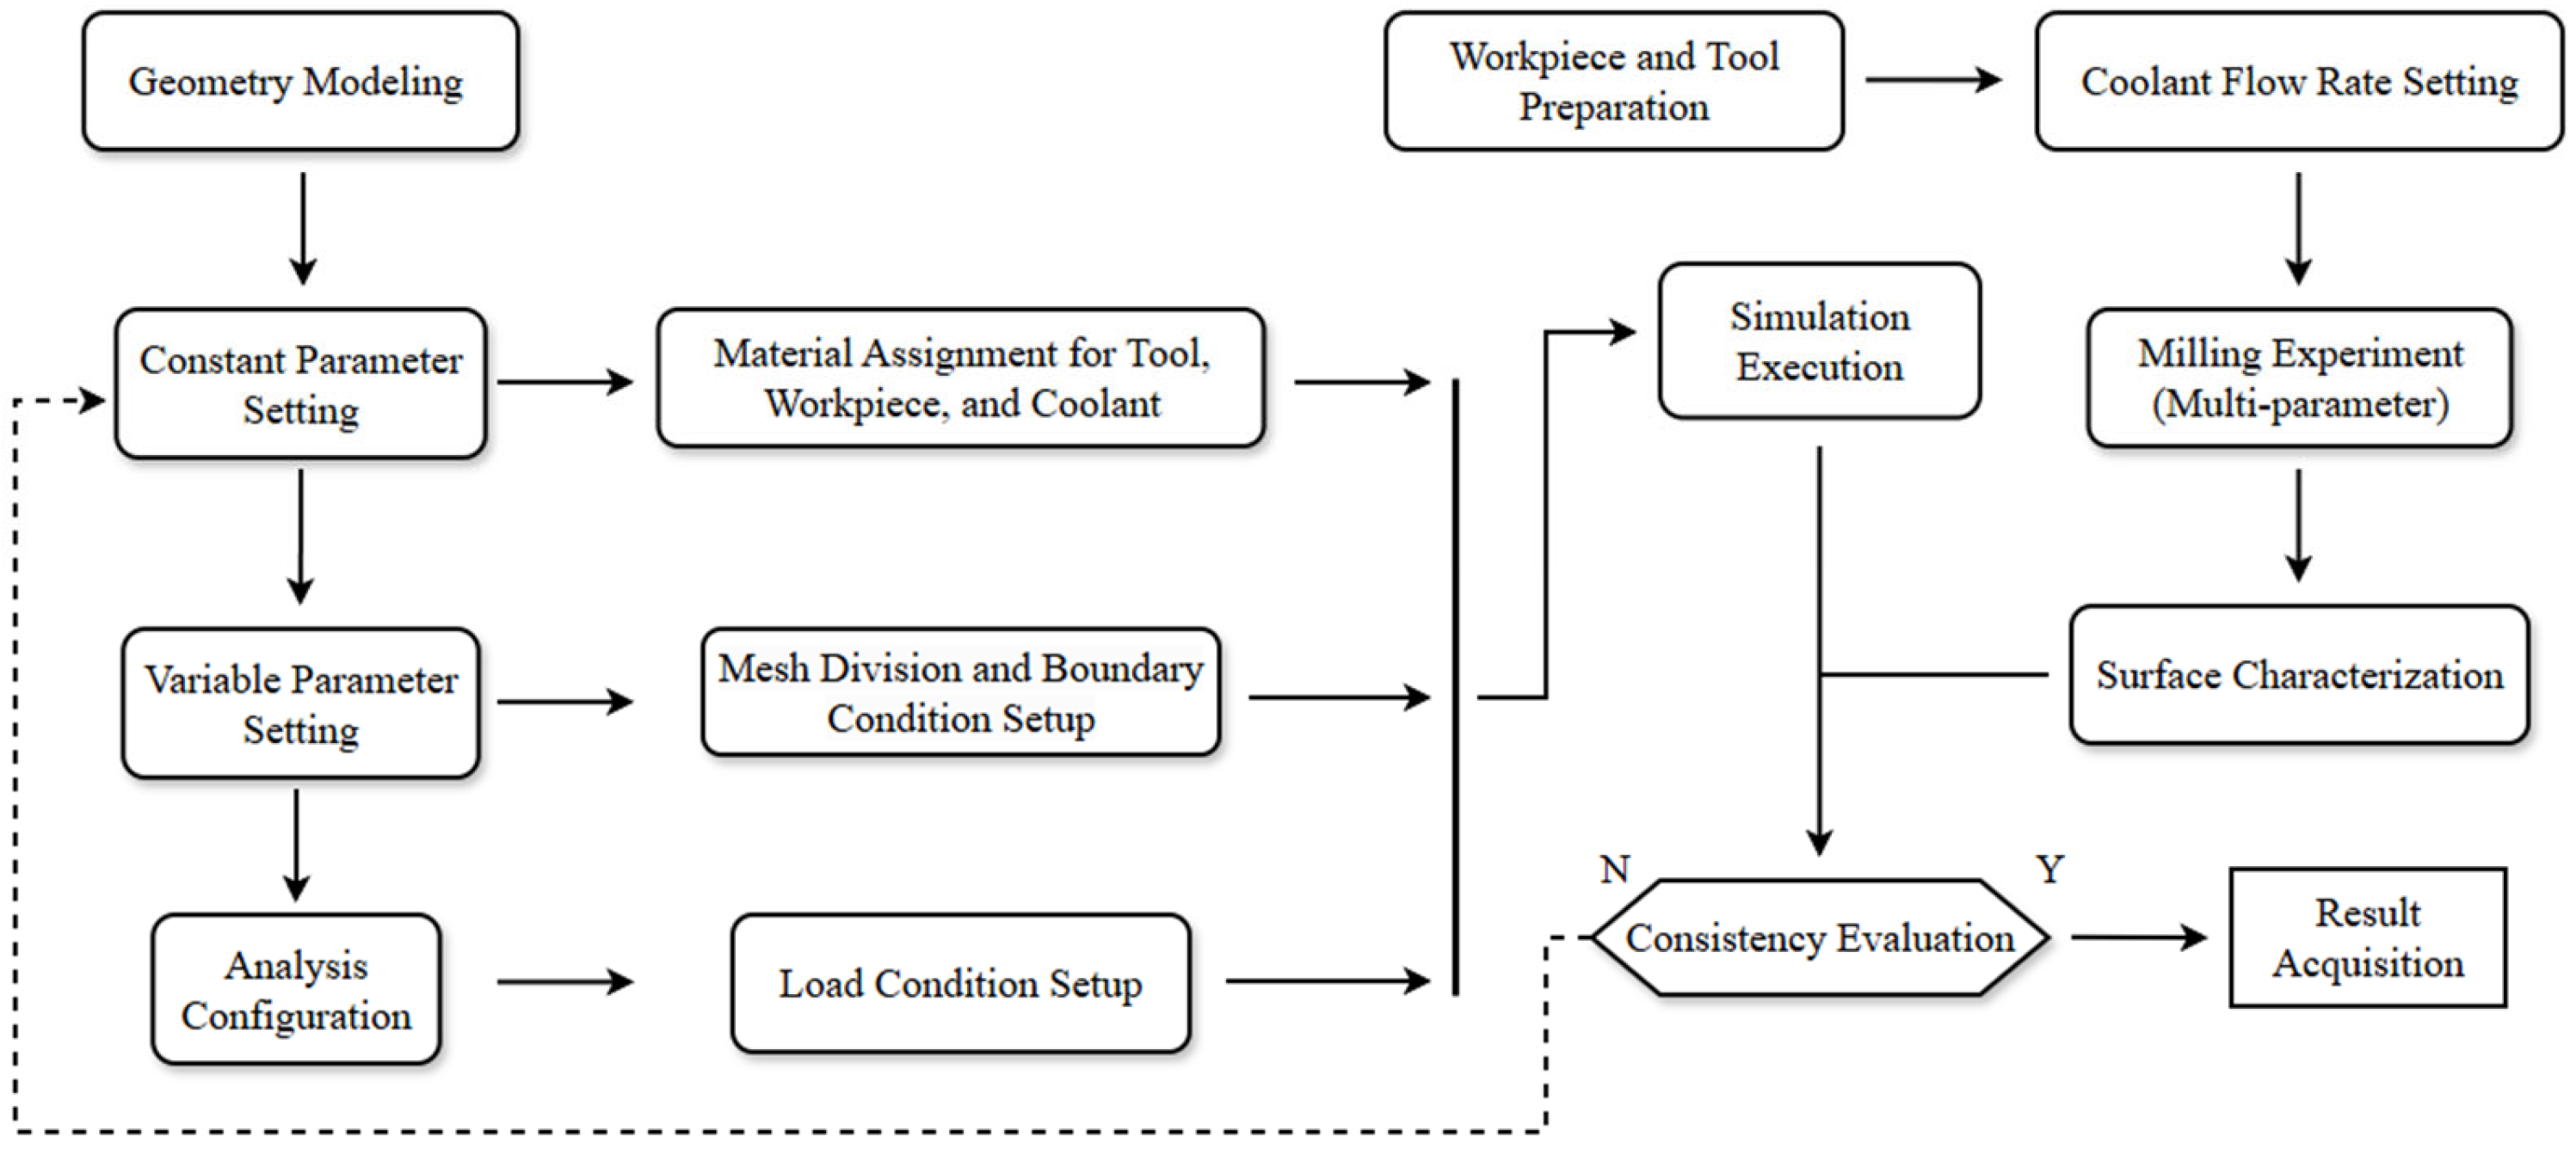
The flowchart shown in Figure 2 is divided into two main stages and presents the complete simulation workflow and surface-based trend validation process for analyzing different machining parameters using 3D thermo–fluid–solid-coupled milling model. In the numerical-simulation part, geometry modeling is carried out first, then material properties are assigned to the milling components, followed by mesh generation and the setting of boundary conditions. After applying loads, the simulation settings are finalized and the computations are performed. In the experimental part, the process starts with the preparation of the tool and workpiece, after which the coolant flow rate is set and milling experiments are conducted under different parameter conditions. Finally, the experimental results are characterized and compared with the simulation results to complete the validation.
Figure 2. Workflow integrating the 3D thermo–fluid–solid-coupled milling model and surface-based trend validation.

2.2. Modeling

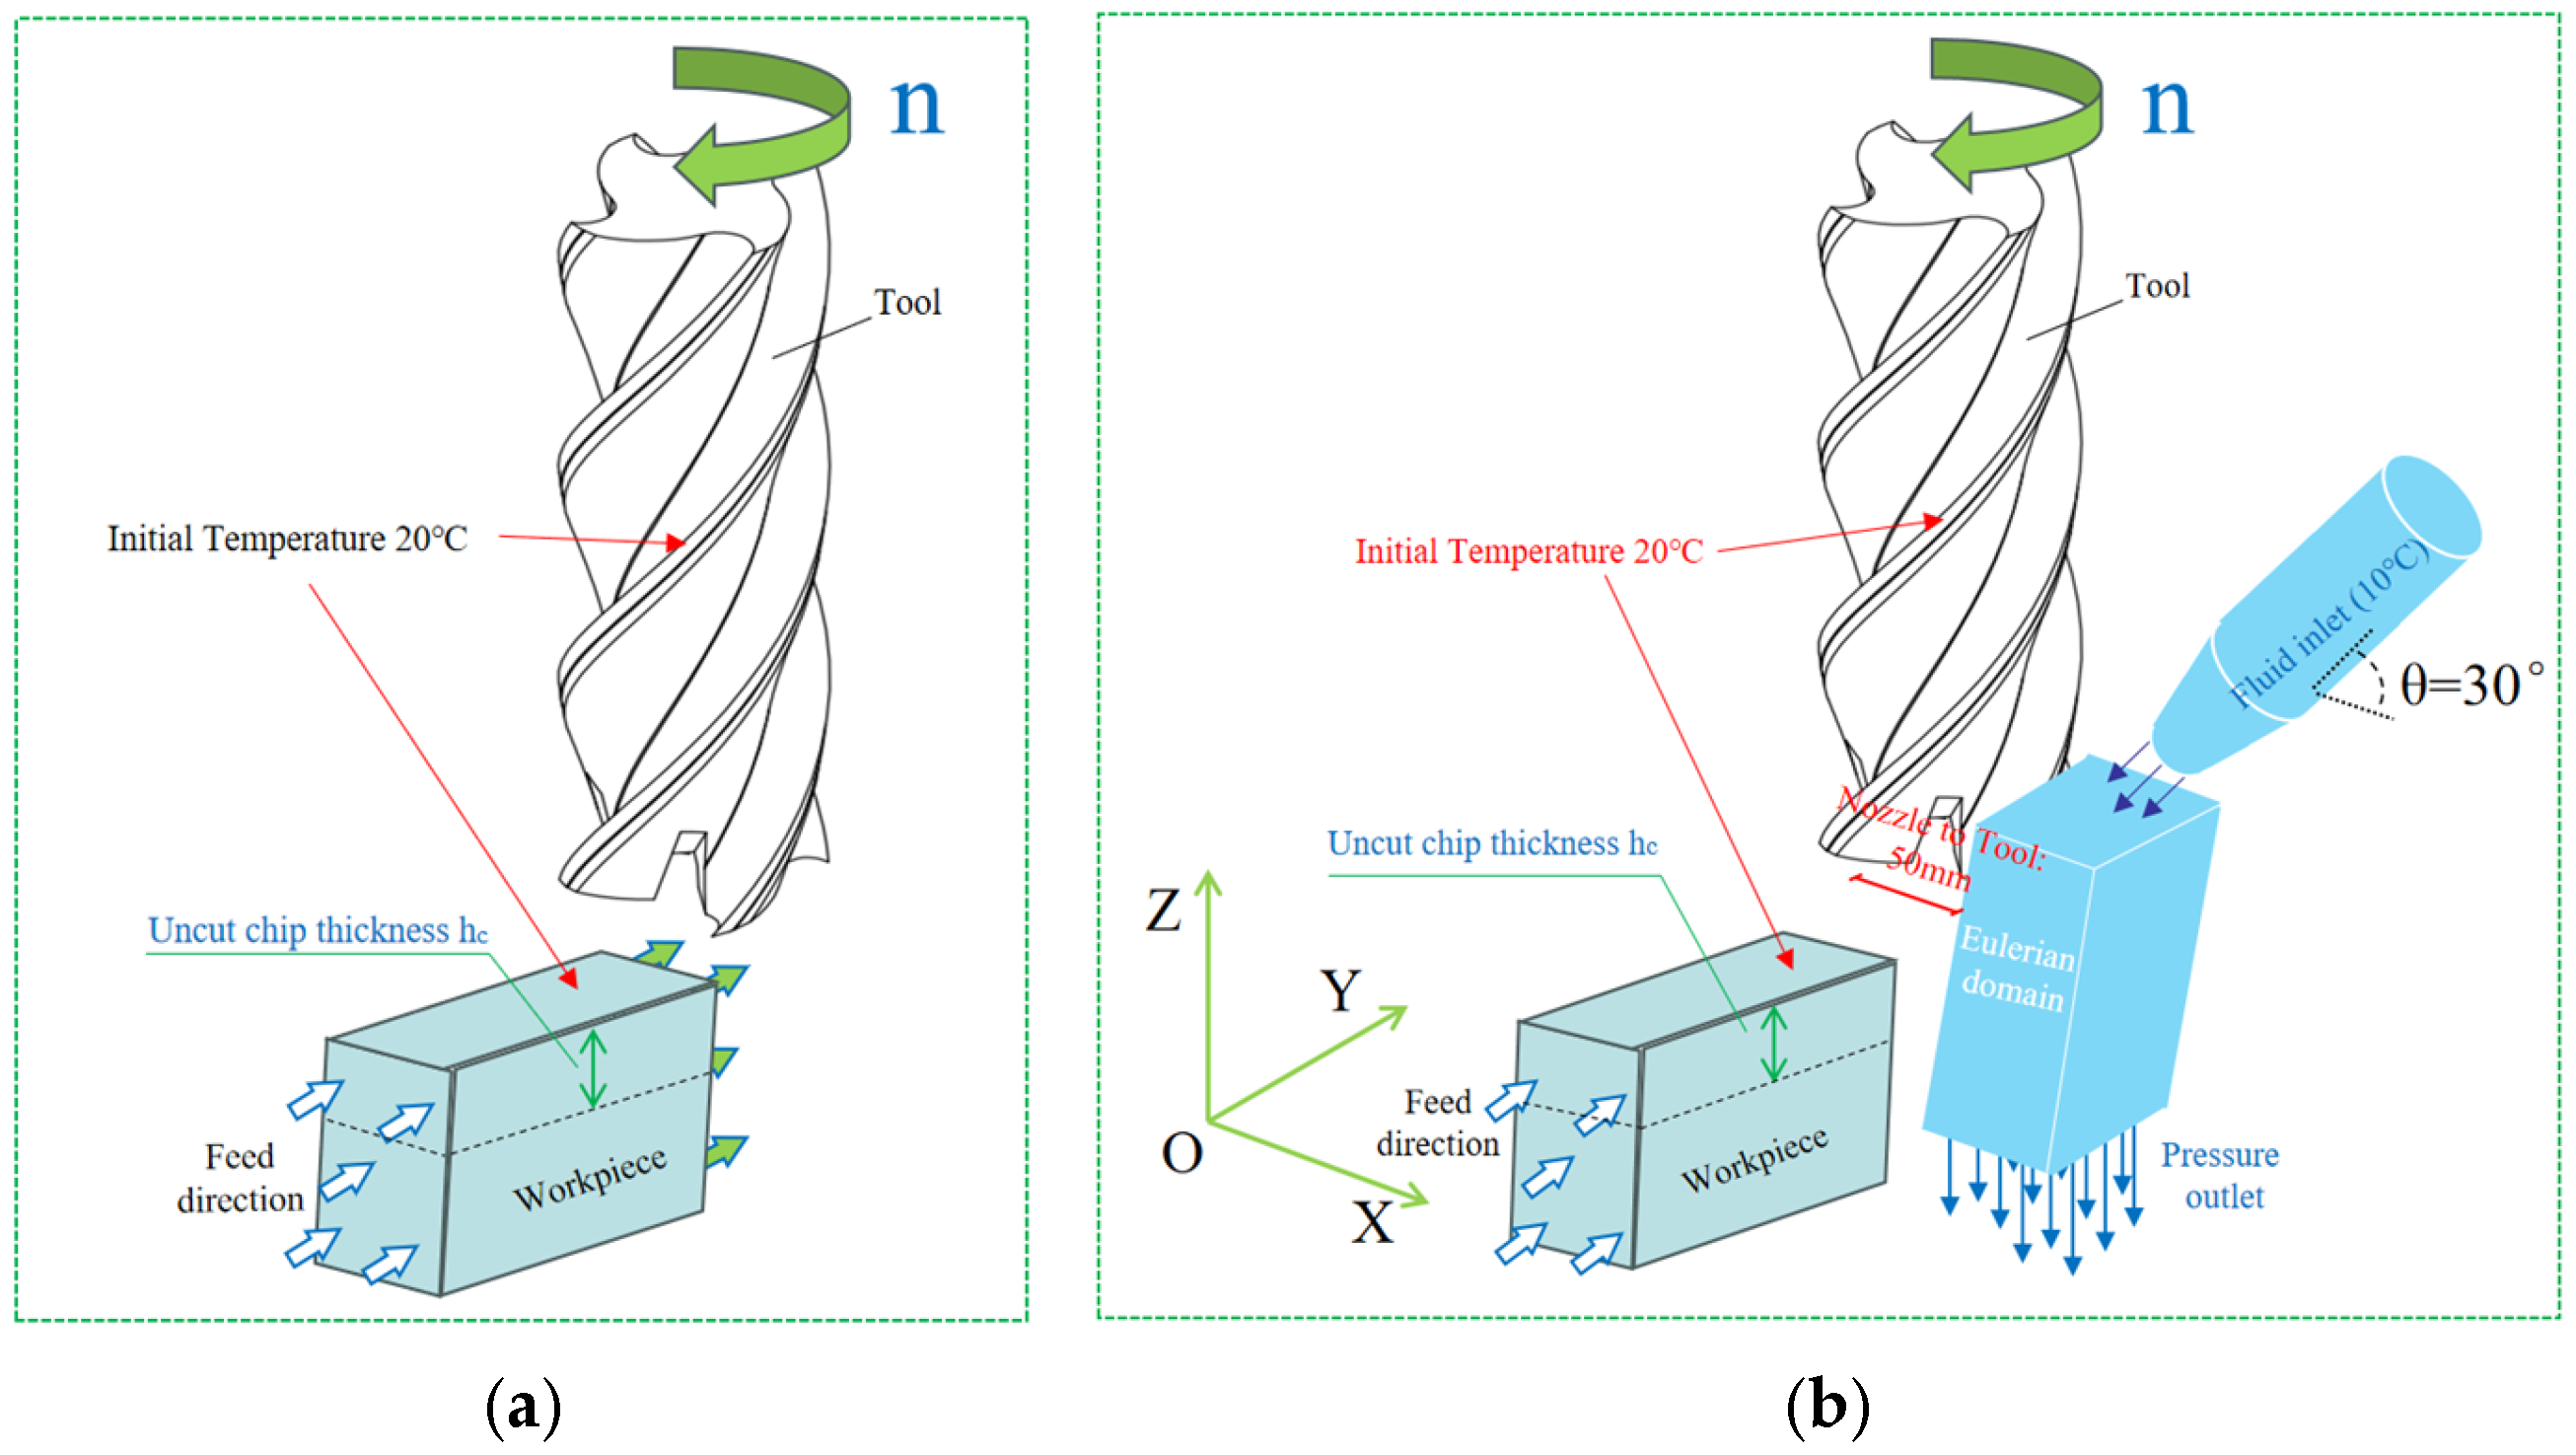
To investigate thermo–fluid–solid-coupled simulation during milling, the research platform utilized was Abaqus 2024 (Windows 11, Dassault Systèmes SIMULIA, Vélizy-Villacoublay, France). Figure 3a shows a schematic of the three-dimensional thermo–mechanical coupling model, and Figure 3b presents a schematic of the three-dimensional CEL-based thermo–fluid–solid coupling model.
Figure 3. Schematic diagram of 3D milling dynamics (a) and 3D milling simulation model based on the CEL method (b).
In Figure 3b, the Eulerian domain and the tool remain fixed in position; milling is carried out by feeding the workpiece horizontally along the Y-axis. The nozzle and the tool both lie in the X–Z plane, the distance between the tool spindle and the nozzle is 50 mm, and the jet angle in that plane is 30°.

2.3. Material Constitutive Model

The finite element method (FEM) offers significant advantages in complex machining processes and has demonstrated remarkable effectiveness in optimizing milling parameters. Classic constitutive models include the Power-Law model, Zerilli–Armstrong model, and Johnson–Cook (J-C) model. Unlike them, the Johnson–Cook model covers a broader range of phenomena and presents thermal softening, strain hardening, and strain rate hardening as a product effect [,], with the expression given by (1):
σ = ( A + B ε n ) ( 1 + C l n ε ˙ ε ˙ ) ( 1 ( T T T T ) m )
These material constants include A, B, C, n, and m. A: Yield stress, B: Strain hardening coefficient, C: Strain rate coefficient, n: Strain hardening index, m: Thermal sensitivity index. ε: Plastic strain, εo: Reference strain rate, T: Material deformation temperature, Tₘ: Melting point temperature, Tₒ: Ambient temperature. The J-C criterion is employed to define material element failure [] and the element damage is as shown in Equation (2):
D = ε ε f
In this equation, D is the material damage parameter, Δε is the increment of equivalent plastic strain, and εf is the failure strain, whose expression is given in Equation (3):
ε f = [ D 1 + D 2 exp ( D 3 p q ) ] [ 1 + D 4 l n ( ε ˙ ε ˙ ) ] [ 1 + D 5 l n ( T T T T ) ]
In this equation, p/q denotes the triaxiality of stress, and the damage function is denoted as Dᵢ (1 ≤ i ≤ 5). For the AL6061 aluminum alloy, the J-C constitutive model is more suitable for this study. In this research, use 0.9 as the value defining the conversion of plastic work into heat. Referencing the methodology of Akram S. et al. [,], the material parameters for the tool (compiled and adapted from []), workpiece (compiled and adapted from [,,]), and coolant (compiled and adapted from [,]) were determined. The tool is a 10 mm diameter four-flute end mill, with specific parameters detailed in Table 1, Table 2 and Table 3.
Table 1. J-C Parameters and Material Properties of AL6061 Aluminum Alloy.
Table 2. YG6X Tungsten Carbide Material Properties. Adapted from ref. [].
Table 3. Coolant Properties.

2.4. Mesh and Boundary Conditions

This study employs the ABAQUS 2024 finite element simulation platform to analyze phenomena during the milling process. To enhance computational efficiency, the milling cutter structure was appropriately simplified without compromising simulation results. First, the cutter body length was shortened, retaining only the portion contacting the workpiece. Second, the protruding section at the cutter tip center that does not contact the workpiece was simplified. Mesh sensitivity was assessed by testing five representative element sizes (0.2, 0.3, 0.5, 0.7, 1 mm). Results showed deviations within 5%, confirming the convergence criteria for peak cutting temperature and equivalent stress. Energy closure error was calculated, with Energy equilibrium error < 3% and static criteria < 5%.
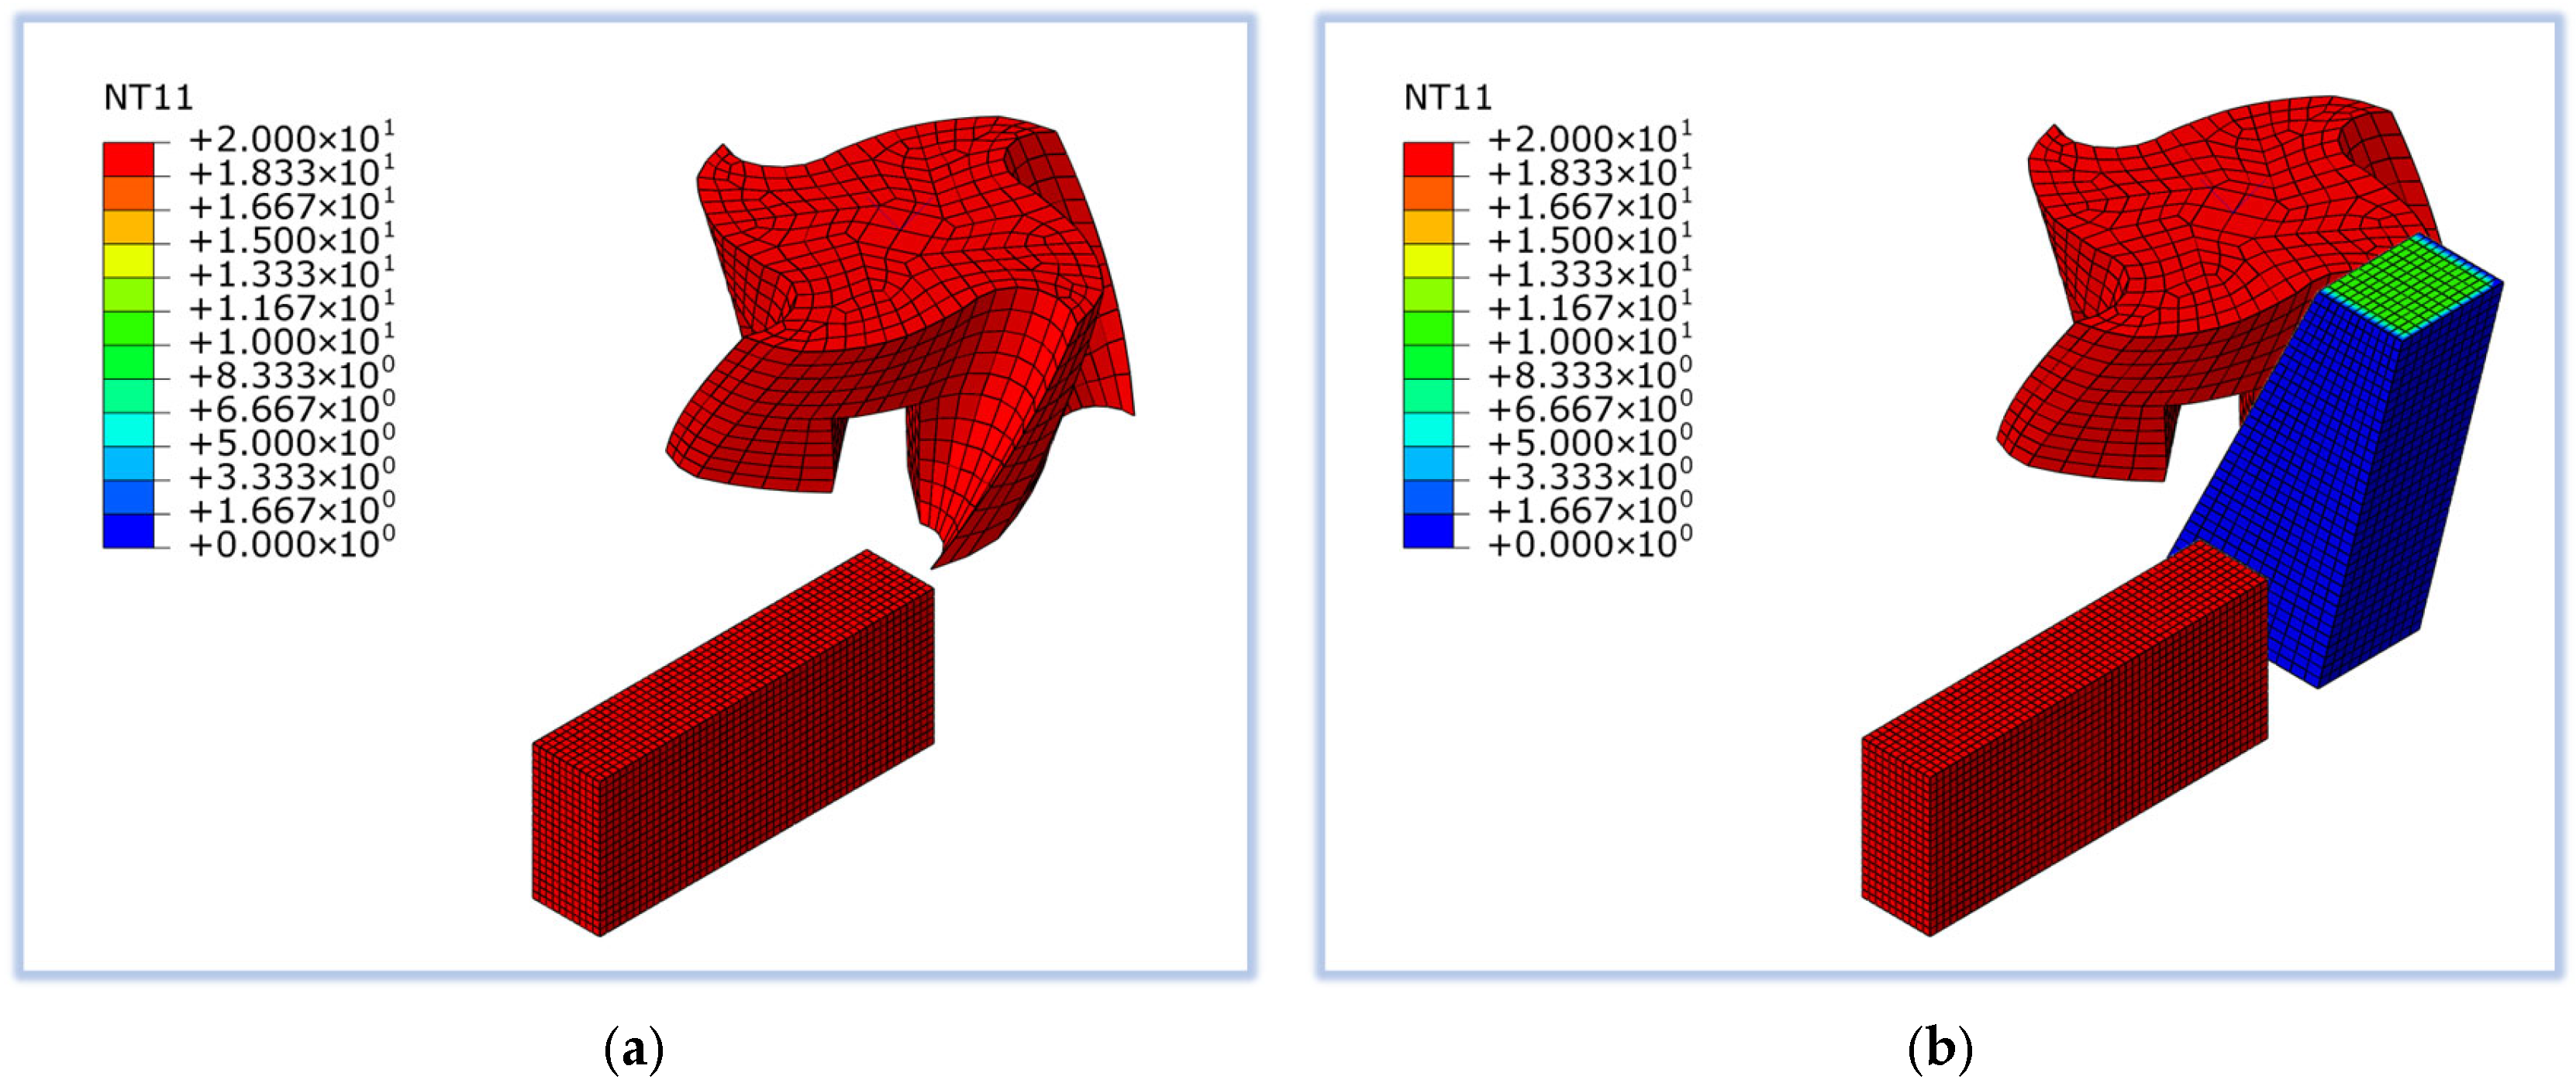
As shown in Figure 4a, the discretization of the tool and workpiece is performed using an 8-node hexahedral mesh with C3D8T. enabling simultaneous calculation of temperature and equivalent stress. As shown in Figure 4b, the fluid domain employs EC3D8RT 8-node meshes. The analysis steps are set to dynamic, temperature-displacement, and explicit solution modes.
Figure 4. Tool and Workpiece Mesh (a) and Thermo–Fluid–Solid-Coupled Mesh (b).
Heat transfer between the fluid, workpiece, and tool occurs through the fluid domain defined as a discrete field at mutual contact points, the tool is defined as a rigid body, with thermal conduction defined within contact properties as pressure dependent. For momentum exchange, sur-face-to-surface contact exists between the tool and workpiece. Set the mechanical constraint as a contact penalty method and set the friction coefficient to 0.3. Both normal behavior and heat generation retain default settings. Contact between the fluid domain and Eulerian domain is defined using a universal release constraint, frictionless with default normal behavior.
In the load module, the Eulerian domain is set as a discrete field; the tool and workpiece do not interfere with the fluid domain, and their volume fraction is set to 0. In Predefined Fields, the coolant material is assigned to the region defined by that discrete field. Boundary conditions for the Eulerian domain are as follows: the top boundary is a coolant inflow boundary; the bottom boundary is an outflow, zero-pressure boundary. Three additional velocity/angular-velocity boundary conditions are applied to prescribe the coolant flow rate, cutter (spindle) speed, and workpiece feed speed.
To facilitate monitoring of heat accumulation and thermal stress, the initial milling conditions were set as follows: spindle speed of 4000 r/min, milling depth of 1.5 mm, and milling cutter feed rate of 3000 mm/min. Under four-flute conditions, the feed per tooth was 0.188 mm/tooth, and the milling width for all simulations and experiments was 1 mm. These parameters are suitable for accurately evaluating the effectiveness of coolant in reducing Tpeak and σeq during the milling process. As shown in Figure 4a,b, to ensure consistent thermal boundary conditions, the initial temperatures of both the cutting tool and workpiece are set to room temperature (20 °C), while the coolant temperature is set to 10 °C. This configuration establishes a distinct temperature gradient, allowing analysis of how surface temperatures are distributed on the workpiece during processing and the heat transfer mechanism.

2.5. Operating Conditions Design

To systematically analyze the thermal effects of different machining processes on milling, the experimental parameters designed are shown in Table 4. The experimental design employs a single-factor approach, sequentially varying the axial depth of cut, feed rate, and spindle speed (with the feed per tooth dynamically changing according to feed rate and spindle speed). This method ensures accurate identification of the influence of these factors on the evolution of Tpeak and σeq.
Table 4. Design of Dry Milling Working Conditions.
Numerical simulations were performed for each operating condition to obtain the Tpeak and σeq during the grinding process. (All parameter settings were consistent, except for the key variable parameters).
Within the CEL computational domain, the Eulerian method is employed to simulate coolant flow. The boundary condition is defined as the nozzle outlet velocity (mm/s). The volumetric flow rate (L/min) in the paper is converted to mm3/s, then divided by the nozzle orifice cross-sectional area to obtain the nozzle outlet velocity. This study employs coolant velocity rather than volumetric flow rate as the reporting unit to ensure that the velocity variables in both experiments and simulations are directly comparable. For specific details, refer to Table 5.
Table 5. Coolant Operating Conditions Design.

2.6. Output Results

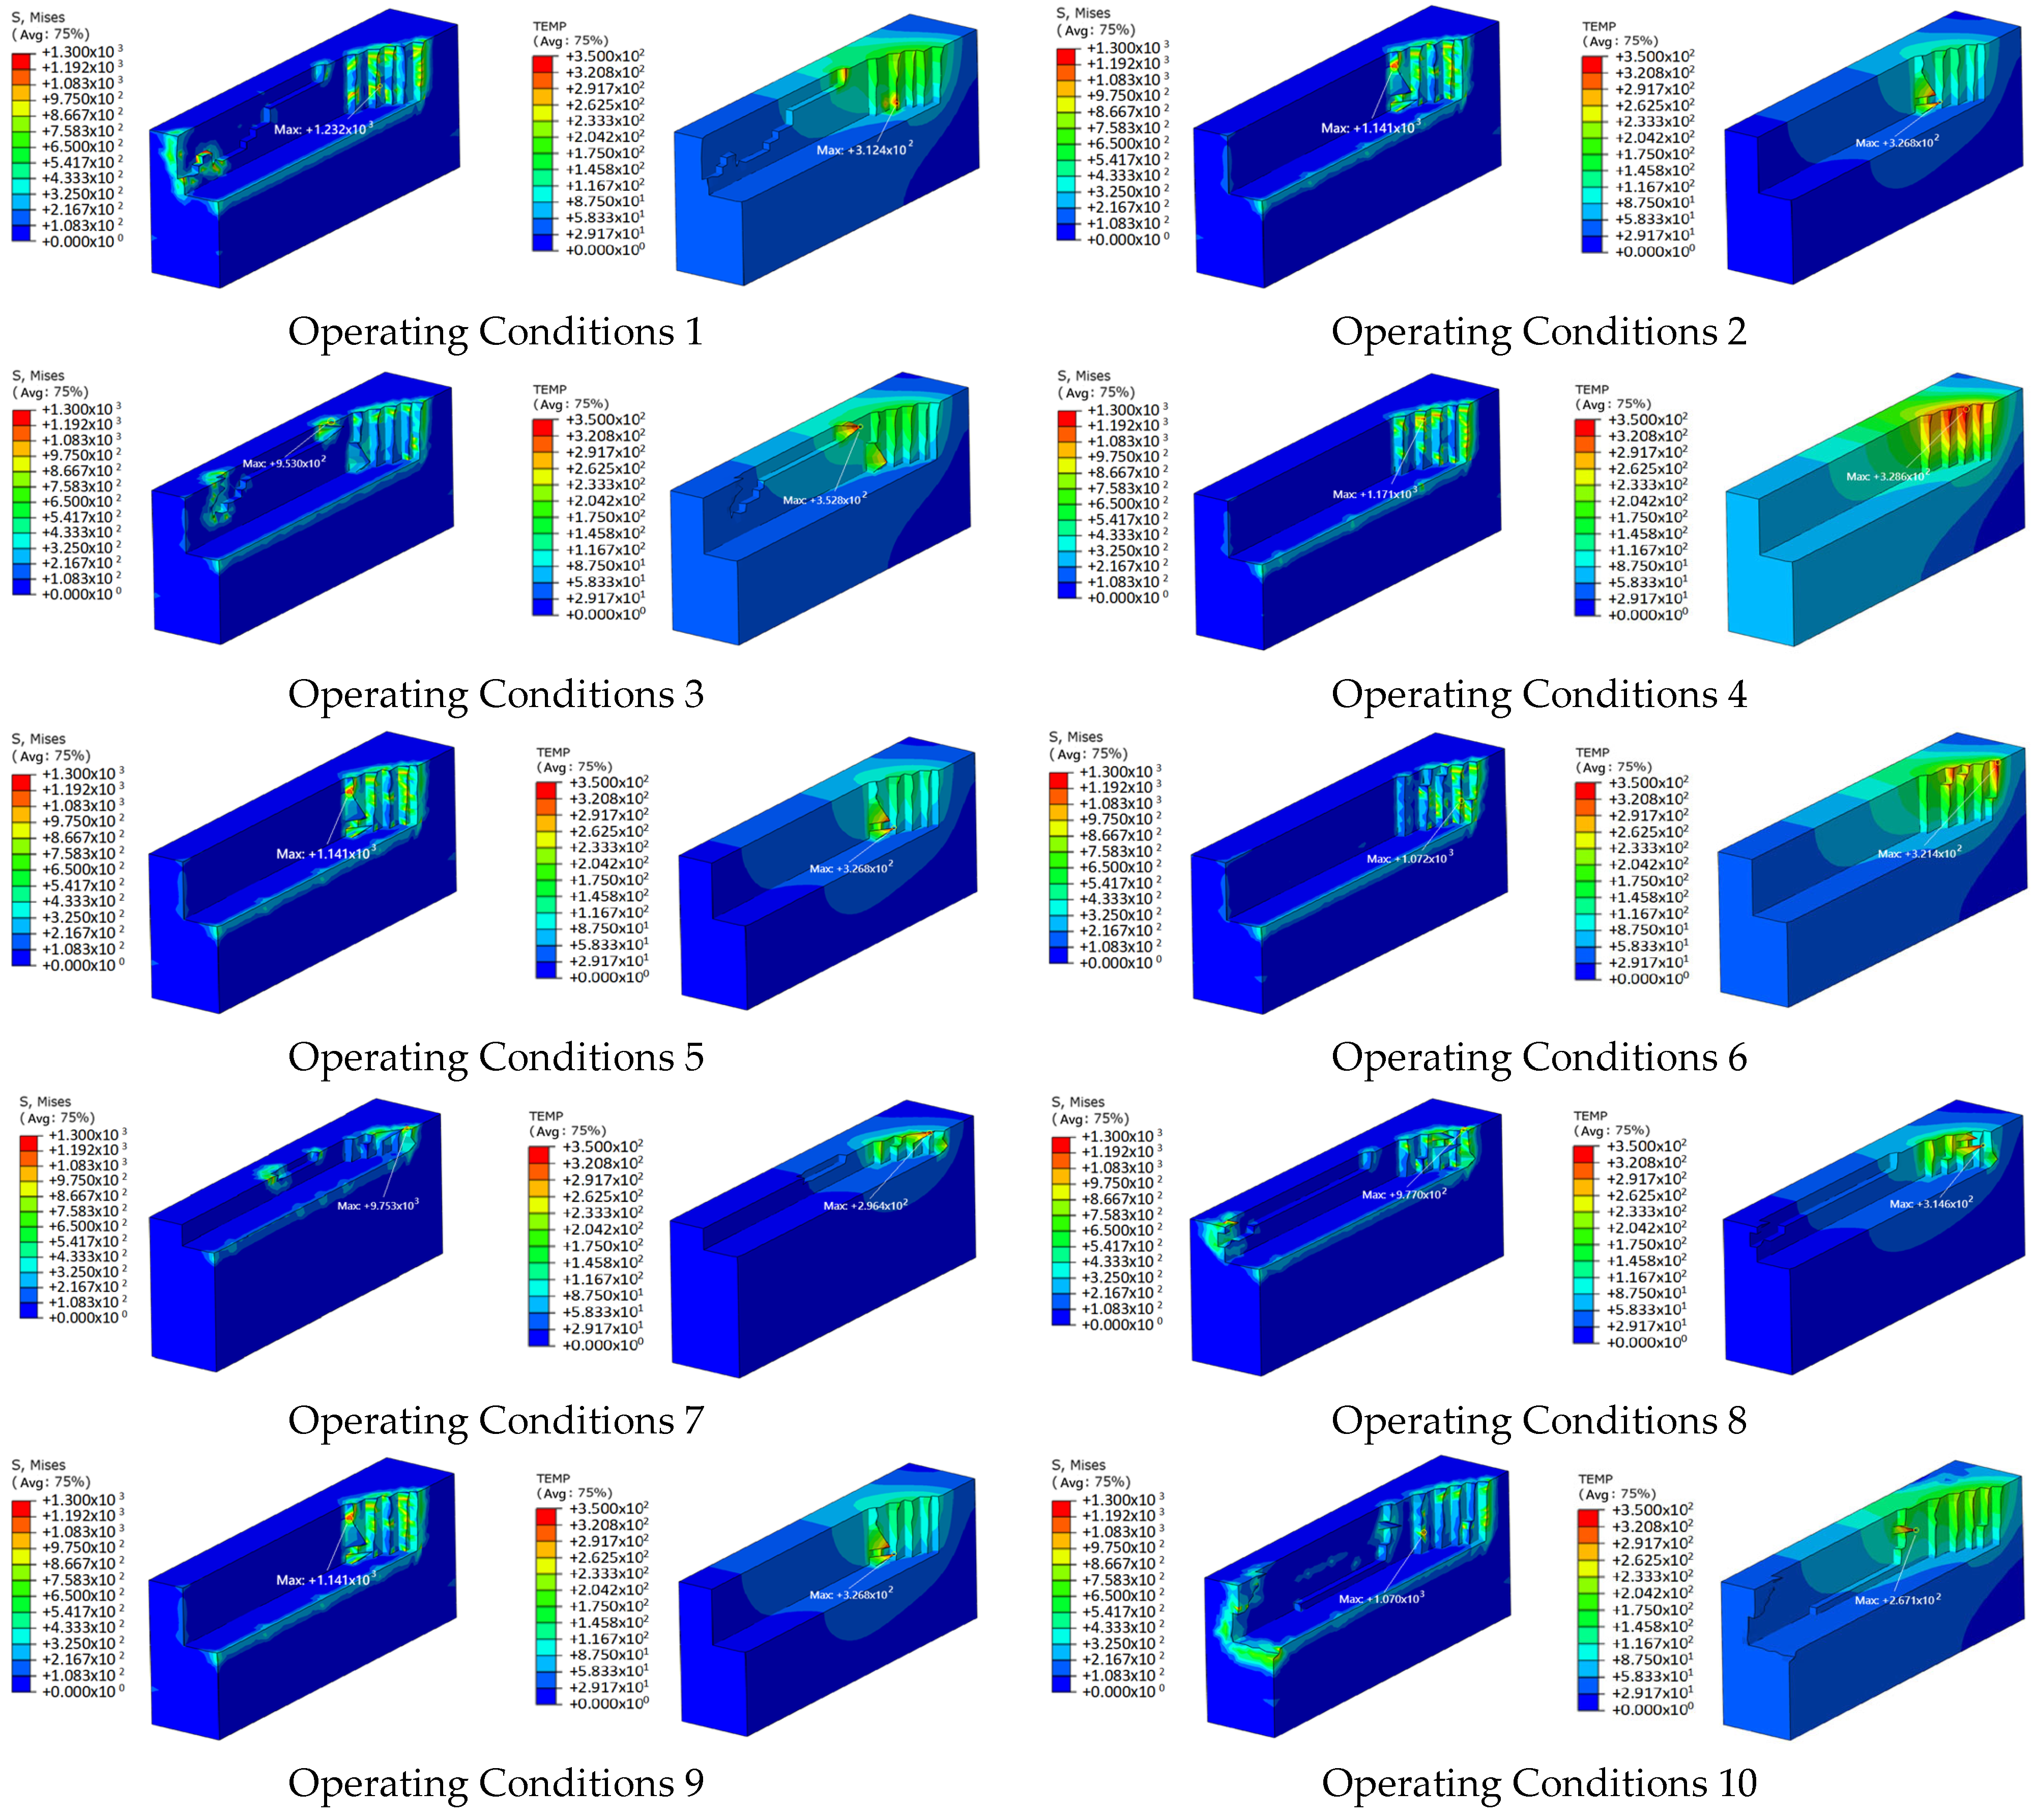
During the milling process of AL6061, the peak milling Tpeak and the σeq within the strain-affected zone are critical factors influencing machining quality. Figure 5 illustrates the variation trends of σeq and Tpeak during milling.
Figure 5. Equivalent stress and temperature distribution under different machining conditions.

2.6.1. Influence of Cutting Parameters

Increasing the feed speed enhances the relative motion per unit time between the tool and the workpiece, enlarging the deformation zone and thereby increasing the material removal rate. As shown from OC 1 to OC 3 in Figure 5, when the feed rate of the milling cutter increased from 2100 mm/min to 3900 mm/min, Tpeak rose from 312.4 °C to 352.8 °C, representing a 12.9% increase. Although the higher spindle feed rate resulted in reduced tool-to-workpiece contact time, the cutting volume achieved by the milling cutter per unit time increased significantly. Increased friction and enhanced plastic deformation generate more heat during milling. The σeq decreases from 1232 MPa to 953 MPa, a reduction of 22.6%. This is because the temperature rise triggers the thermal-softening effect of aluminum alloy. Under high-temperature conditions, the yield strength of materials decreases significantly, resulting in greater plastic flow; consequently, the σeq value generated during the rolling process diminishes accordingly.
As shown in OC 4 to OC 6 in Figure 5, when the spindle speed increases, the feed per tooth of the milling cutter decreases. Tpeak decreased from 328.6 °C to 321.4 °C (a reduction of 2.2%), while the σeq value decreased from 1171 MPa to 1072 MPa (a reduction of 8.5%). The high rotational speed of the milling cutter induces thermomechanical effects during the milling process. The compression of the contact duration caused by higher spindle speeds results in a corresponding reduction in the heat transfer capacity at the interface. Meanwhile, the increased spindle speed improves chip-evacuation efficiency. Because chips carry away part of the generated heat during milling, heat accumulation in the cutting zone dissipates more rapidly. The dual effects of reduced contact duration and enhanced heat dissipation lead to a synchronous decrease in grinding temperature and σeq.
As shown from OC 7 to OC 9 in Figure 5, the peak milling temperature increases with increasing cutting depth. When the cutting depth is 0.5 mm, the Tpeak is 296.49 °C; when the cutting depth increases to 1.5 mm, the Tpeak rises to 326.86 °C, up by 10.2%. The increase in Tpeak is due to the growing contact area between the tool and workpiece as the milling depth increases, resulting in greater plastic deformation and friction that generates higher heat. The σeq also increases with greater milling depth. At a milling depth of 0.5 mm, σeq is 975.3 MPa; at 1.5 mm, it rises to 1141 MPa (an increase of 17%). The greater cutting depth subjects the workpiece to higher mechanical loads, causing the plastic deformation zone to expand continuously and leading to more pronounced internal stress accumulation.

2.6.2. Effect of Coolant Flow Rate

The coverage rate in numerical results is calculated frame-by-frame using liquid phase volume fraction: a threshold is set on adjacent Eulerian surface elements on the workpiece surface. If the liquid phase volume fraction is no less than 0.5, it is considered covered. The coverage ratio for each frame is calculated as the ratio of the covered surface element area to the total target surface area. Subsequently, a weighted average is computed for the steady-state period based on the corresponding time intervals of each frame, yielding the average coverage ratio.
As shown by OC 10–12 in Figure 5, the coolant exhibits a pronounced effect on reducing the milling temperature, and the influence of coolant velocity on temperature is nonlinear. At a coolant flow rate of low, the flow velocity is relatively low, resulting in incomplete coverage of the cutting zone and suboptimal heat dissipation. Tpeak reaches as high as 267.19 °C. When the coolant flow rate is increased to moderate level, the Tpeak decreases by only 4.66 °C. This limited improvement occurs because the coolant remains in the laminar regime, although a larger surface area is covered and the enhancement in heat transfer coefficient is minimal, so the gain in cooling efficiency is modest. When the velocity reaches high velocity, the flow clearly transitions to a turbulent regime, markedly enhancing convective heat transfer; The coolant more effectively dissipates heat generated during milling and reduces Tpeak to 200.9 °C., Compared to low flow rates, it decreased by 24.8%.
By contrast, the σeq does not vary monotonically with coolant velocity. When the coolant flow velocity is low, σeq is 1070 MPa. However, when the coolant flow velocity increases to moderate level, σeq rises to 1127 MPa (an increase of 5.3%). This counterintuitive increase may result from incomplete coolant coverage and locally nonuniform cooling caused by strong thermal gradients. Although coolant reduces Tpeak, lower flow rates may increase temperature gradients on the workpiece surface, leading to localized thermal expansion and stress concentration. When coolant velocity increased to high velocity, σeq decreased to 1058 MPa. This slight reduction indicates that turbulence generated at higher velocities improves temperature uniformity and alleviates stresses in the cutting zone. The σeq value decreased by only 1.1% during the coolant flow rate increase from low to high, indicating that spatial temperature gradients influence σeq rather than absolute temperature. Therefore, while higher coolant flow rates effectively reduce Tpeak, their effect on σeq is indirect.

2.7. Experimental Protocol for Surface Based Trend Validation

Tool and workpiece preparation: this study employed four-flute carbide end mills manufactured by Xiamen Golden Egret (Xiamen, Fujian, China) as the milling tools., with a diameter of 10 mm and made of YG6X tungsten carbide. It offers excellent wear resistance and thermal stability and is well suited to high-speed milling of aluminum alloys. The tool’s geometric parameters are kept consistent with those of the simulation model to ensure comparability between simulation and experiment. The workpiece material is AL6061 aluminum alloy, the same as in the simulation. Before the experiments, the workpiece surface is polished and cleaned with alcohol to ensure measurement accuracy. All experimental operating conditions are carried out under conditions consistent with the simulation operating conditions.
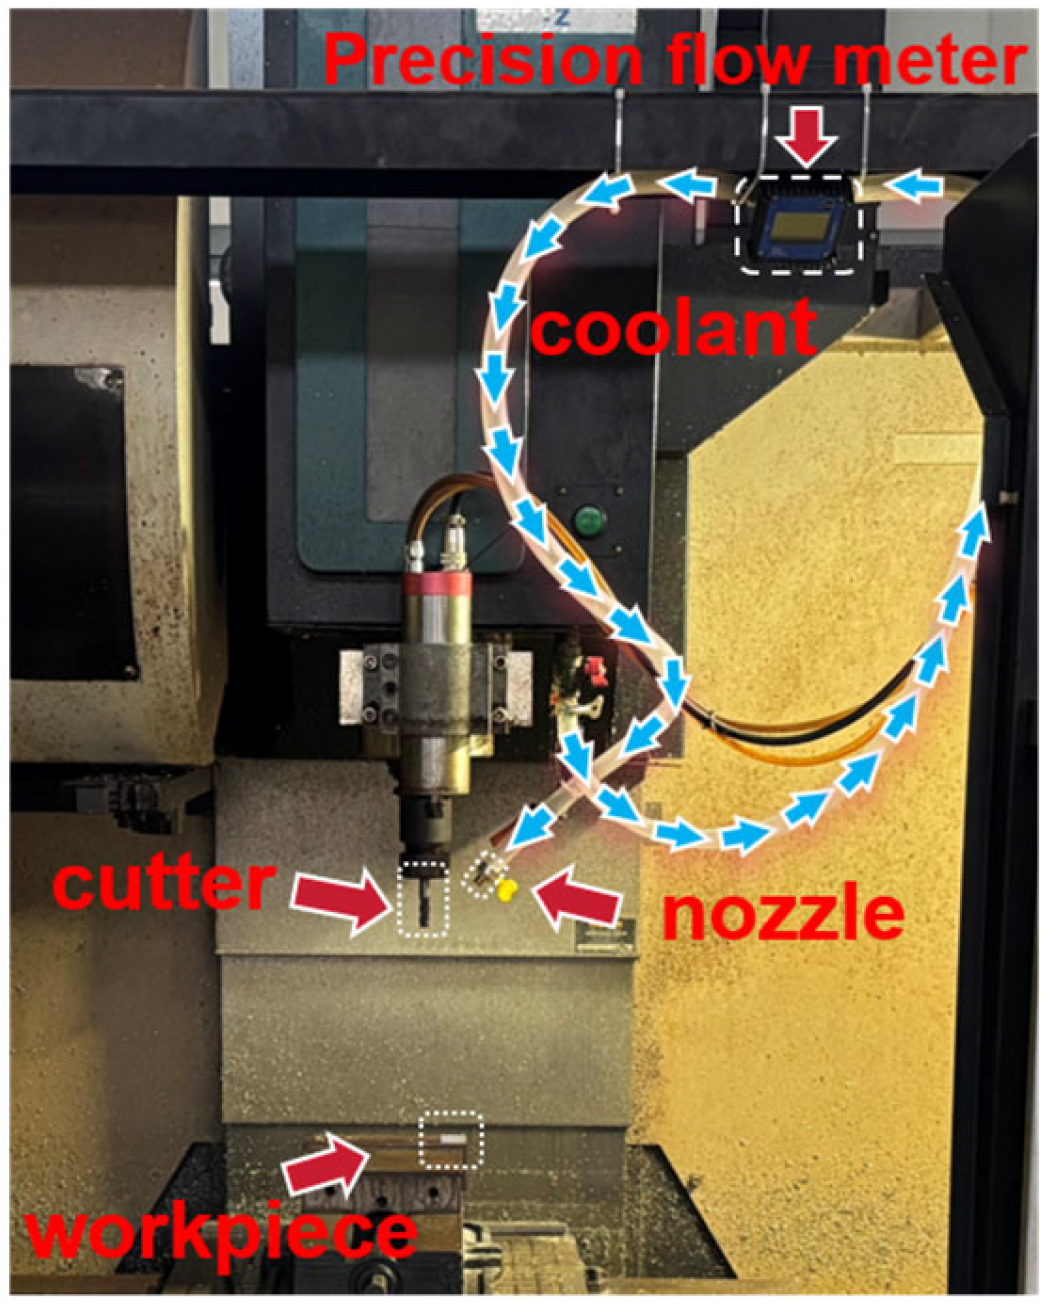
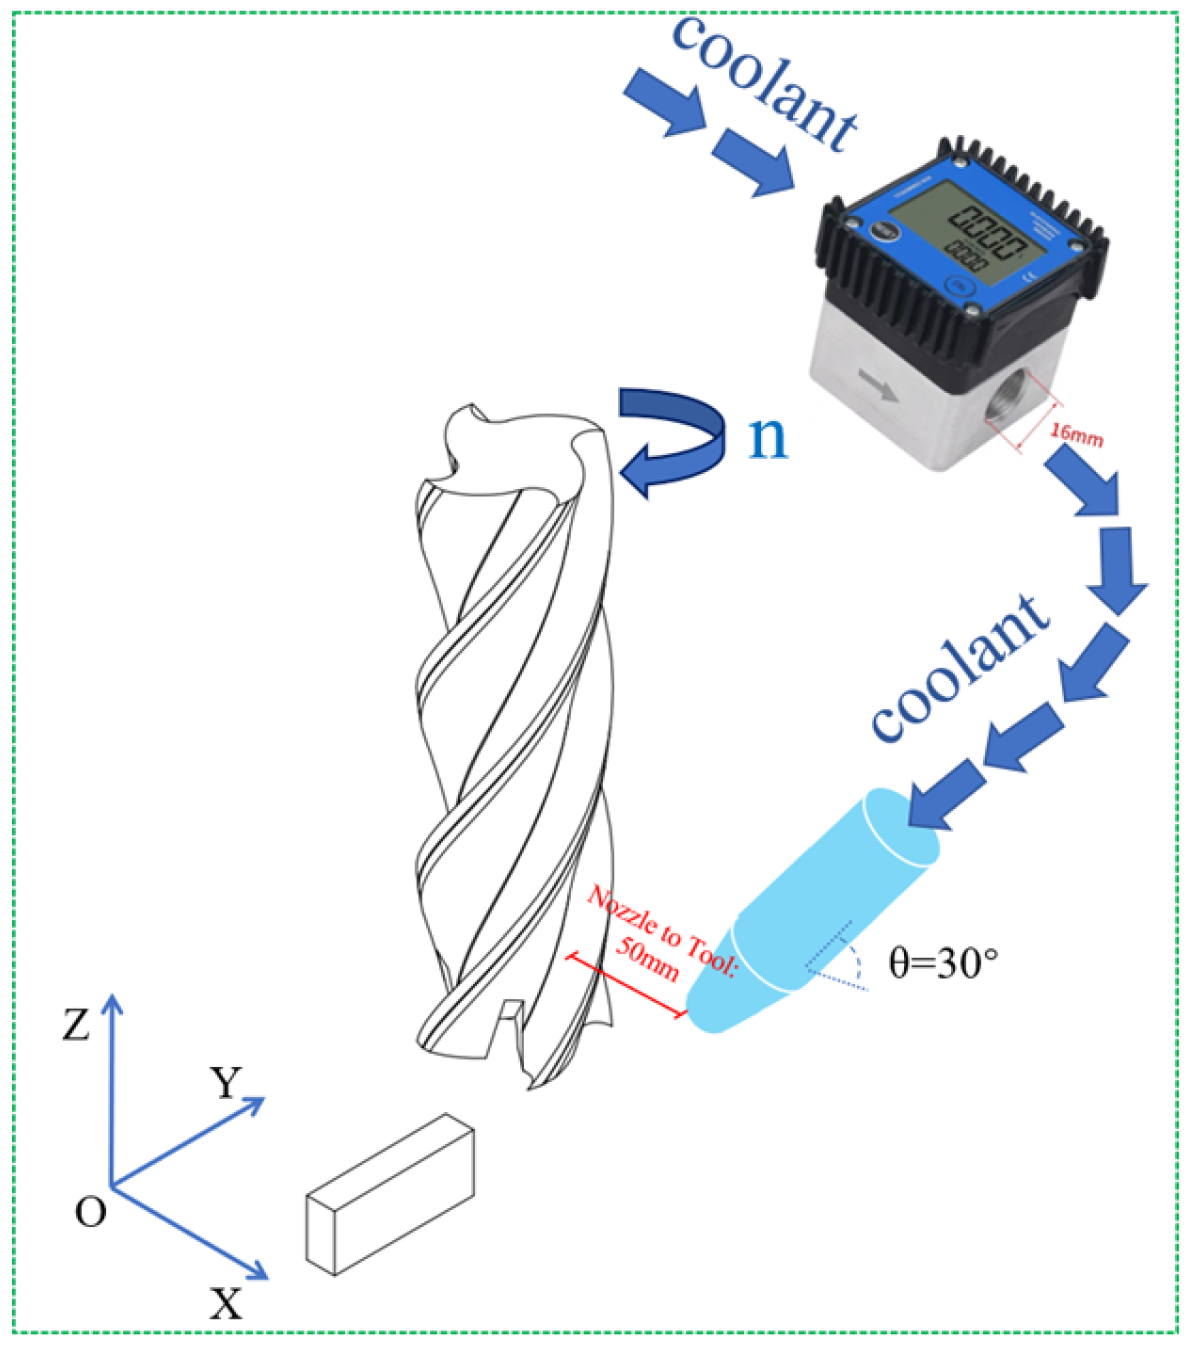
Cutting conditions and coolant flow control: as shown in Figure 6, multi-parameter milling experiments were conducted on a vertical machining center (Model: JT-VL850B, J-TECH CNC Technology Co., Ltd., Quanzhou, Fujian, China). Coolant flow was regulated via a precision flow meter, with the installation schematic depicted in Figure 7. This flow meter measures ranges from 0.2 L/min to 10 L/min, featuring inlet and outlet pipe diameters of 16 mm and 9 mm, respectively. The volumetric flow rate Q (L/min) was converted to mm3/s and divided by the nozzle orifice cross-sectional area to obtain the nozzle flow velocity. Calculations were performed to maintain consistency with simulation settings. When the coolant flow rate was set to 1.15 L/min, 3.05 L/min, and 4.96 L/min, the measured outlet flow rates corresponded to low, medium, and high flow rate levels, respectively.
Figure 6. Test Platform Structure Diagram.
Figure 7. Coolant Flow Rate Control Conditions.
Both the nozzle and the tool lie in the X–Z plane. Because the high-speed rotation of the end mill generates strong local airflow, an excessive standoff distance can prevent the coolant from covering the cutting zone in time; therefore, the nozzle is placed 50 mm from the tool axis, with a jet angle of 30° in the X–Z plane. At this distance, the cutter’s rotational speed has little influence on the coolant, and the jet is directed along the cutter’s direction of rotation. During the milling experiment, the coolant was retrieved from a refrigerated cabinet and could only be maintained at approximately 10 °C—not precisely fixed at that temperature. Therefore, the experiment was conducted as quickly as possible to minimize measurement errors. The rise in coolant temperature and its heat capacity may have reduced heat dissipation from the workpiece and tool during milling, resulting in a slight increase in peak temperatures and a corresponding decrease in equivalent stress.

Optical Surface Observation

Surface roughness is measured using an optical profilometer (RTEC Instruments, Lambda White Light Interferometer, San Jose, CA, USA). The measurement procedure is shown in Figure 8. First, the light-source system of the main unit is started to ensure stable operation of the optical platform. The sample is then fixed on the stage, and real-time imaging is used to observe the appearance of interference fringes. Next, an appropriate objective and scan area are selected; in this experiment the scan area is set to 0.56 mm × 0.89 mm. An automatic scan is then performed to capture the interferogram. The system simultaneously reconstructs the sample’s three-dimensional surface topography, enabling surface-roughness analysis, profile extraction, and statistical evaluation.
Figure 8. Flowchart of surface roughness measurement procedure.

3. Results and Discussion

Surface-based trend validation is conducted using the same milling operating conditions as in the simulation; in total, 12 machining operating conditions are tested. Surface inspection is performed on the machined workpieces, measuring line roughness (Ra) and areal roughness (Sa).
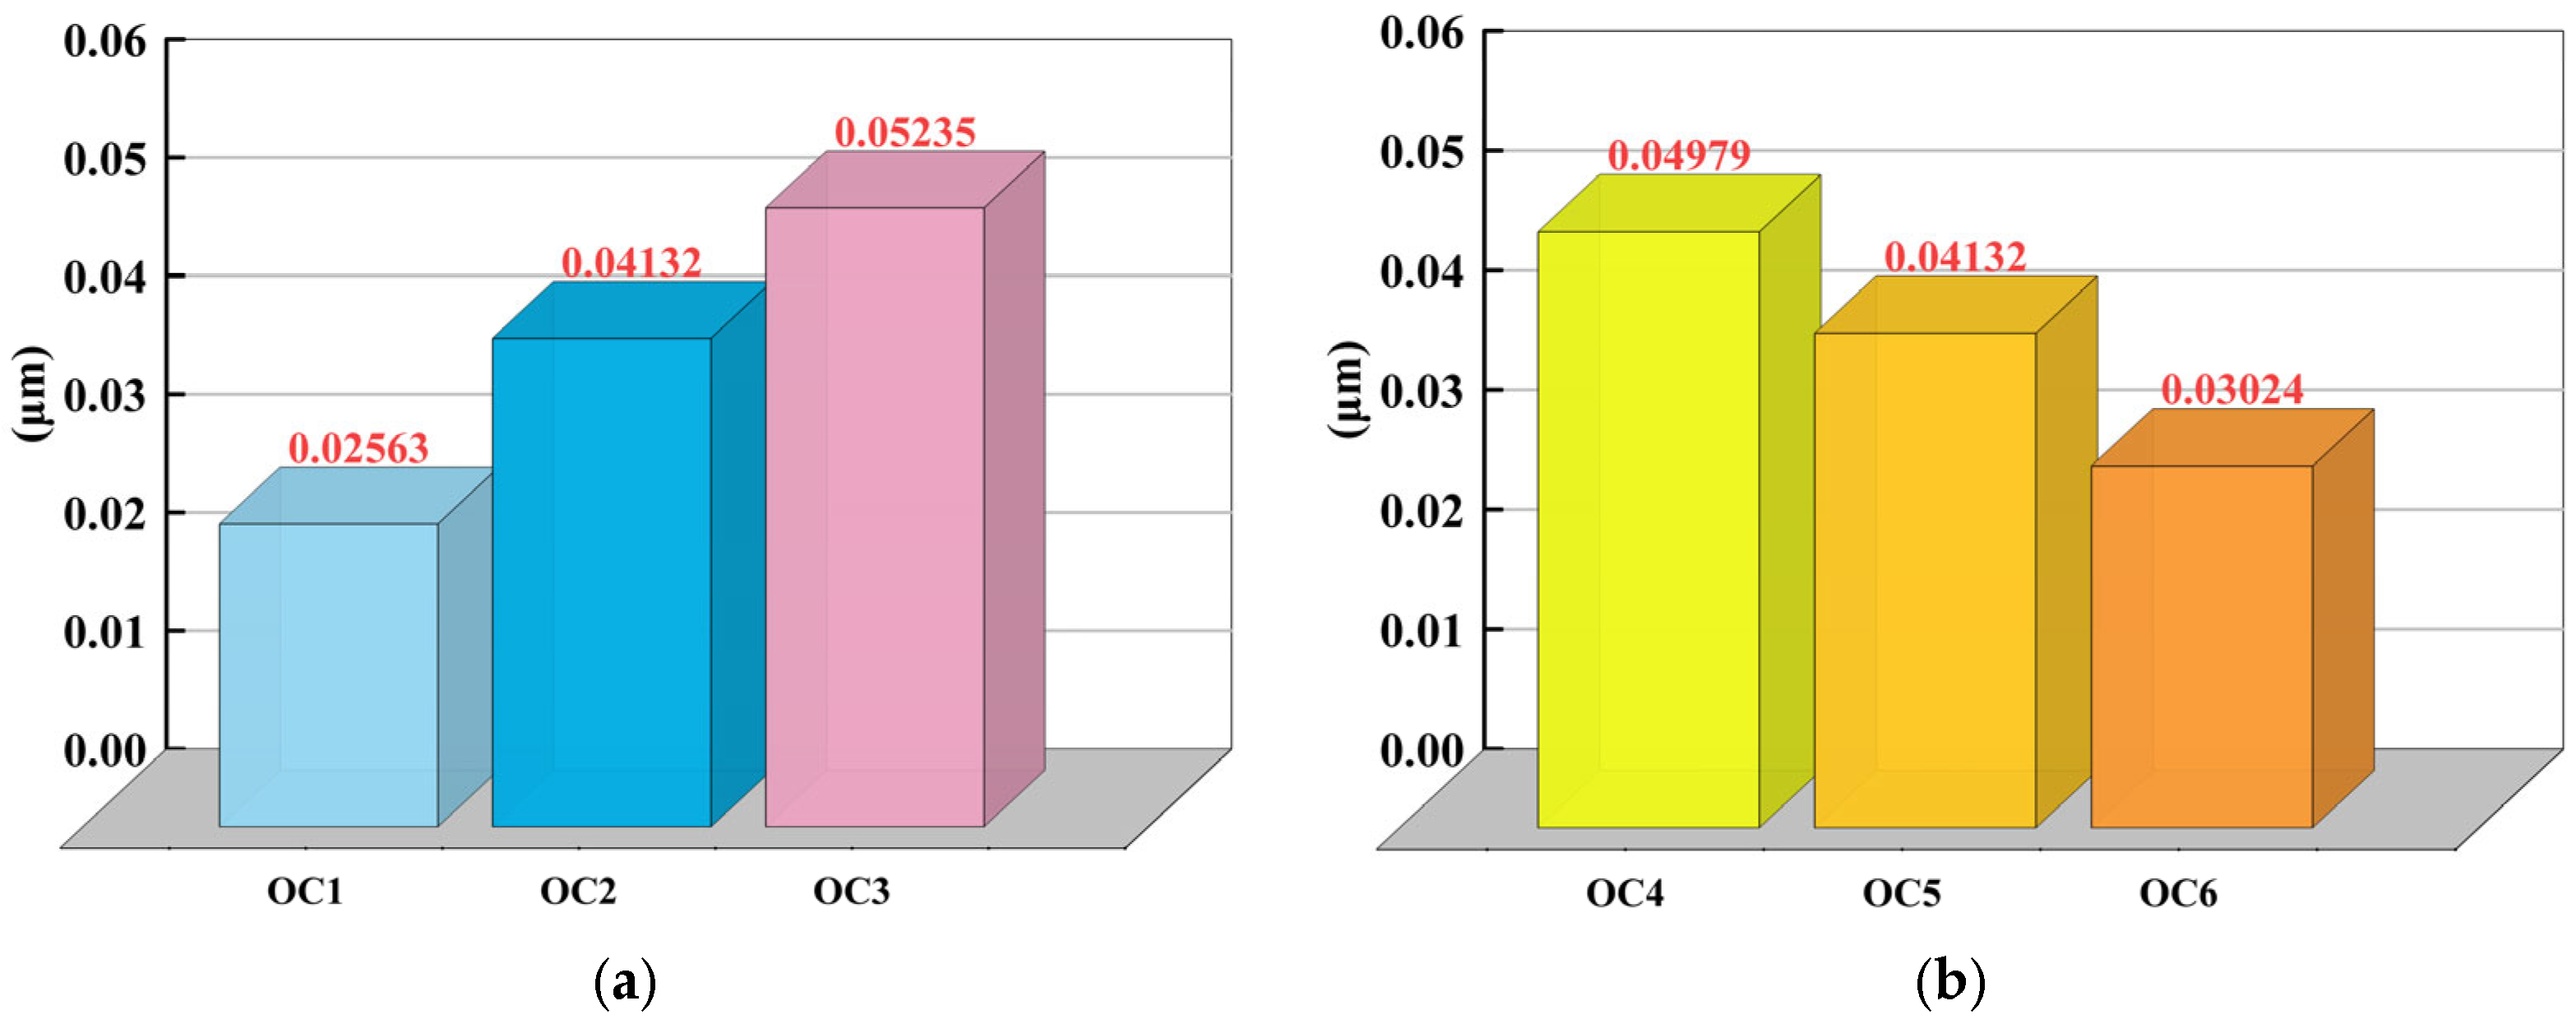
Figure 9a shows that under OC 1 the average line roughness is 0.02563 μm; relative to OC 1, the average line roughness in OC 2 increases by 61.2%, and in OC 3 it increases by 104.2%. This is because a temperature rise induces thermal softening in the aluminum alloy, lowering the yield strength; under the same deformation conditions the material exhibits stronger plastic flow, which in turn increases surface roughness.
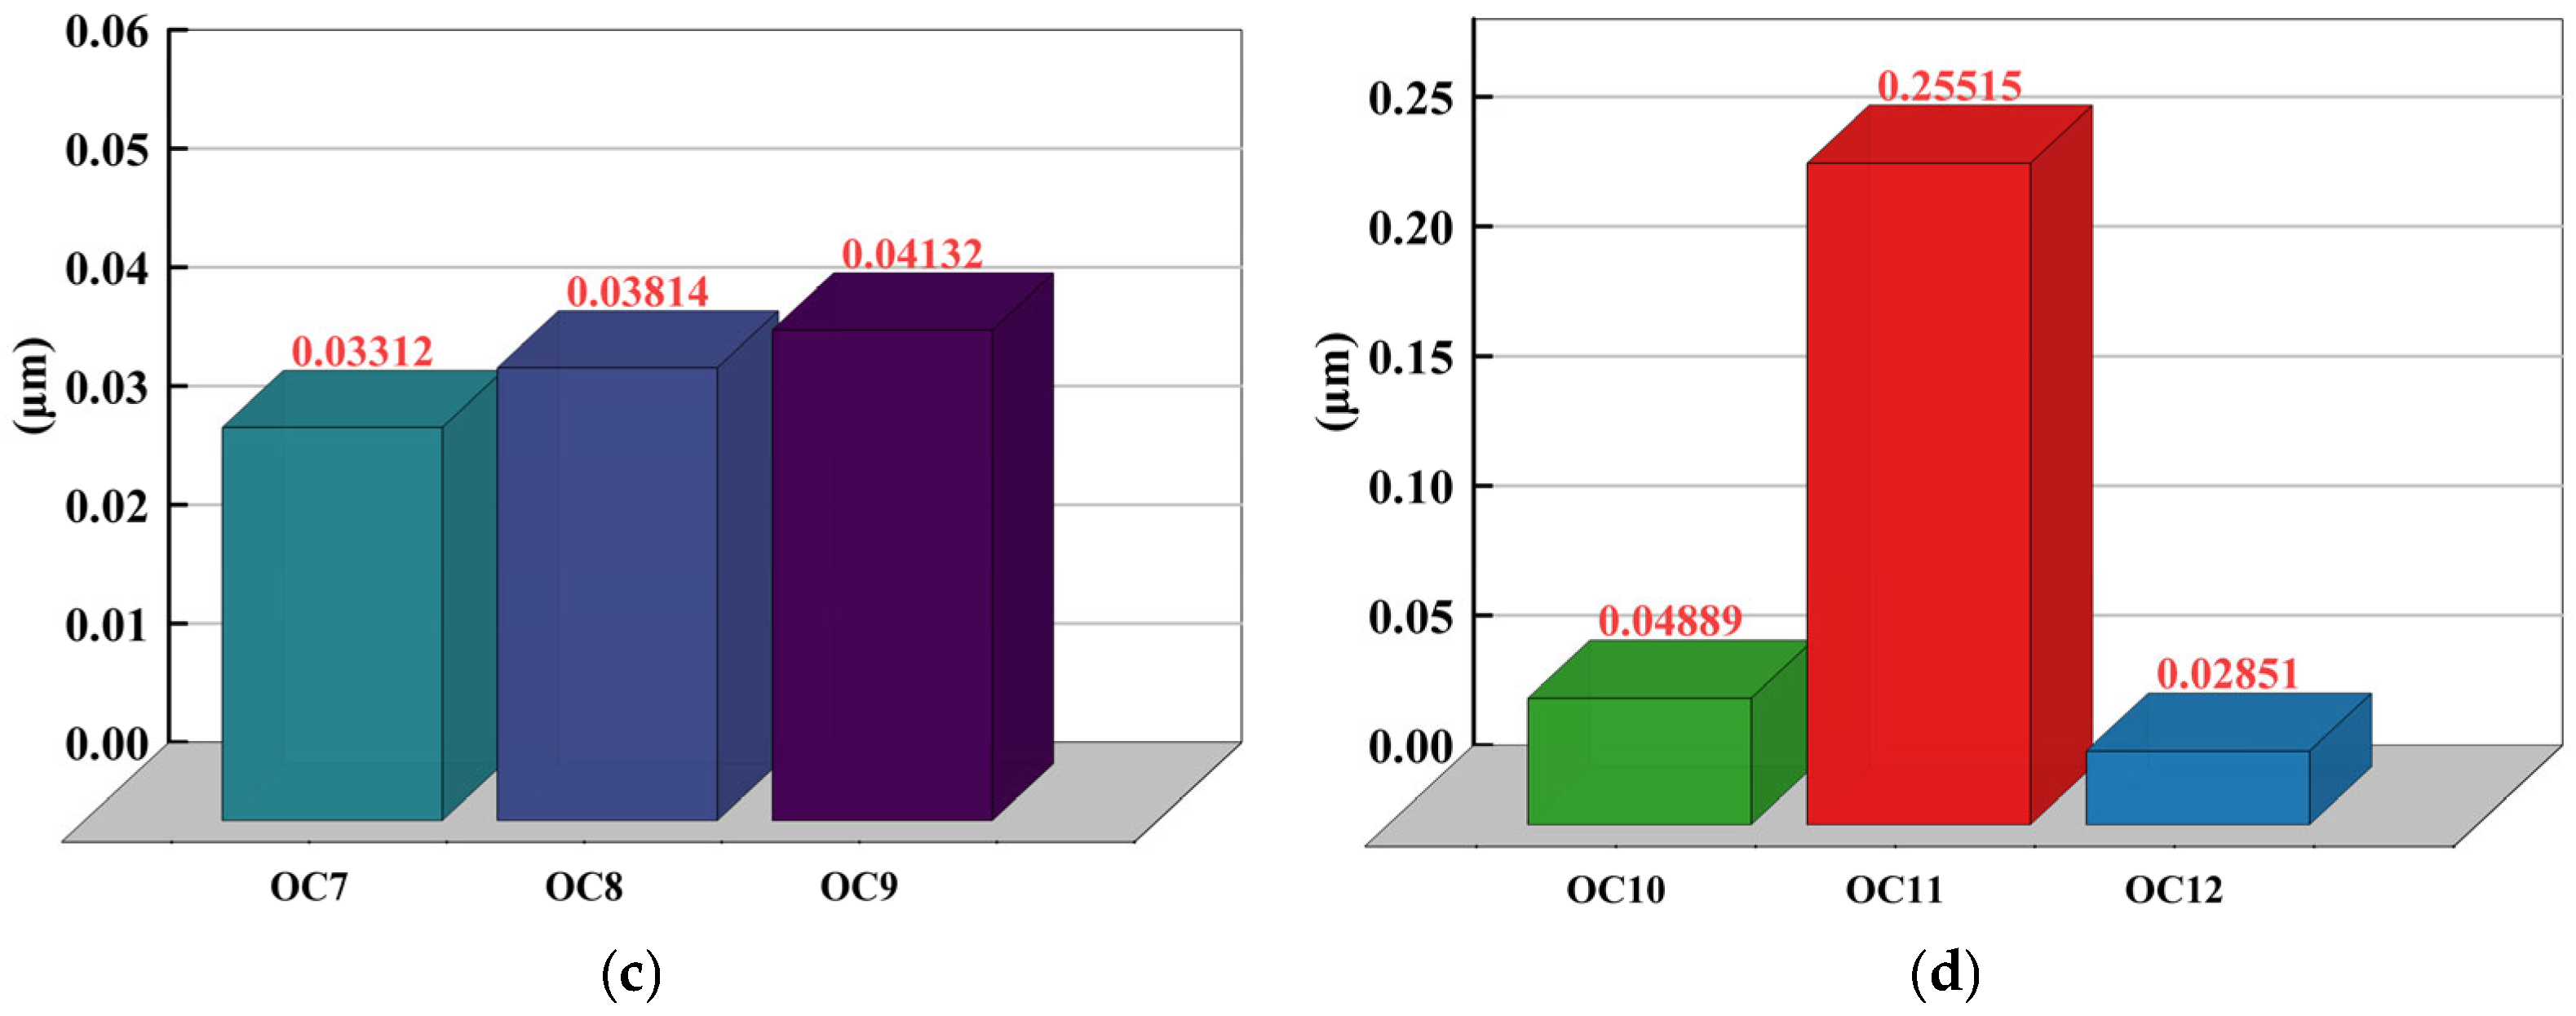
Figure 9. (a) Effect of feed rate on line roughness. (b) Effect of spindle speed on line roughness. (c) Effect of milling depth on line roughness. (d) Effect of coolant flow rate on line roughness.
Figure 9b shows that the average surface roughness in OC 6 is 0.03024 μm; relative to OC 6, the average line roughness in OC 5 increases by 36.6%, and in OC 4 it increases by 64.6%. As spindle speed increases, the dwell time of the cutting tool on the workpiece is reduced, making it difficult to establish sufficient heat flux at the interface and consequently diminishing heat transfer efficiency; moreover, at high speed the chips carry away part of the generated heat, so a higher spindle speed reduces surface roughness.
Figure 9c shows that under OC 7, the average roughness is 0.03312 μm; relative to OC 7, the average line roughness in OC 8 increases by 15.2%, and in OC 9 it increases by 24.8%. When the unit time remains constant, an increase in cutting depth leads to a larger cutting surface area of the tool engaging the workpiece. The increased work performed generates more heat, so a larger milling depth degrades surface quality.
Under different coolant flow rates, a particularly interesting phenomenon is observed, as shown in Figure 9d. The surface roughness in OC 12 is 0.02851 μm; relative to OC 12, the average line roughness in OC 10 increases by 71.5%, whereas that in OC 12 decreases by 88.83% relative to OC 11. Although both OC 10 and OC 11 use low flow rates, the roughness in OC 11 is significantly higher than in OC 10 and 12. These differences primarily stem from insufficient coolant coverage in OC 10, where high-speed rotating tools disperse the coolant, creating conditions similar to dry milling. In OC 11, despite a slight increase in coolant flow rate, uneven coolant distribution persists, leading to heightened thermal gradients and a significant rise in surface roughness. In contrast, under OC 12 conditions, the coolant flow enters a turbulent state, significantly enhancing heat dissipation and improving temperature uniformity across the workpiece surface. This effectively reduces surface roughness. These results indirectly validate that Tpeak and σeq exert a significant influence on surface roughness.
As shown in Table 6, the trends of Sa under different machining conditions are highly correlated with the simulation results and the measured Ra values.
Table 6. Statistical Summary of Average Areal Roughness (Sa) Under Different Machining Conditions.
For different feed speeds, the average areal roughness in OC 1 is 0.485 μm; relative to OC 1, OC 2 increases by 19.3%, and OC 3 increases by 29.9%. For different spindle speeds, the average areal roughness in OC 6 is 0.514 μm; relative to OC 6, OC 5 increases by 12.7%, and OC 4 increases by 19.9%. For different milling depths, the average areal roughness in OC 7 is 0.543 μm; relative to OC 7, OC 8 increases by 2.2%, and OC 9 increases by 6.7%.
Regarding coolant flow rate, the average areal roughness in OC 12 is 0.576 μm; relative to OC 12, OC 10 increases by 13.1%, while OC 12 decreases by 51.3% relative to OC 11.
Figure 10a shows the 3D surface obtained at the optimal feed speed, characterized by minimal peak heights and uniform texture. Figure 10b corresponds to the best surface quality among the tested spindle speeds, with smoother tool marks and fewer local protrusions. Figure 10c shows the surface morphology at the shallowest milling depth, where material deformation is reduced and surface finish is improved. Figure 10d depicts the surface obtained under turbulent coolant conditions (high velocity), with the lowest peak–valley heights and the most uniform surface, demonstrating excellent thermal control and minimal thermal damage. These images visually corroborate the preceding quantitative roughness data and further indicate that optimizing machining parameters can significantly suppress thermo–mechanically induced surface degradation, thereby achieving better surface integrity.
Figure 10. (a) Surface roughness under optimal feed rate. (b) Surface roughness under optimal spindle speed. (c) Surface roughness under optimal milling depth. (d) Surface roughness under optimal coolant flow rate.

4. Conclusions

4.1. Principal Findings on Thermal and Mechanical Responses

This study presents a reproducible computational framework based on a coupled thermo-–fluid–solid approach for wet milling of AL6061. The coolant model is established by the Euler domain, while the workpiece and cutting tool are described in the Lagrangian domain.
This study proposes a repeatable computational framework based on a coupled thermo–fluid–solid approach for wet grinding of AL6061. The coolant model is established in the Eulerian domain, while the workpiece and cutting tool are modeled in the Lagrangian domain. The model’s reliability is validated through mesh independence verification and an Energy equilibrium error value below 5%. Increasing the feed rate enhances the plastic work per unit time. Simultaneously, enlarging the axial cutting depth not only expands the contact area between the workpiece and cutting tool but also increases the effective heat storage volume of the workpiece material, thereby intensifying heat accumulation. Conversely, raising the spindle speed reduces the feed per tooth and shortens the unit contact time between the workpiece and cutting tool, thus having a lesser impact on Tpeak. Cooling effectiveness primarily depends on coolant coverage rather than nominal coolant flow rate. Overall, increasing coolant coverage reduces Tpeak, while higher feed rates and axial cutting depths elevate temperatures.
The study also examined the effects of each parameter on equivalent stress (σeq). We found axial cutting depth to be the primary influencing factor, with increases elevating σeq. Notably, higher feed rates reduced σeq, while spindle speed and coolant flow rate exerted only minor effects. Coolant coverage exhibited a non-monotonic response: σeq rose with increasing coverage at lower flow rates but decreased as flow rates increased.

4.2. Influence on Surface Integrity

Regarding surface roughness: We measured and studied its sensitivity to variations in process parameters using arithmetic mean roughness Ra and arithmetic mean area roughness Sa. It was found that Ra values primarily increase with higher feed rates but can be reduced by improving coolant coverage. Increasing spindle speed slightly reduces Ra, while axial cutting depth typically has minimal impact, causing only a slight Ra increase. Sa is most susceptible to cutting fluid coverage; higher coverage significantly lowers Sa. Feed rate significantly affects Sa, increasing it as feed rate rises. Spindle speed also affects the Sa value, with increased speed causing a decrease in Sa. Furthermore, it is most significantly influenced by coolant coverage; improved coverage can substantially reduce the Sa value. Feed rate significantly affects Sa, with increased feed rates raising Sa values. Spindle speed also influences Sa values, while axial cutting depth has the least impact, causing only a slight increase in Sa values.

4.3. Guidelines for Process Optimization

In summary, this study systematically elucidates the influence of key process parameters—including feed rate, axial cutting depth, spindle speed, feed per tooth, and coolant coverage—on the surface quality of AL6061 aluminum alloy machining. It analyzes the thermal and mechanical responses during wet milling. It was found that coolant coverage plays a crucial role in controlling peak temperatures and enhancing workpiece surface quality, while axial cutting depth is the most critical factor affecting equivalent stress. The feed per tooth dynamically varies between cutter speed and feed rate, with feed rate primarily influencing surface roughness. These findings provide essential reference for optimizing milling conditions and improving machining efficiency and quality. To suppress peak temperatures and enhance surface quality, prioritize optimizing the nozzle spray angle and nozzle-to-workpiece distance to ensure full coverage. Subsequently, appropriately reduce the feed rate and axial cutting depth. A higher and stable spindle speed aids temperature control. If the objective is to reduce equivalent stress, limit the axial cutting depth, avoid localized splashing at medium flow rates, and employ a higher and stable spindle speed with sufficient coolant supply.

4.4. Scope and Outlook

This study provides trend-level predictions only and does not yet include direct experimental validation of Tpeak and σeq. The concept of coolant coverage, identified as a critical factor in simulations, was not quantitatively measured in experiments. To address this, we recommend employing a combined approach of high-speed visualization and image processing in subsequent work to directly quantify the wetted area fraction. Additionally, point-to-point verification and parameter calibration should be conducted using the RDIC-IR three-dimensional full-field thermal strain measurement system. This system comprises two high-resolution cameras, an infrared thermal imager, a synchronous triggering device, measurement software, calibration plates, and a workstation. With a temperature measurement range of −20 to 550 °C, it reliably acquires temperature field/surface deformation data under wet high-speed conditions. To correlate XRD results with equivalent stress, XRD residual stress profiling analysis was conducted using the electrolytic stripping method. Within the 0–200 μm range, σx, σy, and τxy were measured layer-by-layer at 10–20 μm increments. Under plane stress conditions, the σvm-depth curve was derived by calculating equivalent stress σvm = (σx2 + σy2 − σxσy + 3τxy2)1/2. Key parameters requiring systematic investigation include nozzle angle, nozzle-to-cutting-head distance, coolant flow rate, and its interaction with spindle speed.
Comparing surface stress with residual stress measurements proves highly valuable. Predicting surface machining quality trends through these parameters significantly reduces model uncertainty and identifies bias sources with minimal effort. Cross-validation between peak microhardness and characteristic depth enhances the reliability and universality of predictive results. However, limitations persist: The J-C constitutive model is based on a purely empirical model, capable only of measuring strain, strain rate, and temperature, and cannot capture precipitation evolution or dynamic recrystallization phenomena during severe plastic deformation.

Author Contributions

Conceptualization, Y.X. and X.W.; methodology, Y.X.; software, Y.X.; validation, Y.X. and C.Z.; formal analysis, Y.X. and X.W.; investigation, Y.X.; resources, X.W. and X.T.; data curation, Y.X.; writing—original draft preparation, Y.X. and X.W.; writing—review and editing, Y.X., X.W., X.T., E.C. and C.Z.; visualization, Y.X.; supervision, X.T.; project administration, X.W. and X.T. All authors have read and agreed to the published version of the manuscript.

Funding

This research was funded by the Fujian Provincial Department of Science and Technology, China, under the Key Technical Innovation and Industrialization Project “Research and Application of High-Performance Sintered NdFeB Permanent Magnet Manufacturing Equipment” (No. 2023XQ002), and the University–Industry Cooperation Project “Research on Key Technologies for Uniform Composite Sintering of High-Performance NdFeB Permanent Magnet Materials” (No. 2024H6015).

Data Availability Statement

The original contributions presented in this study are included in the article. Further inquiries can be directed to the corresponding author.

Conflicts of Interest

The authors declare no conflicts of interest.

References

  1. Trzepieciński, T.; Najm, S.M.; Oleksik, V.; Vasilca, D.; Paniti, I.; Szpunar, M. Recent developments and future challenges in incremental sheet forming of Aluminium and Aluminium alloy sheets. Metals 2022, 12, 124. [Google Scholar] [CrossRef]
  2. Ajibola, O.O.; Adebayo, A.O.; Borisade, S.G.; Adigun, O.D.; Babalola, B.A. Electrochemical Corrosion Behaviour of Heat-Treated AA6063 Aluminium Matrix Composites Reinforced with Alumina, Titania and Hybrid Powders in 1.0 M HCl Solution. FUOYE J. Pure Appl. Sci. (FJPAS) 2024, 9, 130–146. [Google Scholar]
  3. Monteiro, B.; Simões, S. Production and characterization of hybrid Al6061 nanocomposites. Metals 2024, 14, 1206. [Google Scholar] [CrossRef]
  4. Kuttan, A.A.; Rajesh, R.; Anand, M.D. Enhancing Mechanical Properties of Al6061 Alloy with Zirconium and Titanium Carbide Reinforcements. J. Mater. Eng. Perform. 2025, 34, 25468–25482. [Google Scholar] [CrossRef]
  5. Zhan, H.; Mol, J.M.C.; Hannour, F.; Zhuang, L.; Terryn, H.; De Wit, J.H.W. The influence of copper content on intergranular corrosion of model AlMgSi (Cu) alloys. Mater. Corros. 2008, 59, 670–675. [Google Scholar] [CrossRef]
  6. Kairy, S.K.; Rometsch, P.A.; Diao, K.; Nie, J.F.; Davies, C.H.J.; Birbilis, N. Exploring the electrochemistry of 6xxx series aluminium alloys as a function of Si to Mg ratio, Cu content, ageing conditions and microstructure. Electrochim. Acta 2016, 190, 92–103. [Google Scholar] [CrossRef]
  7. Sekhar, A.P.; Mandal, A.B.; Das, D. Mechanical properties and corrosion behavior of artificially aged Al-Mg-Si alloy. J. Mater. Res. Technol. 2020, 9, 1005–1024. [Google Scholar] [CrossRef]
  8. Wang, S.J.; To, S.; Chen, X.; Chen, X.D. An investigation on surface finishing in ultra-precision raster milling of aluminum alloy 6061. Proc. Inst. Mech. Eng. Part B J. Eng. Manuf. 2015, 229, 1289–1301. [Google Scholar] [CrossRef]
  9. Zhang, W.; Wei, J.; Zheng, M.; Si, B.; Zhang, L. Based on the instantaneous milling thickness of unequal pitch end milling cutter milling force solution and simulation research. Int. J. Adv. Manuf. Technol. 2024, 134, 1333–1351. [Google Scholar] [CrossRef]
  10. Kwon, K.B.; Cho, D.W.; Lee, S.J.; Chu, C.N. A fluid dynamic analysis model of the ultra-precision cutting mechanism. CIRP Ann. 1999, 48, 43–46. [Google Scholar] [CrossRef]
  11. Araújo, R.P.; Rolim, T.L.; Oliveira, C.A.; Moura, A.E.; Silva, J.C.A. Analysis of the surface roughness and cutting tool wear using a vapor compression assisted cooling system to cool the cutting fluid in turning operation. J. Manuf. Process. 2019, 44, 38–46. [Google Scholar] [CrossRef]
  12. Wu, S.; Xue, F.; Liu, G.; Chen, W.; Wang, C. Microstructure evolution of titanium alloy in cryogenic cooling cutting. J. Mater. Process. Technol. 2025, 341, 118914. [Google Scholar] [CrossRef]
  13. La Monaca, A.; Murray, J.W.; Liao, Z.; Speidel, A.; Robles-Linares, J.A.; Axinte, D.A.; Hardy, M.C.; Clare, A.T. Surface integrity in metal machining-Part II: Functional performance. Int. J. Mach. Tools Manuf. 2021, 164, 103718. [Google Scholar] [CrossRef]
  14. Han, Z.; Cao, W.; Chen, Z.; Yan, J.; Wu, J.; Hu, Y.; Qu, J.; Zhang, M. Numerical simulation and experimental study of grinding temperature field of high-temperature alloy under different grinding parameters. Mach. Tool Hydraul. 2022, 50, 76–81. (In Chinese) [Google Scholar] [CrossRef]
  15. Li, M.; Wang, Y.; Ni, C.; Zhao, T.; He, Y.; Zhu, Y.; Lan, J. Simulation study of orthogonal milling of 7150-T6 aluminum alloy based on ABAQUS. Tool Eng. 2023, 57, 80–85. (In Chinese) [Google Scholar] [CrossRef]
  16. Lin, B.; Morgan, M.N.; Chen, X.W.; Wang, Y.K. Study on the convection heat transfer coefficient of coolant and the maximum temperature in the grinding process. Int. J. Adv. Manuf. Technol. 2009, 42, 1175–1186. [Google Scholar] [CrossRef]
  17. Liu, H.; Meurer, M.; Schraknepper, D.; Bergs, T. Investigation of the cutting fluid’s flow and its thermomechanical effect on the cutting zone based on fluid–structure interaction (FSI) simulation. Int. J. Adv. Manuf. Technol. 2022, 121, 267–281. [Google Scholar] [CrossRef]
  18. Al Sofyani, S.; Marinescu, I.D. Analytical modeling of the thermal aspects of metalworking fluids in the milling process. Int. J. Adv. Manuf. Technol. 2017, 92, 3953–3966. [Google Scholar] [CrossRef]
  19. Lan, S.; Jiao, F. Modeling of heat source in grinding zone and numerical simulation for grinding temperature field. Int. J. Adv. Manuf. Technol. 2019, 103, 3077–3086. [Google Scholar] [CrossRef]
  20. Mao, J.; Usuki, H.; Tanaka, R.; Morigo, C.; Yukinari, S. Research on effect of ultra-high pressure coolant supplied from flank face in end milling of Ti-6Al-4V supported by CFD simulations. J. Manuf. Process. 2024, 118, 15–31. [Google Scholar] [CrossRef]
  21. Cao, Y.; Liu, C.; Tian, H.; Sun, Y.; Zhang, S. Mechanical behaviors of pipeline inspection gauge (pig) in launching process based on Coupled Eulerian-Lagrangian (CEL) method. Int. J. Press. Vessel. Pip. 2022, 197, 104622. [Google Scholar] [CrossRef]
  22. Hardt, M.; Bergs, T. Considering multiple process observables to determine material model parameters for FE-cutting simulations. Int. J. Adv. Manuf. Technol. 2021, 113, 3419–3431. [Google Scholar] [CrossRef]
  23. Johnson, G.R. A constitutive model and data for metals subjected to large strains, high strain rates and high temperatures. In Proceedings of the 7th International Symposium on Ballistics, The Hague, The Netherlands, 19–21 April 1983. [Google Scholar]
  24. Li, C.; Huo, W. Finite element analysis of single-grit grinding of GH4169 superalloy based on ABAQUS. Tool Eng. 2023, 57, 86–92. (In Chinese) [Google Scholar]
  25. Akram, S.; Jaffery, S.H.I.; Khan, M.; Fahad, M.; Mubashar, A.; Ali, L. Numerical and experimental investigation of Johnson–Cook material models for aluminum (Al 6061-T6) alloy using orthogonal machining approach. Adv. Mech. Eng. 2018, 10, 1687814018797794. [Google Scholar] [CrossRef]
  26. Lesuer, D.R.; Kay, G.J.; LeBlanc, M.M. Modeling Large-Strain, High-Rate Deformation in Metals; (No. UCRL-JC-134118); Lawrence Livermore National Lab. (LLNL): Livermore, CA, USA, 2001. [Google Scholar]
  27. Zhu, S.; Zhao, M.; Mao, J.; Liang, S.Y. A Ti-6Al-4V milling force prediction model based on the Taylor factor model and microstructure evolution of the milling surface. Micromachines 2022, 13, 1618. [Google Scholar] [CrossRef] [PubMed]
  28. Wang, S.; Deng, W.; Zhao, S.; Sun, Z.; Li, X.; Wang, H. A study of diamond cutting mechanism for aluminum alloy 6061 with AlFeSi particle effect: Modeling and simulation. J. Manuf. Process. 2023, 104, 384–404. [Google Scholar] [CrossRef]
  29. Bailey, N.S.; Hong, K.M.; Shin, Y.C. Comparative assessment of dendrite growth and microstructure predictions during laser welding of Al 6061 via 2D and 3D phase field models. Comput. Mater. Sci. 2020, 172, 109291. [Google Scholar] [CrossRef]
  30. Ko, D.H.; Ko, D.C.; Lim, H.J.; Lee, J.M.; Kim, B.M. FE-simulation coupled with CFD analysis for prediction of residual stresses relieved by cryogenic heat treatment of Al6061 tube. Int. J. Precis. Eng. Manuf. 2013, 14, 1301–1309. [Google Scholar] [CrossRef]
  31. Wittmann, F.; Arnautovic, Z.; Heberle, F.; Brüggemann, D. Thermophysical Properties of Silicon Oxide Nanoparticles in Water and Ethylene Glycol–Water Dispersions. Fluids 2024, 9, 261. [Google Scholar] [CrossRef]
  32. Jandron, M.A.; Hurd, R.C.; Belden, J.L.; Bower, A.F.; Fennell, W.; Truscott, T.T. Modeling of hyperelastic water-skipping spheres using Abaqus/Explicit. In Proceedings of the SIMULIA Community Conference, Providence, RI, USA, 19–22 May 2014. [Google Scholar]
Disclaimer/Publisher’s Note: The statements, opinions and data contained in all publications are solely those of the individual author(s) and contributor(s) and not of MDPI and/or the editor(s). MDPI and/or the editor(s) disclaim responsibility for any injury to people or property resulting from any ideas, methods, instructions or products referred to in the content.

Article Metrics

Citations

Article Access Statistics

Article metric data becomes available approximately 24 hours after publication online.