Abstract
Ion adsorption rare-earth (IARE) ores, a strategic metal resource, are extracted by leaching with ammonium sulfate [(NH4)2SO4] solution, our samples have ∑REO grades of 0.032–0.079% wt%. IARE sandstone, mudstone, clay, and strongly weathered rock were selected as test materials. Surface-related physicochemical parameters were determined, and bound water was determined by volumetric flask pycnometry. For each IARE lithology, we also obtained particle size distributions and evaluated bound water variation in (NH4)2SO4 solutions at 0, 1, 2, and 3 wt%. Based on the Gouy–Chapman theory, the relationship between the surface bound water and solution concentration, as well as the surface charge of IARE samples, and other influencing factors was explored. The experimental results show the following: ① The surface charge per unit area of four types of IARE samples, namely mudstone, sandstone, clay, and strongly weathered rock, are 0.7072 × 10⁻² mmol/m2, 1.9620 × 10⁻² mmol/m2, 1.5418 × 10⁻² mmol/m2, and 2.1003 × 10⁻² mmol/m2, respectively, with strongly weathered rock having the highest and mudstone having the lowest. ② As the concentration of aqueous (NH4)2SO4 increases (0, 1, 2, 3 wt%), the total volume reduction in free water ∆V in the system increases, and the mass of adsorbed bound water per unit mass of IARE sample also increases. ③ As the concentration of the solution increases, the thickness of the diffusion double layer on the surface of the IARE sample is compressed, the total amount of adsorbed anions and cations on the surface increases, and the density of the surface water film also increases, leading to a corresponding increase in the quality of adsorbed bound water. ④ Under the same solution concentration, the variation trend of adsorbed bound water mass per unit area of IARE samples is strongly weathered rock > sandstone > clay > mudstone, which is consistent with the trend of surface charge per unit area of IARE samples. A higher lixiviant concentration increases bound water, shrinks the effective pore throats of the ore body, reduces hydraulic conductivity, and consequently diminishes leaching efficiency.
1. Introduction
The concept of adsorbed water in soils was initially proposed by Chilingarian and Vorabutr [] in 1936. Since then, researchers [,,,] have investigated the influence of adsorbed water on clay–water systems. However, there has been a lack of sufficient quantitative data to support this concept. Some scholars have focused on the macroscopic effects of water or solutions on interfaces when studying the impact of solutions on adsorbed water. For instance, Zhang et al. []. utilized the volumetric flask method to observe the overall volume changes in soil–water mixtures. They measured the adsorbed water content on soil particle surfaces by assuming adsorbed water density. Using numerical simulation, Kuhn et al. [] constructed a model of bound water adsorption and found that, for particle surfaces in both pure water and alcohol media, the adsorption isotherm of water molecules shifts from IUPAC type II to type I.
Numerous scholars have also focused on the microscale relationship between water molecules and interfaces. V. I. Osipov [] proposed that stress formed at the mineral–water interface causes water to adsorb into the mineral crystalline layer, leading to structural changes in the mineral. David B. Asay and Seong H. Kim [] elucidated that hydrogen bonding with immobilized surface hydroxyl groups (Si—OH) influences the molecular configuration of adsorbed water. The structural transformation of water molecules profoundly affects the adsorption of isotherms and oxidized silicon surfaces. Dietmar Neuhaus [] performed adsorption and desorption cycles on the sample surface using water as a pretreatment. After multiple cycles, the treated sample surface exhibited faster and stronger adsorption of water molecules compared to the untreated sample. Moreover, there were small amounts of specially arranged water molecules on the treated sample surface, providing support for water adsorption.
Based on the structural characteristics of Clay particles, scholars have examined the macroscopic behavior of Clay from a microscopic perspective. The Gouy–Chapman theory, introduced by Chapman [] and Gouy [], explains the interaction among Clay particles, basic particles, cations, and water. Clay particles possess both permanent and variable charges on their surfaces and edges, resulting in an overall negative charge and the generation of a negative electric field on the surface. When Clay particles come into contact with a solution, the counterions in the solution are influenced by both the electric field force from the Clay particle surface and the diffusion force caused by the thermal motion of ions themselves. Certain polar water molecules and hydrated cations near the Clay particle surface experience strong attraction from the electric field of the Clay particle surface. Consequently, they become firmly adsorbed [], forming a region known as the Stern layer or strongly bound water layer.
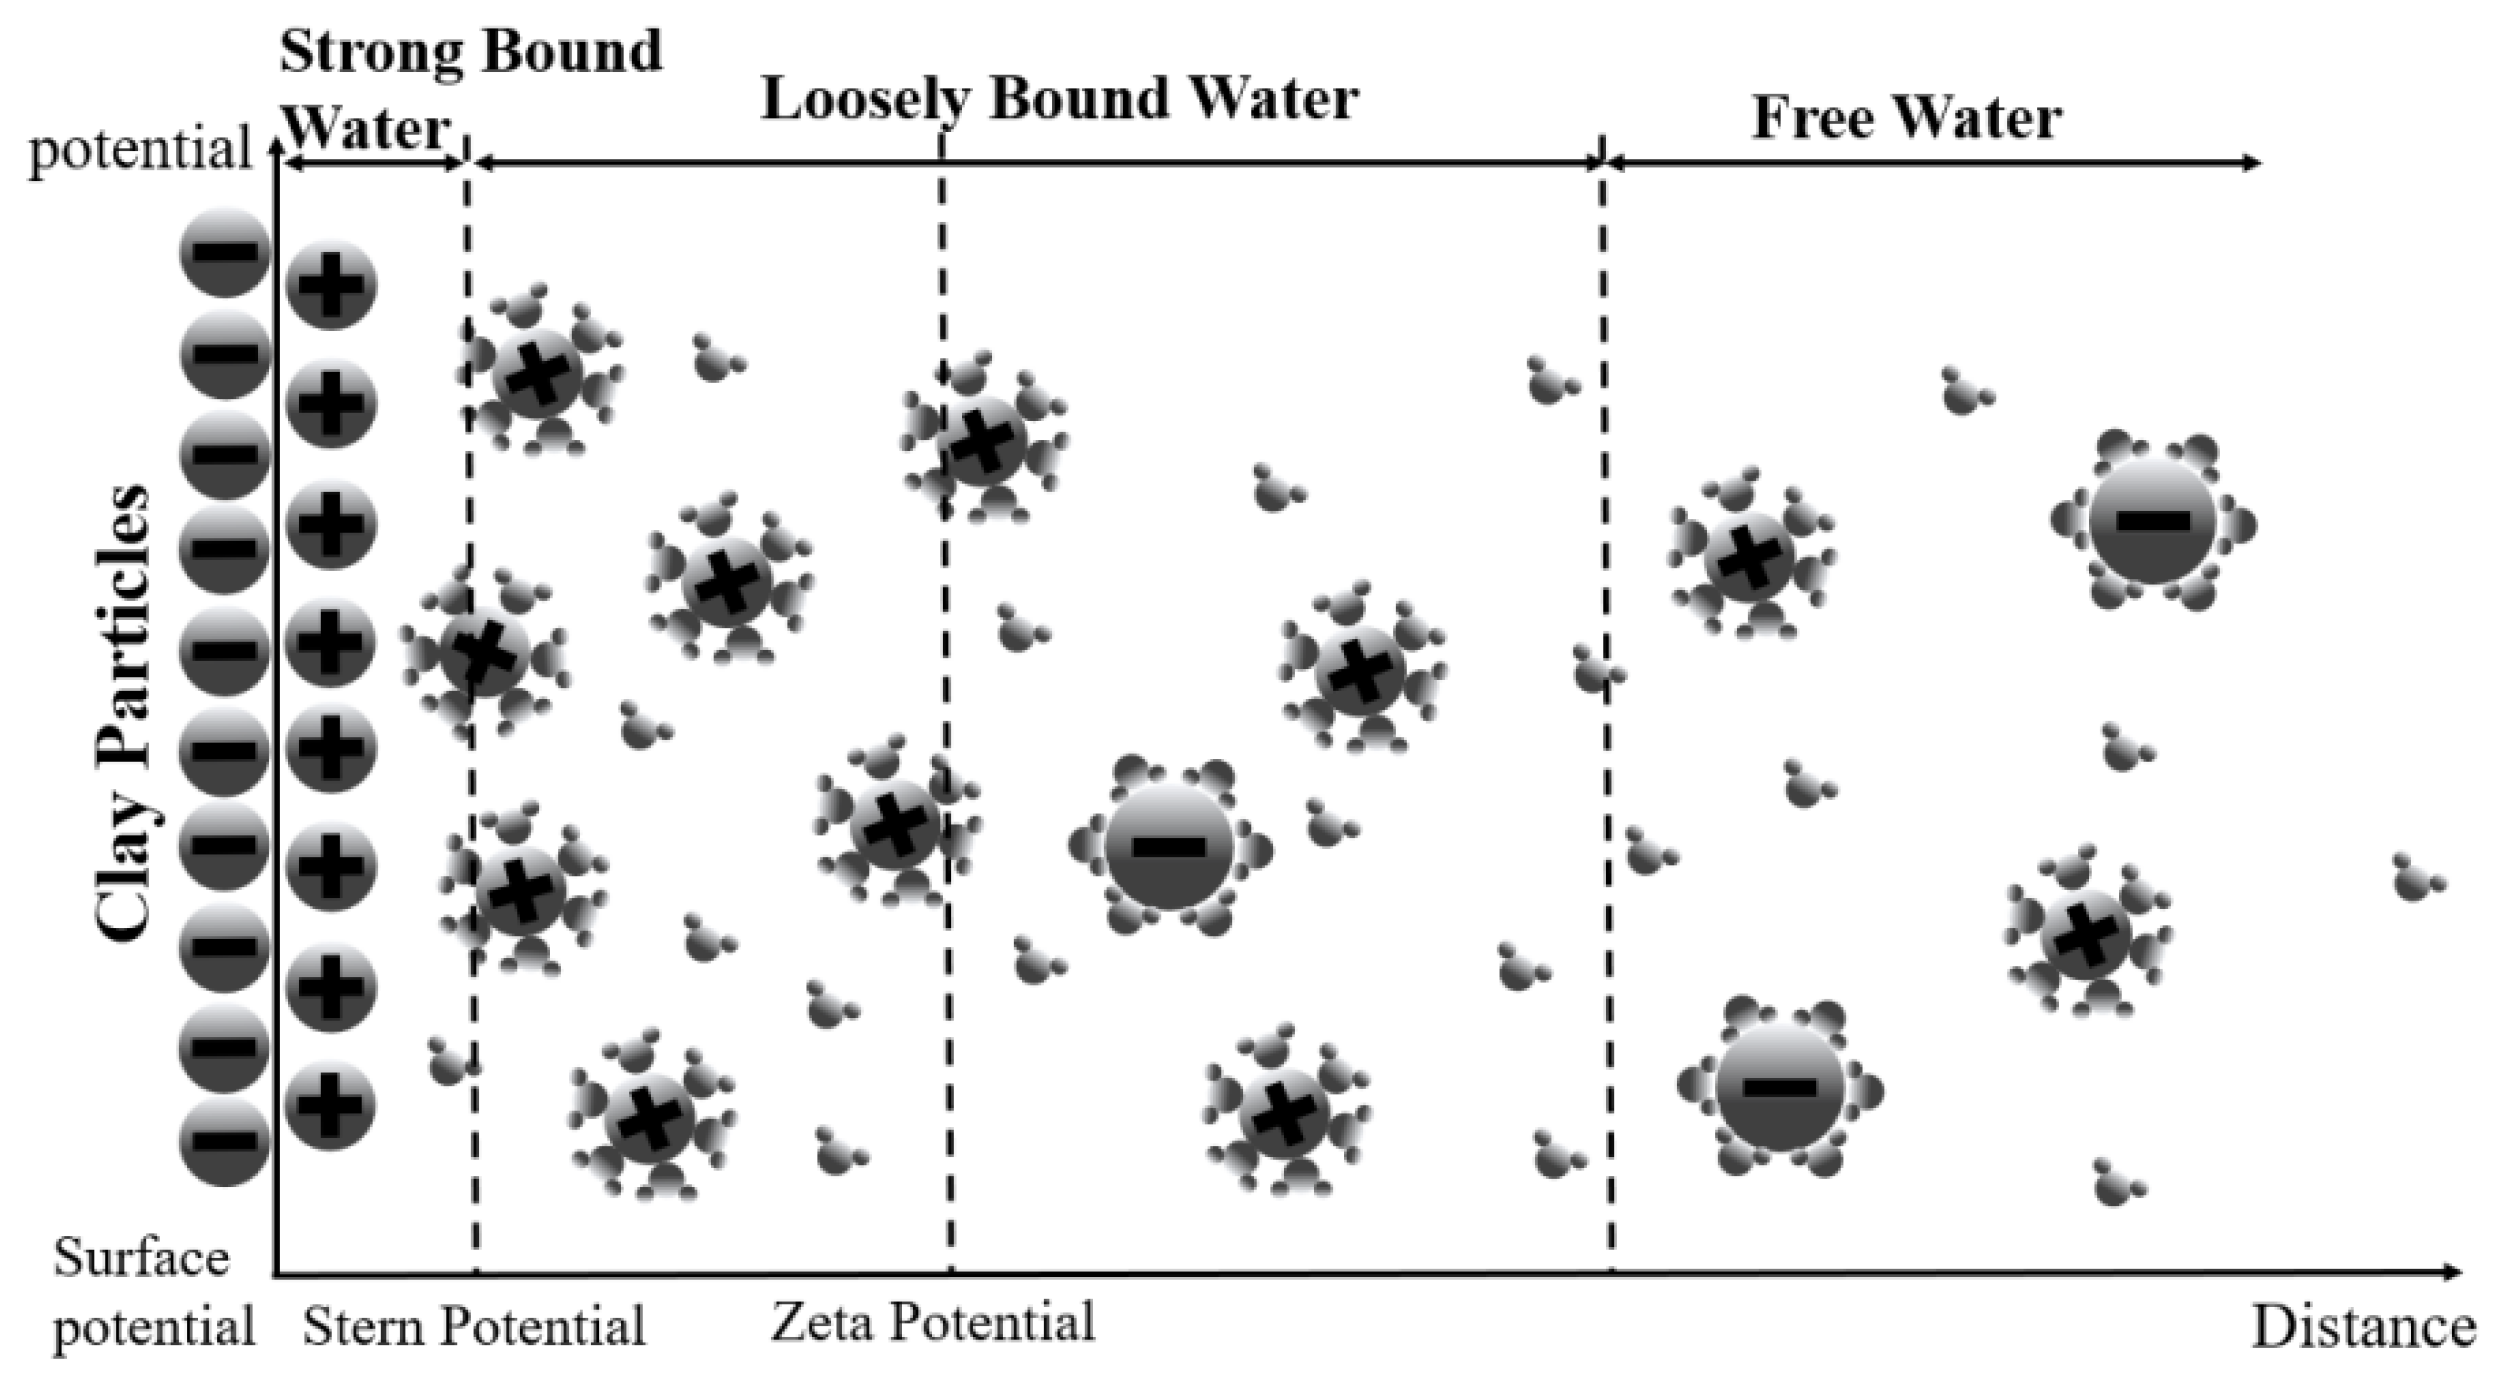
In this layer, these molecules and cations lose their mobility and arrange themselves in an orderly manner. The strongly adsorbed water is considered part of the solid phase, creating a quasi-solid layer that envelops the Clay particle surface. This layer possesses load-bearing capacity and shear resistance, with a density ranging from 1.3 to 1.8 g/cm3 []. It is eliminated within the temperature range of 120 to 300 °C []. Other polar water molecules and hydrated cations, which are slightly farther away from the particle surface, are distributed in the bulk solution surrounding the particles. They form a diffuse layer referred to as the Gouy layer or weakly bound water layer. In this layer, the particles experience a weakened attraction from the Clay particles, allowing for mobility but exhibiting a loose and irregular arrangement. The Gouy layer has a higher viscosity and shear strength compared to the strongly bound water and has a density close to 1.0 g/cm3 []. It is removed within the temperature range of 75 to 120 °C. The Stern layer and the Gouy layer together constitute the counterion layer, which, along with the negative charge on the Clay particle surface, forms a double electric layer [,]. Li et al. [] proposed a structural model for the formation of bound water on the surface of Clay minerals, as depicted in Figure 1.
Figure 1.
Classification of Bound Water in Soil.
Building on Xu Renkou’s work [], charged soil particles form an electric double layer (EDL) upon contact with polar liquids; within this interfacial region, ions undergo hydration/polarization and may also participate in ion-exchange reactions [,]. Falsone et al. [] showed that in the clay-deposited muddy Bx layer, cations—beyond water alone—enhance clay flocculation. The structure and properties of water in clay differ at low versus high water contents. Below the hydration thresholds for clay surfaces and exchangeable cations, interfacial water is organized differently from bulk water; adsorbed (bound) water is governed primarily by the surface electric field and double-layer cations []. Using X-ray diffraction and density-bottle measurements, prior studies [] related the density of water adsorbed by Na-montmorillonite to its water content. At low contents, strongly bound water forms on clay surfaces due to the dipole nature of water, with a thickness of ~10 Å (≈ three molecular layers) and a density > 1 g cm−3 (average ~1.3 g cm−3). The water-film thickness is influenced by particle specific surface area, particle shape, and surface charge density. For cylindrical and spherical particles, the double-layer thickness increases with the dimensionless particle radius and declines with decreasing absolute surface-charge density [].
Bentonite, specifically montmorillonite, exhibits a significantly higher specific surface area and surface charge density compared to other soil types. Incorporating bentonite as a soil amendment can effectively enhance soil moisture, water-holding capacity, and saturated hydraulic conductivity, particularly during dry periods with low rainfall []. The presence of electrolytes also impacts the physicochemical properties of soil. Agricultural studies have demonstrated that high-concentration solutions can reduce soil permeability, particularly in Clayey soils []. The salinity of irrigation water can induce changes in soil structure and permeability [], leading to alterations in soil water retention and impeding water and nutrient uptake by plants, thereby adversely affecting plant growth. Investigation into the dissolution of southwestern purple shale and the release of cations by simulated acidic solutions revealed that acidic solutions promote the release of cations from the rock–soil system compared to deionized water []. In the leaching of ion-type rare earth ores, increasing the concentration of the leaching solution facilitates the leaching of rare earth ions (such as Nd3+, Sm3+, Dy3+, and Yb3+). However, excessively high concentrations of the leaching solution do not enhance the leaching efficiency of rare earth ions [].
The investigation of the impact of different solution concentrations on the content of adsorbed-bound water holds significant research implications in various fields, including chemical engineering, environmental engineering, and mining engineering. In solution-leaching extraction of IARE ores, leaching efficiency is governed by the efficiency of fluid percolation. Different lixiviant concentrations lead to different amounts of bound water, which change the effective pore size of the ore body and thus its permeability and leach performance.
In this study, four types of rock–soil samples, namely Mudstone, Sandstone, Clay, and highly weathered rock, were selected. The physical and chemical parameters of the soil samples were determined, and the content of bound water on the soil particle surfaces in solutions of varying concentrations was measured using the volumetric flask method. The influence of solution concentration on the bound water content of soil particle surfaces using the Gouy–Chapman framework, considering pH, temperature, ion valence and bulk concentration (zi, ni0) for NH4+ and, and the surface potential φ0.
2. Theoretical Derivation
Assuming a uniform surface charge distribution on soil particles without specific ion adsorption, the surface of Clay particles can be treated as an infinitely extended plane with uniform charge. The surrounding region is considered as an ideal solution, and the ions in the solution are treated as point charges. The ideal solution refers to a bulk solution identical to the one initially prepared. When focusing solely on the x-direction, the distribution of ammonium ions and sulfate ions within the diffuse layer of the particle surface double layer follows the Boltzmann distribution, as represented by Equation (1):
where ni(x) is the concentration (mol/m3) of the i-ion at a distance x from the particle surface, while ni0 is the concentration (mol/m3) of the i-ion in the bulk solution, φ(x) is the electrostatic potential, zi is the valence (charge number) of ion i, F is the Faraday constant, R is the gas constant, 8.314 J·mol−1·K−1, T is the temperature (K).
The spatial charge density ρ at a specific location on the particle surface can be described by Equation (2):
The electric potential φ can be determined by solving Poisson’s equation (Equation (3)):
where ε is the dielectric constant (permittivity). By substituting Equation (2) into Poisson’s equation, the resulting equation is known as the Poisson–Boltzmann equation, represented by Equation (4):
According to the Poisson–Boltzmann equation (Equation (4)), The equilibrium amount of ion i adsorbed within a particular interval of the diffuse layer follows Equation (5).
where Ni(eq) is the equilibrium adsorbed amount of ion iii in the diffuse layer, S is the specific surface area of soil particles (m2/g), and κ is the Debye-Hückel parameter. The inverse of κ corresponds to the thickness of the diffusion layer (m).
Gouy and Chapman derived an analytical solution for the potential distribution in a 1:2 electrolyte system when solving the Poisson–Boltzmann equation [,,]. The solution is given by Equation (6):
where , .
Consideration of the influence of ammonium ions (zNH = 1) and sulfate ions (zSO = −2) allows us to substitute Equation (6) into Equation (5) for calculating the equilibrium adsorption amounts of these ions. The resulting equations are as follows:
In the process of determining parameter “a” it is crucial to ascertain the surface potential φ0 of the particles. Specifically, in the context of solely considering the double layer in the x-direction and achieving adsorption equilibrium, Equation (9) represents the description of the average concentration of ions within the diffusion double layer, denoted as “n”:
When substituting the Boltzmann distribution equation (Equation (1)) into Equation (9), we obtain the following expression:
By substituting Equation (6) into Equation (10) and integrating, the result is:
Based on Equation (6), the relationship between φ0 and a can be obtained:
Based on Equations (11) and (12), an approximate expression for φ0 can be obtained:
To characterise the adsorption state of bound water on the soil sample’s surface in ammonium sulphate solutions of varying concentrations, this paper proposes using the Gouy–Chapman model. The connection between the mass of bound water on the soil sample’s surface and ammonium sulphate concentration was identified by measuring the appropriate physicochemical parameters on its surface and employing a volumetric flask test. Finally, the Poisson–Boltzmann equation was employed, determining the main influencing factors of the total mass of the bound water present on the soil sample’s surface. This was accomplished by calculating the trend of the adsorbed cation concentration, with respect to the ammonium sulphate solution’s concentration.
3. Material and Methods
3.1. Experimental Design
The adsorbed bound water content on soil particle surfaces was measured using the volumetric flask method in solutions with ammonium sulfate concentrations of 0%, 1%, 2%, and 3%. The (NH4)2SO4 solutions at 1, 2, and 3 wt% were prepared on a mass-percent basis; their molar concentrations are approximately 0.0758, 0.1522, and 0.2293 mol L−1, respectively. The IARE samples were analyzed for particle size and specific external surface area using a Malvern particle size analyzer. The cation exchange capacity was determined using the cobalt hexamine trichloride extraction-spectrophotometric method [], and the bulk density was measured using the pycnometer method []. The experiment aimed to investigate the factors influencing the adsorbed bound water content on soil particle surfaces in different concentration systems.
3.2. Experimental Materials
To explore the general impact of solution concentration on adsorbed bound water content, experiments were performed on four different IARE samples: Sandstone, Mudstone, Clay, and highly weathered rock. The Mudstone and Sandstone samples were obtained from Xigeda Mudstone and Sandstone in Panzhihua, Sichuan Province, China, as illustrated in Figure 2a,b. The Clay and highly weathered rock samples were collected from Pingnan County and Jinjiang City, respectively, in Fujian Province, China, as depicted in Figure 2c,d.
Figure 2.
Different IARE samples (a) Xigeda Mudstone (Mudstone); (b) Xigeda Sandstone (Sandstone); (c) PingNan Rare Earth (Clay); (d) JinJiang Rare Earth (Strongly weathered rock).
Xigeda soil is a region-specific soil found in the western part of Panzhihua, China. It is named after the Xigeda Village, where it is exposed. It represents a typical deposit of lacustrine sedimentary formations characterized by a rhythmic sedimentary pattern with a grain size trend that fining upward within each sedimentary unit. The lithology of Xigeda soil transitions from fine Sandstone to silty Sandstone, followed by siliceous sandy Mudstone, and finally Mudstone with an increasing grain size at the base of each sedimentary unit []. Mudstone, composed mainly of Clay-sized and silt-sized particles, is predominantly formed in the upper portion of the sedimentary rhythm cycle during the process of sedimentary differentiation. Xigeda soil can be classified into two primary categories based on its composition: Mudstone and Sandstone. Illite, montmorillonite, chlorite, quartz, and iron oxides are the major components found in Xigeda Mudstone according to Peng Shengen []. Conversely, Xigeda Sandstone, as reported by Wen Lina [] and You Hong [], primarily consists of quartz, illite, and a small amount of montmorillonite. For the experiment, the Mudstone sample was obtained from the uppermost layer of the sedimentary formation, while the Sandstone sample was collected from the lowermost layer, specifically the fine Sandstone stratum, during the sedimentary formation process.
Clay is composed of Quaternary loose alluvial deposits and consists of fine-grained Clay. It displays a pale gray-yellow to light gray color and possesses a soft, plastic texture. The Clay soil exhibits a certain degree of flowability, ranging from slightly moist to wet. It contains a small amount of sand particles and exhibits moderate dry strength and toughness. The surface of Clay appears relatively smooth and does not exhibit any noticeable shaking or vibrating reaction.
The Strongly weathered rock belongs to the Hetian rock mass and is classified as an Early Yanshan intrusive fine-grained biotite granite. The rock exhibits colors ranging from reddish-pink to gray-white, while weathered portions display shades of yellow-brown, reddish-brown, and beige. Semi-weathered areas exhibit a yellow-brown to gray-white color. It possesses a medium to fine-grained granite structure, with grain sizes varying between 2 and 10 mm. Occasional large potassium feldspar phenocrysts with grain sizes larger than 10 mm may also be present. The major mineral components of the rock include potassium feldspar (40–60%), plagioclase feldspar (15–30%), quartz (20–25%), and biotite (3–5%). Additionally, the rock contains accessory minerals such as magnetite, hematite, zircon, xenotime, apatite, epidote, and sphene.
The IARE material examined here is a soil/regolith (not hard rock) in which REE occur as exchangeable cations on clay–mineral surfaces. Clay minerals are inherently hydrophilic: permanent negative layer charge on basal planes and protonatable edge hydroxyls align water dipoles and support hydrogen bonding, favoring interfacial (bound) water formation. Our objective in this study was to isolate how the lixiviant concentration affects the bound water content of ion adsorption rare-earth (IARE) ores during leaching, so as to provide practical guidance for IARE mining operations. Accordingly, we used as-collected (raw) ore samples directly, rather than processed proxies, to preserve field representativeness. While we did not measure macroscopic contact angles or surface roughness (Ra/Rq) in this study, these properties will be incorporated in future work to quantify their effects on bound water.
To eliminate the pre-existing adsorbed water on the surface of the IARE samples, the samples were dried and cooled at 573.15 K for 24 h []. The glass capacity bottles and funnels were also dried and cooled at 398.15 K. The IARE samples, capacity bottles, and funnels were then cooled to the laboratory temperature. To elucidate the differences in water adsorption by IARE particles in different concentration solutions, ammonium sulfate solutions with mass fractions of 1%, 2%, and 3% were prepared and compared with deionized water.
The particle size analysis and specific surface area determination of the four IARE samples were conducted using a Malvern particle size analyzer. The cation exchange capacity of the IARE samples was determined using the cobalt hexamine chloride extraction and spectrophotometry method. The specific gravity of the IARE samples was measured using a specific gravity bottle.
3.3. Experimental Method
When soil particles are immersed in water, the cohesive forces between Clay particles are overcome by the wedging force of water molecules. This enables effective dispersion and water adsorption by the soil particles, mirroring the natural processes of soil water adsorption during rainfall, irrigation, and groundwater fluctuations. Negatively charged soil particles adsorb cations to maintain electrical neutrality. Moreover, when dry soil particles are exposed to air under natural humidity conditions for an extended period, they adsorb water molecules from the air, leading to an increase in moisture content until reaching maximum capacity [].
In the case of soil particles immersed in a polar solution, the interface between the two phases becomes charged. To maintain electrical neutrality, the particle surfaces adsorb counterions from the liquid phase, establishing equilibrium. The hydration layer adjacent to the soil surface consists of water molecules that are directly hydrated by surface activation centers. In our experiments, the interactions of water molecules with particle surfaces—via coordination, electrostatic forces, and hydrogen bonding—occurred within a mildly acidic to near-neutral window. Specifically, the measured pH values (298.15 K) for (NH4)2SO4 solutions at 0, 1, 2, and 3 wt% were approximately 7.0, 5.04, 4.89, and 4.80, respectively. Within this pH range (~4.8–7.0), basal surfaces retain permanent negative charge from isomorphous substitution, while edge hydroxyls are variably protonated; thus both electrostatic orientation of interfacial water and hydrogen-bonding to surface hydroxyls are operative. Although pH co-varies with concentration, the dominant control on interfacial water densification in our tests is the increase in ionic strength; the pH variation remains within a narrow, mildly acidic range and does not alter the qualitative conclusions.
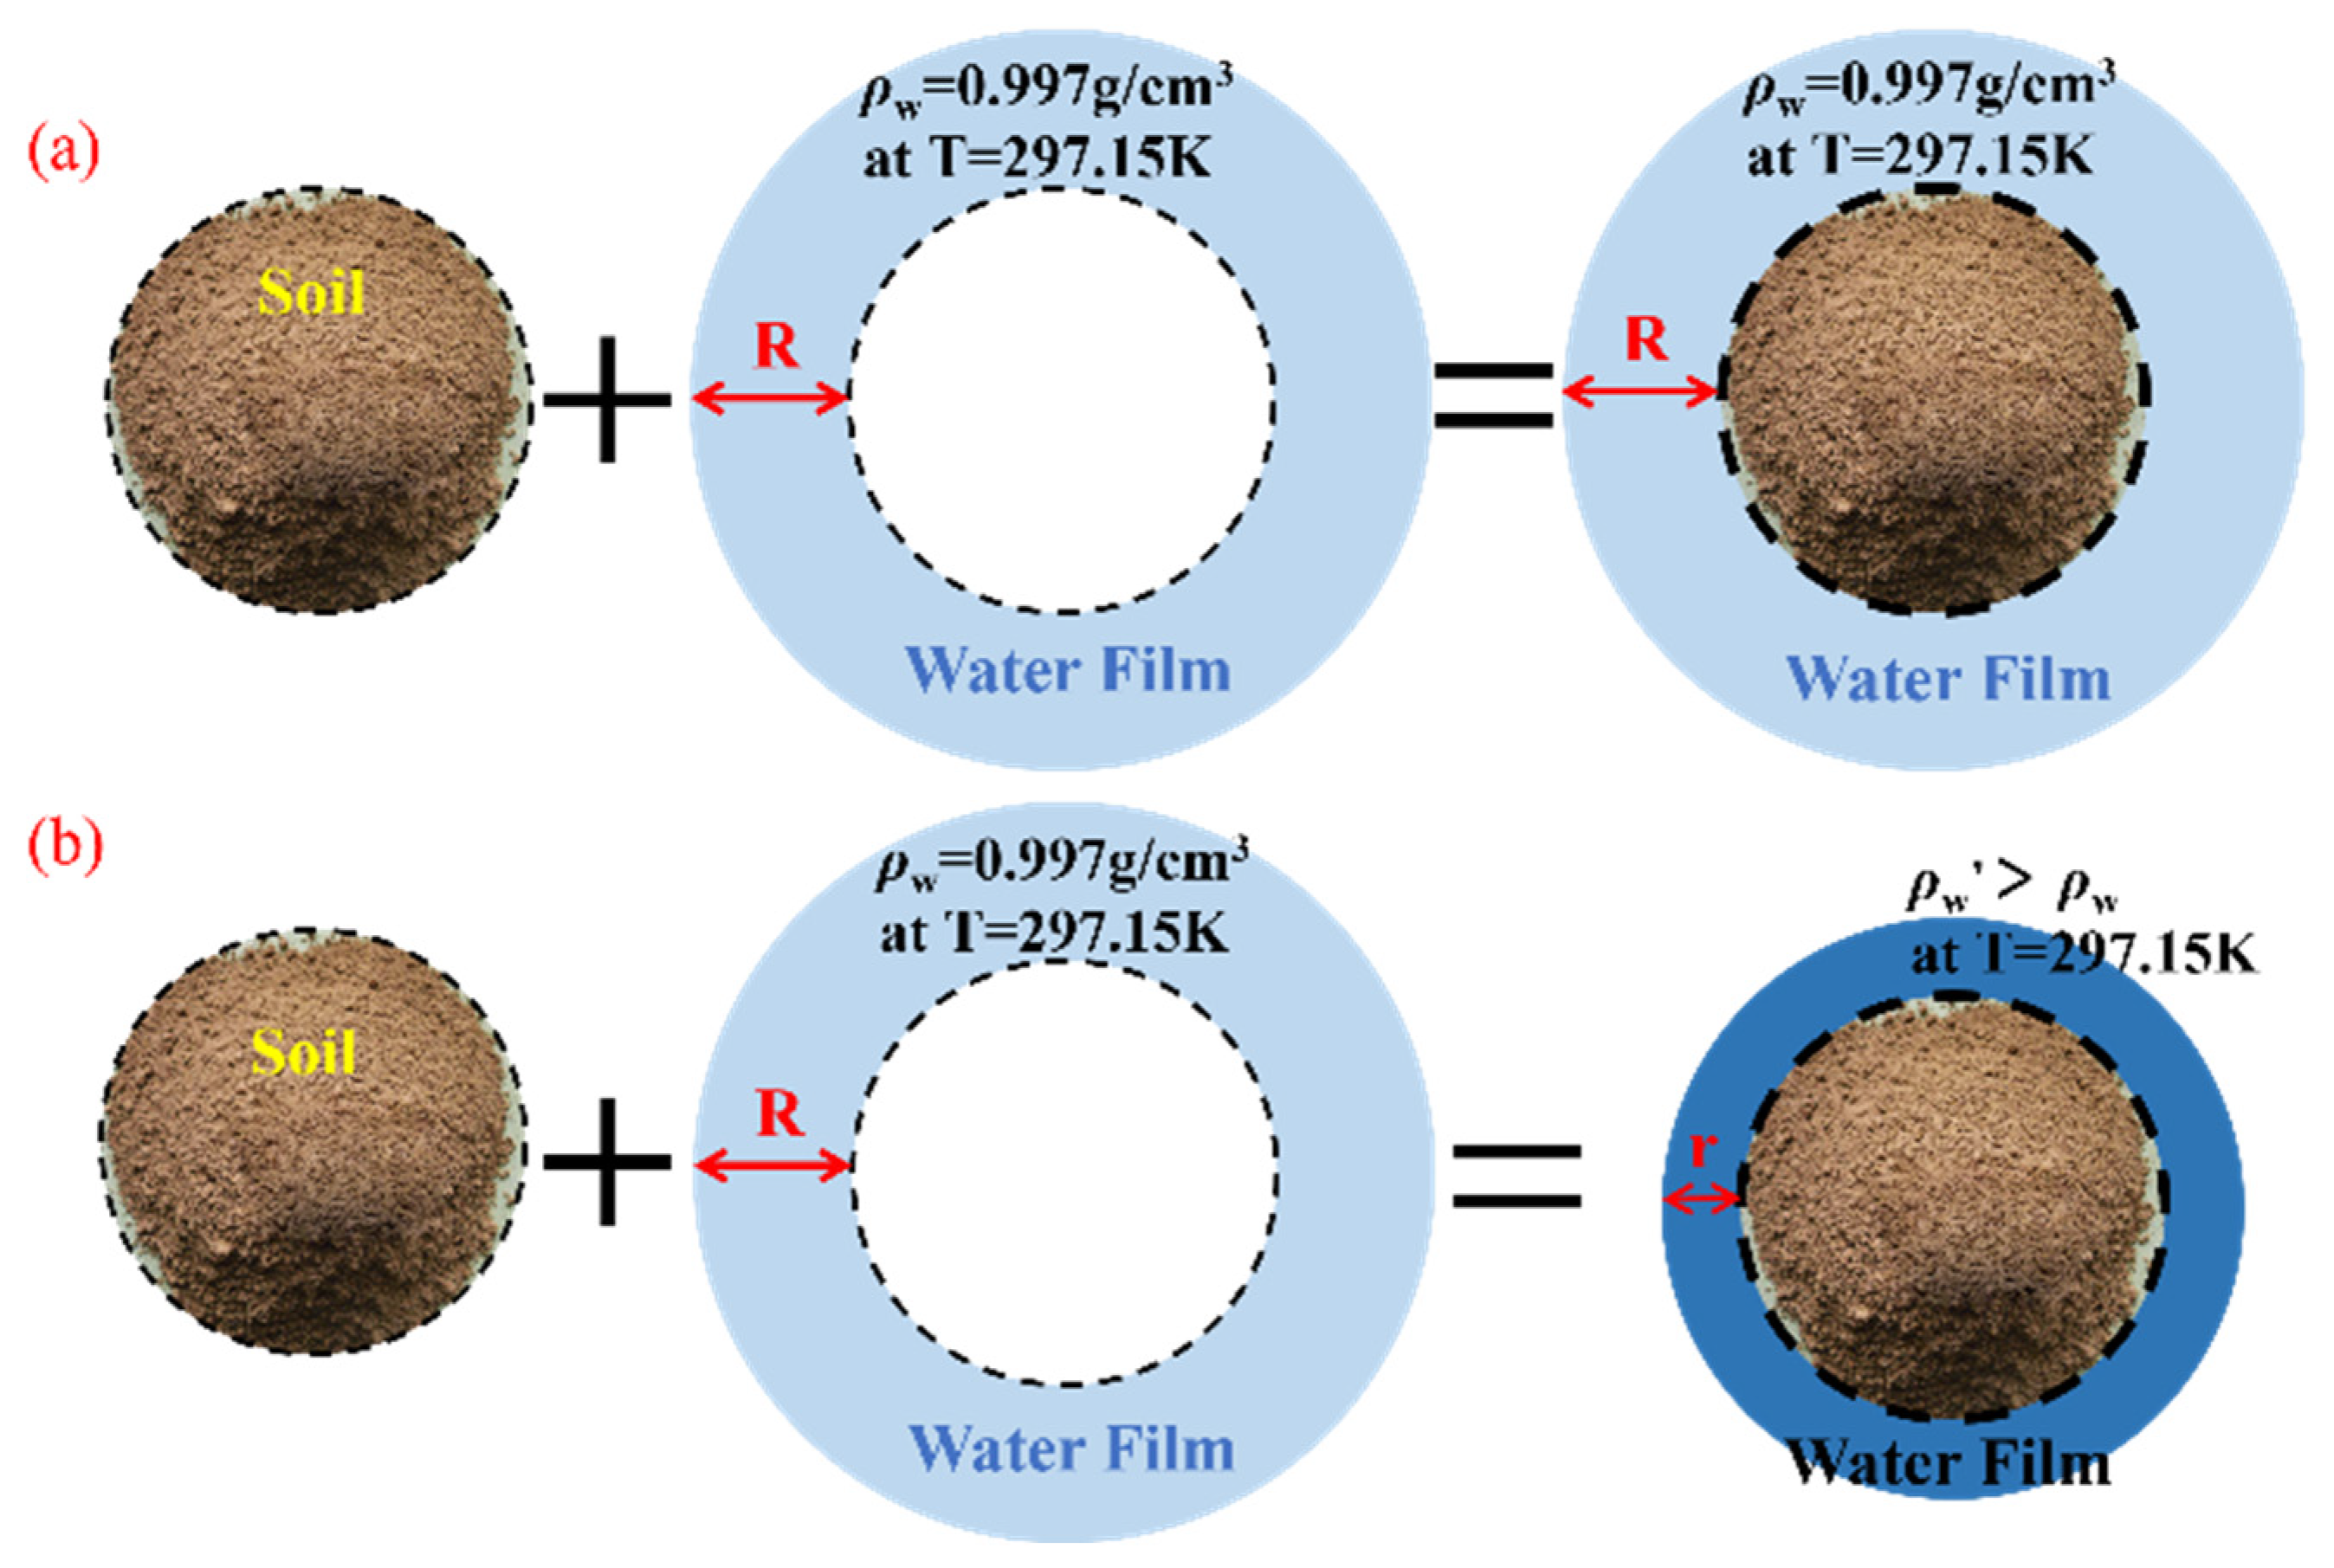
The capacity bottle method [] is based on the principle that the transformation of free water in the liquid phase into bound adsorbed water in the solid phase results in a change in water volume due to an increase in density and a decrease in volume. Figure 3 illustrates this process: (a) In ideal conditions, the water film on the soil particle surface is unaffected by the electrostatic forces of the particle surface. Thus, the density of the water film equals that of free water, and the volume of soil particles enveloped by the water film is equal to the sum of the volumes of dry soil particles and water. (b) In actual conditions, the water film on the soil particle surface is influenced by the electrostatic adsorption forces of the particle surface, resulting in a thinner water film with a higher density than free water. This leads to a decrease in volume, and the final mixed volume is smaller than the sum of the individual volumes. The capacity bottle method is straightforward, practical, and capable of reflecting changes in adsorbed water content, making it increasingly popular among researchers.
Figure 3.
Schematic Diagram of Surface Bound Water (a) Ideal state (b) Actual state.
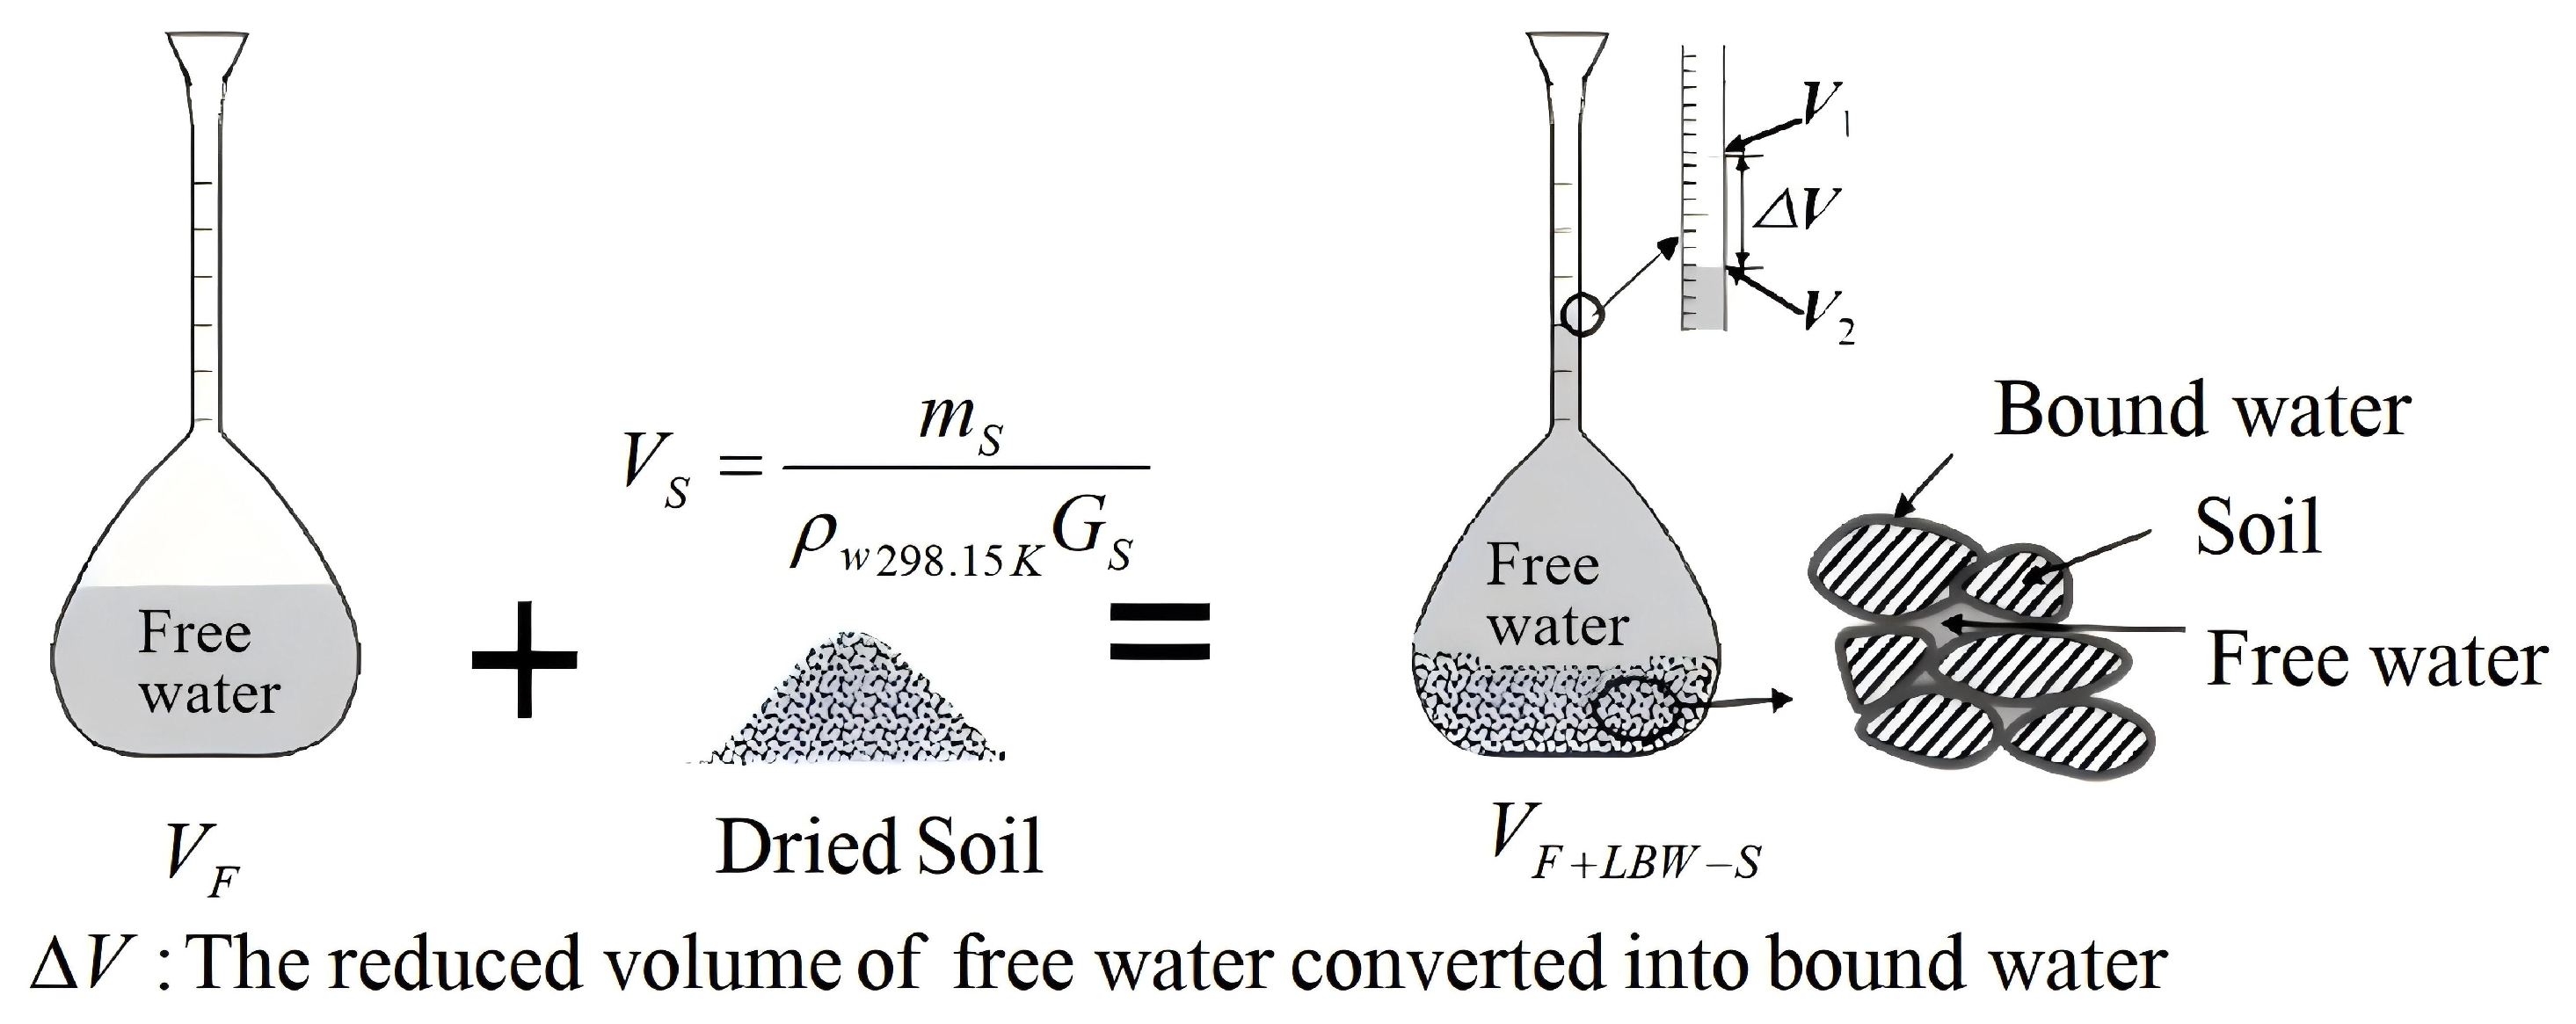
The experimental procedure employed the capacity bottle method, as depicted in Figure 4 []. The temperature during the experiment was maintained at 298.15 K. Initially, a mass of soil sample (ms in g) was placed inside the capacity bottle. Subsequently, a volume of ammonium sulfate solution (VF in ml) was added to the bottle using a funnel. To ensure proper immersion of the soil sample and eliminate air bubbles, the bottle was oscillated. A micro-porous stopper was tightly sealed on the bottle. Within the first 24 h, gentle oscillations of the bottle were performed 1–2 times to enhance particle dispersion and air release. Once the water level reached a stable state without any further changes, the experiment was concluded, and the final reading of the concave liquid surface (V2 in mL) was recorded. Adsorption of bound water in IARE samples is a time-dependent process, and the measured bound water content is therefore a process-dependent quantity. We took pycnometric readings every 24 h and continued until the volume change stabilized; this ensures that the reported bound water content corresponds to the stabilized maximum. For montmorillonite-rich specimens, a 24-h pre-equilibration in the target solution preceded measurements. Deionized water blanks were run to assess residual swelling effects. Under ideal conditions, the total volume (V1 in ml) of the soil particles and the solution was calculated using Equation (14). Additionally, the volume variation in free water (∆V in mL) was determined according to Equation (15):
Figure 4.
Volumetric flask schematic.
The capacity bottle method was employed to measure the transformation of free water into adsorbed-bound water, as illustrated in Figure 4. The dry soil sample, with a mass of ms (g), was added to the capacity bottle along with a predetermined amount of solution. During the transformation, the mass of the converted free water remained constant, but its density increased, leading to a decrease in the volume (∆V in mL) of the water. This volume variation can be calculated using the following equation:
The expression for the adsorbed-bound water (wg) can be derived using Equation (17), where γwe represents the average density of bound water, which is equal to 1.8 g/cm3; γwt represents the density of free water at temperature t °C.
The equation for wg is as follows:
4. Results and Discussion
4.1. Analysis of Particle Size Distribution and Property Parameters of the Tested IARE Samples
The grading analysis results of the IARE samples provide information on the particle size distribution. The particle analysis results table and the cumulative curve chart display various parameters, including the restricted particle sizes (d60 and d30), effective particle size (d10), non-uniformity coefficient (Cu), and curvature coefficient (Cc) of the four IARE samples. The restricted particle sizes (d60 and d30) and effective particle sizes (d10) are determined based on the cumulative content of 60%, 30%, and 10% on the non-uniform IARE accumulation curve. These values indicate the range of particle sizes and the shape of particle distribution on the particle size distribution curve. The non-uniformity coefficient (Cu) and curvature coefficient (Cc) can be calculated using Equations (18) and (19), respectively, based on the restricted particle sizes (d60 and d30) and effective particle size (d10) of the IARE:
Based on the data presented in Table 1, several observations can be made regarding the coefficient of uniformity (Cu) and coefficient of curvature (Cc) for the different IARE samples. Comparing the Sandstone and Mudstone samples, it is evident that the Sandstone has higher values for both Cu and Cc. This indicates that the particle sizes in the Sandstone are more uniformly distributed, resulting in better gradation compared to the Mudstone. In contrast, the Mudstone exhibits relatively similar particle sizes, indicating good sorting and uniformity, but poorer gradation. As for the Clay and weathered rock samples, their particle size distribution curves show some similarities within a broader range of particle sizes. However, below the 60% cumulative content, the weathered rock sample’s curve is steeper than that of the Clay sample, suggesting a higher proportion of fine particles in the weathered rock. Although the Clay and weathered rock samples have comparable values for Cu and Cc, the weathered rock sample demonstrates better gradation compared to the Clay sample. In conclusion, the Sandstone stands out for its good gradation due to its uniform particle distribution. The Mudstone exhibits relatively uniform particle sizes but poor gradation. The Clay and weathered rock samples show similar values for Cu and Cc, but the weathered rock sample demonstrates better gradation compared to the Clay sample.
Table 1.
IARE Samples Lithology and Basic Physical Indicators.
Figure 5 reveals distinct characteristics of the particle size distribution curves for the Mudstone and Sandstone samples. The Mudstone curve exhibits a steep slope, indicating a narrow range of particle sizes. The majority of particles in the Mudstone fall within the <0.005 mm size range, consisting mainly of Clay-sized particles which account for 61.53% of the total content. The remaining portion comprises silt-sized particles, constituting 38.47% of the content. In contrast, the Segedah Sandstone, Clay, and weathered rock samples demonstrate particle size distributions primarily concentrated in the 0.075 mm to 0.005 mm range. Within this range, silt-sized particles dominate, with the content distribution ranking as follows: Strongly weathered rock > Clay > Sandstone. Additionally, these three IARE samples contain substantial amounts of Clay-sized particles and varying proportions of fine sand, medium sand, and coarse sand.
Figure 5.
Distribution of Grading Parameters of Rocks in IARE Samples.
Table 2 presents the specific surface area (S), cation exchange capacity (CEC), and specific gravity (Gs) of the four IARE samples. Notably, Mudstone exhibits the highest specific surface area, which is approximately twice that of the other three IARE types. However, its cation exchange capacity is approximately half that of the other three IARE types. The specific surface areas of all four IARE samples range from 2.63 to 2.76. Using the ratio method to calculate the surface charge per unit specific surface area, the values for the Mudstone, Sandstone, Clay, and weathered rock are as follows: 0.7072 × 10⁻² mmol/m2, 1.9620 × 10⁻² mmol/m2, 1.5418 × 10⁻² mmol/m2, 2.1003 × 10⁻² mmol/m2, respectively. Among these values, the weathered rock exhibits the highest surface charge per unit specific surface area, while the Mudstone demonstrates the lowest value.
Table 2.
Physical and Chemical Parameters of IARE Samples.
4.2. Analysis of the Results of the Volumetric Flask Method
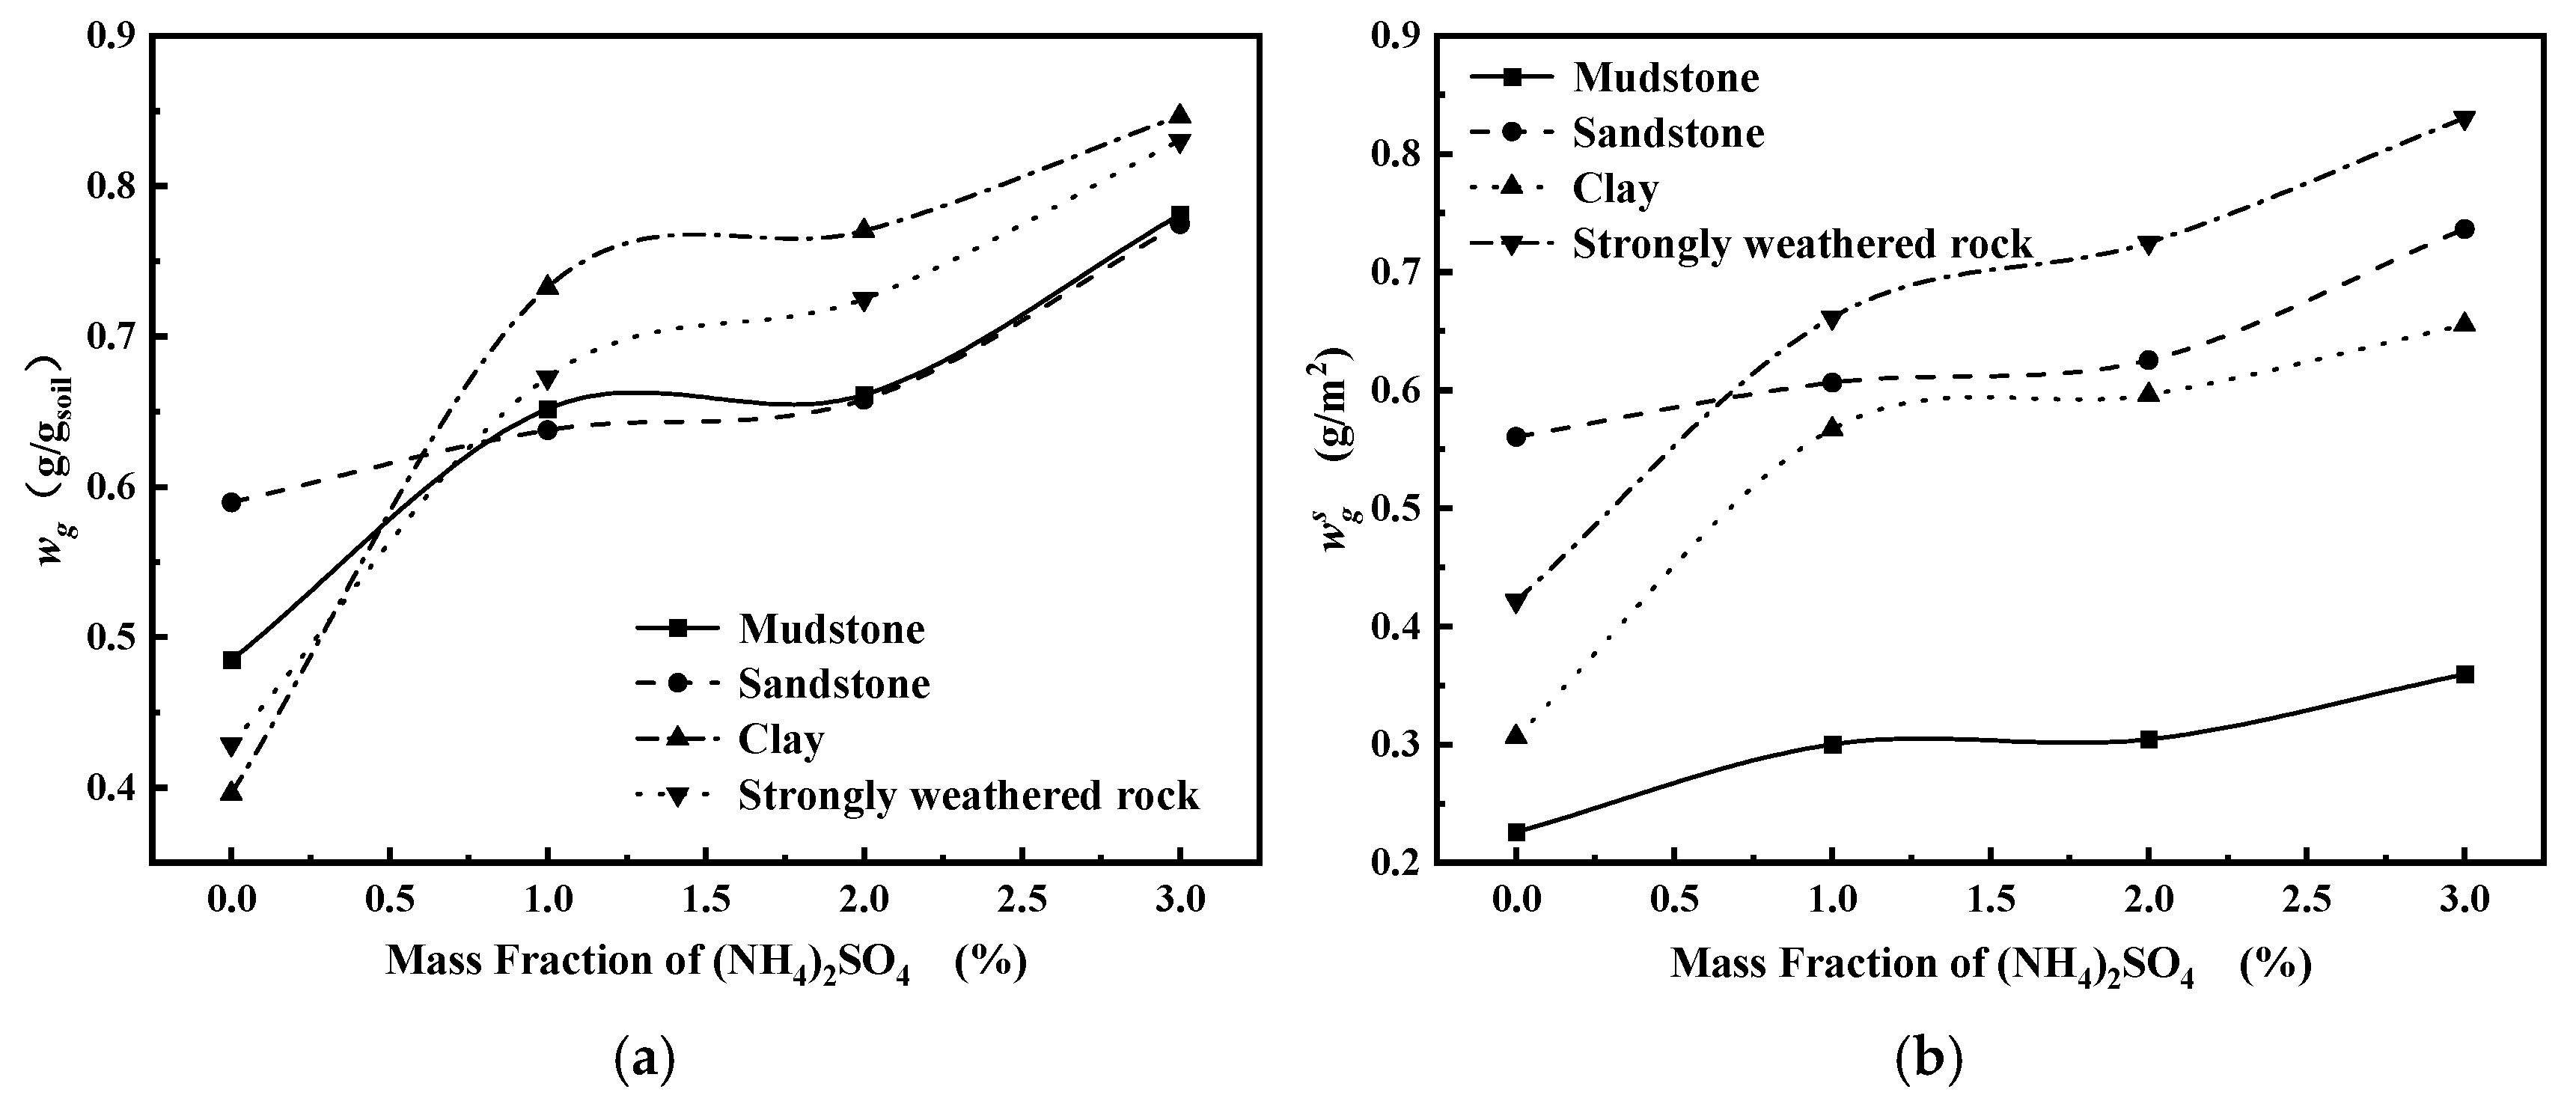
Figure 6a illustrates the trend of the mass of adsorbed bound water per unit weight of IARE with varying concentrations of ammonium sulfate. The data obtained from the volumetric flask method provide the following insights: (1) As the solution concentration increases, the adsorbed bound water content of the IARE tends to increase. (2) The Xigeda Group IARE exhibits a higher ability to adsorb deionized water compared to Clay and Strongly weathered rock. The order of adsorption capacity is as follows: Sandstone > Mudstone > Strongly weathered rock > Clay. The mass of adsorbed bound water per unit weight of IARE is 0.2155 g/gsoil, 0.2621 g/gsoil, 0.1760 g/gsoil, and 0.1905 g/gsoil, respectively. (3) Clay and Strongly weathered rock show significantly higher adsorption capacities for ammonium sulfate solution compared to Mudstone and Sandstone. Under the same concentration conditions, there are variations in the adsorbed-bound water content among different IARE samples. When the mass fraction of ammonium sulfate solution is 1%, the order of adsorbed bound water content is as follows: Clay > Strongly weathered rock > Mudstone > Sandstone, with the mass of adsorbed bound water per unit weight of IARE being 0.7325 g/gsoil, 0.6728 g/gsoil, 0.6517 g/gsoil, and 0.6377 g/gsoil, respectively.
Figure 6.
(a) Total adsorption-bound water quality; (b) Quality of adsorbed-bound water per unit area.
Figure 6b depicts the trend of the mass of adsorbed bound water per unit area with varying concentrations of ammonium sulfate. The unified factor used in this study is the specific surface area of dehydrated Clay minerals, which encompasses various particle properties crucial for studying soil–water suspension systems. The observations from the figure are as follows: (1) When adsorbing deionized water, the trend of mass of adsorbed bound water per unit area is as follows: Sandstone > Strongly weathered rock > Clay > Mudstone, with masses of 0.5605 g/m2, 0.4215 g/m2, 0.3065 g/m2, and 0.2258 g/m2, respectively. (2) When adsorbing ammonium sulfate solution, the trend of mass of adsorbed bound water per unit area is as follows: Strongly weathered rock > Sandstone > Clay > Mudstone. At a mass fraction of 1%, the masses of adsorbed bound water are 0.6615 g/m2, 0.6062 g/m2, 0.5669 g/m2, and 0.3000 g/m2, respectively. (3) Strongly weathered rock and Sandstone exhibit similar specific surface areas. Through calculations, the specific surface area of Strongly weathered rock is determined as 2.1003 × 10⁻² mmol/m2, while that of Sandstone is 1.9620 × 10⁻² mmol/m2. The higher specific surface area of Strongly weathered rock results in a higher adsorbed bound water content when adsorbing ammonium sulfate. This indicates that the quality of adsorbed-bound water on the surface of IARE particles is influenced not only by their specific surface area but also by the surface charge they carry.
4.3. Analysis of Calculation Results
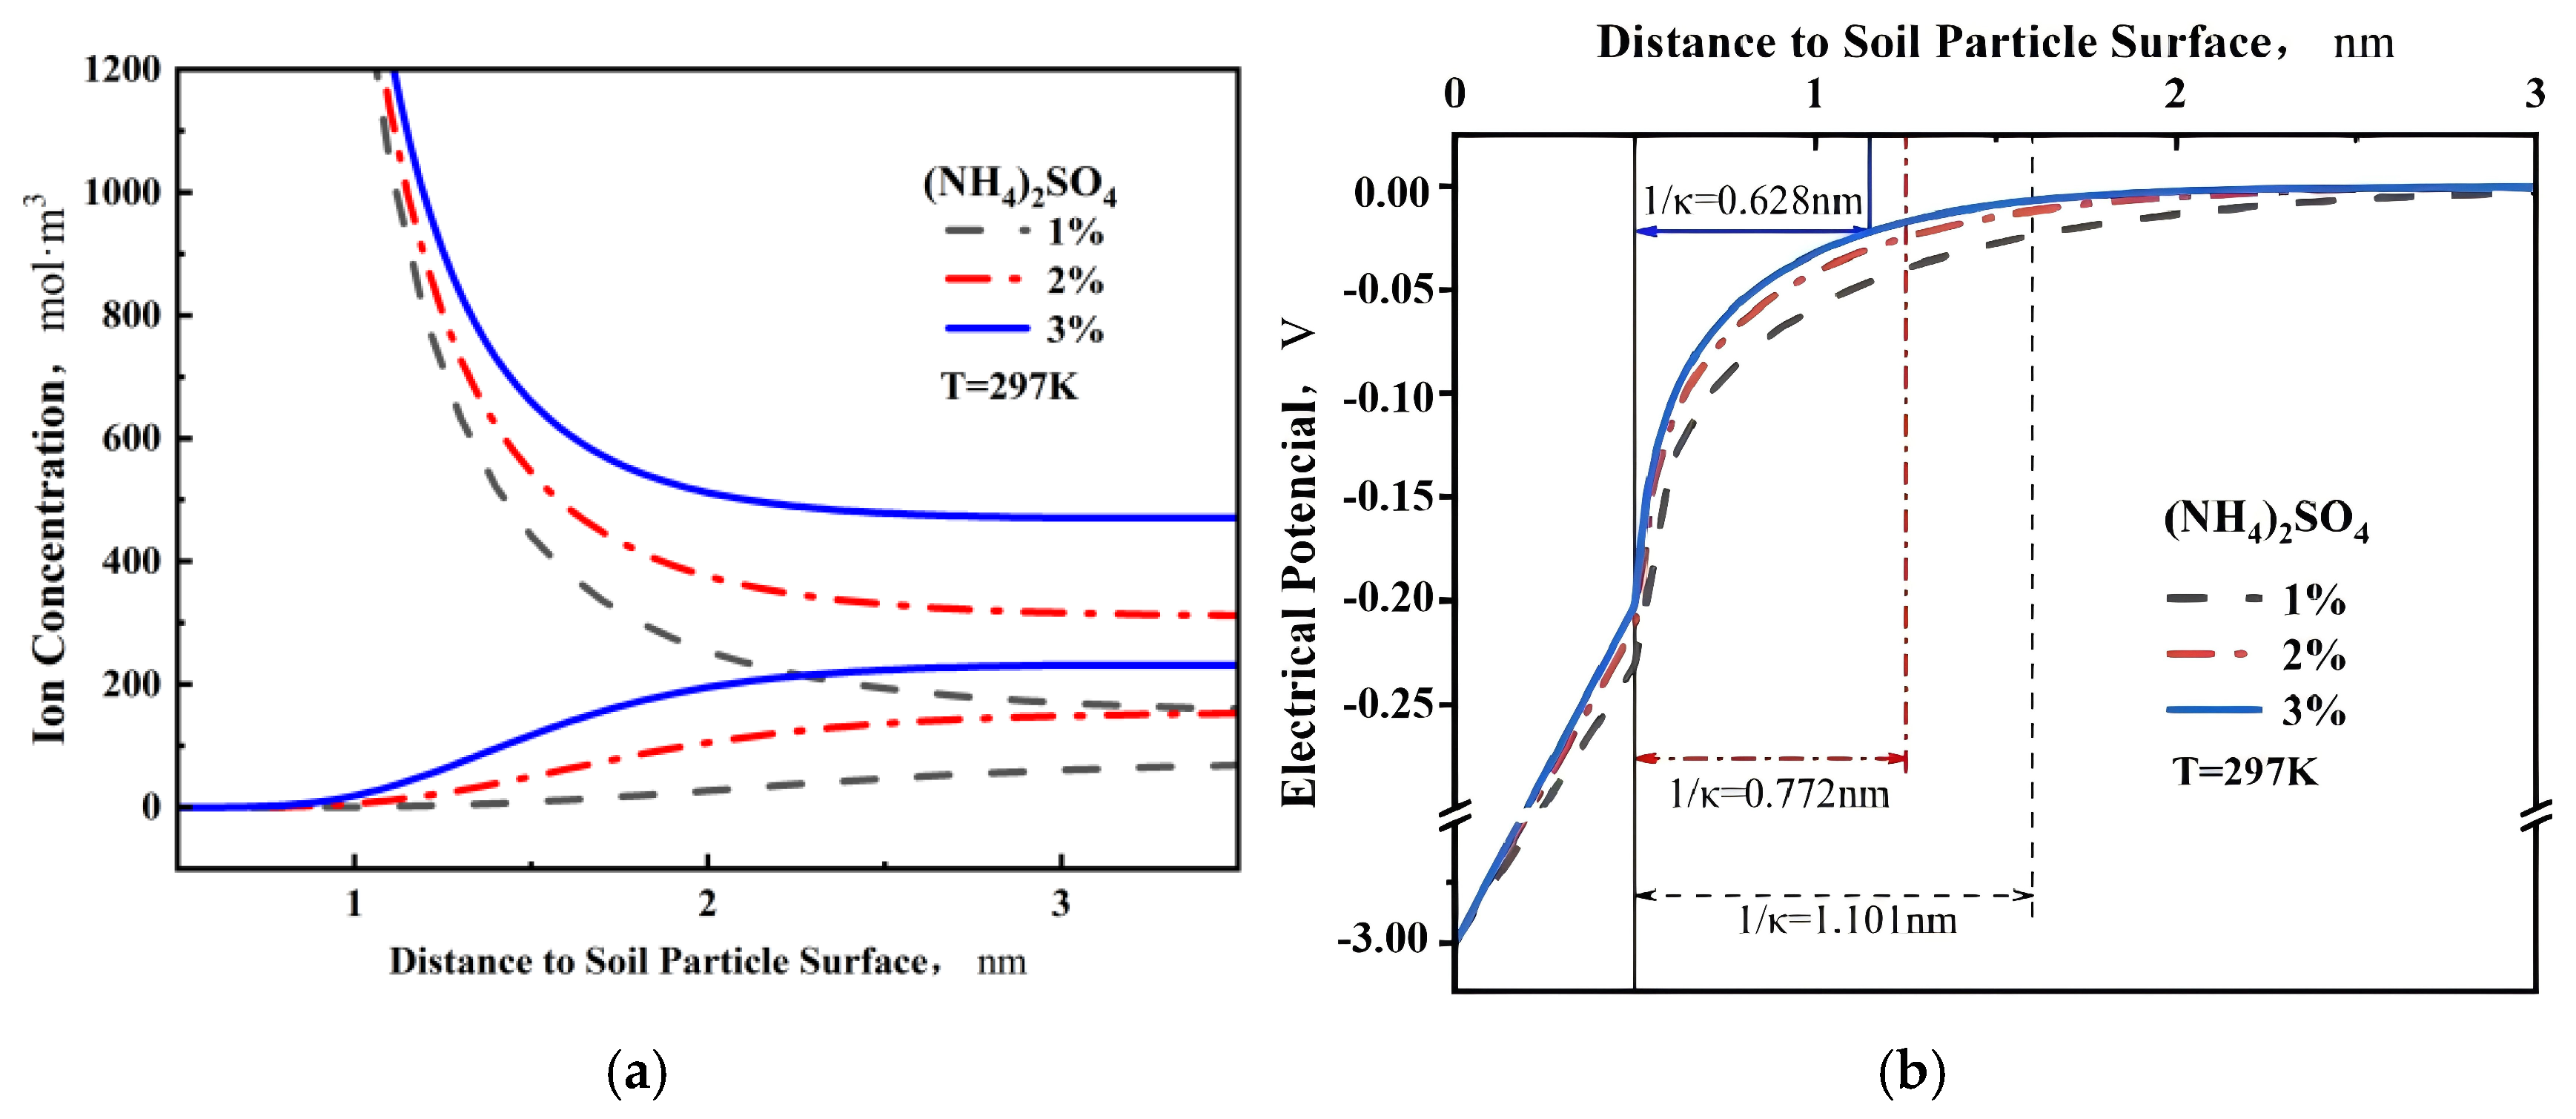
By applying Equations (7) and (8), the concentration distribution and potential distribution of ammonium ions and sulfate ions in the double layer of each system were calculated. The results are presented in Figure 7a,b, respectively. The observations from the figures are as follows: (1) The surface potential φd of IARE particles increases with the increasing concentration of ammonium sulfate solution, indicating a higher positive charge on the surface. Additionally, the concentration of ammonium ions near the surface is also higher, reflecting the increased adsorption of these ions. (2) At higher bulk solution concentrations, more ammonium ions are tightly adsorbed on the surface of IARE particles due to the combined effects of electric field force and concentration potential. This leads to a compression of the double-layer thickness. (3) As the bulk solution concentration increases, a larger number of cations accumulate in the diffuse layer. This accumulation enhances the ability to shield the electric field, resulting in increased hydration effects of adsorbed ions and ultimately leading to higher solution density within the double layer. These observations highlight the influence of solution concentration on the surface potential, ion distribution, and double-layer characteristics of IARE particles.
Figure 7.
(a) Ion concentration distribution and (b) potential distribution in the electric double layer.
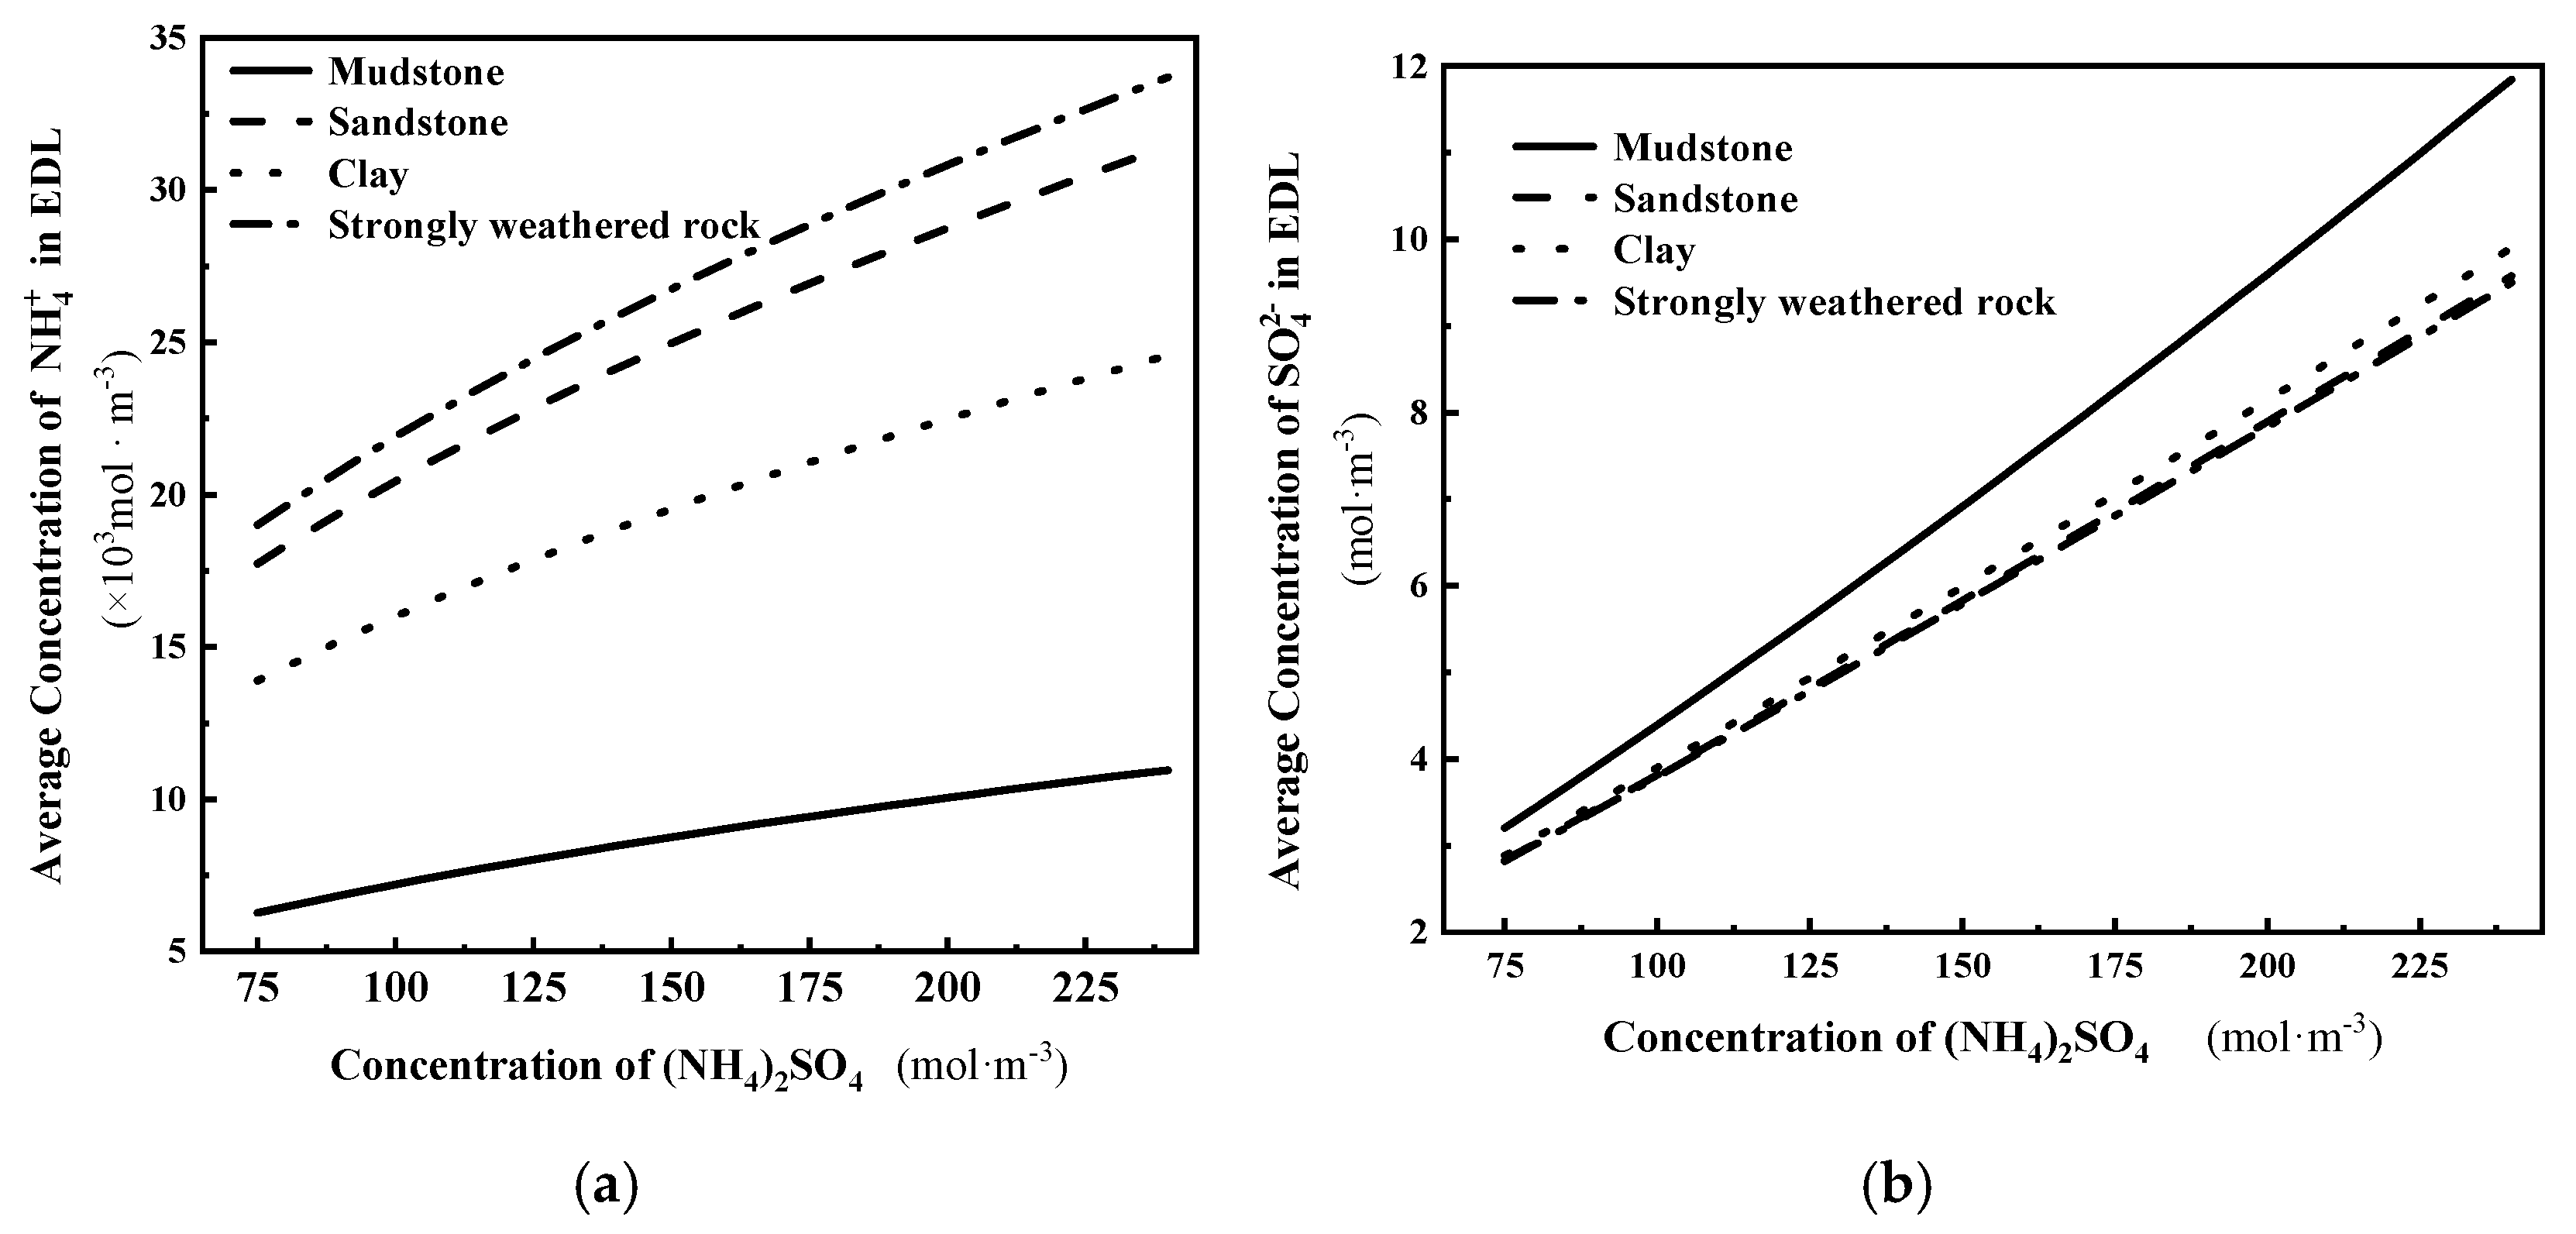
Based on Equations (7)–(9), the average concentration of adsorbed ions on the unit area of Clay particles in each system was calculated and presented in Figure 8. The following observations can be made: (1) The average concentrations of ammonium ions and sulfate ions in the electric double layer increase with the increase in bulk solution concentration. Notably, the average concentration of ammonium ions is much higher than that of sulfate ions. This indicates that ammonium ions play a dominant role in contributing to the mass of the electrolyte within the double layer. (2) The formation of the adsorbed water film on the surface of Clay particles is influenced by both the bulk solution concentration and the surface charge density of Clay particles []. Clay particles possess a significant amount of negative charge due to factors such as isomorphous substitution and broken bonds, resulting in a strong negative electric field on their surfaces. With a constant electric field on the Clay particle surface, the thickness of the double layer decreases as the bulk solution concentration increases. However, the average concentration of cations also increases with the concentration, leading to a higher density of the water film. As a result, the mass of the adsorbed water film increases with the increase in bulk solution concentration. The quantity of adsorbed ions on Clay particles depends on their charge, while the strength of ion adsorption relies on the surface charge density []. Isomorphous substitution refers to the replacement of certain cations in the crystal structure of clay minerals (e.g., montmorillonite, illite) by cations of similar size but different valence during mineral formation. In the mineral lattices of the ore soil particles, such substitution occurs—for example, Al3+ replacing Si4+ in the Si–O tetrahedral sheet, and Mg2+ or Fe2+ replacing Al3+ in the Al–O octahedral sheet. These substitutions create a deficit of positive charge, or equivalently an excess of negative charge, resulting in a net negative charge on the particle surfaces. On the unit area of Clay particles, a higher charge corresponds to a larger surface charge density, enabling the Clay particles to firmly adsorb more cations. When the surface charge density of Clay particles is higher, the density of the adsorbed water film on the surface also increases, resulting in a higher mass of adsorbed-bound water. Therefore, among the four IARE samples, the Strongly weathered rock with the highest surface charge density exhibits a higher adsorbed-bound water content, while the shale, which has the lowest surface charge density, shows the least amount of adsorbed-bound water.
Figure 8.
Variation in the average concentration of ions in the double layer with the concentration of the bulk solution: (a) NH4+; (b) SO42−.
4.4. Implications for (NH4)2SO4 Leaching (Relevance and Use)
Our data show that increasing (NH4)2SO4 concentration (0–3 wt%) increases the mass of bound water, i.e., converts more mobile water into interfacial water films. Two process-level consequences follow:
Transport limitation: As bound water increases, the effective porosity and pore throat apertures decrease, and tortuosity increases, which together lower permeability and hinder percolation. A simple scaling captures the trend: if we write an effective porosity neff ≈ n0 − β mbw (with mbw the bound water mass per unit solid and β a texture factor), then a Kozeny–Carman–type relation suggests k∝ at fixed specific surface. Thus, higher concentration can slow flow and lengthen breakthrough/soak times, even as it enhances exchange thermodynamics.
Exchange enhancement: Higher ionic strength raises activity and compresses the diffuse layer, increasing exchange-site occupancy for REE3+ displacement. Within our conditions (pH ≈ 4.8–7.0), this thermodynamic gain is clear from the monotonic increase in bound water metrics and the Gouy–Chapman analysis.
These counteracting effects imply an optimum concentration window that balances mass-transfer kinetics (favored by lower ionic strength and higher permeability) against exchange equilibrium (favored by higher ionic strength). The exact optimum will vary with lithology and texture, but our normalized trends—bound water per specific surface area (mbw/S) and per CEC (mbw/CEC) plotted versus ionic strength—are consistent across four lithologies, providing transferable guidance irrespective of deposit-specific absolute values.
Operational relevance. Initiate with a lower concentration to establish permeability and contact, then step up to a higher concentration to drive exchange once flow paths are established; Alternate soaking (low-flow, diffusion-dominated) with draining/flush to mitigate transport limitations when bound water is high; Track the free water volume loss (ΔV) and pressure drop as practical proxies for rising bound water and tortuosity; adjust concentration or cycle timing accordingly. Clay-rich, high-CEC materials will experience stronger permeability penalties at the same ionic strength; sand-dominated ores tolerate higher concentration before transport becomes limiting.
5. Conclusions
Changes in lixiviant concentration can alter the thickness of the bound water layer on ore particle surfaces, thereby modifying the effective pore throat size and influencing leaching performance. In this paper, electric double-layer theory is used to derive the dependence of bound water content on solution concentration. At 298.15 K, four types of IARE raw ores were characterized for particle size, cation-exchange capacity (CEC), and specific gravity, and the bound water content was measured by volumetric flask pycnometry in (NH4)2SO4 solutions at 0, 1, 2, and 3 wt%. The conclusions are as follows:
- (1)
- The surface charge per unit area of four types of IARE samples, namely mudstone, sandstone, clay, and strongly weathered rock, are 0.7072 × 10⁻² mmol/m2, 1.9620 × 10⁻² mmol/m2, 1.5418 × 10⁻² mmol/m2, and 2.1003 × 10⁻² mmol/m2, respectively, with strongly weathered rock having the highest and mudstone having the lowest.
- (2)
- As the concentration of the solution increases, the thickness of the diffusion double layer on the surface of the IARE sample is compressed, the total amount of adsorbed anions and cations on the surface increases, and the density of the surface water film also increases, leading to a corresponding increase in the quality of adsorbed bound water.
- (3)
- As the concentration of the solution increases, the total volume reduction in free water ∆V in the system increases, and the mass of adsorbed bound water per unit mass of IARE sample also increases. This effectively increases particle hydrodynamic size, reduces pore throat apertures and effective porosity, and lowers permeability, which together impede lixiviant penetration and mass transfer. The net effect is reduced contact between the reagent and ore particles and, therefore, a decline in rare-earth extraction efficiency.
- (4)
- At the same solution concentration, the four tested IARE ores exhibit a per-area bound water mass ranking of strongly weathered rock > sandstone > clay > mudstone, consistent with the ordering of surface charge per unit area.
- (5)
- During the leaching of IARE ores, higher lixiviant concentration does not necessarily yield higher leaching efficiency. Efficient IARE leaching results from multiple interacting factors and typically exhibits an ore-specific optimal concentration window. Depending on the raw ore characteristics, staged concentration and soak–drain cycling can be employed to enhance leaching efficiency.
Due to differences in composition, wettability, particle size, and surface charge, different ore types exhibit different bound water contents under the same lixiviant concentration. Continued attention should be paid to the roles of composition and surface wettability in governing bound water during IARE leaching, with the aim of supporting high-efficiency ion adsorption rare-earth extraction.
Author Contributions
Conceptualization, J.W., C.P. and Y.L.; methodology, J.W., Z.F. (Zhikui Fei) and Z.F. (Zhanfeng Fan); validation, H.A. and Y.L.; resources, J.W. and Y.L.; data curation, J.W. and H.A.; writing—original draft preparation, Y.L. and J.W.; writing—review and editing, J.W., C.P. and Y.L.; funding acquisition, J.W., Z.F. (Zhanfeng Fan) and Z.F. (Zhikui Fei). All authors have read and agreed to the published version of the manuscript.
Funding
This article was supported by the Sichuan Science and Technology Program in China (Grant Nos. 2022NSFSC1021), Natural Science Foundation of Sichuan Province in China Grant Nos. 2025YFHZ0321) and the Open Fund of Sichuan Engineering Research Center for Mechanical Properties and Engineering Technology of Unsaturated Soils (Grant Nos. SC-FBHT2022-08). Additional support was provided by the Panzhihua Municipal Guiding Scientific and Technological Program (Grant Nos. 2024ZD-S-78 and 2024ZD-C-2) and the Sichuan Province Key Laboratory of Higher Education Institutions for Comprehensive Development and Utilization of Industrial Solid Waste in Civil Engineering (Grant Nos. SC_FQWLY-2025-Z-04 and SC_FQWLY-2025-Y-04).
Data Availability Statement
The original contributions presented in this study are included in the article. Further inquiries can be directed to the corresponding authors.
Acknowledgments
We sincerely thank the editorial staff and reviewers for their valuable time, efforts, and insightful comments devoted to this manuscript. We gratefully acknowledge the partial contribution of Zhengling Li, an undergraduate student in Civil Engineering at Panzhihua University, to the experimental work reported in this study.
Conflicts of Interest
The authors declare no conflicts of interest.
References
- Chilingarian, G.V.; Vorabutr, P. Drilling and Drilling Fluids. Eng. Geol. 1982, 19, 74–75. [Google Scholar] [CrossRef]
- Orchiston, H. Adsorption of water vapor. Soil Sci. 1959, 87, 350–352. [Google Scholar] [CrossRef]
- Barshad, I.; Halevy, E.; Gold, H.A.; Hagin, J. Clay Minerals in Some Limestone Soils From Israel. Soil Sci. 1956, 81, 423–438. [Google Scholar] [CrossRef]
- Barshad, I. Absorptive and Swelling Properties of Clay-Water System. Clays Clay Miner. 1952, 1, 70–77. [Google Scholar] [CrossRef]
- Grim, R.E. Applied Clay Mineralogy; McGraw-Hill: New York, NY, USA, 1962. [Google Scholar]
- Zhang, R.; Wu, M.; Kumar, P.; Gao, Q.-F. Influence of loosely bound water on compressibility of compacted fine-grained soils. Adv. Civ. Eng. 2020, 2020, 1496241. [Google Scholar] [CrossRef]
- Kuhn, J.; Castillo-Sanchez, J.M.; Gascon, J.; Calero, S.; Dubbeldam, D.; Vlugt, T.J.H.; Kapteijn, F.; Gross, J. Adsorption and diffusion of water, methanol, and ethanol in all-silica DD3R: Experiments and simulation. J. Phys. Chem. C 2009, 113, 14290–14301. [Google Scholar] [CrossRef]
- Osipov, V.I. Nanofilms of adsorbed water in clay: Mechanism of formation and properties. Water Resour. 2012, 39, 709–721. [Google Scholar] [CrossRef]
- Asay, D.B.; Kim, S.H. Evolution of the adsorbed water layer structure on silicon oxide at room temperature. J. Phys. Chem. B 2005, 109, 16760–16763. [Google Scholar] [CrossRef] [PubMed]
- Neuhaus, D. Water adsorption and desorption pretreatment of surfaces increases the maximum amount of adsorbed water molecules by a multiple. Adsorption 2013, 19, 1127–1135. [Google Scholar] [CrossRef]
- Chapman, D.L. LI. A contribution to the theory of electrocapillarity. Lond. Edinb. Dublin Philos. Mag. J. Sci. 1913, 25, 475–481. [Google Scholar] [CrossRef]
- Gouy, M. Sur la constitution de la charge électrique à la surface d’un electrolyte. Anniue Phys. 1910, 9, 457–468. [Google Scholar] [CrossRef]
- Zhang, S.; Pei, H. Rate of capillary rise in quartz nanochannels considering the dynamic contact angle by using molecular dynamics. Powder Technol. 2020, 372, 477–485. [Google Scholar] [CrossRef]
- Kurichetsky, A.H. The Combination of Soil Water Translation; Geological Publishing House Press: Beijing, China, 1982. [Google Scholar]
- Zhang, N. Research Methods for Clay Minerals; Science Press: Beijing, China, 1990. [Google Scholar]
- Low, P.F. Nature and Properties of Water in Montmorillonite-Water Systems. Soil Sci. Soc. Am. J. 1979, 43, 651–658. [Google Scholar] [CrossRef]
- Sposito, G.; Prost, R. Structure of water adsorbed on smectites. Chem. Rev. 1982, 82, 553–573. [Google Scholar] [CrossRef]
- Li, S.; Bo, Z.; Hu, C.; Yang, H.; Wang, A.; Liu, Y.; Jin, H.; Zhu, J. Collection of Translated Works on the Combination of Soil and Water; Geological Publishing House: Beijing, China, 1982. [Google Scholar]
- Li, Z.; Li, J.; Xu, R.; Hong, Z.; Liu, Z. Streaming potential method for characterizing the overlapping of diffuse layers of the electrical double layers between oppositely charged particles. Colloids Surf. A Physicochem. Eng. Asp. 2015, 478, 22–29. [Google Scholar] [CrossRef]
- Du, W.; Li, R.; Liu, X.; Tian, R.; Ding, W.; Li, H. Estimating Hofmeister energy in ion-clay mineral interactions from the Gouy-Chapman theory. Appl. Clay Sci. 2017, 146, 122–130. [Google Scholar] [CrossRef]
- Snyder, V.A. Gibbs–Duhem Equation for Ion-Exchanging Mixtures in Donnan Equilibrium with Electrolyte Solutions. Soil Sci. Soc. Am. J. 2011, 75, 2169–2177. [Google Scholar] [CrossRef]
- Falsone, G.; Stanchi, S.; Bonifacio, E. Simulating the effects of wet and dry on aggregate dynamics in argillic fragipan horizon. Geoderma 2017, 305, 407–416. [Google Scholar] [CrossRef]
- Calvet, R.; Prost, R. Cation Migration into Empty Octahedral Sites and Surface Properties of Clays. Clays Clay Miner. 1971, 19, 175. [Google Scholar] [CrossRef]
- Wang, P. Quantitative Analysis of Bound Water on Clay Surface and Study on Hydration Mechanism. Ph.D. Thesis, Southwest Petroleum University, Nanchong, China, 2001. [Google Scholar]
- Saboorian-Jooybari, H.; Chen, Z. Calculation of re-defined electrical double layer thickness in symmetrical electrolyte solutions. Results Phys. 2019, 15, 102501. [Google Scholar] [CrossRef]
- Mi, J.; Gregorich, E.G.; Xu, S.; McLaughlin, N.B.; Ma, B.; Liu, J. Effect of bentonite amendment on soil hydraulic parameters and millet crop performance in a semi-arid region. Field Crops Res. 2017, 212, 107–114. [Google Scholar] [CrossRef]
- Rahimi, L.; Amanipoor, H.; Battaleb-Looie, S. Effect of salinity of irrigation water on soil properties (abadan plain, SW Iran). Geocarto Int. 2021, 36, 1884–1903. [Google Scholar] [CrossRef]
- Aza-Gnandji, C.D.R.; Xu, Y.; Raitt, L.; Levy, J. Salinity of irrigation water in the Philippi farming area of the Cape Flats, Cape Town, South Africa. Water SA 2013, 39, 199–210. [Google Scholar] [CrossRef]
- Zhao, J.; Lu, C.; Deng, L.; Liu, G. Impacts of simulated acid solution on the disintegration and cation release of purple rock (Mudstone) in Southwest China. Geomorphology 2018, 316, 35–43. [Google Scholar] [CrossRef]
- Moldoveanu, G.A.; Papangelakis, V.G. Recovery of rare earth elements adsorbed on Clay minerals: II. Leaching with ammonium sulfate. Hydrometallurgy 2013, 131–132, 158–166. [Google Scholar] [CrossRef]
- Sposito, G. The Surface Chemistry of Soils; Spenter Inc.: Burbank, CA, USA, 1984. [Google Scholar]
- Lin, F.M.; Wang, G.S.; Qin, L.; Peng, C.L. Analysis of the location of physical adsorption state of ammonium in diffusion double layer on the surface of clay minerals. Chem. Ind. Eng. Prog. 2025, 44, 6093–6101. [Google Scholar] [CrossRef]
- Lin, F.M.; An, H.R.; Wang, G.S.; Peng, C.L. Adsorption law of ammonium during exchange process of La3+/NH+4 in electric double layer. Chin. J. Nonferrous Met. 2024, 34, 2762–2772. [Google Scholar]
- HJ 889-2017; Soil Quality—Determination of Cation Exchange Capacity (CEC)—Hexamminecobalt Trichloride Solution-Spectrophotometric Method. Ministry of Ecology and Environment of the People’s Republic of China: Beijing, China, 2018.
- Editorial Board of Engineering Geology Handbook. Engineering Geology Handbook, 4th ed.; China Construction Industry Press: Beijing, China, 2007. [Google Scholar]
- Xiang, G.; Xu, M.; Cui, J. Study on Particle Composition and Fractal Characteristics of Rock and Soil in Xigeda Formation. J. Chongqing Jiaotong Univ. (Nat. Sci. Ed.) 2018, 37, 60–63+75. [Google Scholar]
- Peng, S. Study on the Engineering Geological Characteristics of Xigeda Formation Clay. Hydrogeol. Eng. Geol. 1986, 57, 16–18. [Google Scholar]
- Wen, L.; Zhu, X.; Bai, Z.; Zou, K.; You, H. Characteristics of Rock and Soil of Xigeda Strata in Xinjiu District of Xi-Pan Expressway. Highway 2005, 7, 145–148. [Google Scholar] [CrossRef]
- You, H. Stability Analysis and Mechanism Study of Xigeda Formation Slope. Master’s Thesis, Southwest Jiaotong University, Chengdu, China, 2004. [Google Scholar] [CrossRef]
- Wu, F. Some characteristics of adsorption bound water measurement and seepage in cohesive soil. Chin. J. Geotech. Eng. 1984, 6, 84–93. [Google Scholar]
- Liu, X.; Li, H.; Li, R.; Xie, D.; Ni, J.; Wu, L. Strong non-classical induction forces in ion-surface interactions: General origin of Hofmeister effects. Sci. Rep. 2014, 4, 5047. [Google Scholar] [CrossRef] [PubMed]
- Du, W. The Influence of Polarization Effect on Ion Exchange Adsorption in Clay Minerals. Ph.D. Thesis, Southwest University, Chongqing, China, 2017. [Google Scholar]
Disclaimer/Publisher’s Note: The statements, opinions and data contained in all publications are solely those of the individual author(s) and contributor(s) and not of MDPI and/or the editor(s). MDPI and/or the editor(s) disclaim responsibility for any injury to people or property resulting from any ideas, methods, instructions or products referred to in the content. |
© 2025 by the authors. Licensee MDPI, Basel, Switzerland. This article is an open access article distributed under the terms and conditions of the Creative Commons Attribution (CC BY) license (https://creativecommons.org/licenses/by/4.0/).