Abstract
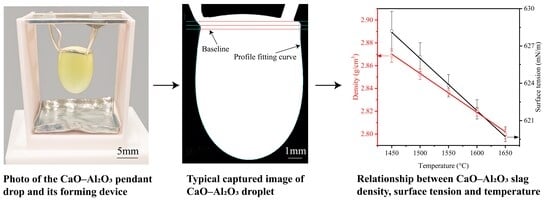
The pendant drop method is often used to determine the surface tension of liquids. However, in the process of calculating surface tension, corresponding density data are required, which brings a series of problems to the determination of the surface tension of high-temperature slag, especially. So far, there have been few reports on determining the two properties of density and surface tension by the pendant drop method in a single experiment. In this work, CaO–50% Al2O3 slag was taken as the research object, a novel ring-shaped-pendant drop-forming device constructed with Pt–10% Ir alloy was employed, and the outer diameter of the alloy ring at experimental temperatures was determined as a reference scale by pixel analyses of images. The density and surface tension of the slag within the range of 1450 to 1650 °C were simultaneously determined under heating and cooling modes, respectively, and the effect of slag mass on measurement results was also investigated. The results show that the measurement mode (heating or cooling) has little effect under experimental conditions, whereas the slag mass has a certain effect when it is small. The average density and surface tension values obtained both decrease with increasing temperature, and the temperature coefficients are −3.406 × 10⁻⁴ g/(cm3⋅°C) and −4.2 × 10⁻² mN/(m⋅°C), respectively. The density and surface tension of the slag at 1550 °C are 2.836 g/cm3 and 624 mN/m, respectively. In addition, the combined standard uncertainties of the measured density and surface tension are 0.01 g/cm3 and 4 mN/m, respectively. The density and surface tension values are basically consistent with literature data. This work can provide an experimental basis for the development of a pendant drop method used to determine the density and surface tension properties of molten slag.
1. Introduction
Density and surface tension are two important properties of metallurgical slags. They not only have significant influence on metallurgical practices, such as the emulsification or separation of molten metal and slag, the removal of inclusions, slag-foaming operations, and the interfacial reactions between slag and metal or refractory [,,,,,], but are also of great significance for fundamental research into aspects such as the prediction of slag properties using models, the calculation of slag molecular dynamics, and investigations into the microstructure of molten slags.
The pendant drop method is often used to measure the surface tension of liquids. It is easy to operate, requires only a small amount of liquid, and does not need calibration. This method is commonly used for room-temperature liquids [,,,] but is less commonly used for high-temperature molten slags. A pendant droplet [,,,,,,] is generally obtained through a capillary-like circular open container, and the surface tension is calculated by analyzing the geometric shape of the pendant droplet. However, corresponding density data is required for calculating the surface tension. Due to the inability to accurately obtain the total mass and/or volume of a pendant drop at high temperatures, the density of a droplet cannot be obtained simultaneously in the traditional pendant drop method. Researchers have to use density data in the literature or design a separate experiment to measure density [,,,]. In recent years, with the development of computer and digital image technology, the determination of the surface tension of molten slag by the pendant drop method has attracted increasing attention [,,]. However, there are few reports of simultaneously determining the two properties of both density and surface tension in a single experiment using the pendant drop method, and there are also few studies on the influence of the slag mass on the measurement results. As a result, the application of the pendant drop method in determining the surface tension of molten slag is still considerably limited. So far, only recently, Paras et al. [] have simultaneously determined the density and surface tension of pure oxide melts in a single experiment by a containerless pendant drop method (self-melting of solid oxide rods). Although this completely avoided the possible contamination of the melts by contact materials at high temperatures, special heating techniques such as thermal focusing were required, the measurement temperature range was narrow (generally controlled near the melting point), and it was difficult to control the formation rate of the pendant droplet. Moreover, the mass of the droplet was unknown before the start of the experiment. There were certain human factors involved in determining the melt mass after the experiment, and the process was complex, which was not easy to promote and use.
Theoretically, the determination of slag properties should be independent of the mass (volume) of the pendant droplet. However, the determination [] of liquid surface tension at room temperature shows that, when the mass (volume) of the droplet is too small, the pendant drop shape is close to spherical. In this scenario, the shape factor is relatively small, and a significant change in the surface tension of a spherical surface only causes a slight shape change; that is, the sensitivity of surface tension determination decreases, and this is prone to causing large systematic errors in fitting calculations. Therefore, it is of great importance to conduct application research on the pendant drop method, so as to simultaneously obtain the accurate properties of slag density and surface tension in a single experiment.
It is well known that experimentally determining the properties of molten slag at high temperatures is far more difficult than determining those of liquid at room temperature []. On the one hand, it is limited by high-temperature experimental techniques, such as the stability of experimental materials and high-temperature operation []; on the other hand, there is a lack of recognized standard slag to evaluate the accuracy of determined properties []. CaO–Al2O3 is a basis of a new mold flux [] and refining slag system []. Its surface tension [,,,,,,,] and density [,,,,] properties have been extensively investigated using various methods. For this reason, in this work, the 50% CaO–50% Al2O3 slag was taken as the measurement object. A novel and structurally simple ring-shaped-pendant drop-forming device was constructed using Pt–10% Ir (mass fraction) alloy, and the outer diameter size of the alloy ring at the experimental temperature was determined as a reference scale by pixel analyses of images. Pt–10% Ir alloy exhibits good oxidation resistance, high strength, and good creep resistance at high temperatures. Through a single experiment, the changes in density and surface tension properties with temperature were obtained, respectively, under both heating and cooling modes, and they were compared with literature data to verify the reliability of the measurement results. Meanwhile, through multiple experiments with different slag masses, the effect of slag mass on the determination results was also investigated.
2. Experimental
2.1. Slag Preparation
Analytical pure chemical reagents (CaCO3 and Al2O3 powders, all from Sinopharm Group Chemical Reagent Co., Ltd., Shanghai, China) were used to prepare CaO–Al2O3 binary slag with equal mass fractions (50% each). The CaCO3 and Al2O3 powders were accurately weighed in a certain proportion and mixed evenly, then calcined at 900 °C for 9 h. After cooling, the mixed slag was placed in a graphite crucible and pre-melted in a medium-frequency induction furnace. The pre-melted slag was placed in the muffle furnace to decarburize at 1000 °C for about 80 h. The decarburized slag was detected by an X-ray fluorescence spectrometer (XRF). The final mass fractions of CaO and Al2O3 were 50.23% and 49.60%, respectively, which were basically consistent with the target value. The mass fraction of other impurities totaled 0.17%.
2.2. Experimental Equipment
The experiments were conducted using a high-temperature and vacuum contact angle-measuring instrument (OCA25-HTV1800, DataPhysics Instruments GmbH, Filderstadt, Germany; measurement accuracy of contact angle and surface tension is 0.01° and 0.01 mN/m, respectively). The SCA20 software version 5.0.24 built into the instrument was used to control the experimental temperature and measure the contact angle and surface tension of the slag. Detailed information about the equipment can be found in the literature [,]. A novel ring-shaped-pendant drop-forming device was constructed with Pt–10% Ir alloy. The outer diameter and the wire diameter of the alloy ring were precisely measured at room temperature using a scanning electron microscope (SEM), and were 7.1273 mm and 0.4598 mm, respectively. The alloy ring with a determined size has multiple functions, such as supporting the slag compact, forming the pendant drop, and serving as a reference scale.
2.3. Experimental Method
The decarbonized slag was pressed into a cylindrical compact (φ7 × 10 mm) in a steel mold using a tablet press. The slag compact was placed on the alloy ring, carefully avoiding contact with surrounding tie bars, and the bottom of the compact passed through the center of the alloy ring. Before placing the compact on the ring, the masses of the compact and the pendant drop-forming device should be accurately weighed separately.
The instrument and built-in SCA20 software were started. The forming device with the slag compact was carefully placed at one end of the water-cooled horizontal furnace and smoothly sent into the constant temperature zone (30 mm in length, with a fluctuation of ±1 °C) along the inner wall of the furnace tube via a sample-feeding ruler. The plane of the alloy ring was kept horizontal as much as possible, preventing irregular droplet shapes from forming after the slag melted due to the inclination of the alloy ring.
The SCA20 screen resolution was set to 1472 × 1088 in the experiment. The magnification and focal length of the CCD camera were adjusted to obtain an appropriate size and clear image, and the magnification remained constant throughout the entire experimental process. Ar gas was introduced into the furnace chamber, and the flow rate was adjusted to 200 mL/min through the controller of a gas mass flowmeter. The furnace was programmed to heat up at a rate of 5 °C/min via SCA20 software. A neutral density (ND) filter was installed in front of the CCD camera lens near 20 °C before the slag melted to suppress the interference of slag self-luminescence at high temperatures on imaging. After melting, the slag flowed downwards and passed through the alloy ring, hanging autonomously beneath the ring to form a stable droplet without any high-temperature operation. And the contact area between the alloy ring and the molten slag was minimized, reducing contamination to the slag. No obvious bubbles were observed to escape during the slag melting and measurement processes in this work.
The experimental temperature rose in segments from the initial measurement temperature of 1450 °C to the peak of 1650 °C in intervals of 50 °C. Each measurement temperature was held for 10 min. The video of the droplet during holding was captured using SCA20 software. This measurement was labeled as the heating mode. Then, the experimental temperature was reduced from 1650 °C to 1450 °C in intervals of 50 °C, and the above operation was repeated. This measurement was labeled as the cooling mode. The heating and cooling rates were both 5 °C/min.
After the measurements were completed, the droplet cooled naturally with the furnace to room temperature. The forming device was taken out of the furnace via the sample-feeding ruler. It was observed that there was sometimes a small amount of blue slag adhered to the alloy bracket. The forming device with a solidified droplet was immersed as a whole into HF–HCl mixed acid for treatment. During the acid leaching, we collected the droplet that detached from the alloy ring. The contents of Pt and Ir in the detached droplet were detected via ICP-MS (inductively coupled plasma mass spectrometry). It should be noted that, in order to eliminate the influence of the adhered slag on the droplet mass, the adhered slag on the alloy bracket and the droplet beneath the alloy ring should be dissolved in the mixed acid successively. For this reason, taking advantage of the property that paraffin is insoluble in acid, the adhered slag on the alloy bracket was covered with paraffin for protection before the acid leaching. After the solidified droplet beneath the alloy ring was completely dissolved, the pendant drop-forming device was taken out of the mixed acid. Then, the pendant drop-forming device was rinsed repeatedly with alcohol and hot water, respectively, so as to thoroughly remove the paraffin protective layer on the adhered slag. Finally, the pendant drop-forming device with the adhered slag was immersed in the mixed acid again until the adhered slag was also completely dissolved. After the paraffin removal, by comparing the mass changes in the pendant drop-forming device before and after the acid leaching, the mass of the adhered slag could be accurately obtained. The final droplet mass was the mass of the solidified droplet and the pendant drop-forming device after experiments minus the mass of the adhered slag and the pendant drop-forming device after the paraffin removal. The pendant drop-forming device could be reused after the residue was removed by acid leaching. Six pendant drop experiments with different slag masses were conducted in this work.
3. Theoretical Bases
The shape of a pendant droplet in the equilibrium state follows the Young–Laplace equation [,], that is, Equation (1), which links the surface tension with the density and the curvature radius of a droplet. β is defined as the shape factor of the pendant drop in Equation (2).
The profile of a pendant droplet is governed by its β value. The smaller the β value is, the closer the profile of the pendant droplet is to spherical. This is because, when the surface tension of the droplet dominates relative to gravity, the droplet is more inclined to form a sphere to minimize the surface area. Conversely, if the gravity of the droplet has a significant impact, the droplet will be elongated, and the β value will increase. The values of β and R0 can be obtained by fitting the full profile of the pendant drop through Equation (1). If the ∆ρ value is known, the σ value can be obtained through Equation (2). This work intends to calculate the density by obtaining the droplet volume in a single experiment.
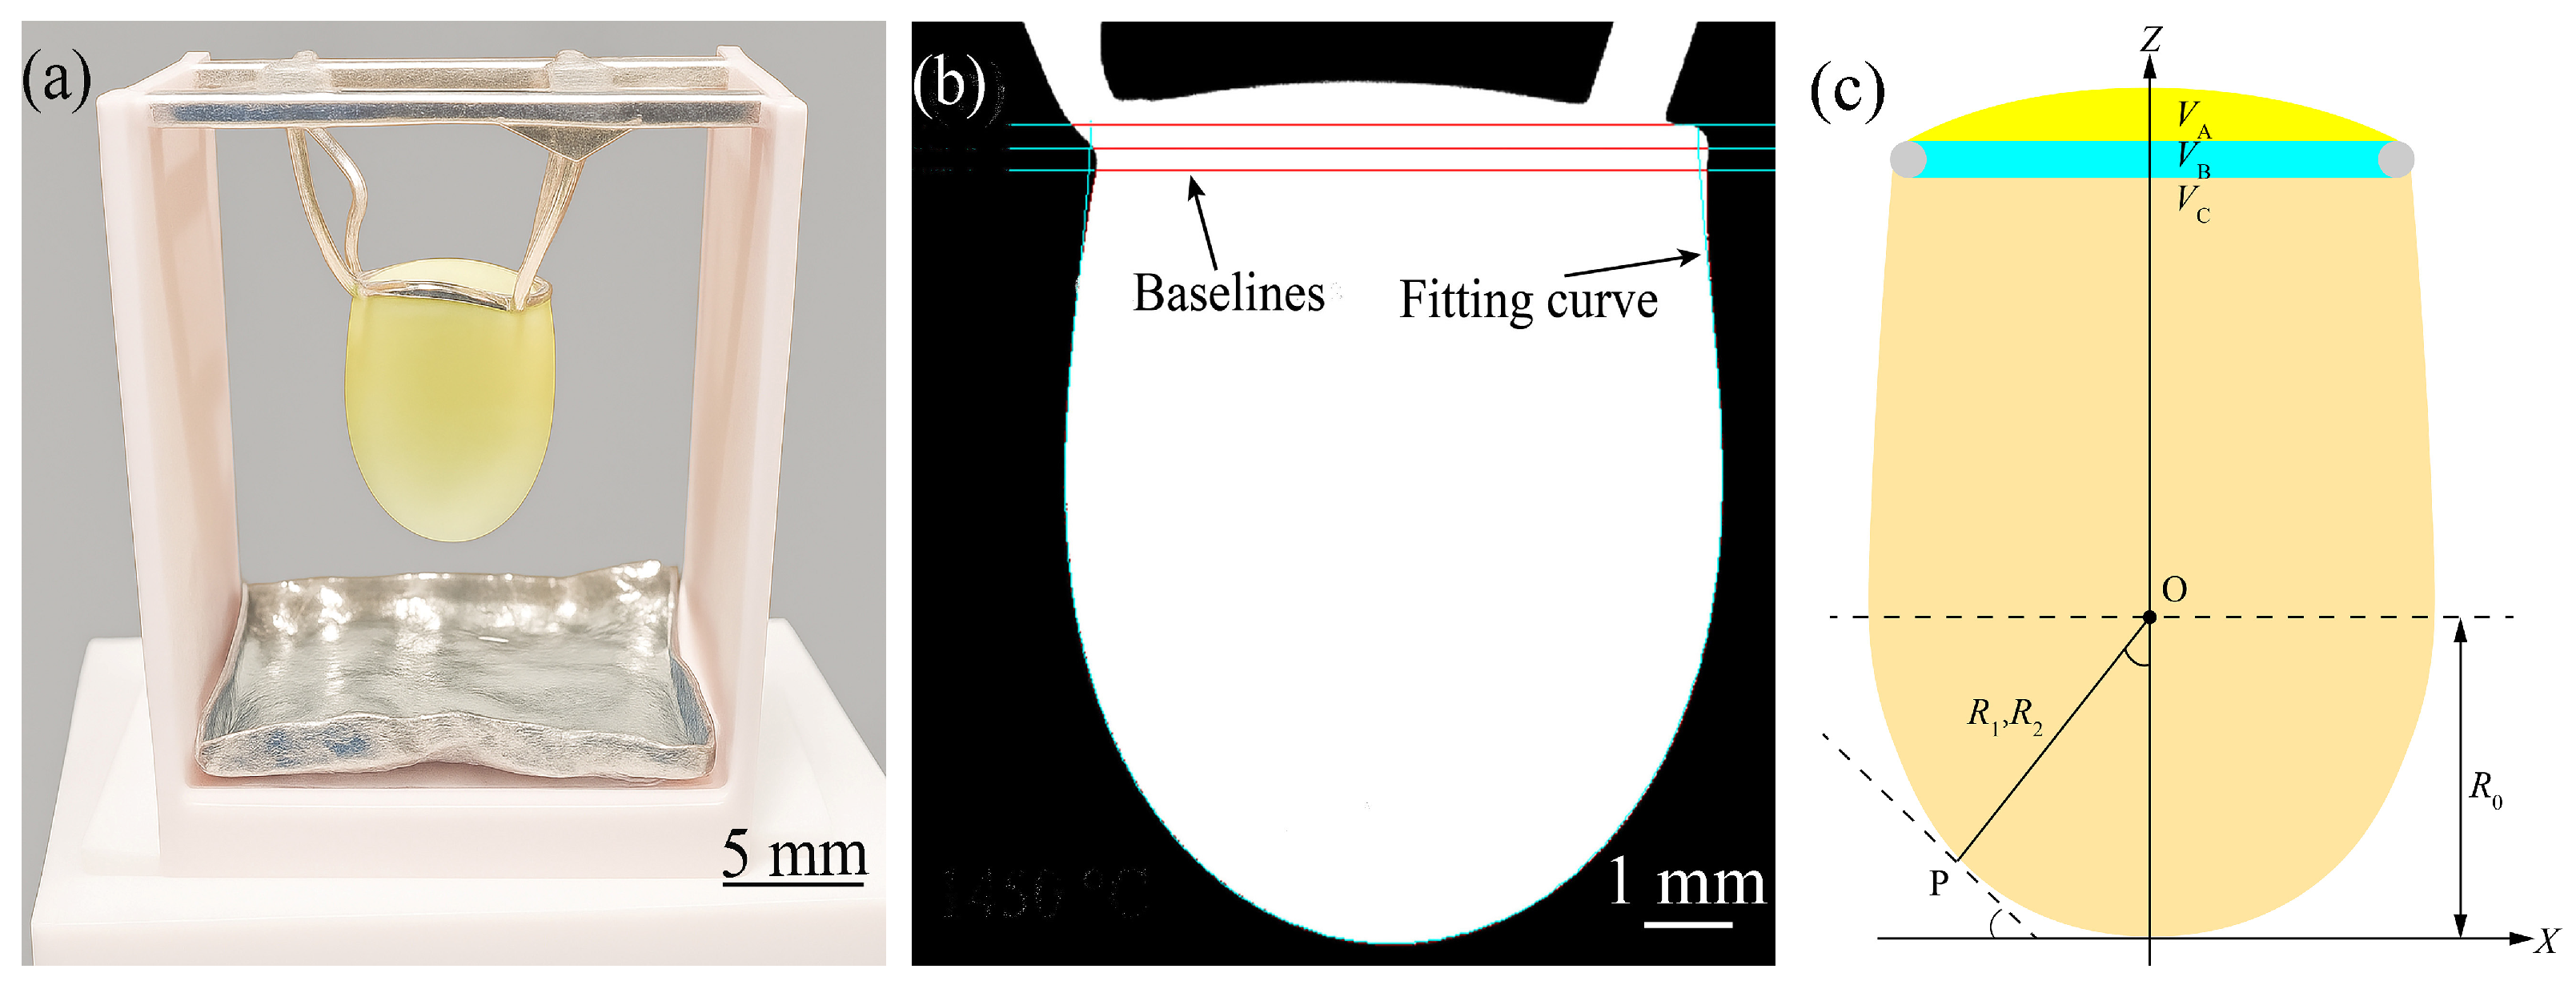
Figure 1a shows a physical photo of a CaO–Al2O3 pendant drop and its forming device. Figure 1b,c give a typical image captured by the CCD camera from the front of the droplet and the corresponding equivalent geometric shape, respectively. The volume of the droplet in Figure 1b can be divided into three parts by the two horizontal reference baselines of the SCA20 software. Ideally, these two reference baselines are located on the upper and lower horizontal planes of the horizontally placed alloy ring, respectively. Part A in Figure 1c corresponds to the spherical crown-shaped slag on the upper horizontal plane, and Part B represents the slag filled in the blank region between the upper and lower horizontal planes. Part C denotes the droplet hung beneath the lower horizontal plane of the alloy ring. Then the total volume Vm = VA + VB + VC. However, to calculate VA, VB, and VC, a reference scale needs to be set. Therefore, the outer diameter of the alloy ring is used as the reference scale in this work.
Figure 1.
(a) Physical photo of the CaO–Al2O3 molten slag and pendant drop combination; (b) Typical captured image of droplet; (c) Geometric schematic of the droplet.
Combined with the outer diameter of the alloy ring at room temperature, the pixel lengths of the alloy ring at room and experimental temperatures are measured by SCA20 software, and the outer diameter (Lt) of the alloy ring at the experimental temperature can be calculated. In SCA20 software, the image of the alloy ring at room temperature is opened, and then the position of the horizontal baseline is adjusted to align the second baseline accurately with the maximum outer-diameter position of the alloy ring. By reading the pixel coordinates of the two endpoints of the maximum outer diameter of the alloy ring, the Lpixel,20°C is calculated. The same steps are applied to the image of the alloy ring at the experimental temperature to obtain its Lpixel,t. Based on the L20°C (=7.1273 mm), the Lt (=2R) is calculated through the proportional relationship. Meanwhile, since the aspect ratio of the CCD camera is 1, the Mag can be determined in SCA20 through the ratio of the pixel length to the maximum outer diameter of the alloy ring at room temperature. The relation between Lt and Mag can be described by Equation (3).
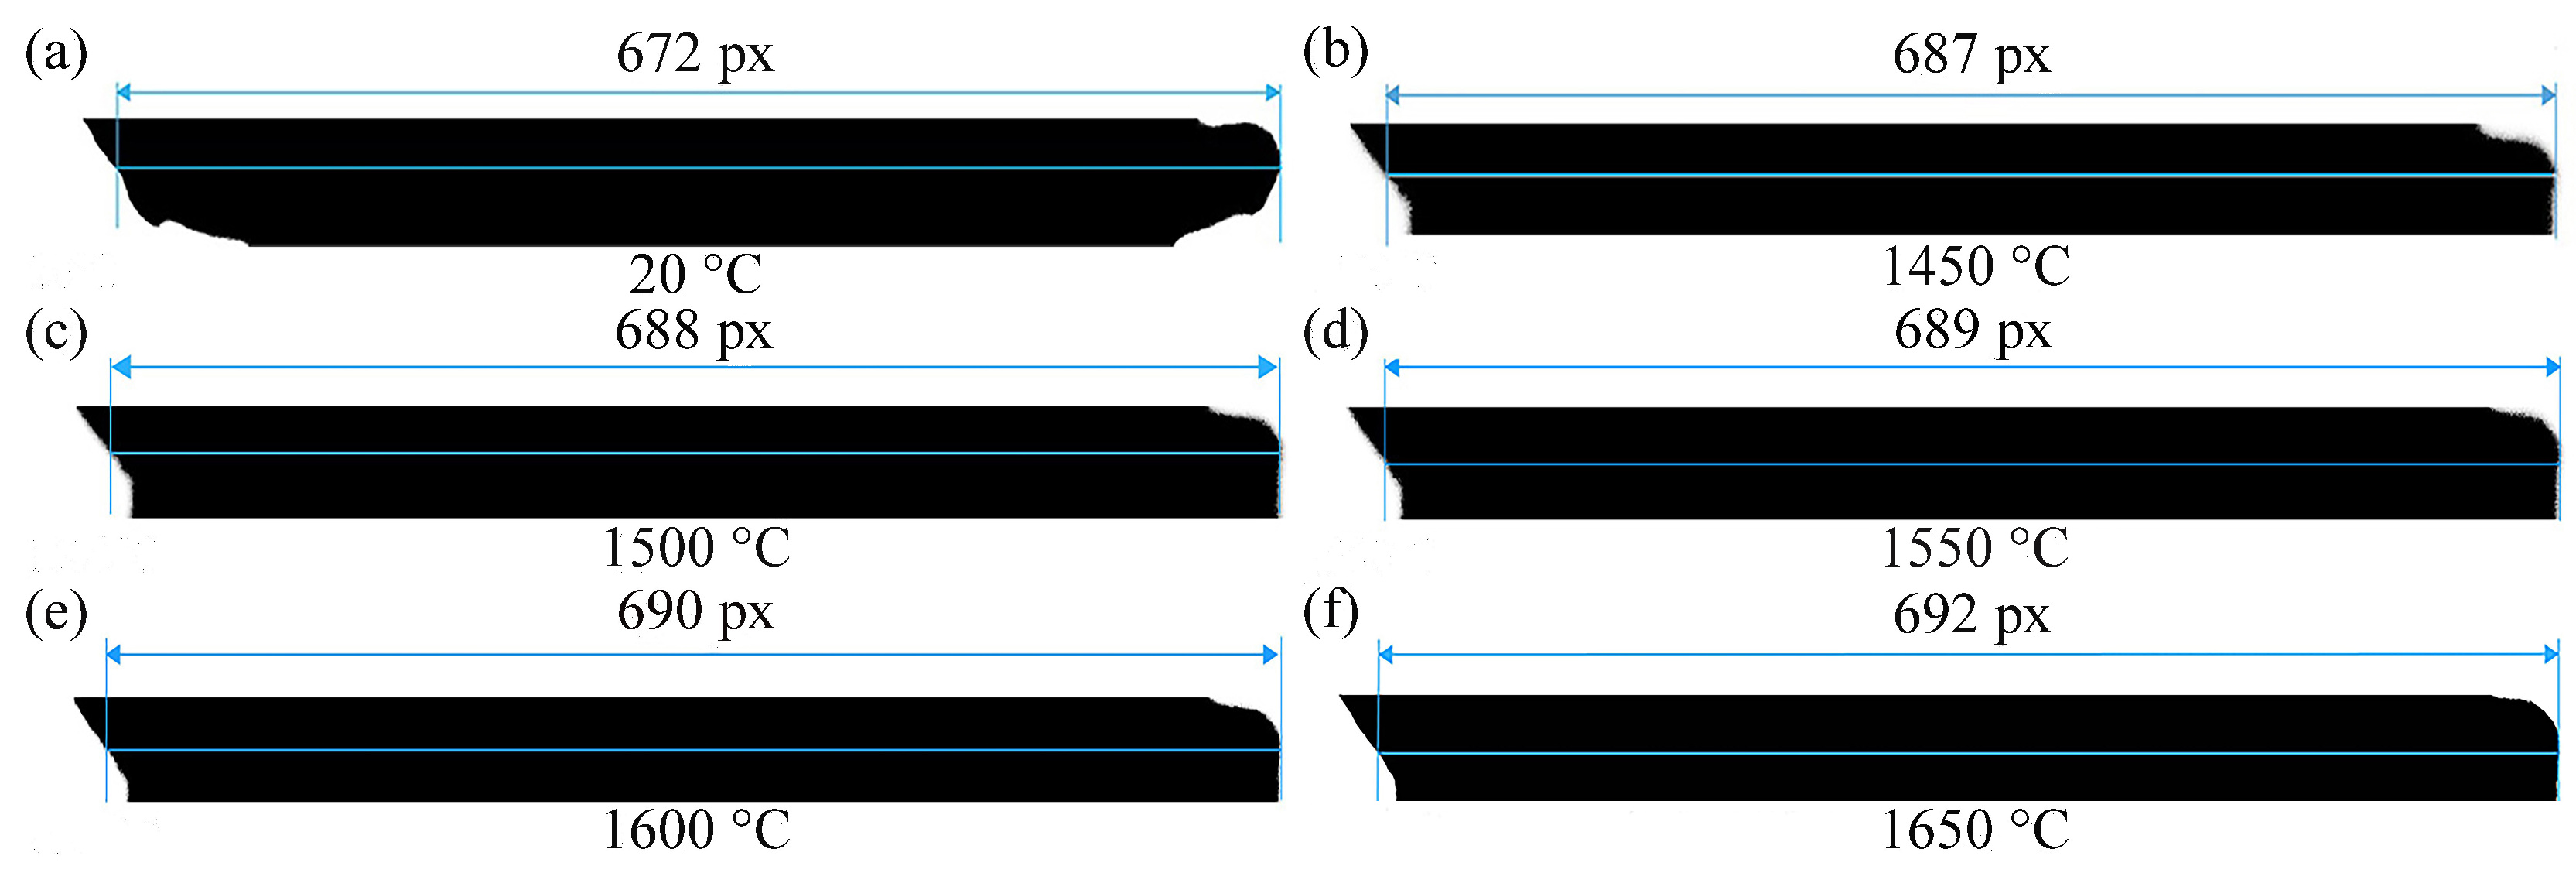
As an example, Figure 2 displays the measured pixel lengths of the maximum outer diameter of the alloy ring at room and experimental temperatures in run 4#. Table 1 summarizes the outer diameter of the alloy ring, the diameter of the ring wire, their corresponding pixel lengths, and the magnification factor of the images in run 4#.
Figure 2.
The measured pixel lengths of the maximum outer diameter of the alloy ring at room (a) and experimental (b–f) temperatures in run 4#.
Table 1.
The outer diameter (2R), wire diameter (2r), their corresponding pixel lengths, and the magnification factor of images of the alloy ring in run 4#.
The longitudinal sections of parts A and B in Figure 1c are enlarged, as shown in Figure 3. The inclination angle (α) refers to the angle between the upper plane of the alloy ring and the slag in part A at the experimental temperature, similar to the contact angle in the sessile drop method, and its measurement method is shown in Figure 4. The left angle is labeled as CA left and the right as CA right. The α value is the average of the CA left and the CA right. The result indicates that the α value remains nearly constant with the increase in temperature; that is, the wettability of CaO–Al2O3 molten slag on the alloy ring does not change much with temperature. In addition, it is found that the measured α value tends to slightly decrease with the increase in slag mass.
Figure 3.
Longitudinal sections of parts A and B of the molten slag.
Figure 4.
The angle between the crown-shaped slag and the upper plane of the alloy ring.
The VA and VB values can be calculated from parameters such as α, R, and r according to relevant mathematical formulas. The calculation formulas are Equations (4) and (5), respectively. The mathematical derivation process based on Figure 3 is omitted here.
In the workspace interface for the pendant drop method in the SCA20 software, the position of the third reference baseline is adjusted to the horizontal plane beneath the alloy ring, which is equivalent to moving the pixel length (see Table 1) of the radius of the alloy ring wire downward from the second baseline position at the maximum outer diameter of the alloy ring. Then, in the parameter interface, the magnification factor and the scale length at the experimental temperature are set, respectively. After setting, back in the workspace interface for the pendant drop method, the profile curve of the droplet was fitted to obtain the VC value. The density (ρ) can be calculated based on the final mass (m) and total volume (Vm) of the slag: ρ = m/Vm. Finally, the profile edge of the droplet at the experimental temperature is fitted again in the SCA20 software, and based on ρAr [] and obtained ρ values, the values of β, R0, and σ are determined.
4. Results and Discussion
4.1. Effects of Measurement Mode and Droplet Mass
Table 2 presents the mass changes in the slag and the pendant drop-forming device before and after six experiments. It should be noted that no slag was observed to adhere on the alloy bracket in run 1#, while the amount of adhered slag in run 3# was very small and could be ignored. It was speculated that the final mass of the droplet in run 3# was actually larger than that in run 1#, but slightly smaller than that in run 2#. It can be seen that both the pendant drop-forming device and slag exhibit light mass loss after the experiments. The mass loss of the slag might be caused by further decarburization of the small amount of residual carbides contained in the decarburized slag at high temperatures during the pendant drop experiment. Therefore, in this work, the final mass of the pendant droplet after the experiment was used to calculate the slag density.
Table 2.
Mass changes in the slag and pendant drop-forming device before and after the experiments.
Taking run 4# at 1450 °C as an example, under the heating and cooling modes, the VC, R0, β, ρ, and σ values of the droplet were measured five times, respectively, in the later stage of holding, and their average values were calculated, as shown in Table 3. Here, for simplicity, the slight difference in α, VA, and VB values between the heating and cooling modes was ignored; to save space, the results at other temperatures in run 4# and those of other runs under the heating and cooling modes were not listed either. The ratio of VA, VB, and VC can be obtained from Table 3 and is approximately 3:5:99. This indicates that the total volume of the slag is mainly determined by the VC value. Even if there were certain errors in the determination of VA and VB, it would not bring significant errors to the calculation of total volume or density.
Table 3.
Some relevant parameters of slag droplet at 1450 °C in run 4#.
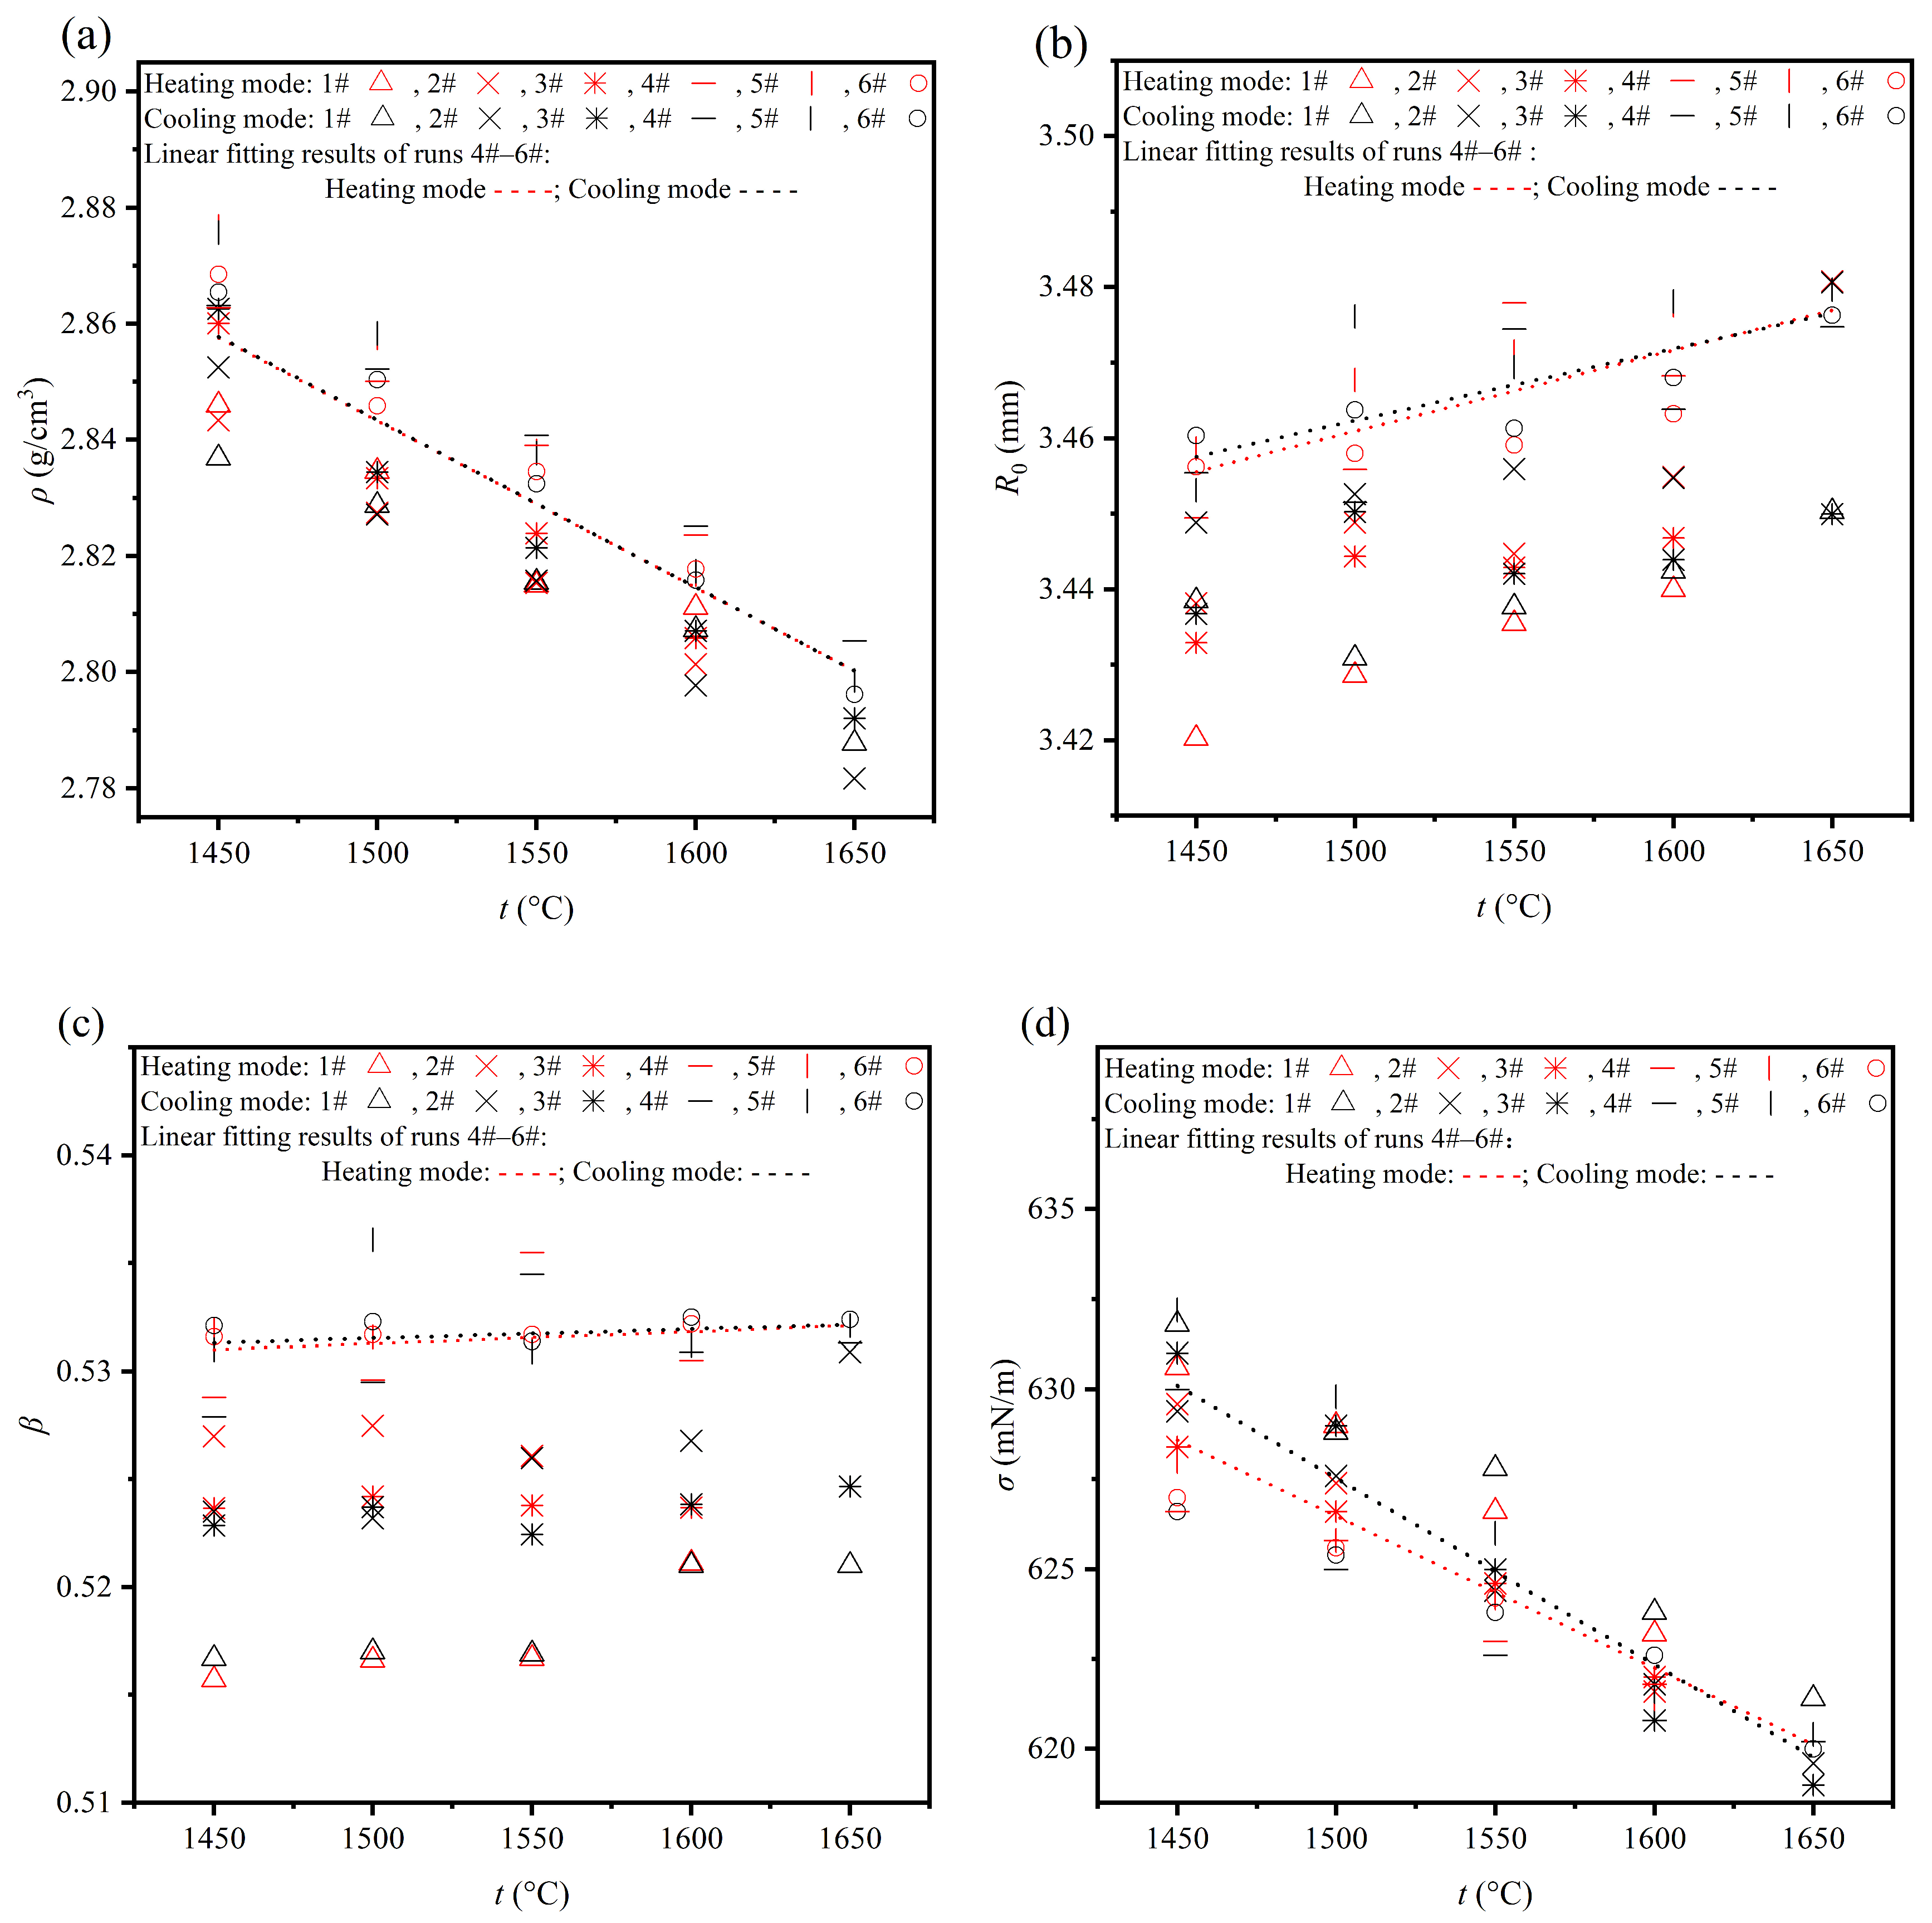
Figure 5 presents the variations in the measured ρ, R0, β, and σ values with temperature under both heating and cooling modes in six experiments. For each experiment, the data at each temperature under each mode represent the average of five measured values after holding at that temperature for different times (refer to Table 3). Under the same temperature conditions, it was found that when the droplet mass was relatively small (in runs 1#–3#), the values of ρ, R0, and β increased, while the σ value decreased; when the droplet mass was relatively large (in runs 4#–6#), with the increase in droplet mass, the values of ρ, R0, β, and σ did not show obvious regular changes. It should be noted that the mass of the adhered slag was neglected in run 3#, making the actual mass of the droplet smaller than that in run 2#. Theoretically, the ρ and σ values should not vary with the droplet mass. However, this was not the case when the droplet mass was relatively small, indicating the presence of systematic errors during the measurement process. When the droplet mass was relatively large, the results became independent of the droplet mass, but some fluctuations were still observed, indicating the presence of accidental errors.
Figure 5.
The variations in ρ (a), R0 (b), β (c), and σ (d) with temperature and droplet mass (see Table 2) under heating and cooling modes.
At the same temperature, with an increase in the droplet mass, the gravity acting on the droplet increased, causing the droplet to fall and elongate. The R0 value increased, and the Vm value also increased. According to Equation (2), the increase in the R0 value resulted in an increase in the β value as well, improving the fitting accuracy of the pendant drop edge. After the slag mass increased to a certain extent, the gravity gradually approached the limit supported by the surface tension, and the droplet was likely to drip. At this time, the droplet mass was close to the critical mass of the forming device, and the β value was also relatively large. However, accidental factors could lead to unstable droplet shapes, and the fitting result was also unstable, resulting in fluctuations in the values of ρ, R0, β, and σ, which did not change linearly with temperature. Since the entire droplet only maintained partial contact with the alloy ring, under the influence of occasional factors such as environmental vibrations, the droplet hanging beneath the alloy ring was easy to sway slightly, thereby affecting the values of Vm, R0, and β calculated by the edge fitting, and further affecting the values of ρ and σ.
To decrease the systematic errors during the edge fitting and improve measurement accuracy, the droplet mass should not be lower than that in run 4#. Here, the results of runs 1#–3# with a relatively small slag mass could be excluded when processing the data. To decrease the accidental errors during the fitting process, it was necessary to linearly fit the measurement results at different temperatures in runs 4#–6# with close to the critical mass of the forming device. To compare the effect of measurement modes, the measurement results under the heating and cooling modes were linearly fitted, respectively, as shown in Figure 5.
From the linear fit lines of the measurement results of runs 4#–6# in Figure 5, it can be seen that, at the same temperature, the R0 and β values under the cooling mode were slightly larger than those under the heating mode, while the difference in the ρ and σ values between the two modes was very small, and the ρ values were even almost the same. This phenomenon indicates that the measurement mode did not significantly influence the determination of the ρ and σ values. It was believed that, when the segmented temperature for controlling measurement was adopted, the droplet could fully reach the thermal equilibrium state and eliminate the thermal hysteresis effect; meanwhile, the slag also reached structural equilibrium.
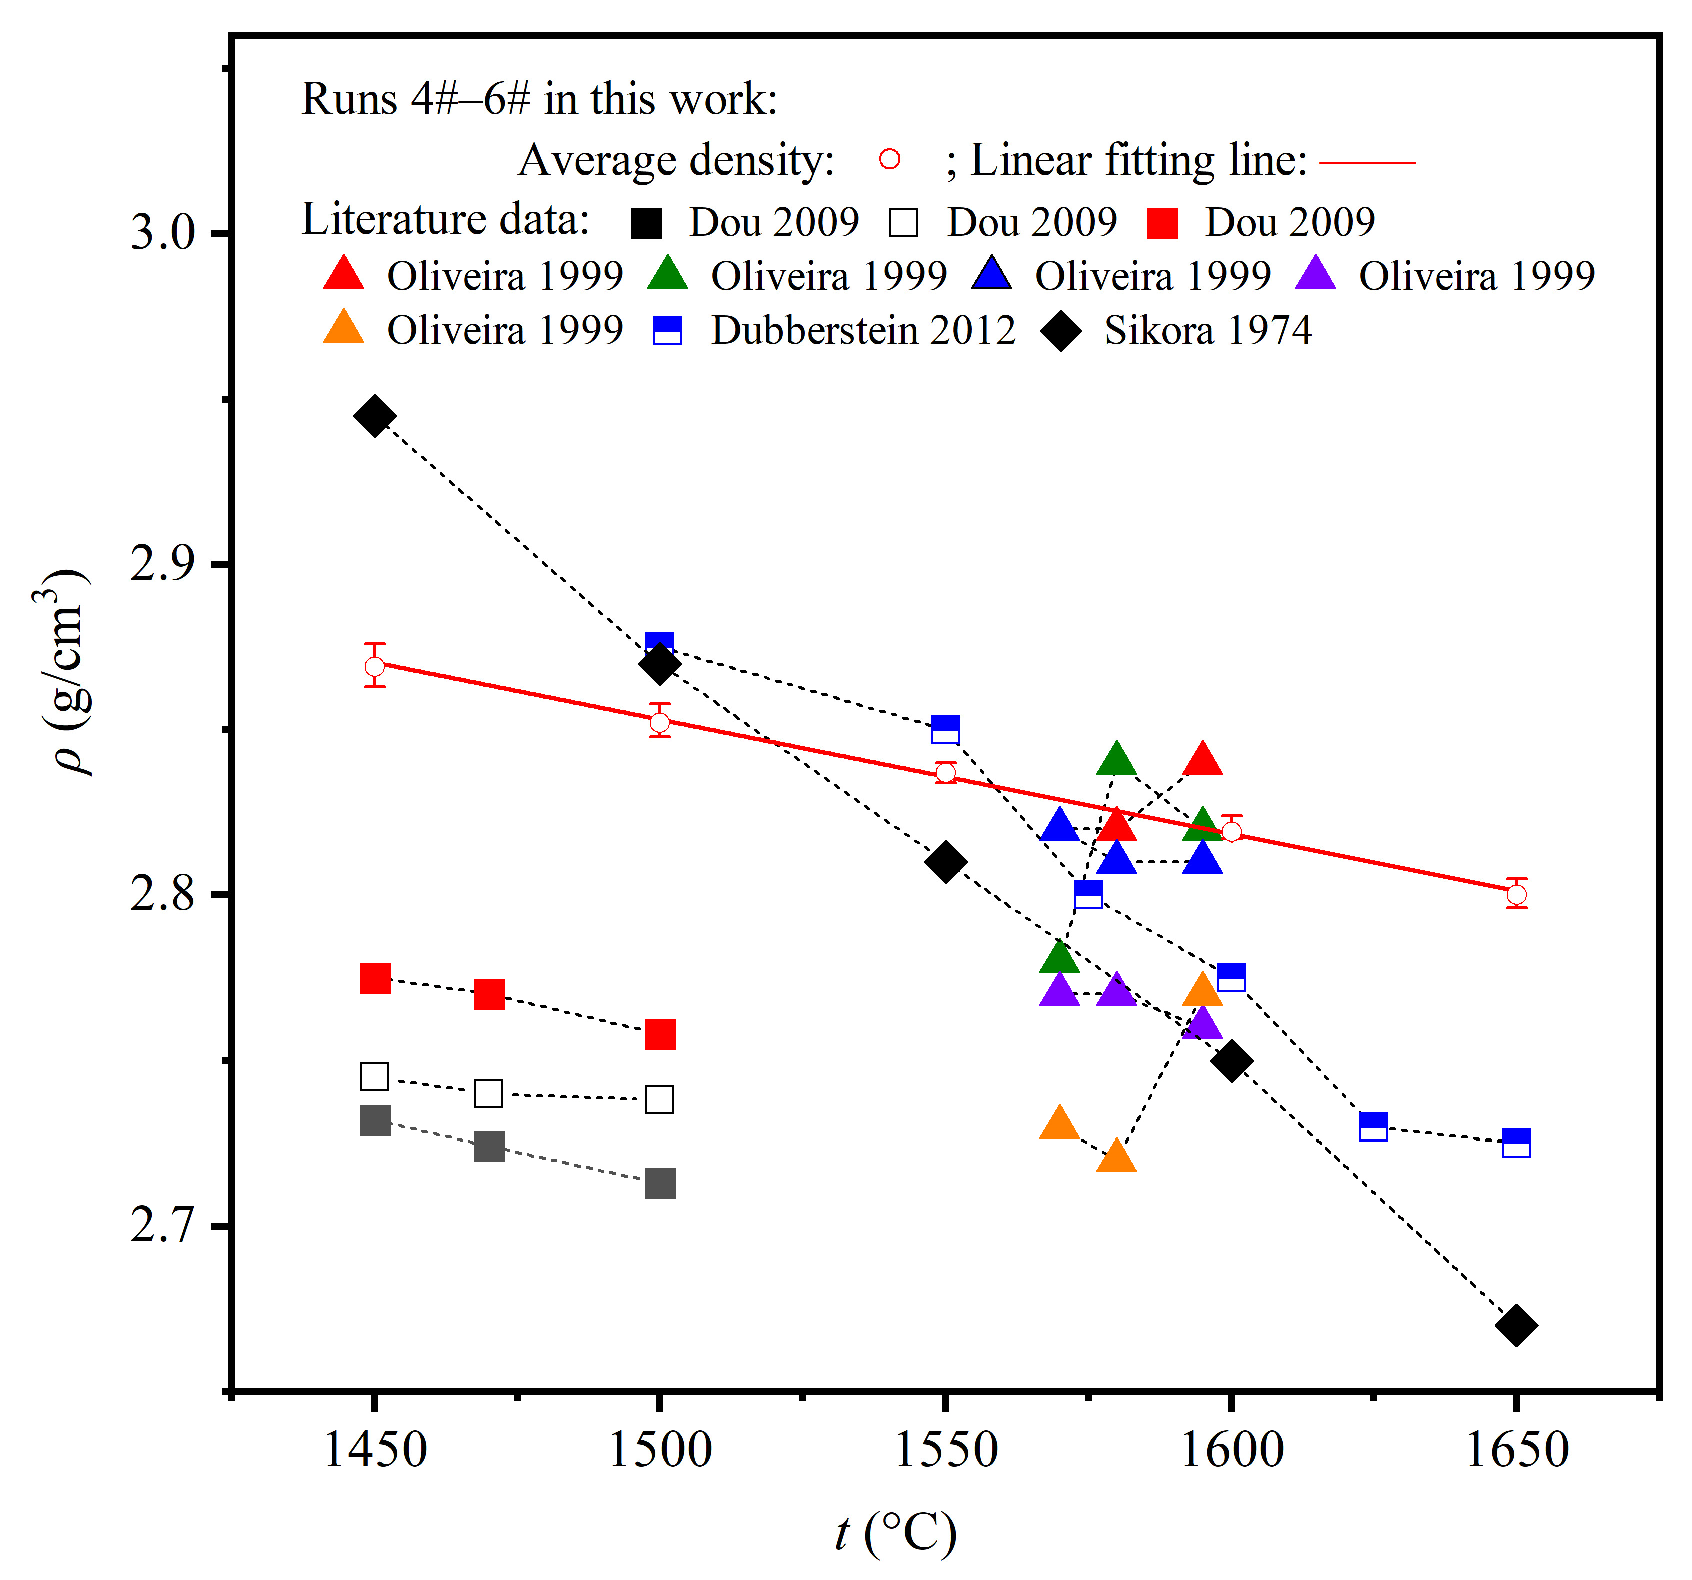
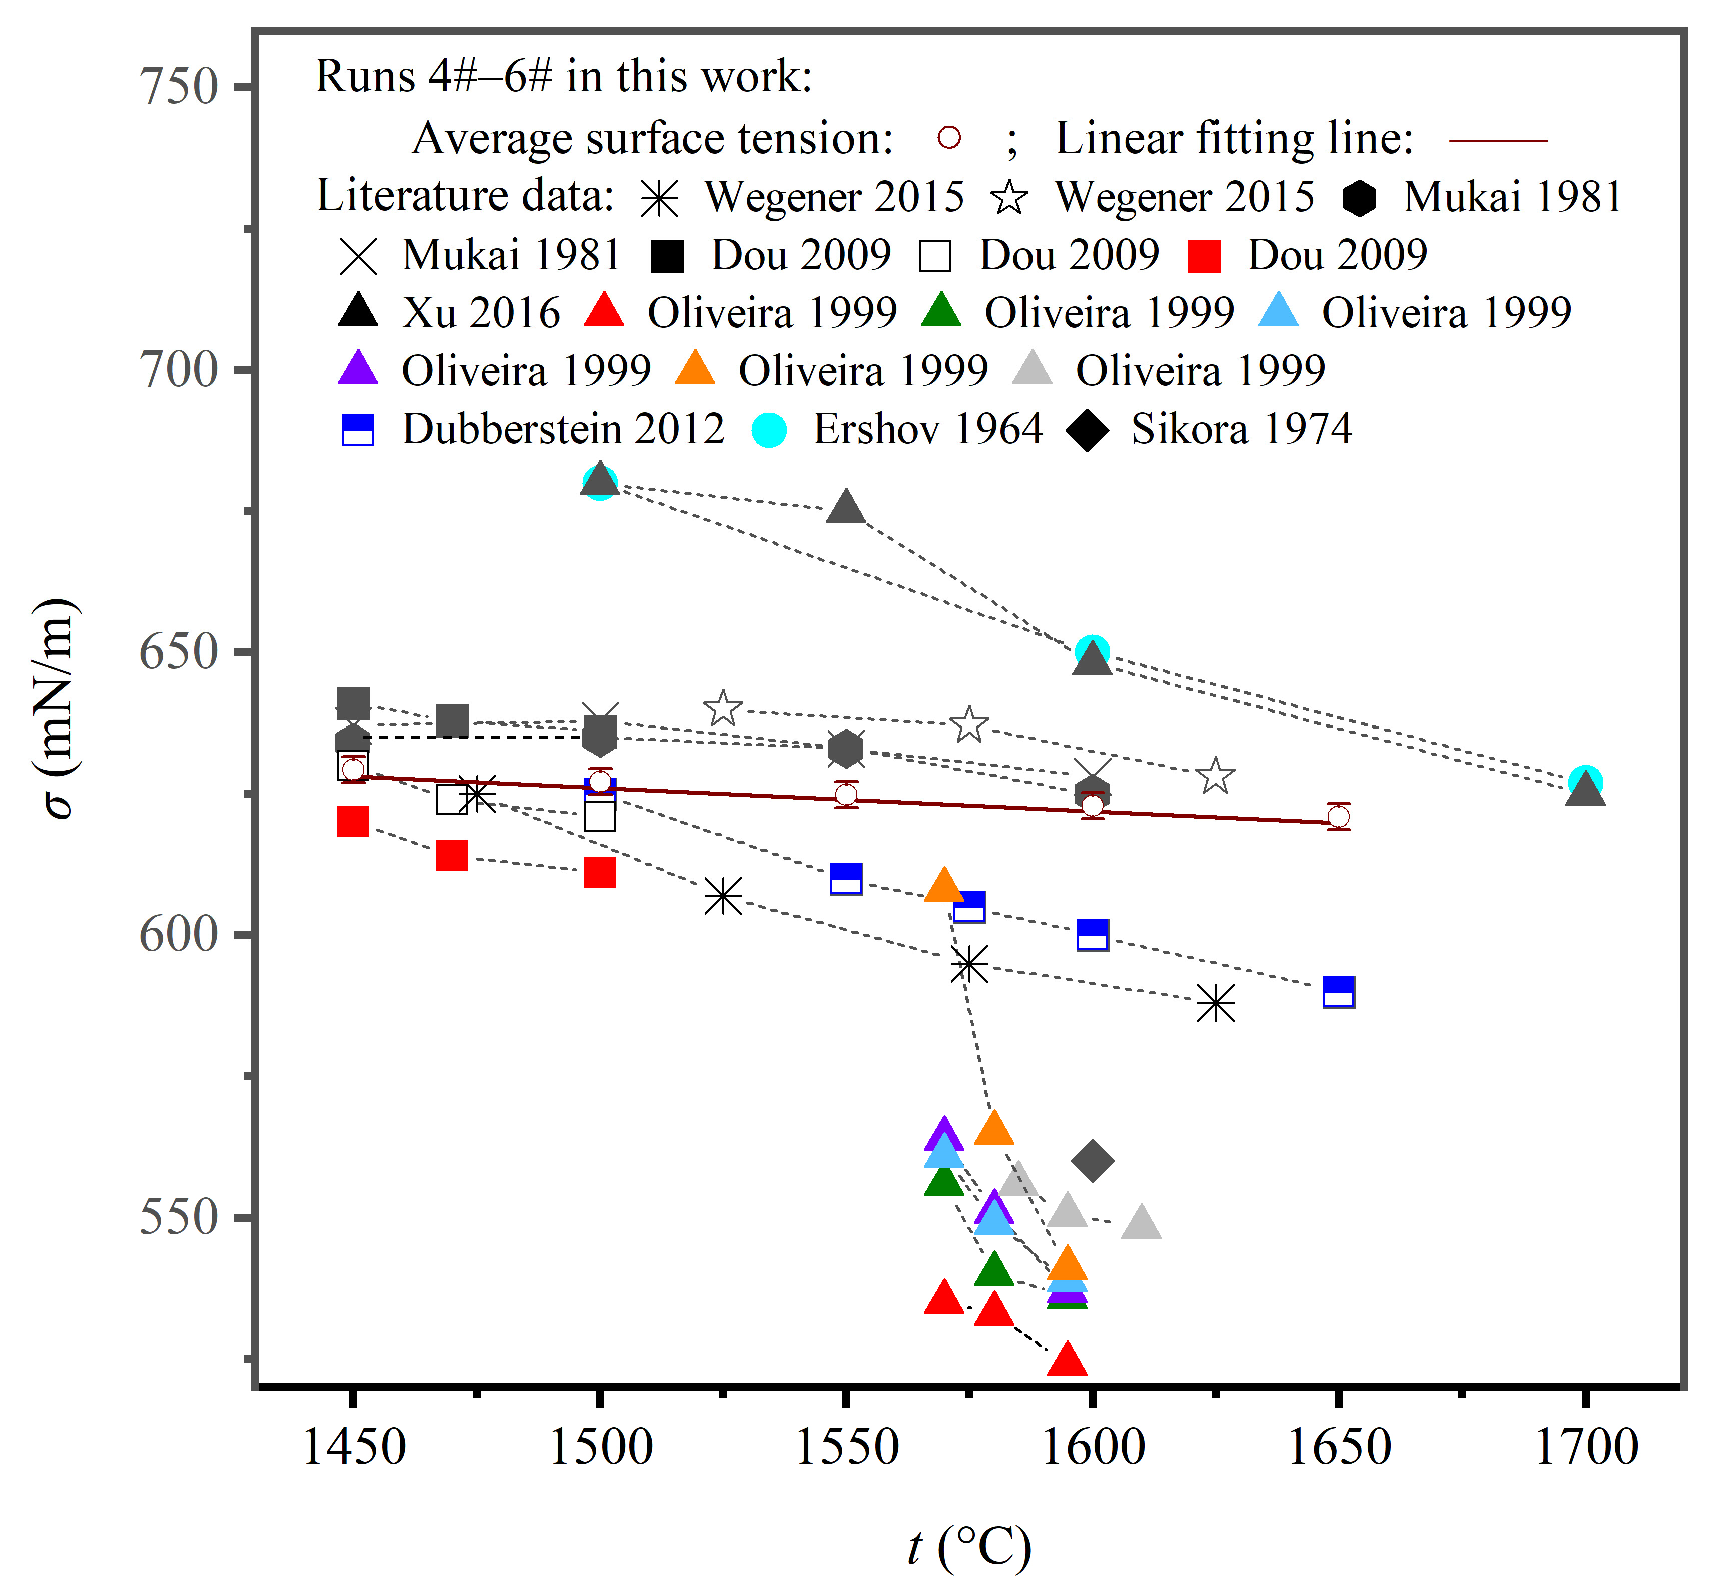
Due to the small differences in the R0, β, ρ, and σ values between the heating and cooling modes in runs 4#–6#, this indicates that the determination results under the two modes have good stability when the slag mass is relatively large. Therefore, the average density and surface tension values obtained under the two modes can be linearly fitted against temperature (1450–1650 °C), as shown in Figure 6 and Figure 7, respectively. The linear relationships between the average density (ρ, g/cm3) and surface tension (σ, mN/m) values and temperature (t, °C) are given in Equations (6) and (7), respectively.
Figure 6.
The variation in the measured density of CaO–Al2O3 molten slag with temperature in this work and in the literature. The literature data adapted from Refs. [,,,].
Figure 7.
The variation in the measured surface tension of CaO–Al2O3 molten slag with temperature in this work and in the literature. The literature data adapted from Refs. [,,,,,,,].
Based on 30 data points (refer to Table 3, note only 15 data points at 1650 °C) of density or surface tension at each temperature in runs 4#–6#, the standard deviation at each temperature was calculated using the STDEV. S function in the Excel software. The calculation results indicate that the standard deviations of density and surface tension are the highest at 1450 °C, with values of 0.006 g/cm3 and 2 mN/m, respectively. The corresponding error bar representing standard deviations at each temperature is also presented in Figure 6 and Figure 7.
It can be seen that both the density and surface tension values of CaO–Al2O3 molten slag decreased with the increase in temperature, while the R0 value increased synchronously, and the β value only increased slightly (see Figure 5). This phenomenon revealed the dual regulatory mechanisms of temperature on the microstructure of the molten slag. On the one hand, the increase in temperature leads to intensified particle motion, weakening the interaction force between particles and resulting in an increase in the droplet volume and a decrease in density. On the other hand, the surface molecules decrease their binding strength with internal molecules due to enhanced thermal motion, resulting in a decrease in surface tension. This relaxation of the microstructure enhances the fluidity of the molten slag, which is macroscopically manifested as the expansion and sagging of the droplet, resulting in increases of R0 and β with the increase in temperature. It was noted that β had a significant effect on the σ value; fitting calculations showed that a 1% deviation of the determined β value could directly cause a proportional change in the σ value, and this sensitivity stemmed from the core equation (that is, Equation (2)) of the pendant drop method.
Overall, when the droplet mass was small (see runs 1#–3#), the slag mass had a greater effect on the results than the measurement mode. However, when the slag mass was relatively large (see runs 4#–6#), the effects of both factors were negligible. It is recommended that the droplet with a mass as close as possible to the theoretical critical mass of the pendant drop-forming device should be used for the measurements, but the measurement mode (i.e., heating or cooling mode) is not limited.
To evaluate the accuracy of surface tension measurement using the pendant drop method, Berry [] proposed the Wo number as a criterion. The Wo value is defined in Equation (8).
The Wo value is between 0 and 1. The closer the Wo value is to 1, the more accurate the measured surface tension is. In this work, the average Wo value is 0.73 and increases with the droplet mass (the Wo values for runs 1#–6# are 0.67, 0.72, 0.73, 0.74, 0.75, and 0.76, respectively), indicating that the larger the droplet mass, the smaller the measurement error of surface tension. This is consistent with the decrease in the measurement error of the surface tension as mentioned earlier when the droplet mass increases.
The uncertainties of calculating measured density and surface tension are of great significance. Here, the influencing factors involved in measuring density and surface tension in this work were analyzed, including mass, scale length, and temperature. The uncertainty components were calculated or estimated separately, and the combined standard uncertainty values of density and surface tension were finally obtained. Due to the large number of categories of uncertainty, the simple calculations are as follows:
The used electronic balance can be accurate to 0.0001 g (see Table 2), and the combined standard uncertainty of its mass is g. The pixel length of the Pt-10% Ir alloy ring is measured by identifying pixel points, and its error comes from the selection of endpoints, with an endpoint coordinate point error of 1 px (see Figure 2 or Table 1). Therefore, the uncertainty of one endpoint is: px. According to the rules of error propagation, the pixel coordinates of the starting and ending points are independent of each other, and the combined uncertainty of the two endpoints is px. The magnification factor, namely, Mag, of the image is 94.285 px/mm, and the scale uncertainty component, namely, upx(L), introduced by the endpoint pixel length error can be obtained from Equation (9).
The uncertainty components of the measured length of the alloy ring under SEM are neglected due to the small values, and upx(L) is equal to the combined standard uncertainty, namely, u(L), of the scale length. That is to say, the value of u(L) is mainly determined by upx(L).
Assuming VC was fitted from the edge of the droplet profile: VC = aL3, where a is a constant for stacking droplets by a pixel grid in a stereoscopic image. The uncertainty component of VC is as follows:
Due to the small values of u(VA) (including inclination angle α) and u(VB), the u(VC) obtained from Equation (10) is equal to the combined standard uncertainty, namely, u(Vm), of the total volume of the droplet. That is to say, u(Vm) is mainly determined by u(VC)—refer to Table 3.
According to the equation ρ = m/Vm, the uncertainty component, namely, ucal(ρ), of the calculated density can be obtained by substituting the relevant data into Equation (11). It can be seen that u(m) is relatively small, and ucal(ρ) is mainly determined by u(Vm).
Due to the small uncertainty components of temperature and repeated density measurements, they can be ignored. Then, ucal(ρ) is equal to the combined standard uncertainty, namely, u(ρ), of the slag density. To one significant digit, u(ρ) = 1 × 10⁻² g/cm3. It can be seen that u(ρ) is essentially determined by the uncertainty, namely, upx(L), of the pixel length.
According to Equation (2), the uncertainty component, namely, ucal(σ), of the calculated surface tension can be obtained from Equation (12).
where the uncertainty of ∆ρ is as follows: u(Δρ) = u(ρ) = 1 × 10⁻² g/cm3. It should be noted that g is a constant, and its uncertainty can be ignored. The R0 and β values are provided from the SCA20 software by identifying the droplet profile. The software interface displays that the original output data for R0 and β values are to four decimal places, but the data source accuracy provided by the SCA20 software is only two digits. The uncertainties introduced by R0 and β are, respectively, mm, and . By substituting other relevant data into Equation (12), ucal(σ) is calculated to be 4.1 mN/m. Ignoring the uncertainty components of temperature and repeated surface tension measurements, ucal(σ) is equal to the combined standard uncertainty, namely, the u(σ) value, of surface tension. To one significant digit, u(σ) = 4 mN/m.
The calculation results indicate that the combined standard uncertainty of the measured density values is u(ρ) = 0.01 g/cm3, which mainly depends on the uncertainty of the scale (L) determined by the pixel method or the uncertainty of the VC calculated by fitting. The combined standard uncertainty of the measured surface tension is u(σ) = 4 mN/m, with the uncertainty component of β having the greatest impact, followed by that of ρ and R0. It can be seen that the uncertainties of the pixel grid scale and droplet profile edge fitting have the greatest impact on the determination of density and surface tension, while other factors such as temperature, inclination angle (α), and the average value of measured density or surface tension can be ignored.
4.2. Comparison of the Measured Density and Surface Tension with the Literature Data
For comparison, Figure 6 also shows the variation in density with temperature for CaO–Al2O3 slag with the same or similar composition in the literature. Table 4 provides literature sources for the density values of CaO–Al2O3 slag with the same or similar composition, as well as relevant information on their experimental measurement methods, conditions, etc. The slag density generally shows a decreasing trend with an increase in temperature, but there are also different trends in the literature. At comparable temperatures, the density values of CaO–Al2O3 slag measured in this work are higher than those of Dou et al. [], but the temperature coefficients of density are not much different. Dou et al. [] adopted the sinker method to measure the slag density, while the pendant drop method was used in this work. Since the slag composition is very similar, it can be seen that the measurement method can significantly affect the determined density of CaO–Al2O3 slag among different researchers. Most other researchers used the maximum bubble pressure method to determine slag density. For the molten slag with a composition of CaO/Al2O3 = 50%/50% (mass fraction), the temperature coefficients of density in the literature differ significantly from those obtained in this work. Moreover, corresponding densities are larger than those in this work at lower temperatures, while being smaller than those in this work at higher temperatures. Within the comparable temperature ranges, the density and its temperature coefficients determined in this work are only consistent with the results obtained by Oliveira [] for slag with the same composition, indicating that the density determined in this work is basically reasonable. But strangely, the densities measured by Oliveria et al. [] for other CaO–Al2O3 slags with different compositions do not decrease with the increase in temperature.
Table 4.
Experimental conditions for density and surface tension of CaO–Al2O3 slag in the literature.
Figure 7 also shows the variation in surface tension with temperature for CaO–Al2O3 slag with the same or similar composition in the literature. Corresponding literature sources, along with their experimental methods and conditions, are also summarized in Table 4. Overall, the surface tension of the slag in both this work and the literature shows a decrease with the increase in temperature, which is consistent with the theoretical expectation that slag structures tend to dissociate with increases in temperature. However, it is worth noting that the surface tension values obtained by different research groups show significant discrepancies, which may be due to fluctuations in the component contents in each system as well as differences including impurity contents, measurement methods, and related parameters. The surface tension values measured by Ershov et al. [] and Xu et al. [] were significantly larger using the maximum bubble pressure and slide methods, respectively. The measurement results using the maximum bubble pressure method from Oliveria et al. [] were significantly smaller, while the temperature coefficient was relatively larger. The measurement results in this work were relatively close to those of other researchers and were at an intermediate level, indicating that the surface tension values measured in this work are also reasonable. Furthermore, it can be known from Figure 6 and Figure 7 that when the same method is used to simultaneously measure both density and surface tension in the relevant literature, the variation in the two with temperature is sometimes not consistent, and these data are questionable. For example, the surface tension measured by Oliveira et al. [] using the maximum bubble pressure method decreased with increases in temperature, but the temperature dependence of the density of the slag with the same composition was different.
In addition, the interactions between the molten slag and the experimental substrate materials during the measurement process may also affect the results. As shown in Table 4, the experimental substrates in the literature are mostly Mo or graphite materials, both of which still undergo a certain degree of oxidation even in an argon atmosphere. In this work, Pt–10% Ir alloy was adopted. Although its physical and chemical stability was far superior to that of Mo and graphite, there would still be trace amounts of Pt and Ir undergoing oxidation reactions under high temperature and Ar gas conditions, forming oxides of Pt or Ir. Some of the gas products were discharged from the furnace with the carrier gas, while others dissolved into the molten slag through interfacial reactions [,,,]. After the experiment, it was found that the pendant drop-forming device was slightly weightless (refer to Table 2), and the adhered slag on the alloy bracket was blue, which was basically consistent with the characteristic blue-black color of IrO2 reported in the literature [], indicating the occurrence of Ir oxidation during the experiment. The ICP detection of the solid droplet detached from the alloy ring by acid leaching showed that there were trace amounts of Pt and Ir in the slag, with the Pt and Ir contents being 39 ppm and 2 ppm, respectively, confirming the phenomenon of trace dissolution of the Pt–10% Ir alloy into the slag at high temperatures. Furthermore, it was observed that the solidified CaO–Al2O3 slag exhibited a grayish-yellow surface (see Figure 1a) after the experiment. It is speculated that the color is caused by a trace impurity component, such as Al4C3, in the slag. The crystal of Al4C3 has a pale yellow color []. Carbides such as Al4C3 may be generated when the CaO–Al2O3 slag is smelted using a graphite crucible in the induction furnace. Therefore, it is very difficult to completely avoid contamination when determining the properties of molten slag at high temperatures.
5. Conclusions
In this work, the measurement mode has little effect on the results under the experimental conditions, but the slag mass has a certain effect on the surface tension when the droplet mass is small. The average density and surface tension values obtained in this work both display a linear decrease with increases in temperature, and the temperature coefficients are −3.406 × 10⁻⁴ g/(cm3·°C) and −4.2 × 10⁻² mN/(m·°C), respectively. Moreover, the standard deviations of measured density and surface tension were calculated, with maximum values of 0.006 g/cm3 and 2 mN/m, respectively. The combined standard uncertainties of the measured density and surface tension were also analyzed and calculated, with values of 0.01 g/cm3 and 4 mN/m, respectively. The density and surface tension values obtained are basically consistent with the literature data, indicating that the method for determining density and surface tension in this work is feasible and the measurement results are reasonable and reliable. The research findings will be beneficial for promoting the application of the pendant drop method in determining the density and surface tension properties of molten slag.
Author Contributions
Conceptualization, Y.G.; Methodology, J.C. and Y.G.; Software, J.C. and Y.G.; Validation, J.C. and Y.G.; Formal analysis, J.C. and Y.G.; Resources, Y.G.; Data curation, J.C.; Writing—original draft, J.C.; Writing—review and editing, Y.G.; Supervision, Y.G.; Project administration, Y.G.; Funding acquisition, Y.G. All authors have read and agreed to the published version of the manuscript.
Funding
This study was supported by the National Natural Science Foundation of China (No. 52374343).
Data Availability Statement
The original contributions presented in this study are included in the article. Further inquiries can be directed to the corresponding author.
Conflicts of Interest
The authors declare no conflicts of interest.
Nomenclature
The following symbols are used in this paper:
| Dn | Inner diameter of the alloy ring (mm) | t | Experimental temperature (°C) |
| g | Gravitational acceleration constant (g = 9.7933 m/s2) | VA, VB, and VC | Volumes of parts A, B, and C of the slag, respectively (mm3) |
| h | Height of crown-shaped slag on the upper horizontal plane of the alloy ring (mm) | Vm | Total volume of slag (mm3) |
| L20 °C and Lt | Maximum outer diameter of the alloy ring at room and experimental temperatures, respectively (mm), or scale length | Wo | Dimensionless number |
| Lpixel,20°C and Lpixel,t | Pixel length of the maximum outer diameter of the alloy ring at room and experimental temperatures, respectively (px) | z | Height difference between the vertex of the pendant drop and the measurement position (mm) |
| Mag | Magnification factor of image (px/mm) | α | Inclination angle (°) |
| m | Final pendant droplet mass (g) | β | Shape factor |
| m0 and m1 | Mass of the slag or pendant drop-forming device before and after the experiment (g) | φ | Diameter of cylindrical compact (mm) |
| m2 | Mass of adhered slag on the alloy bracket after experiment (g) | π | Constant (π = 3.1416) |
| r | Half of the diameter of the alloy ring wire (mm) | ρ | Density of droplet (g/cm3) |
| R | Half of the outer diameter of the alloy ring (mm) | ρAr | Density of argon gas (g/cm3) |
| R0 | Curvature radius of the pendant drop vertex (mm) | ∆ρ | Density difference between the pendant drop and the environment atmosphere (that is, Ar gas in this work) (g/cm3) |
| R1 and R2 | Main curvature radius on both sides of the pendant drop (mm) | σ | Surface tension of droplet (mN/m) |
| L | Scale length (mm) | Average surface tension of droplet (mN/m) | |
| u(B) | Uncertainty of physical quantity B | Average density of droplet (g/cm3) |
References
- Zhang, H.; Peng, Y.B.; Zhang, S.; Liu, C.S. Effects of refining slag on transformation and removal of inclusions in type 430 stainless steel. Metall. Mater. Trans. B 2022, 53, 702–715. [Google Scholar] [CrossRef]
- Liu, C.S.; Ran, X.G.; Zhang, H.; Li, J.; Wang, Y.; Lu, Y.Y.; Xiong, L.; Ni, H.W. Influence of refining slag on transformation and separation of nonmetallic inclusions in 316L stainless steel. Mater. Res. Technol. 2023, 26, 7199–7217. [Google Scholar] [CrossRef]
- Zheng, D.L.; Ma, G.J.; Zhang, X.; Liu, M.K.; Xu, J.F. Effect of CaO/Al2O3 on structure, viscosity, and surface tension of electroslag remelting-type CeO2-bearing slag. Iron Steel Res. Int. 2023, 30, 717–725. [Google Scholar] [CrossRef]
- Cheremisina, E.; Zhang, Z.; Bilbao, E.; Schenk, J. Density, viscosity and surface tension of high-silicate CaO–SiO2–Fe2O3 slags derived by aerodynamic levitation. The behavior of Fe3+ in high-silicate melts. Cream. Int. 2023, 49, 4460–4472. [Google Scholar] [CrossRef]
- Ju, J.T.; He, K.; Guo, W.K.; Zhou, Y. Effects of TiO2 and CaO/Al2O3 on melting characteristics, surface tension, and structure electroslag-remelting-type low-fluorine slag. Steel Res. Int. 2024, 95, 2400241. [Google Scholar] [CrossRef]
- Chang, Y.E.; Lin, C.M.; Shen, J.M.; Luo, S.F.; Yu, K.W.; Wu, W. The effect of the addition of alumina on the viscosity, surface tension, and foaming efficiency of 2.5(CaO/SiO2)–xAl2O3–yFeO–MgO melts. Ceram. Int. 2023, 49, 1994–2003. [Google Scholar] [CrossRef]
- Hoorfar, M.; Neumann, A.W. Recent progress in axisymmetric drop shape analysis (ADSA). Adv. Colloid Interface Sci. 2006, 121, 25–49. [Google Scholar] [CrossRef]
- Berry, J.D.; Neeson, M.J.; Dagastine, R.R.; Chan, D.Y.C.; Tabor, R.F. Measurement of surface and interfacial tension using pendant drop tensiometry. J. Colloid Interface Sci. 2015, 454, 226–237. [Google Scholar] [CrossRef]
- Saad, S.M.I.; Policova, Z.; Neumann, A.W. Design and accuracy of pendant drop methods for surface tension measurement. Colloids Surf. A 2011, 384, 442–452. [Google Scholar] [CrossRef]
- Sravya, S.; Thomas, W. Stability and critical volume of a suspended pendant drop in air via experiments and eigenvalue analysis. Colloids Surf. A 2023, 66, 131346. [Google Scholar] [CrossRef]
- Wegener, M.; Muhmood, L.; Sun, S.; Deev, A.V. Surface tension measurements of calcia-alumina slags: A comparison of dynamic methods. Metall. Mater. Trans. B 2015, 46, 316–327. [Google Scholar] [CrossRef]
- Chang, Y.Y.; Wu, M.Y.; Hung, Y.L.; Lin, S.Y. Accurate surface tension measurement of glass melts by the pendant drop method. Rev. Sci. Instrum. 2011, 82, 055107. [Google Scholar] [CrossRef] [PubMed]
- Kingery, W.D. Surface tension of some liquid oxides and their temperature coefficients. J. Am. Cream. Soc. 1959, 42, 6–10. [Google Scholar] [CrossRef]
- Mukai, K.; Ishikawa, T. Surface tension measurements on liquid slags in CaO–SiO2, CaO–Al2O3 and CaO–Al2O3–SiO2 systems by a pendant drop method. J. Jpn. Inst. Met. 1981, 45, 147–154. (In Japanese) [Google Scholar] [CrossRef]
- Lihrmann, J.M.; Haggerty, J.S. Surface tensions of alumina-containing liquids. American. J. Am. Ceram. Soc. 1985, 68, 81–85. [Google Scholar] [CrossRef]
- Lee, J.; Kiyose, A.; Nakatsuka, S.; Nakamoto, M.; Tanaka, T. Improvements in surface tension measurements of liquid metals having low capillary constants by the constrained drop method. ISIJ Int. 2004, 44, 1793–1799. [Google Scholar] [CrossRef]
- Duchesne, M.A.; Hughes, R.W. Slag density and surface tension measurements by the constrained sessile drop method. Fuel 2017, 188, 173–181. [Google Scholar] [CrossRef]
- Paras, J.; Takeda, O.; Wu, M.; Allanore, A. The surface tension and density of molten Sc2O3, La2O3, Y2O3, Al2O3, and MgO measured via a pendant droplet method. Metall. Mater. Trans. B 2022, 53, 2077–2087. [Google Scholar] [CrossRef]
- Stephan, H.W.; Wang, B.; Wang, T.; Stadler, F.J. Measurement principles for room temperature liquid and fusible metals’ surface tension. Surf. Interfaces 2023, 39, 102921. [Google Scholar] [CrossRef]
- Xin, J.J.; Wang, N.; Chen, M.; Gan, L. Surface tension calculation of molten slag in SiO2–Al2O3–CaO–MgO systems based on a statistical modelling Approach. ISIJ Int. 2019, 59, 759. [Google Scholar] [CrossRef]
- Shi, C.B.; Seo, M.D.; Cho, J.W.; Kim, S.H. Crystallization characteristics of CaO–Al2O3–based mold flux and their effects on in-mold performance during high-aluminum TRIP steels continuous casting. Metall. Mater. Trans. B 2014, 45, 1081–1090. [Google Scholar] [CrossRef]
- Zhou, Y.; Wu, L.S.; Wang, J.; Wang, H.C.; Dong, Y.C. Alumina extraction from high-alumina ladle furnace refining slag. Hydrometallurgy 2013, 140, 14–19. [Google Scholar] [CrossRef]
- Dou, Z.H.; Zhang, Y.A.; Yao, J.M.; Jang, X.L.; Niu, L.P.; He, J.C. Research on the character of CaO–Al2O3 slag. Chin. J. Process. Eng. 2009, 9, 4–8. [Google Scholar] [CrossRef]
- Xu, J.F.; Zhang, J.Y.; Chen, D.; Sheng, M.Q.; Weng, W.P. Effects of MgO content and CaO/Al2O3 ratio on surface tension of calcium aluminate refining slag. J. Cent. South Univ. 2016, 23, 3079–3084. [Google Scholar] [CrossRef]
- Oliveira, F.A.; Miller, A.; Madias, J. Surface tension, densities and viscosities of some CaO–Al2O3 slags. Rev. Metal. Madrid. 1999, 35, 91–99. [Google Scholar] [CrossRef]
- Dubberstein, T.; Heller, H.P.; Scheller, P.R. Determination of Thermophysical Properties for Molten Slags by Maximum Bubble Pressure Method; Institute of Iron and Steel Technology IEST, Technical University Bergakademie Freiberg: Freiberg, Germany, 2012; Available online: https://api.semanticscholar.org/CorpusID:204920674 (accessed on 11 November 2025).
- Ershov, G.S.; Popova, E.A. Dissolution kinetics of silica in oxide melt. Russ. J. Inorg. Chem. 1964, 9, 654–659. [Google Scholar]
- Sikora, B.; Zielinski, M. Density surface tension, viscosity, and electric conductivity of fused calcium oxide-alumina-calcium fluoride systems. Hutnik 1974, 41, 433–437. Available online: https://www.mendeley.com/catalogue/375c1e4e-ea67-3558-8dd2-70ae18b6931a/ (accessed on 11 November 2025).
- Gao, Y.; Zhang, H.; Wang, Q.; Li, G. Effect of applied voltage on wetting and corrosion of corundum refractory by CaO–SiO2–MgO molten slag. Ceram. Int. 2022, 48, 9753–9764. [Google Scholar] [CrossRef]
- Zhang, X.; Gao, Y.; Wang, Q.; Li, G. Determination of density and surface tension of CaO–SiO2–Al2O3 molten slag by pendant drop method. Metall. Mater. Trans. B 2023, 54, 1499–1510. [Google Scholar] [CrossRef]
- Saad, S.M.I.; Neumann, A.W. Axisymmetric drop shape analysis (ADSA): An outline. Adv. Colloid Interface Sci. 2016, 238, 62–87. [Google Scholar] [CrossRef]
- GB/T 4842-2017; Argon. Standardization Administration of China (SAC): Beijing, China. (In Chinese)
- Alcock, C.B.; Hooper, G.W. Thermodynamics of the gaseous oxides of the platinum-group metals. Phys. Math. Sci. 1960, 254, 551–561. Available online: http://www.jstor.org/stable/2413869 (accessed on 11 November 2025).
- Wimber, R.T.; Kraus, H.G. Oxidation of iridium. Metall. Mater. Trans. B 1974, 5, 1565–1571. [Google Scholar] [CrossRef]
- Wimber, R.T.; Hills, S.W.; Wahl, N.K.; Tempero, C.R. Kinetics of evaporation/oxidation of iridium. Metall. Mater. Trans. A 1977, 8, 193–199. [Google Scholar] [CrossRef]
- Cordfunke, E.H.P.; Meyer, G. The system iridium-oxygen I. Measurements on the volatile oxide of iridium. J. Chem. Soc. 1962, 81, 495–504. [Google Scholar] [CrossRef]
- Gesing, T.M.; Jeitschko, W. The crystal structure and chemical properties of U2Al3C4 and structure refinement of Al4C3. Z. Naturforsch. B 1995, 50, 196–200. [Google Scholar] [CrossRef]
Disclaimer/Publisher’s Note: The statements, opinions and data contained in all publications are solely those of the individual author(s) and contributor(s) and not of MDPI and/or the editor(s). MDPI and/or the editor(s) disclaim responsibility for any injury to people or property resulting from any ideas, methods, instructions or products referred to in the content. |
© 2025 by the authors. Licensee MDPI, Basel, Switzerland. This article is an open access article distributed under the terms and conditions of the Creative Commons Attribution (CC BY) license (https://creativecommons.org/licenses/by/4.0/).