Abstract
Thick steel plates in bridges exhibit mechanical property gradients along their thickness, yet the underlying micro-mechanisms remain unclear. This study investigates an 80 mm thick 420 MPa-grade HSLA steel plate, and also quantitatively investigates the mechanism of its mechanical gradient behavior in the thickness direction through layered tensile tests combined with multi-scale microstructural characterization. The unique contribution of this work lies in establishing a quantitative correlation between the gradient in the dislocation density and the transition in yielding behavior. The results show that the surface layer area of the tested steel exhibited continuous yield characteristics, while all core layers exhibited pronounced discontinuous yielding. The mechanical properties showed a gradient distribution along the thickness direction, with the yield strength and tensile strength decreasing from 512.4 MPa and 545.9 MPa at the surface to 419.5 MPa and 520.4 MPa at the center (1/2t). Microstructural analysis shows that the full-thickness structure was composed of granular bainite (GB) and polygonal ferrite (PF). With respect to increases with depth, the average grain size increased from 6.86 µm at the surface to 11.57 µm at the center. Moreover, the surface region exhibited a broader grain size distribution range and higher size dispersity. The second-phase precipitates in the full thickness were mainly of two types, namely, Fe3C and (Nb, Ti) (C, N) composite precipitates, and the precipitates in the surface layer had smaller sizes and higher distribution densities. Crucially, the dislocation density decreased sharply from the surface to 1/8t, then stabilized. While quantitatively elucidating the contributions of various strengthening mechanisms to the strength gradient, the mechanistic analysis also reveals a dislocation microstructure synergistic mechanism underlying the yield behavior differences.
1. Introduction
As modern bridges evolve toward larger spans, heavier loads, and enhanced adaptability to complex environments, there has been a substantially growing demand for high-performance thick steel plates [1]. Traditional ferrite pearlite carbon steels face inherent limitations in simultaneously attaining high strength and toughness due to their limited strength–toughness balance and coarse, brittle microstructures. Currently, high-strength low-alloy (HSLA) steels produced via the Thermomechanical Control Process (TMCP) can achieve optimal microstructure and mechanical properties through controlled additions of microalloying elements involving Nb, V, Mo, etc., as well as microstructure optimization [2], thereby offering a viable solution to overcoming material performance limits [2,3,4].
During thick plate production, process-induced defects, such as center segregation, cooling gradients, and deformation inhomogeneity, induce pronounced microstructural heterogeneity along the thickness direction, consequently leading to the development of mechanical property gradients [5]. Sun et al. [4] evaluated the mechanical properties of 60 mm thick 460 MPa grade steel plate at different thicknesses. The results indicate that the bainite fraction decreases and grains coarsen from 1/4t to 1/2t, leading to the yield strength and impact toughness at 60 °C decreasing from 648 MPa to 575 MPa and 64 J to 32 J, respectively. Zhang et al. [6] investigated the microstructure and mechanical properties at different positions of 85 mm thick, 500 MPa grade thick steel plates. The results show that, due to variations in cooling rates, the fraction of bainite in the microstructure gradually decreases from the surface to 1/2t, with corresponding yield strength reduction occurring from 659 MPa to 494 MPa.
The yielding behavior of metallic materials during tensile deformation can be broadly categorized into two types: continuous and discontinuous yielding. Discontinuous yielding is characterized by a distinct yield point, a subsequent yield drop, and a yield plateau (Lüders strain) on the curve. In contrast, continuous yielding exhibits a smooth elastic plastic transition without a yield point or plateau. This distinction holds significant practical implications. The yield plateau in discontinuous yielding can lead to inhomogeneous plastic deformation, where strain is localized in propagating Lüders bands, potentially resulting in surface imperfections or unpredictable dimensional changes in formed components. Conversely, continuous yielding promotes homogeneous deformation from the onset, which is highly desirable for forming processes as it ensures uniform strain distribution and superior surface quality.
In some past studies on thick steel plates produced via the TMCP, a tendency toward continuous yielding or a transition from discontinuous to continuous yielding has been observed near the surface [6,7]. However, these studies primarily document the phenomenon rather than providing a systematic mechanistic explanation. The current understanding of yielding mechanisms is fragmented, with debates centering on the roles of grain size and dislocation density. For instance, Li et al. [8] reported that, in pure titanium, discontinuous yielding occurs at grain sizes of 1–2 μm, while continuous yielding appears when grains grow beyond 2.26 μm. Conversely, studies on a Ti-3Al-2.5V alloy show that both ultrafine grains (0.5–1 μm) and coarse grains (2–3 μm) can exhibit continuous yielding [9], whereas discontinuous yielding emerges at an average size of ~4 μm [10]. Similar grain size effects have been observed in pure copper [11]. Beyond the grain size, the initial mobile dislocation density is another critical factor. Shi et al. [12] and Fan et al. [13] attributed the suppression of yield platforms to a high density of low-angle grain boundaries and an initial lack of mobile dislocations, respectively. Furthermore, Zhang et al. [14] proposed that a high geometrically necessary dislocation density enhances strain hardening, thereby inhibiting yield drop and promoting continuous yielding.
These seemingly contradictory findings underscore that yielding behavior is not governed by a single isolated factor but by the complex synergy of multiple microstructural parameters. Crucially, within the context of thick steel plates, a dedicated investigation that quantitatively links the well-known mechanical property gradient to the underlying microstructural gradient responsible for the yielding behavior transition from surface to core is, notably, absent. Therefore, a systematic study is essential to deconvolute these synergistic effects and establish a unified mechanistic understanding.
To establish this understanding, this study employed a systematic experimental approach centered on an 80 mm thick 420 MPa grade HSLA steel plate processed by TMCP. The investigation combined layered tensile testing with multi-scale microstructural characterization. Tensile specimens were machined from five distinct layers (surface, 1/8t, 1/4t, 3/8t, and 1/2t) to quantitatively assess the mechanical property gradient. The concomitant microstructural evolution—including phase fraction, grain size, precipitate distribution, and dislocation density—was analyzed using optical microscopy (OM) scanning electron microscopy (SEM), electron backscatter diffraction (EBSD), transmission electron microscopy (TEM), and X-ray diffraction (XRD).
2. Experimental Procedures
2.1. Material and Processing
The chemical compositions of the experimental steel are detailed in Table 1. The 80 mm thick plate was produced via TMCP using a two-stand reversible mill with a roll length of 4300 mm. The steel plate was supplied by China Railway Shanhaiguan Bridge Group Co., Ltd. (Qinhuangdao, China). The technological process is shown in Figure 1. The key thermal-mechanical parameters in Figure 1 are defined as follows: Tnr is the non-recrystallization temperature, Ar3 is the austenite-to-ferrite transformation start temperature, and FCT is the finish cooling temperature. First, the continuous casting slab was reheated at 1200 °C for 2 h to achieve microstructural homogenization and to dissolve second-phase particles. Subsequently, the slab was rolled to a thickness of 80 mm at a rough rolling temperature (RRT) of 1000–1050 °C and a finish rolling temperature (FRT) of 820–850 °C. The steel plate was then forced water cooled to the phase transformation critical point of 500 °C at a rate of 20 °C/s through an accelerated cooling system (ACC), and it was then finally air cooled to room temperature to complete microstructural regulation.

Table 1.
The chemical compositions of the experimental steel (wt. %).
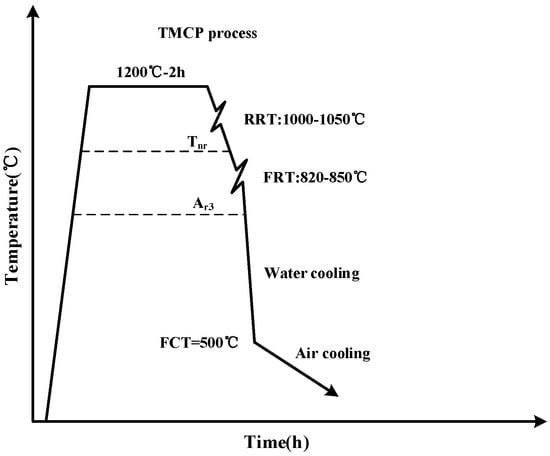
Figure 1.
Schematic diagram of the TMCP.
2.2. Microstructural Characterization
OM (Axio Vert.A1, ZEISS, Oberkochen, Germany) and SEM (EVO18, ZEISS, Oberkochen, Germany; 20 keV, WD = 13.5 mm) were used to observe the microstructure at different thickness positions on the rolling direction normal direction (RD-ND) plane. Specimen preparation involved mechanical polishing and etching (4% Nital). Grain size analysis and bainite/ferrite phase area fraction quantification were performed using Image-Pro Plus 6.0 software on SEM images with a magnification of 200. EBSD (HikariPlus, EDAX, Berwyn, PA, USA) was performed with an accelerating voltage at 20 keV and a step size of 0.25 μm. The samples for EBSD were electropolished at −20 °C in an ethanol solution containing 10% perchloric acid with a voltage of 30 V for 30 s. After EBSD data collection, AZtecCrystal 2.1.2 software was applied to analyze the crystallographic orientation, strain distribution, and grain boundary misorientation on the RD-ND plane of the experimental steel at different thicknesses.
TEM (JEM-F200, JEOL, Tokyo, Japan) equipped with energy-dispersive X-ray spectroscopy (EDS) capability was adopted to investigate the crystal structure and precipitate characteristics of the samples. TEM foil specimens were prepared from 500 μm thick slices extracted at different thicknesses. The slices were mechanically ground to a 50 μm thickness followed by twin-jet electropolishing at 20 V and −20 °C to achieve electron transparency.
XRD (SmartLabSE, Rigaku, Tokyo, Japan) analysis was performed using Cu K-α radiation (λ = 0.154 nm) at a 40 kV tube voltage, with a scanning range of 20–110° and scanning rate of 2°/min. The average dislocation density of the specimens was quantitatively determined through modified Williamson Hall equation analysis.
2.3. Mechanical Tests
The base material for testing was an 80 mm thick steel plate, from which five layers with 10 mm thickness were sectioned from the surface to the core using electrical discharge wire cutting. From each layer, three standard dumbbell-shaped tensile specimens were prepared with their longitudinal axes parallel to the rolling direction (RD). To eliminate potential surface defects, 1 mm was mechanically removed from both the top and bottom surfaces along the thickness direction, resulting in final specimens with 8 mm thickness. The sampling plan and tensile specimen dimensions are illustrated in Figure 2 and Figure 3.

Figure 2.
Schematic diagrams of the (a) layer distribution and (b) sampling locations.

Figure 3.
Schematic diagram of the tensile specimens (unit: mm).
Tensile testing was conducted at room temperature using an MTS810 universal testing machine (MTS Systems Corporation, Eden Prairie, MN, USA) with a 250 kN load capacity. The entire loading process was controlled by displacement with a strain rate of 2.5 × 10⁻⁴ s−1, and data were synchronously collected during the test until the specimen fractured.
Following fracture, rectangular specimens were extracted from characteristic fracture zones. The specimens were ultrasonically cleaned in acetone and subsequently examined for the fracture features at multiple scales using an IT-300 scanning electron microscope (JEOL, Tokyo, Japan). The examination included both low-magnification evaluations of macroscopic fracture patterns and high-resolution examinations of dimple coalescence characteristics.
3. Results
3.1. Tensile Properties
Figure 4 presents the curves of the tensile specimens at different thicknesses. As shown in the figure, the surface specimens exhibited continuous yielding behavior, following a three-stage deformation sequence with complete disappearance of the yield plateau: elastic deformation → uniform hardening → necking fracture. In contrast, the core-region specimens displayed typical discontinuous yielding characteristics, displaying a four-stage deformation pattern: elastic deformation → yield drop with Lüders band propagation → uniform hardening → necking fracture. The surface specimens demonstrated higher ultimate tensile strength, while displaying reduced fracture strain values, compared to the core region specimens.
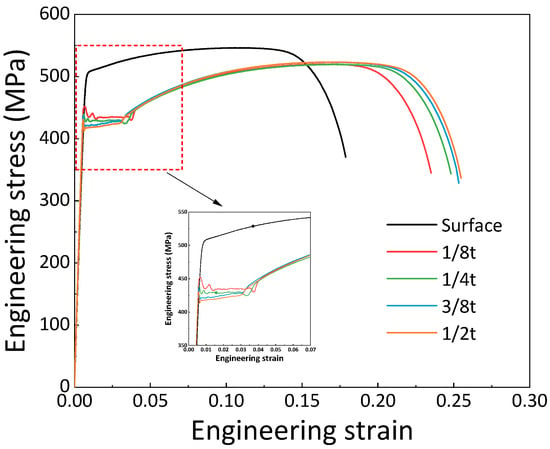
Figure 4.
Engineering strain and engineering stress curves of the experimental steel at different thicknesses.
As presented in Table 2 and Figure 5, the mechanical properties exhibited significant gradient variations along the thickness direction. From the surface to the 1/2t, the yield strength and tensile strength decreased from 512.4 MPa to 419.5 MPa and 545.9 MPa to 520.4 MPa, representing reductions of 18.1% and 4.7%, respectively. Overall, the yield strength showed significantly greater reduction than the tensile strength, leading to a decrease in the yield-to-tensile ratio from 0.93 to 0.81 with a 12.9% reduction, demonstrating enhanced plastic deformation capability and higher strength safety margins in the core region. Notably, approximately 80 percent of the strength gradient variation was concentrated between the surface and 1/8t (Figure 5a). Within this critical zone, the yield strength and tensile strength decreased from 512.4 MPa to 437.4 MPa and 545.9 MPa to 521.3 MPa, representing reductions of 14.6% and 4.5%, respectively, whereas the mechanical properties showed minimal variation from 1/8t to 1/2t. The elongation parameters exhibited an inverse gradient characteristic compared to the strength properties. From the surface to 1/2t, both the total elongation and uniform elongation increased from 0.168 to 0.258 and 0.101 to 0.171, representing increases of 53.6% and 69.3%, respectively. The elongation enhancement primarily concentrated in the near-surface region (Figure 5b), providing further evidence of the superior plastic deformation capacity in the core region.

Table 2.
The tensile properties of the experimental steel at different thickness positions.
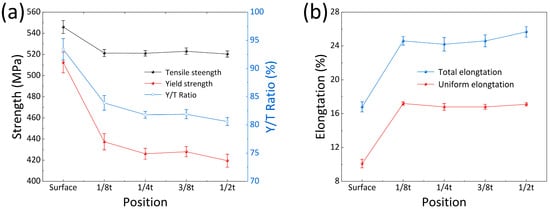
Figure 5.
The tensile properties of the experimental steel at different thicknesses: the (a) yield strength, tensile strength, and Y/T ratio, and the (b) elongation of the tensile samples.
3.2. Microstructures
Figure 6 displays the OM and SEM images of the experimental steel at various thicknesses (surface, 1/8t, 1/4t, and 1/2t). The microstructure across the entire thickness predominantly comprised granular bainite (GB) and polygonal ferrite (PF). Figure 7 presents the frequency distribution histograms and cumulative frequency curves of the grain sizes at different thicknesses, with the grain sizes quantified by equivalent diameter measurements. As shown in the figure, all of the histograms exhibit unimodal distributions. The average grain size increased from 6.86 μm at the surface to 11.57 μm at 1/2t as the depth from the surface increased. Notably, the histogram reveals a prominent submicron (<2 μm) peak at the surface, indicating the existence of fine grains that differ from the microstructure in the core region.
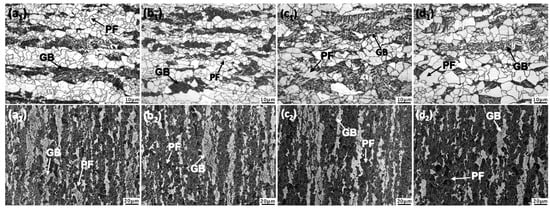
Figure 6.
OM (a1–d1) and SEM (a2–d2) images of the experimental steel at different thicknesses: (a1,a2) surface; (b1,b2) 1/8t,; (c1,c2) 1/4t; and (d1,d2) 1/2t.
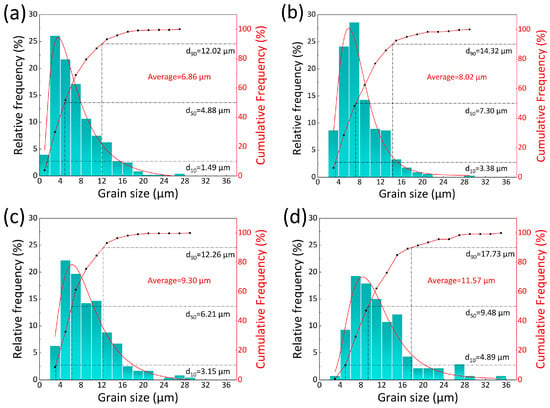
Figure 7.
The distributions of grain sizes: (a) surface, (b) 1/8t, (c) 1/4t, and (d) 1/2t.
Figure 8 shows the grain size span values of each layer calculated by Equation (1) from the data in Figure 7 and the coefficient of variation (CV) values calculated by Equation (2), where the coefficient of variation is calculated by two methods: the equivalent diameter and area.
where d10, d50, and d90 represent the particle diameters at the 10th, 50th, and 90th percentiles of the cumulative volume distribution, respectively; σ is the standard deviation; and davg is the mean value of the dataset. The span parameter quantifies the breadth of the grain size distribution (d10 to d90). A larger span value indicates a wider distribution range and greater microstructural heterogeneity, whereas a smaller value signifies a more uniform grain size distribution. The grain size span values at the surface, 1/8t, 1/4t, and 1/2t positions were 2.16, 1.50, 1.47, and 1.35, respectively. The surface span values exhibited increases of 30.6%, 31.9%, and 37.5% relative to the inner layers, indicating substantial expansion of the primary grain size distribution range at the surface. The CV values based on equivalent diameter measurements were 62.0%, 50.1%, 47.2%, and 49.1% at the surface, 1/8t, 1/4t, and 1/2t positions, respectively, while the area-based CV values were 134.9%, 109.6%, 106.5%, and 109.5% at these corresponding locations. The significantly higher CV values at the surface layer revealed substantially greater grain size heterogeneity compared to the inner regions. The fraction of bainite gradually decreases from the surface to the 1/2t position, whereas the fraction of ferrite shows an increasing trend.
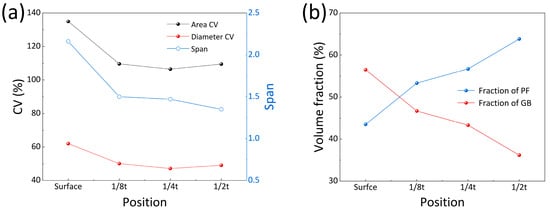
Figure 8.
The (a) CV and span values and (b) PF and GB fraction of the experimental steel at different thicknesses.
Figure 9a–f show the low-magnification and high-magnification tensile fracture morphologies of the experimental steel at the surface and 1/4t positions. The fracture regions in Figure 9a,d are labeled A, B, C, and D. Their corresponding higher-magnification views are presented in Figure 9b,c and Figure 9e,f, respectively.
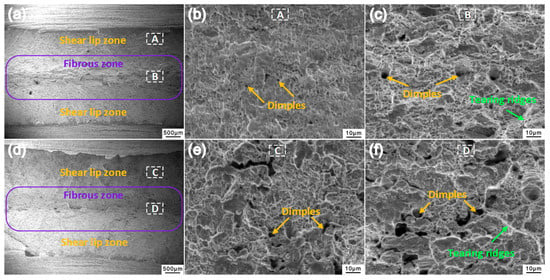
Figure 9.
The tensile fracture morphology of the experimental steel at different thicknesses: (a–c) surface and (d–f) 1/4t.
Low-magnification analysis (Figure 9a,d) revealed that all of the tensile fracture surfaces exhibited fibrous zones and shear lips without observable radial markings, consistent with classical ductile fracture morphology patterns [15].
Figure 9b displays the shear lip morphology on the surface fracture. High-magnification imaging revealed that this region displayed parabolic dimple configurations. This indicates that fractures ultimately occur under shear stress, with the major axis of the dimples aligning with the principal shear stress direction [16]. The shear lip dimples show markedly shallower depths than the fibrous zone dimples. These shallow dimple characteristics suggest that microvoid growth was constrained under multiaxial stress states during plastic deformation, resulting in insufficient void expansion and limited local plastic deformation capacity [17].
Figure 9c presents the microscopic morphology of the fibrous zone in the surface-layer fracture. High-density hierarchical dimple structures were observed in this region, where the primary dimples were surrounded by secondary microvoids, with clearly visible continuous tear ridges along the dimple boundaries. The dimple edges exhibited consistent orientation perpendicular to the fracture plane, demonstrating notable spatial alignment uniformity. This morphological feature represents characteristic equiaxed dimple morphology. The predominant equiaxed dimple distribution indicates fracture control by a uniaxial tensile stress field, which maintained dimple orientation stability [16].
Figure 9e,f show the distinct morphologies of the shear lip and fibrous zone at the 1/4t position, respectively. The fibrous zone contained numerous deep equiaxed dimples with tear ridges. Compared to the surface region, the 1/4t shear lip exhibited an increased density of large equiaxed dimples and a decreased proportion of small inclined dimples, indicating more developed dimple formation and enhanced plastic deformation resistance [18].
The differences in fracture morphology are closely related to the microstructural evolution at different thickness positions. As the average grain size decreases, the increased grain boundary density hinders the rapid propagation of microcracks [19], leading to a higher number of nucleation sites and a denser distribution of dimples, along with a significant reduction in their average size. In contrast, larger grains facilitate the movement and sliding of dislocations at grain boundaries, which promotes the formation of larger dimples with higher energy absorption capacity during coordinated deformation. Additionally, the significantly higher ferrite content at 1/4t—acting as a soft phase—undergoes extensive plastic deformation during fracture, resulting in the formation of large and deep dimples [6].
Figure 10 shows the EBSD crystallographic characterization results at different thicknesses, including the inverse pole figure (IPF) colored maps, the kernel average misorientation (KAM) maps, the geometrically necessary dislocations (GND) maps, and the band contrast (BC) maps with grain boundary misorientation data and statistical distributions of grain boundary misorientation angles.
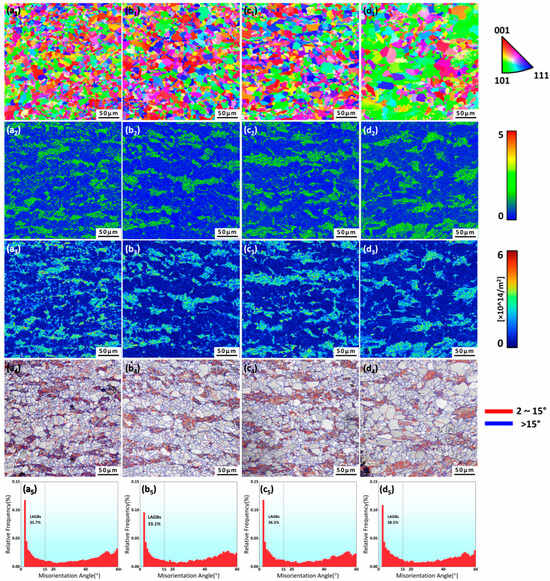
Figure 10.
The EBSD inverse pole figure maps (a1–d1), kernel average misorientation maps (a2–d2), geometrically necessary dislocation density maps (a3–d3), band contrast with grain boundary misorientation distributions (a4–d4), and misorientation angle distributions (a5–d5) of the experimental steel at different thicknesses: (a1–a5) surface, (b1–b5) 1/8t, (c1–c5) 1/4t, and (d1–d5) 1/2t.
The IPF maps (Figure 10(a1–d1)) indicate that the PF grains predominantly exhibited equiaxed morphology with limited internal orientation variation and clearly defined boundaries. In contrast, the GB grains consistently showed multiple crystallographic orientations, implying internal subdivision into smaller domains containing numerous substructures. The IPF maps reveal a distinct grain coarsening progression from the surface to 1/2t.
The KAM values calculated from the orientation differences between the adjacent scanning points in the EBSD analysis provide quantitative characterization of both the local strain distribution and accumulated plastic deformation severity at different thickness positions. Plastic deformation induces dislocation multiplication and entanglement, leading to intensified lattice distortion that increases orientation gradients between neighboring measurement points, thereby raising KAM values [20]. As shown in Figure 10(a2–d2), the regions with low KAM values in blue correspond to low-strain zones characterized by minimal plastic deformation, reduced dislocation density, and relatively intact lattice structures. Conversely, the high KAM value regions in green represent high-strain areas exhibiting substantial plastic deformation, elevated dislocation density, and pronounced lattice distortion. It is well known that ferrite typically exhibits significantly lower dislocation density than bainite. Consequently, low KAM value regions predominantly correspond to ferrite, while high KAM value zones primarily represent bainitic. Geometrically necessary dislocation (GND) density analysis provides further confirmation of this distribution pattern. As shown in Figure 10(a3–d3), the bainite phase exhibited GND densities of approximately two to three orders of magnitude higher than those in the ferrite grains. The GND mapping analysis revealed pronounced dislocation accumulation within bainitic microstructures, while the ferrite grains exhibited only moderately elevated GND density, which were localized near grain boundaries with substantially lower density than in their interior regions. Concurrently, the surface layer displayed a dispersed GND distribution pattern, whereas the core region showed distinct GND clustering.
Figure 10(a4–d4) present composite maps combining the grain boundary misorientation data with the band contrast (BC) information. The high-brightness regions with increased BC values in the BC maps correspond to the ferrite grains that exhibited superior crystalline integrity, whereas the low-brightness areas with decreased BC values represent bainitic structures that contained higher defect densities and inferior Kikuchi band diffraction quality [21]. The red and blue lines in the grain boundary misorientation maps designate low-angle grain boundaries (LAGBs, with GB misorientations lower than 15°) and high-angle grain boundaries (HAGBs, with GB misorientations higher than 15°), respectively. The boundary analysis confirmed that the LAGBs were primarily concentrated in the bainitic phases, exhibiting a distribution pattern that aligned with the substructural characteristics observed in the IPF mapping. These sub-boundaries, mainly formed by dislocation rearrangement, generally displayed misorientation angles below 15°. Conversely, the HAGBs were predominantly located at intergranular regions, indicating significant crystallographic orientation differences between neighboring grains.
The statistical distributions of grain boundary misorientation angles (Figure 10(a5–d5)) indicates that the proportion of LAGBs at the surface, 1/8t, 1/4t, and 1/2t positions were 35.7%, 33.1%, 36.5%, and 38.5%, respectively. The volume fraction of the LAGBs remained relatively stable throughout the thickness direction without significant gradient evolution.
Figure 11 presents the TEM micrographs of the experimental steel at different thicknesses. The precipitation behavior of the second-phase particles (SPPs) and the distribution patterns of dislocations were analyzed through a TEM characterization combining selected-area electron diffraction (SAED) and energy-dispersive X-ray spectroscopy (EDS). Comparative analysis of Figure 6(a1–c1) revealed a pronounced refinement of the precipitate size in the surface layer relative to the core region, with measured particle size distributions increasing from 70 to 200 nm to 200–700 nm. The SPPs displayed a dispersed distribution pattern at different thicknesses. These particles were predominantly concentrated within the bainitic grains and along the ferrite bainite phase boundaries (Figure 11(a2)), but they also showed significantly reduced density inside the ferrite grains (Figure 11(b2)). Based on previous analytical results, the surface layer exhibited substantially higher bainite content than the core region, resulting in elevated SPP distribution densities. SAED analysis identified the secondary precipitates as predominantly Fe3C cementite and (Nb, Ti) (C, N) carbonitrides (Figure 11(a3,b3)). Energy-dispersive X-ray spectroscopy (EDS) analysis verified the coexistence of both precipitate types. The rectangular (Nb, Ti) (C, N) carbonitrides in Figure 11d display increased Ti and Nb concentrations, while the spherical/elliptical Fe3C cementite particles in Figure 11e exhibit characteristically high Fe and C content.
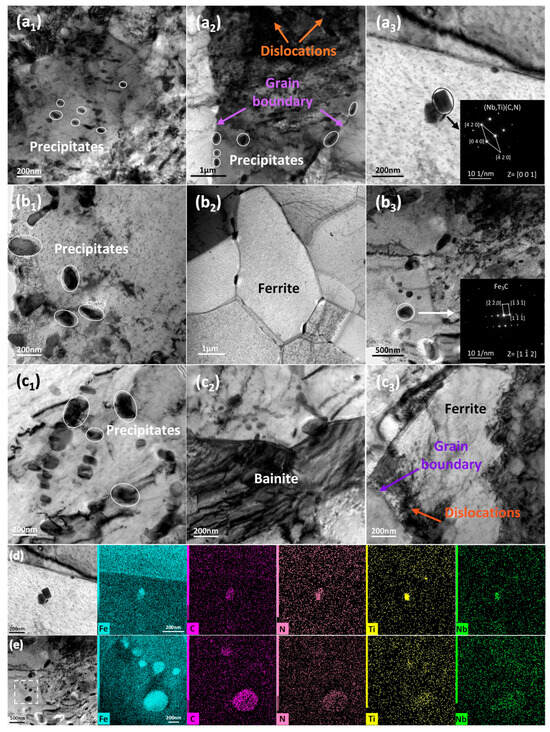
Figure 11.
TEM micrographs and EDS analysis of the experimental steel at different thicknesses: (a1–a3) morphological image at surface, (b1–b3) morphological image at 1/4t, (c1–c3) morphological image at 1/8t, (d) EDS element map corresponding to a3, and (e) EDS element map corresponding to (b3).
The dislocation structure analysis (Figure 11(c2,c3)) demonstrated dense dislocation entanglement networks within the bainitic matrices, while the ferritic grains displayed substantially reduced dislocation densities, with localized accumulation predominantly at the grain boundary areas. This distribution pattern exhibited strong correlations with the GND maps derived from EBSD analysis.
Figure 12a shows the XRD spectra of the experimental steel at different thicknesses. The dislocation density at different thickness positions was determined using a modified Williamson Hall method [22,23,24] based on the full width at half maximum (FWHM) of the (110), (200), (211), and (220) diffraction peaks. Physical broadening and instrumental broadening were the two main parts of the peak widening. To isolate the physical broadening, the instrumental broadening was corrected prior to analysis. The FWHM of the standard silicon powder sample’s diffraction peaks was mapped as a function of the diffraction angle (2θ) to establish a continuous instrumental broadening curve. For each diffraction peak of the steel samples, the corresponding instrumental broadening value was determined from this curve, and the physical broadening (β) was extracted using the following relationship [25]:
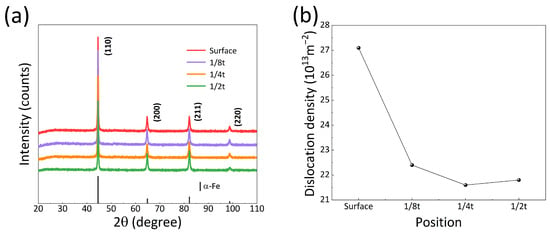
Figure 12.
The (a) XRD results and (b) dislocation density variation in the experimental steel at different thicknesses.
The calculation results are presented in Figure 12b, with the modified Williamson Hall equation shown in Equation (4) [22]:
where , . θ, β, and λ are the diffraction angle, the physical broadening and the wavelength of the X-ray used (0.154 nm for Cu), respectively; and D, ρ, and b represent the mean particle size, the dislocation density, and the Burger’s vector (0.248 nm for the <111>-type full dislocation in α-Fe), respectively. The parameter M represents a constant related to the effective outer cutoff radius of the dislocations, typically ranging between 1 and 2 [26,27], a value of 2 [28] was chosen for M. The parameter C denotes the average dislocation contrast factor for the specific diffraction planes, and it is expressed by Equation (5):
where h, k, and l are the Miller’s indices of each peak; Ch00 represents the mean contrast factor; and q denotes the dislocation characteristic parameter. Both Ch00 and q can be calculated using Equations (6) and (7), respectively.
The parameters in the equations were adopted from Ungár et al. [29], with calculated values of Ch00 = 0.2607 and q = 2.6744. The modified Williamson Hall equation was employed to perform linear fitting of the ΔK versus KC1/2 plots for various diffraction peaks, with the dislocation density subsequently calculated from the fitting slope m using Equation (8):
Figure 12b displays the calculated dislocation density values at different thicknesses. The values at the surface, 1/8t, 1/4t and 1/2t positions were 27.1 × 10¹³ m−2, 22.4 × 10¹³ m−2, 21.6 × 10¹³ m−2, and 21.8 × 10¹³ m−2, respectively. The surface exhibits significantly higher dislocation densities compared to the core region.
While this method proves effective for systems with multiple dislocations, its accuracy remains influenced by factors such as grain size, microstrain, and instrumental broadening. In this study, multi-peak fitting and linear regression were employed to mitigate systematic errors. The primary sources of residual error were the coupled effects of various factors on the diffraction peak broadening and the uncertainty in the fitting slope.
4. Discussion
4.1. Microscopic Mechanism of Yielding Behavior
The curves reveal a pronounced difference in the yielding behavior between the surface and core regions of the experimental steel. The surface tensile specimens exhibited continuous yielding, while the specimens from 1/8t to 1/2t displayed discontinuous yielding characteristics with distinct yield plateaus.
4.1.1. Microscopic Mechanism of Discontinuous Yielding in Core Regions
The discontinuous yielding behavior resulted from the combined effects of dislocation pinning [30,31] and dislocation multiplication [32,33]. The dislocation pinning effect arose from interactions between the dislocations and solute atoms, causing solute segregation within the dislocation strain fields, which formed a Cottrell [30] or Snoek atmosphere [31] and effectively reduced the strain energy of the dislocations. In the materials exhibiting discontinuous yielding, the mobile dislocations during initial deformation were strongly pinned by solute atoms, requiring application of external stress sufficient to overcome the critical unpinning stress to initiate large-scale dislocation glide and multiplication. This threshold stress corresponded to the upper yield point in the tensile curves. According to dislocation multiplication theories, the yield drop following the upper yield point and the subsequent yield plateau formation can be attributed to both the initial scarcity of mobile dislocations and their rapid multiplication during the early stages of plastic deformation. The relationship between dislocation density evolution and applied stress in materials can be described by the Johnston Gilman (JG) model [33], as expressed in Equation (9):
where , ρm, and b are the material’s strain rate, mobile dislocation density, and Burger’s vector, respectively; and v is the average dislocation glide velocity. Moreover, the relationship between v and the internal shear stress is quantitatively described by Equation (10):
where τ0 is the stress required for the dislocation to move at unit velocity, τ is the effective shear stress acting on the dislocation, and n is the stress sensitivity index.
As evidenced by Figure 12b, the core region of the thick plate exhibited relatively low initial dislocation density. When the external stress exceeded the critical unpinning threshold, locked dislocations were released and began to glide, significantly increasing the mobile dislocation density. According to Equations (9) and (10), the consequent reduction in the dislocation glide velocity led to decreased shear stress under the constant strain rate conditions, resulting in lower yield strength and the formation of a lower yield point.
Figure 13 shows a typical TEM micrograph of the partial ferrite grain at the 1/2t position. It was evident that a large number of dislocations intersected or were arranged parallel in the grain interior. In contrast to the inherently high dislocation density in the bainite, the dislocations within the ferrite primarily originated from the severe deformation rolling during TMCP. During rapid cooling following rolling, the dislocation structures in the austenite could not be sufficiently eliminated through static recovery nor did they undergo recrystallization. Instead, they retained high-density dislocations and deformation bands, enhancing ferrite nucleation while enabling the inheritance of partial dislocation substructures in the newly formed ferrite phase. After yielding, the mobile dislocation density varied little because the pre-stored mobile dislocations could be activated by tensile loading, leading to a minor change in the shear stress and, consequently, the formation of a yield plateau [12].
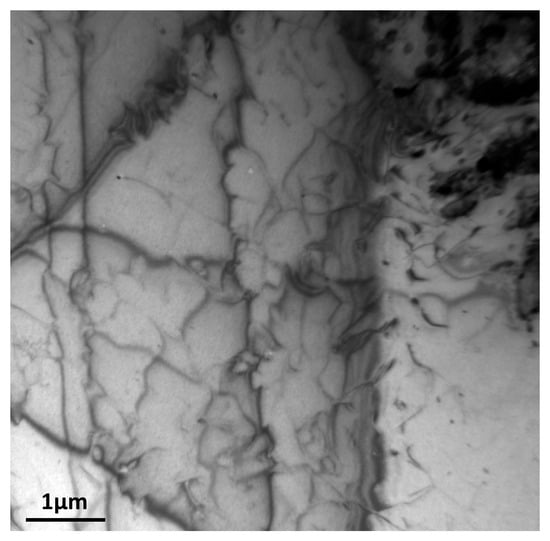
Figure 13.
TEM micrograph of a partial ferrite with high-density dislocations stored in grains at the 1/2t position.
4.1.2. Microscopic Mechanism of Continuous Yielding in Surface Layer
The 80 mm thick steel plate developed a significant rolling force gradient through the thickness during processing, resulting in enhanced plastic deformation at the surface and, consequently, the creation of a strain gradient distribution between the surface and core zones. The strain gradient significantly enhances mobile dislocation multiplication, leading to a strong positive correlation between the dislocation density and pre-strain level. X-ray diffraction (XRD) analysis provided further confirmation of this mechanism, revealing that the surface layer possessed significantly higher dislocation density than the interior regions, as shown in Figure 12b.
The surface region exhibited a higher initial mobile dislocation density due to its greater rolling-induced plastic deformation. The high dislocation density state significantly reduced the critical dislocation glide velocity v required to maintain the constant strain rate in the material. Even when the applied stress was below the conventional dislocation unpinning threshold (upper yield point), the existing glide velocity v remained sufficient to meet the plastic strain rate requirement. This mechanism enabled plastic deformation through the coordinated motion of multiple dislocations rather than relying on concentrated unpinning and the rapid gliding of limited dislocations. Consequently, it effectively bypassed the solute-pinning energy barrier and suppressed the yield drop. Previous studies [12] have observed analogous phenomena in Zn alloy systems, where elevated pre-strain levels lead to the disappearance of a yield drop. Moreover, the high-density dislocation network effectively disperses stress concentrations and promotes uniform deformation, thereby suppressing Lüders band formation upon reaching the elastic limit [34,35]. Consequently, high dislocation density modifies the yielding behavior through dual mechanisms—reducing unpinning dependence and enhancing deformation homogeneity, ultimately leading to macroscopic continuous yielding characteristics.
In previous studies on 60 mm thick plates [6], a significant decrease in dislocation density was observed within 1/4t to 1/8t region, and this was accompanied by a transition from continuous to discontinuous yielding in the engineering stress–strain curves. This phenomenon further confirmed the proposed mechanism. Furthermore, the relatively higher Nb and V contents in the investigated 80 mm thick plate suppressed yield point elongation at the surface by promoting deformation-induced carbide precipitation [36], thereby achieving continuous yielding.
Statistical analysis of the grain size distribution (Figure 8) demonstrated that the surface layer possessed a characteristically fine particle population, with significantly smaller average grain sizes compared to the core region. This grain refinement resulted in a markedly increased grain boundary (GB) density. The GB lengths obtained from EBSD mapping (Figure 10(a4–d4)) were statistically analyzed, and Equation (11) was used to convert the two-dimensional GB lengths into three-dimensional absolute GB area densities. Figure 14 shows the GB density variation from the surface to 1/2t, with the corresponding data provided in Table 3.
where SV is the absolute grain boundary density (m2/m3), and LA and A are the total length of GB and the analysis area in the EBSD map, respectively.
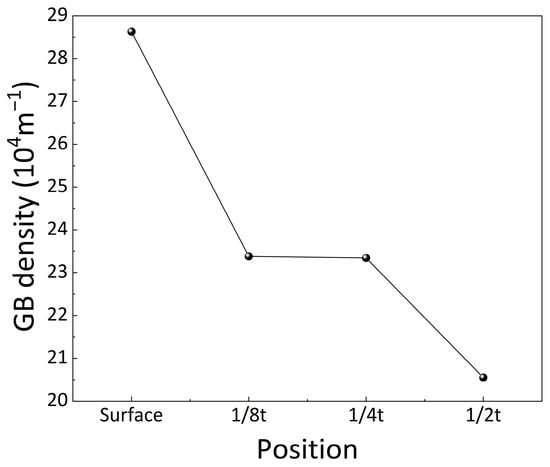
Figure 14.
The absolute grain boundary densities at different thicknesses.

Table 3.
Summary of the grain boundary parameters.
It can be found that the GB density in the surface was significantly higher than in the core region, exhibiting a maximum 39.4% reduction between the surface and 1/2t position. Acting as preferential sites for dislocation nucleation, the elevated grain boundary density facilitated dislocation unpinning across the wider regions, thereby substantially reducing localized slip band formation [37]. Furthermore, the grain boundaries effectively restricted both dislocation glide and Lüders band propagation, leading to responses that more closely resembled continuous yielding behavior.
Quantitative analysis (Figure 9a) revealed that the surface region exhibited higher span and coefficient of variation (CV) values in the grain size distributions, reflecting greater size dispersion and enhanced microstructural heterogeneity. Consistent with the Hall Petch relationship [38], the yield strength showed an inverse dependence on grain size, causing preferential plastic deformation initiation in the coarse-grained areas due to their lower yield strength. The pronounced grain size heterogeneity resulted in significantly different critical unpinning stresses for the dislocation sources across various grain sizes, thereby preventing synchronized dislocation unpinning. Macroscopically, this asynchronous unpinning promoted spatially homogeneous plastic deformation and effectively suppressed yield plateau formation. In summary, the synergistic interactions between the fine-grained characteristics and microstructural heterogeneity collectively govern the homogeneous plastic deformation behavior of the material.
4.2. Microstructure Evolution at Different Thickness Positions
The variation in the cooling rates at different thicknesses significantly influenced the phase transformation behavior of the steel. During the cooling process of the thick plates, the cooling rate exhibited exponential decay with increasing depth due to internal heat conduction mechanisms.
According to the Continuous Cooling Transformation (CCT) diagrams [39], the bainite formation required a faster cooling rate to bypass the diffusion-dependent ferrite and pearlite regimes. The high cooling rate at the surface provided the necessary undercooling to shift the transformation kinetics toward bainite—a displacive transformation that is less dependent on long-range diffusion. In contrast, the slower cooling at the 1/2t position allowed for sustained exposure in the ferrite transformation temperature window. Kinetically, this provides sufficient time for carbon rejection and the collective atomic rearrangements required for the reconstructive, diffusion-controlled formation of ferrite [40,41]. Consequently, the bainite volume fraction progressively decreased from the surface to the 1/2t position, whereas the ferrite content demonstrated an inverse increasing trend.
The precipitation behavior of the microalloying elements (Nb, Ti) was similarly controlled by the cooling rate through its influence on nucleation and growth. During austenitization, these elements were dissolved in the matrix. Upon cooling, the solution became supersaturated as the temperature dropped below the solubility product. Thermodynamically, this supersaturation provided the chemical driving force (ΔGv) for the nucleation of (Nb, Ti) (C, N) carbonitrides [42,43].
With increasing cooling rates, the undercooling degree of the austenite matrix (defined as the temperature difference between the actual temperature and equilibrium transformation temperature) increased significantly. This directly enhanced the driving force (as ΔGv ∝ ΔT, ΔT is undercooling degree). Kinetically, the enhanced driving force resulted in a drastic increase in the nucleation rate, leading to a high density of precipitate nuclei. Simultaneously, the lower transformation temperature and shorter process window severely restricted atomic diffusion, thereby suppressing the growth and coarsening of these nuclei. Consequently, the higher cooling rates at the surface layer produced a fine, high-density distribution to the precipitates, while the lower cooling rates at 1/2t resulted in coarser, low-density precipitation.
4.3. Strengthening Mechanism Analysis
The experimental results demonstrate that the surface layer exhibited significantly higher yield strength compared to the core region. Previous research [44] has indicated that the yield strength of HSLA steels can be attributed to multiple strengthening mechanisms, including grain refinement strengthening, dislocation strengthening, precipitation strengthening, solid solution strengthening, etc. The yield strength can be quantitatively calculated using the following equation [45]:
where σ0 is the lattice frictional resistance, σg is the grain refinement strengthening, σd is the dislocation strengthening, σp is the precipitation strengthening, and σs is the solid solution strengthening. For HSLA steels, σ0 typically ranges between 45 and 54 MPa [46,47], and the value of 54 MPa is normally adopted.
Grain refinement strengthening is a unique type of strengthening, increasing both the strength and toughness. Among various strengthening mechanisms, grain refinement strengthening plays the dominant role [6]. This grain size effect can be quantified by the Hall Petch equation [31], as expressed in Equation (13):
where ky and d are the material constant and the effective grain size, respectively. For HSLA steel, the value of ky is 17.4 MPa*mm1/2 [48,49]. With the effective grain size presented in Figure 8, the calculated σg values were 210.1 MPa, 194.3 MPa, 180.4 MPa, and 161.8 MPa for the experimental steel at the surface, 1/8t, 1/4t, and 1/2t positions, respectively.
The dislocation strengthening mechanism in steel materials primarily originates from the interactions between dislocations, which enhance material strength by impeding the dislocation glide motion [7]. The contribution of dislocation strengthening can be calculated using Equation (14) [50]:
where M, a, and μ are the Taylor factor (about 2.2 for ferrite [51]), the crystal structure-dependent constant (0.2 for ferrite), and the shear modulus (81,600 MPa for ferrite), respectively; and b and ρ are the Burger’s vector of 0.248 nm and the dislocation density, respectively. Based on the dislocation density values determined from the XRD data using the modified W-H method, the calculated σd values were 146.6 MPa, 133.3 MPa, 130.9 MPa and 131.5 MPa for the surface, 1/8t, 1/4t, and 1/2t positions, respectively.
The precipitation strengthening mechanism of the second-phase particles in the steel materials is predominantly governed by the Ashby Orowan mechanism, which can be expressed by Equation (15) [52]:
where f and D are the volume fraction and the average diameter of second-phase particles, respectively. Both of the parameters can be quantified through statistical analysis of TEM images. The calculated σp values were 58.9 MPa, 49.6 MPa, 46.3 MPa, and 44.2 MPa for the surface, 1/8t, 1/4t and 1/2t positions, respectively.
Solid solution strengthening originates from elastic interactions, with its effectiveness being dependent on the solute atom concentration. The contribution of solid solution strengthening can be quantified by the following expression [49]:
where [Xi] represents the mass fraction of element X in the solid solution of the matrix. For HSLA steels, it is assumed that Si, Cr, and Mn are completely dissolved in the matrix. The dissolved fractions of Nb, Ti, V, and C can be estimated using the following equations [53]:
where T is the temperature in K. Using these equations, the solid solution strengthening contribution is calculated as 103.5 MPa.
The contributions of various strengthening mechanisms to the yield strength at different thicknesses are shown in Figure 15, with the corresponding data presented in Table 4. The calculated results show a good overall agreement with the experimental values, demonstrating the validity of the strengthening mechanism analysis.
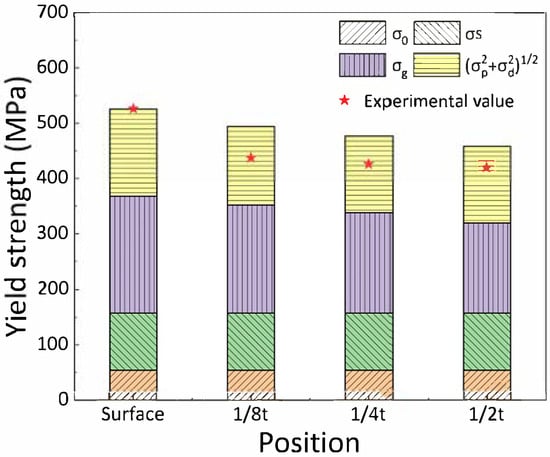
Figure 15.
Contribution of the individual strengthening mechanisms to the yield strength of the experimental steel at different thicknesses.

Table 4.
Contribution of the different strengthening mechanisms.
5. Conclusions
In this study, the mechanical behavior variations and corresponding microstructural mechanisms governing the continuous/discontinuous yielding phenomena at different thickness positions in the 80 mm thick 420 MPa grade HSLA steel plates processed by TMCP were systematically investigated. Quantitative correlations between the microstructural evolution and mechanical property gradients were established. The main conclusions are as follows.
- (1)
- The TMCP-processed thick steel plate exhibited continuous yielding at the surface layer, while the 1/8t–1/2t region displayed discontinuous yielding, whicn was characterized by a distinct yield drop and Lüders strain in the curve.
- (2)
- The average grain size progressively increased progressively from 6.86 μm at the surface to 11.57 μm at the 1/2t position. The surface layer contained ultrafine particles and showed greater heterogeneity in grain size distribution. Precipitates were identified as two types: Fe3C cementite and (Nb, Ti) (C, N) complex carbonitrides.
- (3)
- The continuous yielding at the surface was mainly due to its higher initial dislocation density (27.1 × 10¹³ m−2), which suppressed dislocation unpinning and promoted homogeneous deformation. In contrast, discontinuous yielding in the core region resulted from the dislocation pinning–unpinning under lower dislocation densities (~21.8 × 10¹³ m−2). Grain refinement and microstructural heterogeneity further stabilized the continuous yielding at the surface.
- (4)
- The thick steel plate displayed gradual decreases in both the yield strength and tensile strength from the surface to the 1/2t position, and most of the strength drop occurs between the surface and 1/8t. Grain refinement strengthening played a major role and varied significantly across thicknesses. Therefore, alloy design and processing should prioritize austenite grain conditioning during rolling and transformation control to obtain a fine, uniform microstructure throughout the thickness.
- (5)
- The cooling rate gradient strongly influenced the resultant microstructure. Improving property uniformity in thick plates requires precise cooling control. To alleviate discontinuous yielding and strength loss in the core, TMCP strategies should aim to increase the cooling rate or apply interrupted cooling for microstructural refinement.
Author Contributions
Methodology, M.Z.; validation, W.L. and H.S.; formal analysis, C.Q.; investigation, C.Q. and M.Z.; data curation, C.Q.; writing—original draft preparation, C.Q.; writing—review and editing, W.L. and H.S.; funding acquisition, W.L. All authors have read and agreed to the published version of the manuscript.
Funding
This research was funded by the Technology Research Plan of China National Railway Group Co., Ltd. (grant number N2024G044) and the National Natural Science Foundation of China (grant number No. 52308132).
Data Availability Statement
The original contributions presented in this study are included in the article. Further inquiries can be directed to the corresponding authors.
Conflicts of Interest
Author Mengqi Zhu is employed by the company China Construction Communications Engineering Group Co., Ltd. The authors declare that this study received funding from Technology Research Plan of China National Railway Group Co., Ltd. The funding sponsors had no role in the design of the study; in the collection, analyses, or interpretation of data; in the writing of the manuscript; or in the decision to publish the results.
References
- Qin, X.; Huang, X.; Li, Y.; Kaewunruen, S. Sustainable design framework for enhancing shear capacity in beams using recycled steel fiber-reinforced high-strength concrete. Construct. Build. Mater. 2024, 411, 134509. [Google Scholar] [CrossRef]
- Karmakar, A.; Biswas, S.; Mukherjee, S.; Chakrabarti, D.; Kumar, V. Effect of composition and thermo-mechanical processing schedule on the microstructure, precipitation and strengthening of Nb-microalloyed steel. Mater. Sci. Eng. A 2017, 690, 158–169. [Google Scholar] [CrossRef]
- Wang, J.; Sun, L.; Ma, H.; Cheng, X.; Li, X. Comparative study on mechanical and corrosion fatigue properties of high-strength bridge steels produced by TMCP and intercritical quenching & tempering process. Mater. Sci. Eng. A 2022, 853, 143771. [Google Scholar] [CrossRef]
- Sun, X.J.; Yuan, S.F.; Xie, Z.J.; Dong, L.L.; Shang, C.J.; Misra, R.D.K. Microstructure-property relationship in a high strength-high toughness combination ultra-heavy gauge offshore plate steel: The significance of multiphase microstructure. Mater. Sci. Eng. A 2017, 689, 212–219. [Google Scholar] [CrossRef]
- Kyada, T.; Shant, J.R.; Goyal, R.K.; Kathayat, T.S. Understanding the Delamination and Its Effect on Charpy Impact Energy in Thick Wall Linepipe Steel. J. Mater. Metall. Eng. 2014, 4, 31–39. [Google Scholar]
- Zhang, X.; Li, G.; Zhao, H.; Gao, J.; Wu, H.; Zhang, C.; Huang, Y.; Wu, G.; Wang, S.; Mao, X. Evolution of microstructure and mechanical properties along the thickness direction of 500 MPa HSLA steel heavy plates. Mater. Sci. Eng. A 2024, 913, 147097. [Google Scholar] [CrossRef]
- Cui, S.; Gu, G.; Shi, C.; Xiao, G.; Lu, Y. Variations in microstructure and mechanical properties along thickness direction in a heavy high strength low alloy steel plate. J. Mater. Res. Technol. 2023, 26, 9190–9202. [Google Scholar] [CrossRef]
- Li, Z.; Fu, L.; Fu, B.; Shan, A. Yield point elongation in fine-grained titanium. Mater. Lett. 2013, 96, 1–4. [Google Scholar] [CrossRef]
- Nakahigashi, J.; Takahata, K.; Tsuru, K.; Sumimoto, T.; Yoshimura, H.; Horimura, H. Ultra-fine grain refinement of titanium materials by hydrogen treatment. J. Jpn. Inst. Mater. 2006, 70, 204–211. [Google Scholar]
- Bayona-Carrillo, N.; Bozzolo, N.; Fundenberger, J.; Thomas, B.; Camelin, P.; Lenarduzzi, E.; Wagner, F. Effect of Recrystallization on Tensile Behavior, Texture, and Anisotropy of Ti-3Al-2.5V Cold Pilgered Tubes. Adv. Eng. Mater. 2011, 13, 383–387. [Google Scholar] [CrossRef]
- Tian, Y.Z.; Gao, S.; Zhao, L.J.; Lu, S.; Pippan, R.; Zhang, Z.F.; Tsuji, N. Remarkable transitions of yield behavior and Lüders deformation in pure Cu by changing grain sizes. Scr. Mater. 2018, 142, 88–91. [Google Scholar] [CrossRef]
- Shi, H.; Guo, X.; Li, J.; Mao, J.; Lu, W. The gradual disappearance of yield plateau in Zr–Sn–Nb–Fe–Mo alloy by the trace addition of Cr and V. Mater. Sci. Eng. A 2019, 760, 407–414. [Google Scholar] [CrossRef]
- Fan, Y.R.; Chen, R.; Yan, D.S.; Xue, X.Y.; Luo, T.; Li, J.S.; Lai, M.J. Discontinuous yielding behavior in the near-α Ti-3Al-2.5V alloy. Mater. Sci. Eng. A 2025, 923, 147701. [Google Scholar] [CrossRef]
- Zhang, Y.; Ding, H.; Zhu, H.; Zhou, X.; Zhang, Y.; Jia, N.; Zhang, N. Influence of microstructural morphology on the continuous/discontinuous yielding behavior in a medium manganese steel. Mater. Sci. Eng. A 2021, 824, 141746. [Google Scholar] [CrossRef]
- Shen, X.J.; Li, D.Z.; Tang, S.; Chen, J.; Fang, H.; Wang, G.D. Delamination toughening in a low carbon microalloyed steel plate rolled in the dual-phase region. Mater. Sci. Eng. A 2019, 766, 138342. [Google Scholar] [CrossRef]
- Zhang, C.; Zhou, X.; Chu, X.; Shi, Z.; Zhang, C.; Luo, J. Fractal of tensile fracture morphology of 5083 aluminum alloy sheet and its relationship with tensile properties. Eng. Fail. Anal. 2024, 165, 108819. [Google Scholar] [CrossRef]
- Qin, W.; Li, J.; Liu, Y.; Kang, J.; Zhu, L.; Shu, D.; Peng, P.; She, D.; Meng, D.; Li, Y. Effects of grain size on tensile property and fracture morphology of 316L stainless steel. Mater. Lett. 2019, 254, 116–119. [Google Scholar] [CrossRef]
- Xiong, L.; You, Z.S.; Qu, S.D.; Lu, L. Fracture behavior of heterogeneous nanostructured 316L austenitic stainless steel with nanotwin bundles. Acta Mater. 2018, 150, 130–138. [Google Scholar] [CrossRef]
- Peng, S.Y.; Tian, Y.Z.; Ni, Z.Y.; Lu, S.; Li, S. Effect of grain size on the deformation mechanism and fracture behavior of a non-equiatomic CoCrNi alloy with low stacking fault energy. Int. J. Plast. 2024, 182, 104129. [Google Scholar] [CrossRef]
- Xiao, J.; Yan, L.; Zhang, P.; Li, G.; BLi Zhao, T.; Wang, H.; Chen, L.; Wang, D. Effects of minor Ce doping on the microstructure and mechanical performances of a EH47 grade HSLA steel for ship and ocean engineering. Mater. Char. 2023, 201, 112931. [Google Scholar] [CrossRef]
- He, S.H.; He, B.B.; Zhu, K.Y.; Huang, M.X. Evolution of dislocation density in bainitic steel: Modeling and experiments. Acta Mater. 2018, 149, 46–56. [Google Scholar] [CrossRef]
- Kishor, R.; Sahu, L.; Dutta, K.; Mondal, A. Assessment of dislocation density in asymmetrically cyclic loaded non-conventional stainless steel using X-ray diffraction profile analysis. Mater. Sci. Eng. A 2014, 598, 299–303. [Google Scholar] [CrossRef]
- Ungár, T.; Ott, S.; Sanders, P.; Borbély, A.; Weertman, J. Weertman, Dislocations, grain size and planar faults in nanostructured copper determined by high resolution X-ray diffraction and a new procedure of peak profile analysis. Acta Mater. 1998, 46, 3693–3699. [Google Scholar] [CrossRef]
- Shintani, T.; Murata, Y. Evaluation of the dislocation density and dislocation character in cold rolled Type 304 steel determined by profile analysis of X-ray diffraction. Acta Mater. 2011, 59, 4314–4322. [Google Scholar] [CrossRef]
- Jannat, M.R.; Biswas, B.; Rahman, L.; Ahmed, F.; Hossain, J.; Khanam, J.; Sharmin, N. Validity of crystallite size determination methods based on XRD peak broadening in pure and metal-doped nickel ferrites. Results Mater. 2025, 28, 100762. [Google Scholar] [CrossRef]
- Ribárik, G.; Ungár, T. Characterization of the microstructure in random and textured polycrystals and single crystals by diffraction line profile analysis. Mater. Sci. Eng. A 2010, 528, 112–121. [Google Scholar] [CrossRef]
- Ungár, T. Dislocation densities, arrangements and character from X-ray diffraction experiments. Mater. Sci. Eng. A 2001, 309, 14–22. [Google Scholar] [CrossRef]
- Kan, L.; Ye, Q.; Wang, Z.; Zhao, T. Improvement of strength and toughness of 1 GPa Cu-bearing HSLA steel by direct quenching. Mater. Sci. Eng. A 2022, 855, 143875. [Google Scholar] [CrossRef]
- Ungár, T.; Dragomir, I.; Révész, Á.; Borbély, A. The contrast factors of dislocations in cubic crystals: The dislocation model of strain anisotropy in practice. J. Appl. Cryst. 1999, 32, 992–1002. [Google Scholar] [CrossRef]
- Cottrell, A.H.; Bilby, B.A. Dislocation Theory of Yielding and Strain Ageing of Iron. Proc. Phys. Soc. Lond. Sect. A 1949, 62, 49–62. [Google Scholar] [CrossRef]
- Schoeck, G.; Seeger, A. The flow stress of iron and its dependence on impurities. Acta Metall. 1959, 7, 469–477. [Google Scholar] [CrossRef]
- Hahn, G. A model for yielding with special reference to the yield-point phenomena of iron and related bcc metals. Acta Metall. 1962, 10, 727–738. [Google Scholar] [CrossRef]
- Johnston, W.G.; Gilman, J.J. Dislocation Velocities, Dislocation Densities, and Plastic Flow in Lithium Fluoride Crystals. J. Appl. Phys. 1959, 30, 129–144. [Google Scholar] [CrossRef]
- Shi, J.; Huang, C.; Deng, S.; Tan, Z.; Lu, H.; Hao, J.; Shen, F.; Jia, Y.; Chen, J.; Wang, Q.; et al. In-situ neutron diffraction study of the strengthening mechanism and deformation behavior of cellular structure in high-entropy alloys by additive manufacturing. Int. J. Plast. 2024, 181, 104081. [Google Scholar] [CrossRef]
- Yuzbekova, D.; Mogucheva, A.; Zhemchuzhnikova, D.; Lebedkina, T.; Lebyodkin, M.; Kaibyshev, R. Effect of microstructure on continuous propagation of the Portevin–Le Chatelier deformation bands. Int. J. Plast. 2017, 96, 210–226. [Google Scholar] [CrossRef]
- Singh, P.P.; Mula, S.; Ghosh, S. Grain refinement, strain hardening and fracture in thermomechanically processed ultra-strong microalloyed steel. Mater. Today Commun. 2024, 38, 107582. [Google Scholar] [CrossRef]
- Shi, X.; Cao, Z.; Fan, Z.; Guo, R.; Qiao, J. Probing into the yield plateau phenomenon in commercially pure titanium during tensile tests. Acta Metall. Sin. 2020, 34, 701–709. [Google Scholar] [CrossRef]
- Hall, E.O. Variation of Hardness of Metals with Grain Size. Nature 1954, 173, 948–949. [Google Scholar] [CrossRef]
- Xiong, W.; Song, R.; Huo, W.; Yu, P.; Qin, S.; Liu, Z. Microstructure characteristics and impact fracture mechanisms of Nb and V–Ti micro-alloyed offshore platform steels. Vacuum 2022, 195, 110709. [Google Scholar] [CrossRef]
- Shi, G.; Zhao, H.; Zhang, S.; Wang, Q.; Zhang, F. Microstructural characteristics and impact fracture behaviors of low-carbon vanadium-microalloyed steel with different nitrogen contents. Mater. Sci. Eng. A 2020, 769, 138501. [Google Scholar] [CrossRef]
- Lan, L.; Qiu, C.; Zhao, D.; Gao, X.; Du, L. Microstructural characteristics and toughness of the simulated coarse grained heat affected zone of high strength low carbon bainitic steel. Mater. Sci. Eng. A 2011, 529, 192–200. [Google Scholar] [CrossRef]
- Zhao, W.; Chen, M.; Chen, S.; Qu, J. Static strain aging behavior of an X100 pipeline steel. Mater. Sci. Eng. A 2012, 550, 418–422. [Google Scholar] [CrossRef]
- Jung, J.; Park, J.; Kim, J.; Lee, Y. Carbide precipitation kinetics in austenite of a Nb–Ti–V microalloyed steel. Mater. Sci. Eng. A 2011, 528, 5529–5535. [Google Scholar] [CrossRef]
- Gao, G.; Gao, B.; Gui, X.; Hu, J.; He, J.; Tan, Z.; Bai, B. Correlation between microstructure and yield strength of as-quenched and Q&P steels with different carbon content (0.06–0.42 wt%C). Mater. Sci. Eng. A 2019, 753, 1–10. [Google Scholar]
- Liu, G.; Li, Y.; Liao, T.; Wang, S.; Lv, B.; Guo, H.; Huang, Y.; Yong, Q.; Mao, X. Revealing the precipitation kinetics and strengthening mechanisms of a 450 MPa grade Nb-bearing HSLA steel. Mater. Sci. Eng. A 2023, 884, 145506. [Google Scholar] [CrossRef]
- Yen, H.-W.; Chen, P.-Y.; Huang, C.-Y.; Yang, J.-R. Interphase precipitation of nanometer-sized carbides in a titanium –molybdenum-bearing low-carbon steel. Acta Mater. 2011, 59, 6264–6274. [Google Scholar] [CrossRef]
- Singh, N.; Casillas, G.; Wexler, D.; Killmore, C.; Pereloma, E. Application of advanced experimental techniques to elucidate the strengthening mechanisms operating in microalloyed ferritic steels with interphase precipitation. Acta Mater. 2020, 201, 386–402. [Google Scholar] [CrossRef]
- Iza-Mendia, A.; Gutiérrez, I. Generalization of the existing relations between microstructure and yield stress from ferrite–pearlite to high strength steels. Mater. Sci. Eng. A 2013, 561, 40–51. [Google Scholar] [CrossRef]
- Funakawa, Y.; Shiozaki, T.; Tomita, K.; Yamamoto, T.; Maeda, E. Development of high strength hot-rolled sheet steel consisting of ferrite and nanometer-sized carbides. ISIJ Int. 2004, 44, 1945–1951. [Google Scholar] [CrossRef]
- Shen, Y.; Wang, C.; Sun, X. A micro-alloyed ferritic steel strengthened by nanoscale precipitates. Mater. Sci. Eng. A 2011, 528, 8150–8156. [Google Scholar] [CrossRef]
- Soto, R.; Saikaly, W.; Bano, X.; Issartel, C.; Rigaut, G.; Charai, A. Statistical and theoretical analysis of precipitates in dual-phase steels microalloyed with titanium and their effect on mechanical properties. Acta Mater. 1999, 47, 3475–3481. [Google Scholar] [CrossRef]
- Yong, Q.L. Secondary Phases in Steels; Press of Metallurgy Industry: Beijing, China, 2006; p. 47. (In Chinese) [Google Scholar]
- Taylor, K. Solubility products for titanium-, vanadium-, and niobium-carbide in ferrite. Scr. Metall. Mater. 1995, 32, 7–12. [Google Scholar] [CrossRef]
Disclaimer/Publisher’s Note: The statements, opinions and data contained in all publications are solely those of the individual author(s) and contributor(s) and not of MDPI and/or the editor(s). MDPI and/or the editor(s) disclaim responsibility for any injury to people or property resulting from any ideas, methods, instructions or products referred to in the content. |
© 2025 by the authors. Licensee MDPI, Basel, Switzerland. This article is an open access article distributed under the terms and conditions of the Creative Commons Attribution (CC BY) license (https://creativecommons.org/licenses/by/4.0/).