Article

New Model for Estimating the Volume of Martensite Transformed Using Acoustic Emission Measurements During an Induction Hardening Process †

by
Erlantz Sola Llanos
1,2,3,*,
Rafael Rodríguez
2,3,
Marcos Aguirre
1,
Carmelo Javier Luis-Pérez
2,3,* and
Mario Javier Cabello
1
1
Ikerlan Technology Research Centre, Basque Research and Technology Aliance (BRTA), Paseo J.M. Arizmendiarrieta 2, 20500 Arrasate-Mondragón, Guipúzcoa, Spain
2
Department of Engineering, Public University of Navarra (UPNA), Campus de Arrosadía s/n, 31006 Pamplona, Navarra, Spain
3
Institute for Advanced Materials and Mathematics (INAMAT2), Campus de Arrosadía s/n, 31006 Pamplona, Navarra, Spain
*
Authors to whom correspondence should be addressed.
This article is a revised and expanded version of a paper entitled “Study of the Martensitic Transformation of Steel During the Induction Hardening Process by means of Acoustic Emissions”, which was presented at 36th Conference of the European Working Group on Acoustic Emission (EWGAE2024), Potsdam, Germany, 18–20 September 2024.
Metals 2025, 15(11), 1228; https://doi.org/10.3390/met15111228
Submission received: 2 October 2025 / Revised: 30 October 2025 / Accepted: 3 November 2025 / Published: 7 November 2025
(This article belongs to the Special Issue Surface Treatments and Coating of Metallic Materials)

Abstract

The accurate detection and quantification of martensitic transformation in steel during quenching are essential for controlling the resulting material properties. Numerous studies have investigated this phenomenon using Acoustic Emission (AE) techniques, owing to the significant energy release associated with the transformation. However, no model based on acoustic emission currently exists that can estimate the martensite volume formed during induction hardening. In this work, a novel model is proposed to estimate the transformed martensite volume in induction hardening treatment, focused on the material, geometry, and AE settings used. By integrating acoustic emission data with conventional Vickers hardness measurements, the model parameters can be calibrated. Induction quenching experiments were carried out on cylindrical 42CrMo4 (AISI 4140) steel bars equipped with acoustic emission sensors to capture transformation-related events during heat treatment. The martensite volume after quenching was estimated from hardness values. Model calibration using the experimental acoustic emission data and martensite volume demonstrated strong agreement between predictions and experimental observations. The proposed model offers the potential for in-process monitoring of induction quenching, thereby reducing reliance on conventional characterization techniques.

Graphical Abstract

1. Introduction

The volume fraction of martensite in a component after heat treatment has a direct and significant impact on the component’s mechanical properties, which is why quantifying this volume is crucial. Properties such as hardness and tensile strength are directly related to the amount of martensite present. Higher hardness, in turn, results in greater wear resistance, a critical property in many industrial components [1].
Both experimental and predictive methods are available for quantifying martensite volume. These approaches are complementary and can be used together, providing cross-validation of the results.
Among the experimental methods employed are quantitative metallography, a fundamental visual and microscopic technique based on the analysis of micrograph images, where the martensite fraction, morphology, and distribution are assessed. X-Ray Diffraction (XRD) is a non-destructive method that exploits the differences between the crystalline structures of various microstructures [2]. Quenching dilatometry is another approach, relying on the measurement of volumetric changes in a specimen during the thermal cycles of heat treatment [3].
The prediction of martensite volume through estimation models has progressed from simple empirical formulations to advanced computational approaches. The first model was proposed by Koistinen and Marburger (K–M) in 1959 [4]. This model assumes that the volume of martensite formed depends solely on the degree of undercooling below M s . The K–M model is expressed as shown in Equation (1):
V m = 1 e α ( M s T )
However, several limitations of the K–M model have been reported in the literature. It has been shown to overestimate the fraction of retained austenite [5], and more accurate kinetic models have since been proposed.
To address the limitations of empirical models, thermodynamic models were developed, grounded in the principles of phase transformation thermodynamics. These models rely on the Gibbs free energy difference between austenite and martensite [6].
Recent advances in computational methods have enabled the development of more sophisticated approaches for simulating the complex behavior of materials. These include Finite Element Modeling (FEM) [7], as well as phase-field and machine learning models [8]. Such approaches are capable of integrating multiple domains—thermal, mechanical, and metallurgical—allowing for more accurate estimation of martensite volume after quenching.
Acoustic Emission is a Non-Destructive Testing (NDT) technique that enables real-time monitoring of dynamic processes and structural integrity in real time. Owing to its passive nature, the method “listens” to the elastic waves generated by the sudden release of energy within the material. These waves propagate through the medium and reach the surface, where they produce small, transient displacements that can be captured by sensors.
Studies have demonstrated that AE enables an almost “plate-by-plate” recording of the martensitic transformation. Each AE event has been associated with the formation of approximately 15 martensite plates [9]. The volume of martensite generated per AE event decreases as the overall martensite fraction increases, since the nucleation of new plates becomes progressively more difficult as the available austenite volume is reduced [9].
The literature indicates that martensitic transformation can be detected by Acoustic Emission (AE) due to the large amount of energy released. In 1972 [9] Speich & Fisher establish the origin of AE quantification, with a direct microstructural relationship (15 plaques per event) and demonstrating that AE can be used to study the kinetics of transformation. However, they do not focus on quantifying the final volume of martensite with AE data. In [10], the evolution of acoustic emission data during martensitic transformation is monitored in various steels, both in welding heating tests and in dilatometer experiments, analyzing the fraction of volume transformed into martensite. The AE response during martensitic transformation is evaluated in [11], where it is compared with magnetic emissions, showing agreement in both the data and the start and end transformation temperatures. Ref. [12] provides a dynamic quantitative theoretical framework for interpreting AE signals in martensite focusing on the “avalanche” phenomenon that characterizes the dissipation of elastic energy during martensitic transformation. Ref. [13] reports on the application of AE and Differential Scanning Calorimetry (DSC) in quenching and stress-induced martensite stabilization processes. Other articles analyzing martensitic transformation using AE in different technologies can also be found, such as [14], which analyzes the transformation in real time during a laser powder bed fusion process. Ref. [15] measures the AE signal during the nucleation and propagation of Lüders bands and thermal recovery, ref. [16] measures AE signals during loading and unloading cycles at different temperatures. Ref. [17], which studies the reversibility of martensitic transformation by recording AE signals during tensile and compression tests. The study [18] investigates 35CrMnSiA steel subjected to various heat treatments, demonstrating that acoustic emission signals generated during tensile deformation can be attributed to strain-induced martensitic transformation. Ref. [19] employ AE monitoring to estimate the volume of martensite formed during laser quenching, correlating AE activity with different laser power levels. Ref. [20] explore how specimen geometry affects AE characteristics during immersion quenching, establishing relationships between AE parameters, surface-area-to-volume ratio, and final hardness. Additionally, ref. [21] utilize AE to detect martensitic transformation during water quenching, confirming its potential as a non-destructive indicator of phase change.
Collectively, these studies demonstrate the potential of AE for detecting martensitic transformation in steel; however, none aim to quantify the martensite volume using a model based on AE data during induction hardening. This process generates new challenges, as it involves events that do not occur in other quenching processes, such as cooling the part using a shower instead of immersion in water. And the challenge of performing real-time measurement, being able to monitor each of the pieces during the tempering process itself. It has also been seen that there is a notable lack of information regarding AE in induction processes.
In this article, the application of AE for estimating the amount of material transformed into martensite during an induction quenching process is evaluated. Generating a model that focuses on the material, geometry, and AE settings used. If any of these elements are modified, the model can change. Detailed information is provided on the material selection, the quenching experiments conducted with AE monitoring, the metallographic characterization, data processing procedures, and the development of the final model for estimating martensite volume.

2. Martensite Volume Estimation Model Based on AE

2.1. Proposed Model
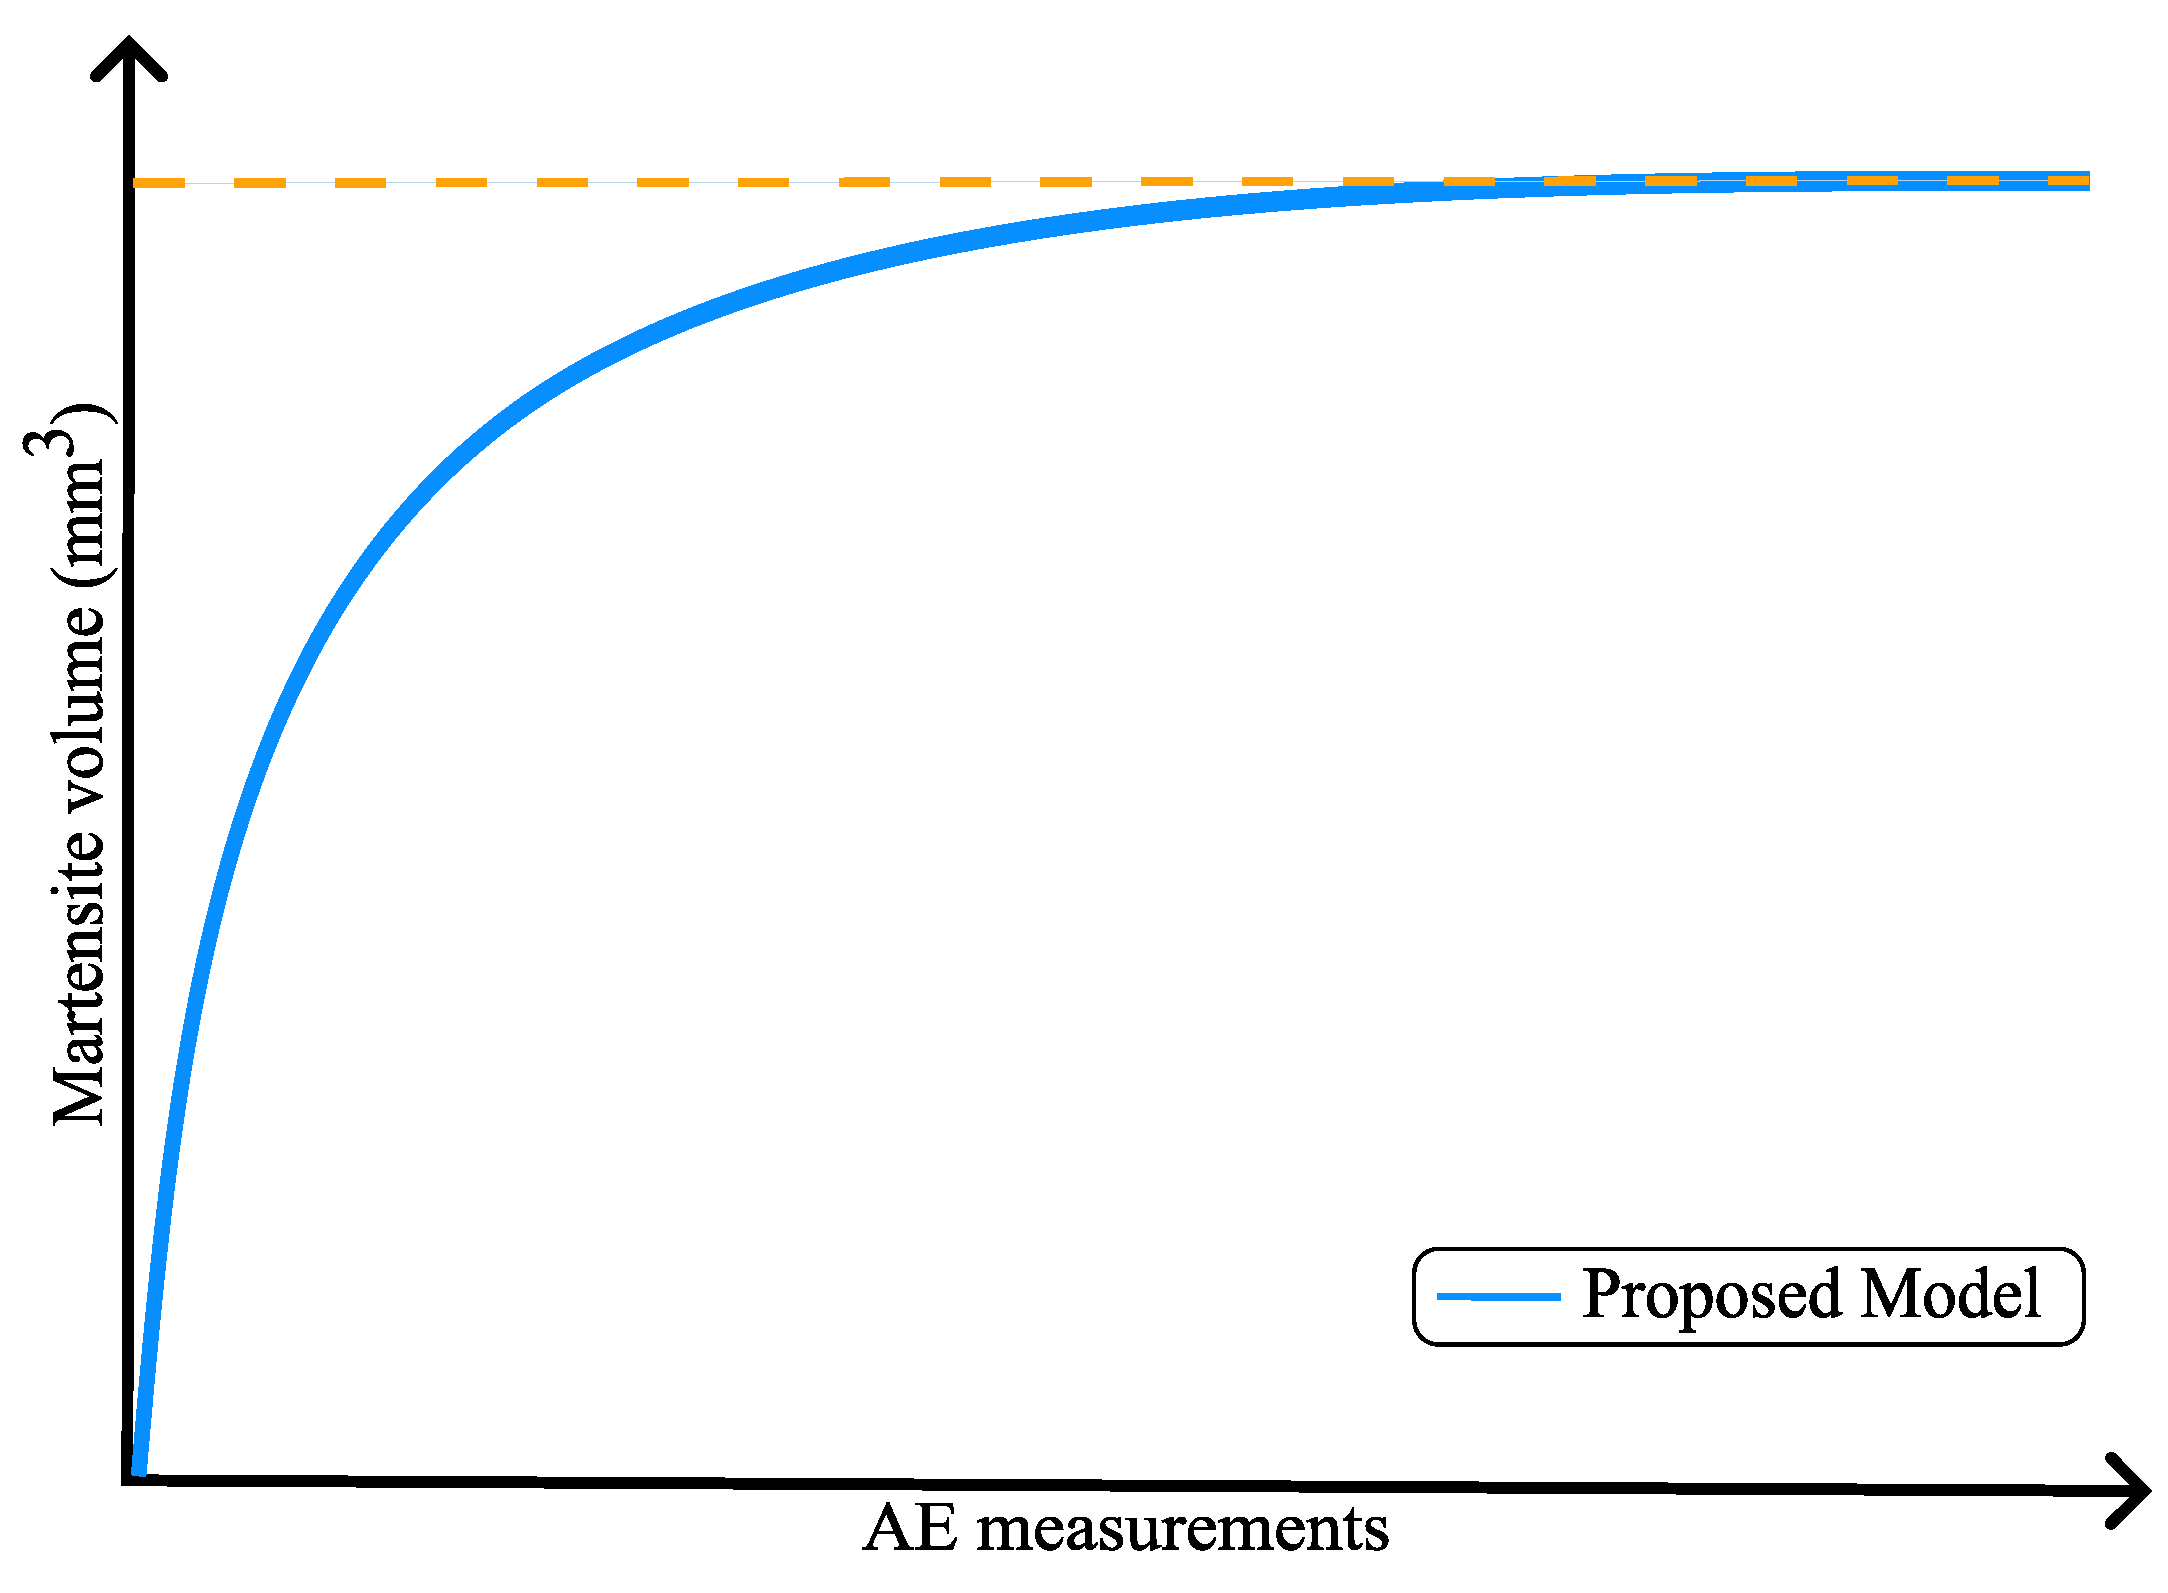
Given the material behavior during quenching and the ability to monitor the martensitic transformation of the microstructure through AE, a model has been proposed to estimate the transformed volume during the process. The proposed model is based on the behavior of the material being used with a simple geometry such as a cylindrical bar. The behavior in more complex geometries or materials to be heat treated will vary.
The model must satisfy the following characteristics: the curve should originate at the point (0, 0), as the absence of material transformation implies that no AE activity should be detected. The curve must also exhibit a horizontal asymptote, since the martensite volume will ultimately reach 100% of the quenchable fraction, depending on the hardenability of the material; once this limit is attained, no further AE signals associated with martensitic transformation are expected. The curve should display a steep initial slope, which gradually decreases as AE activity accumulates, until it approaches the horizontal asymptote.
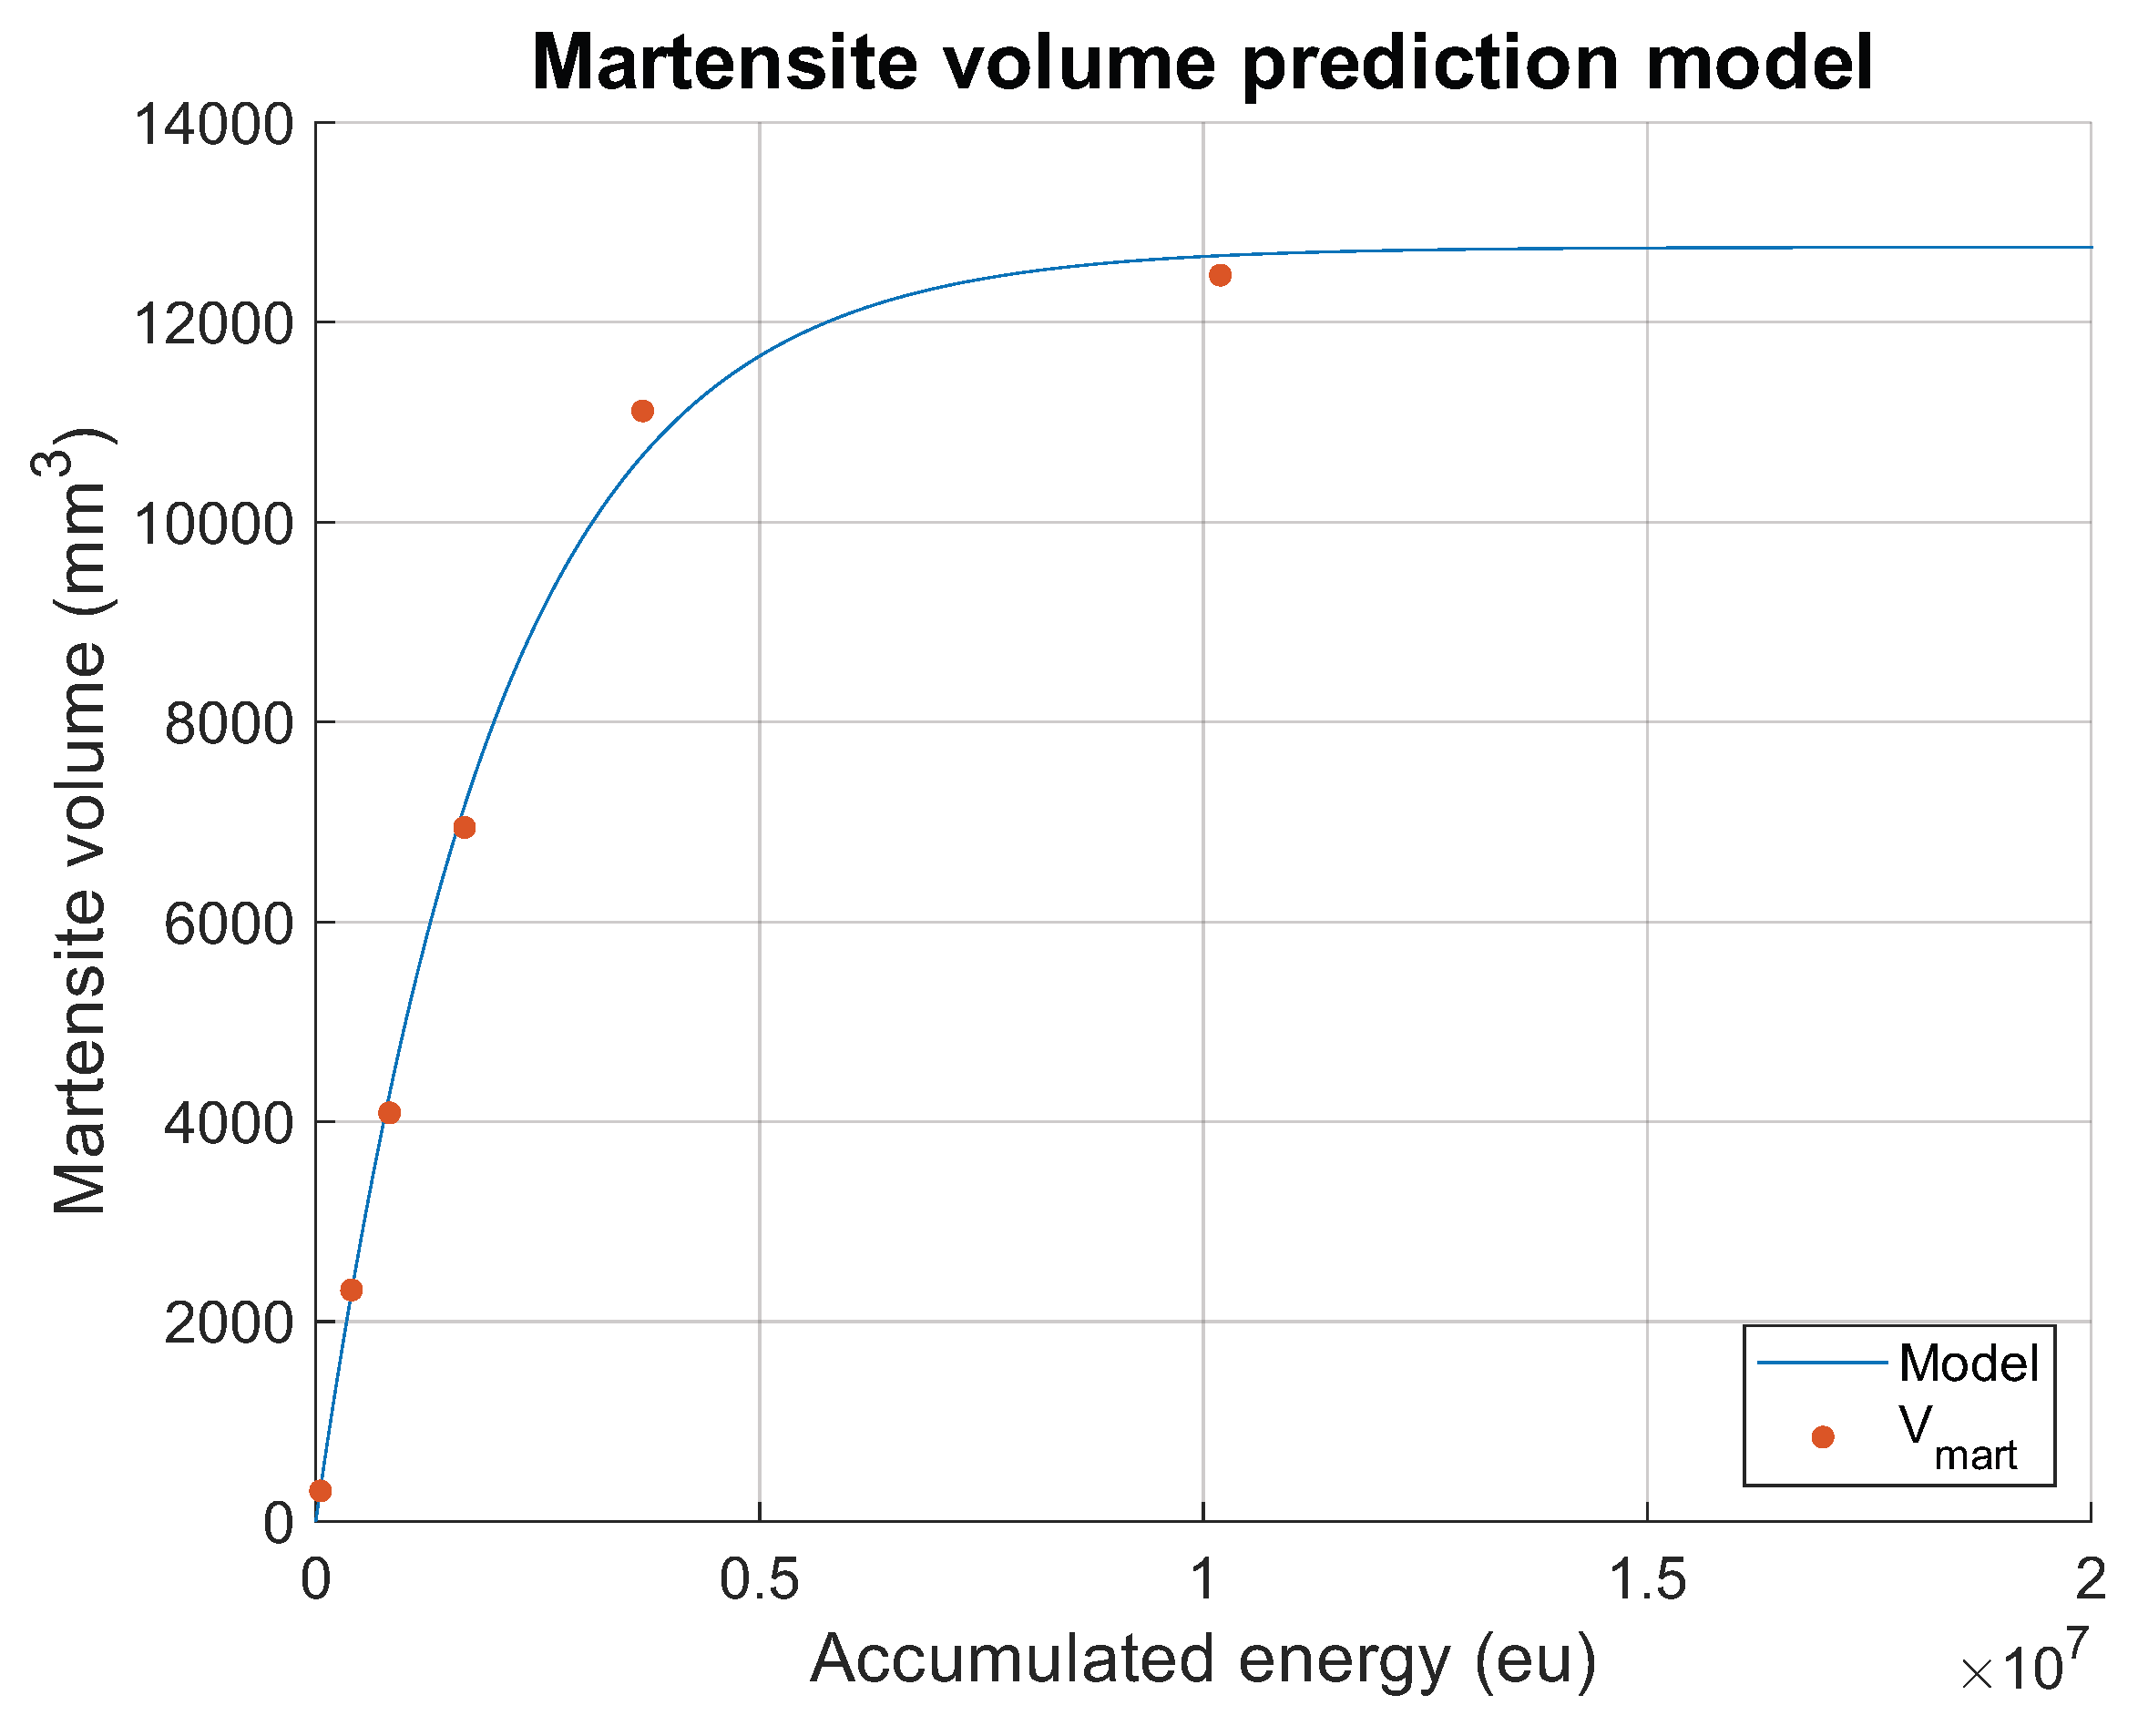
These characteristics would represent an exponential model. This is justified by the nature of the process and the formation of martensite. During the cooling of a quenching process, the first thing to cool is the surface of the piece, due to direct contact with the coolant. This results in the rapid formation of martensite and a corresponding surge in AE events. In the case of surface hardening or with a thin layer, all this martensite is generated quickly, but based on the information in [9], as the martensite content increases, the formation of additional martensite becomes progressively more difficult. This would gradually slow down the transformation, reducing the number of AE events and giving that exponential shape until all the material is hardened. In the case of quenches that reach the core, the surface undergoes the same situation, but the core cools later and at a slower rate. This causes later events, increasing the value of the horizontal asymptote and lengthening the elbow of the curve. The amount of quenched material grows more slowly due to the volume of the cylinder itself, depending on the diameter being quenched. Consequently, using this data to generate a model, hardened sections with a thinner hardened layer and lower martensite volume will be found in the area with the steepest slope, while hardened sections with a thicker hardened layer will be found at the bend in the model or in the horizontal area once 100 % of martensite has been obtained. The exponential model has been proposed (Figure 1), expressed in Equation (2), where the transformed volume is determined as a function of the AE measurements.
f ( x ) = L · 1 e k · x
L = value of the horizontal asymptote
k = growth constant
Figure 1. Proposed model for martensite volume estimation.
Metals 15 01228 g001

2.2. Materials and Methods

The experimental procedure was divided into two stages: first, induction quenching tests were conducted to acquire AE data, followed by the characterization of the treated regions of the specimens using Vickers hardness measurements.
The material selected for the experiments was 42CrMo4 steel (AISI 4140), a high-hardenability alloy. Cylindrical bars of this steel, 450 mm in length and 20 mm in diameter, were acquired. Their chemical composition, as provided by the manufacturer, is presented in Table 1. The bars were previously quenched and tempered at the factory to homogenize the microstructure and exhibit a baseline hardness of 340 HV.

2.2.1. Quenching Tests

Quenching tests were conducted to measure, via AE, the elastic waves released during the martensitic transformation, with the objective of obtaining varying volumes of quenched material to evaluate differences in AE responses. AE measures the elastic waves that reach the sensor, collecting and storing the individual waveform of each event and extracting characteristics from them. To this end, an experimental campaign was designed involving the quenching of 18 bars of 42CrMo4 steel.
To achieve different quenched layer thicknesses and, consequently, varying volumes of material transformed into martensite, the heating times of the specimens were adjusted. Heating was performed with a current of 450 A and a frequency of 14 kHz for all bars.
To establish the heating time for the quenching tests, a series of preliminary experiments were conducted to determine a reference value. Induction hardening was performed at 450 A and 14 kHz, varying the heating time between 8, 10, 12, and 14 s. All parts were cooled at a flow rate of 60 L/min for 30 s. After treatment, the pieces were cut and prepared for measurement with a hardness tester. The hardness tests showed that with 12 s of heating a transformed layer of approximately 3 mm was obtained. To produce both thinner and thicker layers, the heating times were varied from 9 to 17 s, in increments of 2 s. Three bars were quenched at each specified heating time, resulting in a total of 15 experiments.
Three additional tests were conducted outside the defined heating times: a 6 s heating test to evaluate the measurements for a specimen that remained essentially unquenched, an 8 s test corresponding to the onset of martensitic transformation, and a 30 s test to ensure full quenching through the core of the bar.
The sequence of the tests was randomized to ensure that no two consecutive quenching tests employed the same heating time. Following heating, the hot zone was cooled under identical conditions for all experiments: 30 s of cooling with a flow rate of 60 L/min. Table 2 presents the order in which the tests were conducted. Each treated bar was assigned a unique identifier, incremented sequentially according to the testing order.
The quenching of the bars was performed on an induction quenching bench developed at the Ikerlan laboratory. Heating was achieved using a spring-shaped coil through which current flows, generating the required magnetic field. The coil is 60 mm in height, 30 mm in diameter, and consists of six turns. The bars were secured using clamping jaws and allowed two types of movement: rotational and vertical. For cooling, the bench is equipped with four hoses that direct the coolant onto the heated specimen. The coolant, consisting of water and 8% IBERTEMP-I synthetic quenching fluid, is stored in a tank connected to a pump that delivers the mixture to the hoses. Figure 2 illustrates the quenching bench manufactured at Ikerlan, including the interior of the cabin.
To acquire AE data from the induction quenching tests, a three-component setup was assembled, consisting of a VS45-H passive piezoelectric sensor, an AEP5 preamplifier, and an AMSY-6 MB6 AE data acquisition system, capable of connecting up to 12 channels. The sensor was positioned at one end of the cylindrical specimen, as far as possible from the treatment zone, to avoid exposure to high temperatures. Coupling grease was applied to ensure proper contact between the sensor and the specimen. Adhesive tape was used to generate constant pressure on the sensor in the direction of the bar. This enhances the transmission of elastic waves generated within the material. Before performing the tests, the sensitivity of the sensor used was verified by means of a Hsu–Nilsen source test on the bars to be tempered. The sensor captures the elastic wave signals and transmits them through the preamplifier to the acquisition system, which performs initial filtering based on the AE parameters defined for the experiment and displays the processed events using the Vallen VisualAE R2022 software.
Exploiting the capability of the data acquisition system to connect multiple channels, four channels were configured to record information during quenching. All four channels were connected to the same sensor, receiving identical input signals, but each channel employed distinct parameters for the initial data filtering. Given the uncertainty regarding the optimal threshold for detecting martensitic transformation, this parameter was varied across the channels. The parameters used are summarized in Table 3.
After completing the tests and acquiring the AE data, these measurements must be analyzed. AE signals provide various information about the recorded waves, including released energy, maximum amplitude, duration, rise time, and more. It is essential to identify the most appropriate parameter to estimate the martensite volume formed during the cooling of the specimen.
AE is a highly sensitive technique, and the measurements obtained may include signals unrelated to microstructural transformation, such as the impact of the coolant on the steel bar, boiling of the coolant at high temperatures, or external environmental noise. These undesired events must be filtered out; for this purpose, a duration-based filter was implemented to remove the majority of irrelevant signals.

2.2.2. Metallographic Procedure

To estimate the martensite content after heat treatment using AE measurements, it is necessary to analyze the microstructure of the treated region through conventional destructive testing (DT). This approach allows for the estimation of the final martensite volume in the specimen and enables correlation with AE results. For this purpose, Vickers hardness measurements were performed. A total of six bars were tested, each corresponding to a different heating time: C21 (30 s), C38 (17 s), C28 (15 s), C32 (13 s), C29 (11 s), and C31 (9 s).
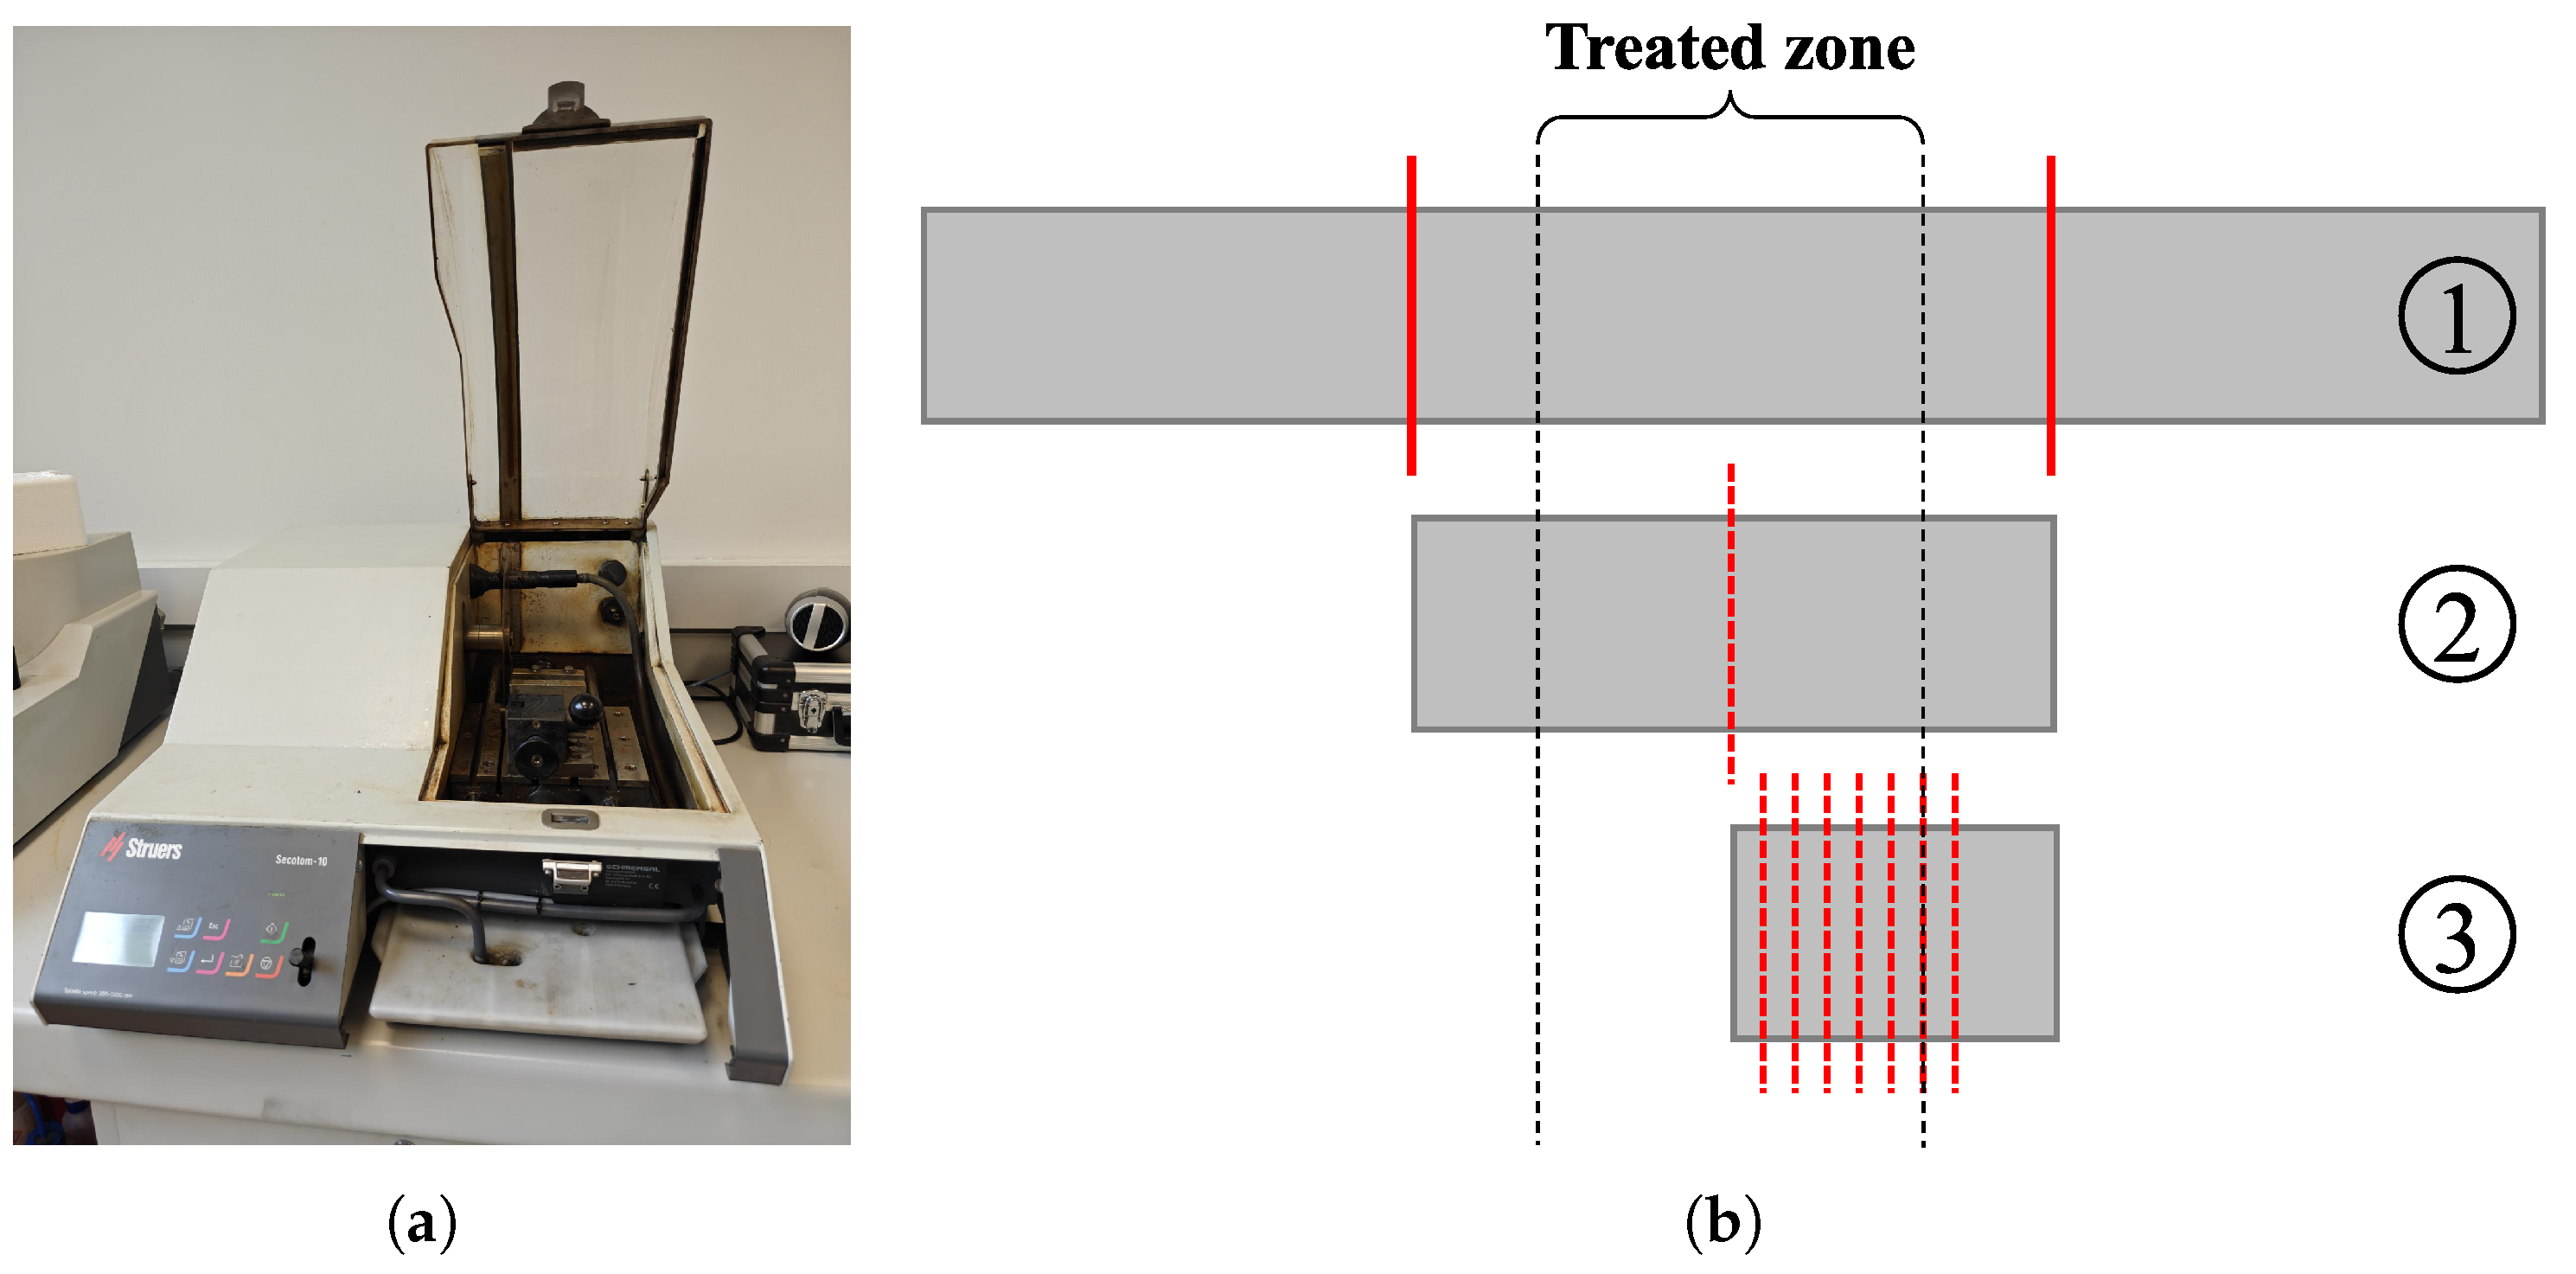
Prior to measuring specimen hardness, proper sample preparation was required. The preparation procedure comprised three steps: cutting, mounting, and grinding and polishing. Initially, using a conventional band saw, the specimens were reduced in size to fit within the precision cutter. Two cuts were made 65 mm from the center of the heat-treated zone (Figure 3(b1) solid red marks), yielding a 130 mm cross-section. This section was then halved using the Struers Secotom-10 precision cutter (Figure 3(b2) discontinuous red marks), producing two equal pieces. Finally, seven 5 mm-thick sections were cut from one of the halves with the Secotom-10 (Figure 3(b3) discontinuous red marks), providing seven surfaces for hardness measurement. The Struers Secotom-10 precision cutter and a diagram of the cuts performed are shown in Figure 3.
Once the seven samples from each bar were obtained, they were embedded in resin to facilitate polishing. For this purpose, 30 mm-diameter molds were used, corresponding to the openings in the polishing machine head. QATM KEM 35 resin, a two-component cold-curing material, was employed, prepared by mixing one part of the liquid component with 1.5 parts of the powder component. Each sample was placed in a mold, and resin was poured over it, allowing it to cure for 24 h prior to demolding.
Finally, the samples were polished to improve the surface finish for analysis. For this purpose, a Struers TegraPol-11 polishing machine (Struers, Ballerup, Denmark) was employed together with three grinding and polishing discs from the same manufacturer, MD-Piano 220, MD-Allegro and MD-DAC.
Vickers hardness tests were performed using a Sinowon MicroVicky VH1010 device (Sinowon, Dongguan, China). Twenty indentations were made at 0.5 mm intervals, with the first positioned 0.5 mm from the surface to avoid edge effects and the last located at the specimen center. Each indentation was produced with a load of 300 g applied for 14 s. Figure 4 shows the MicroVicky VH1010, along with a diagram of the prepared samples and the planned indentation positions for the Vickers hardness measurements.
After measuring the hardness of the seven samples obtained from each bar, the resulting data were analyzed. The hardness matrices derived from the measurements were plotted using MATLAB R2023b with the ‘contourf’ function, generating maps of the heat-affected zone and the corresponding hardness values at each point through a colormap. This function interpolates between the matrix data to estimate the hardness values at intermediate points.
Although only the upper half of the heat-treated zone was measured, the samples for analysis were cut from the midsection to the top. Symmetrical heating by the inductor was assumed, and consequently, the hardness distribution was considered symmetrical across both halves of the bar.
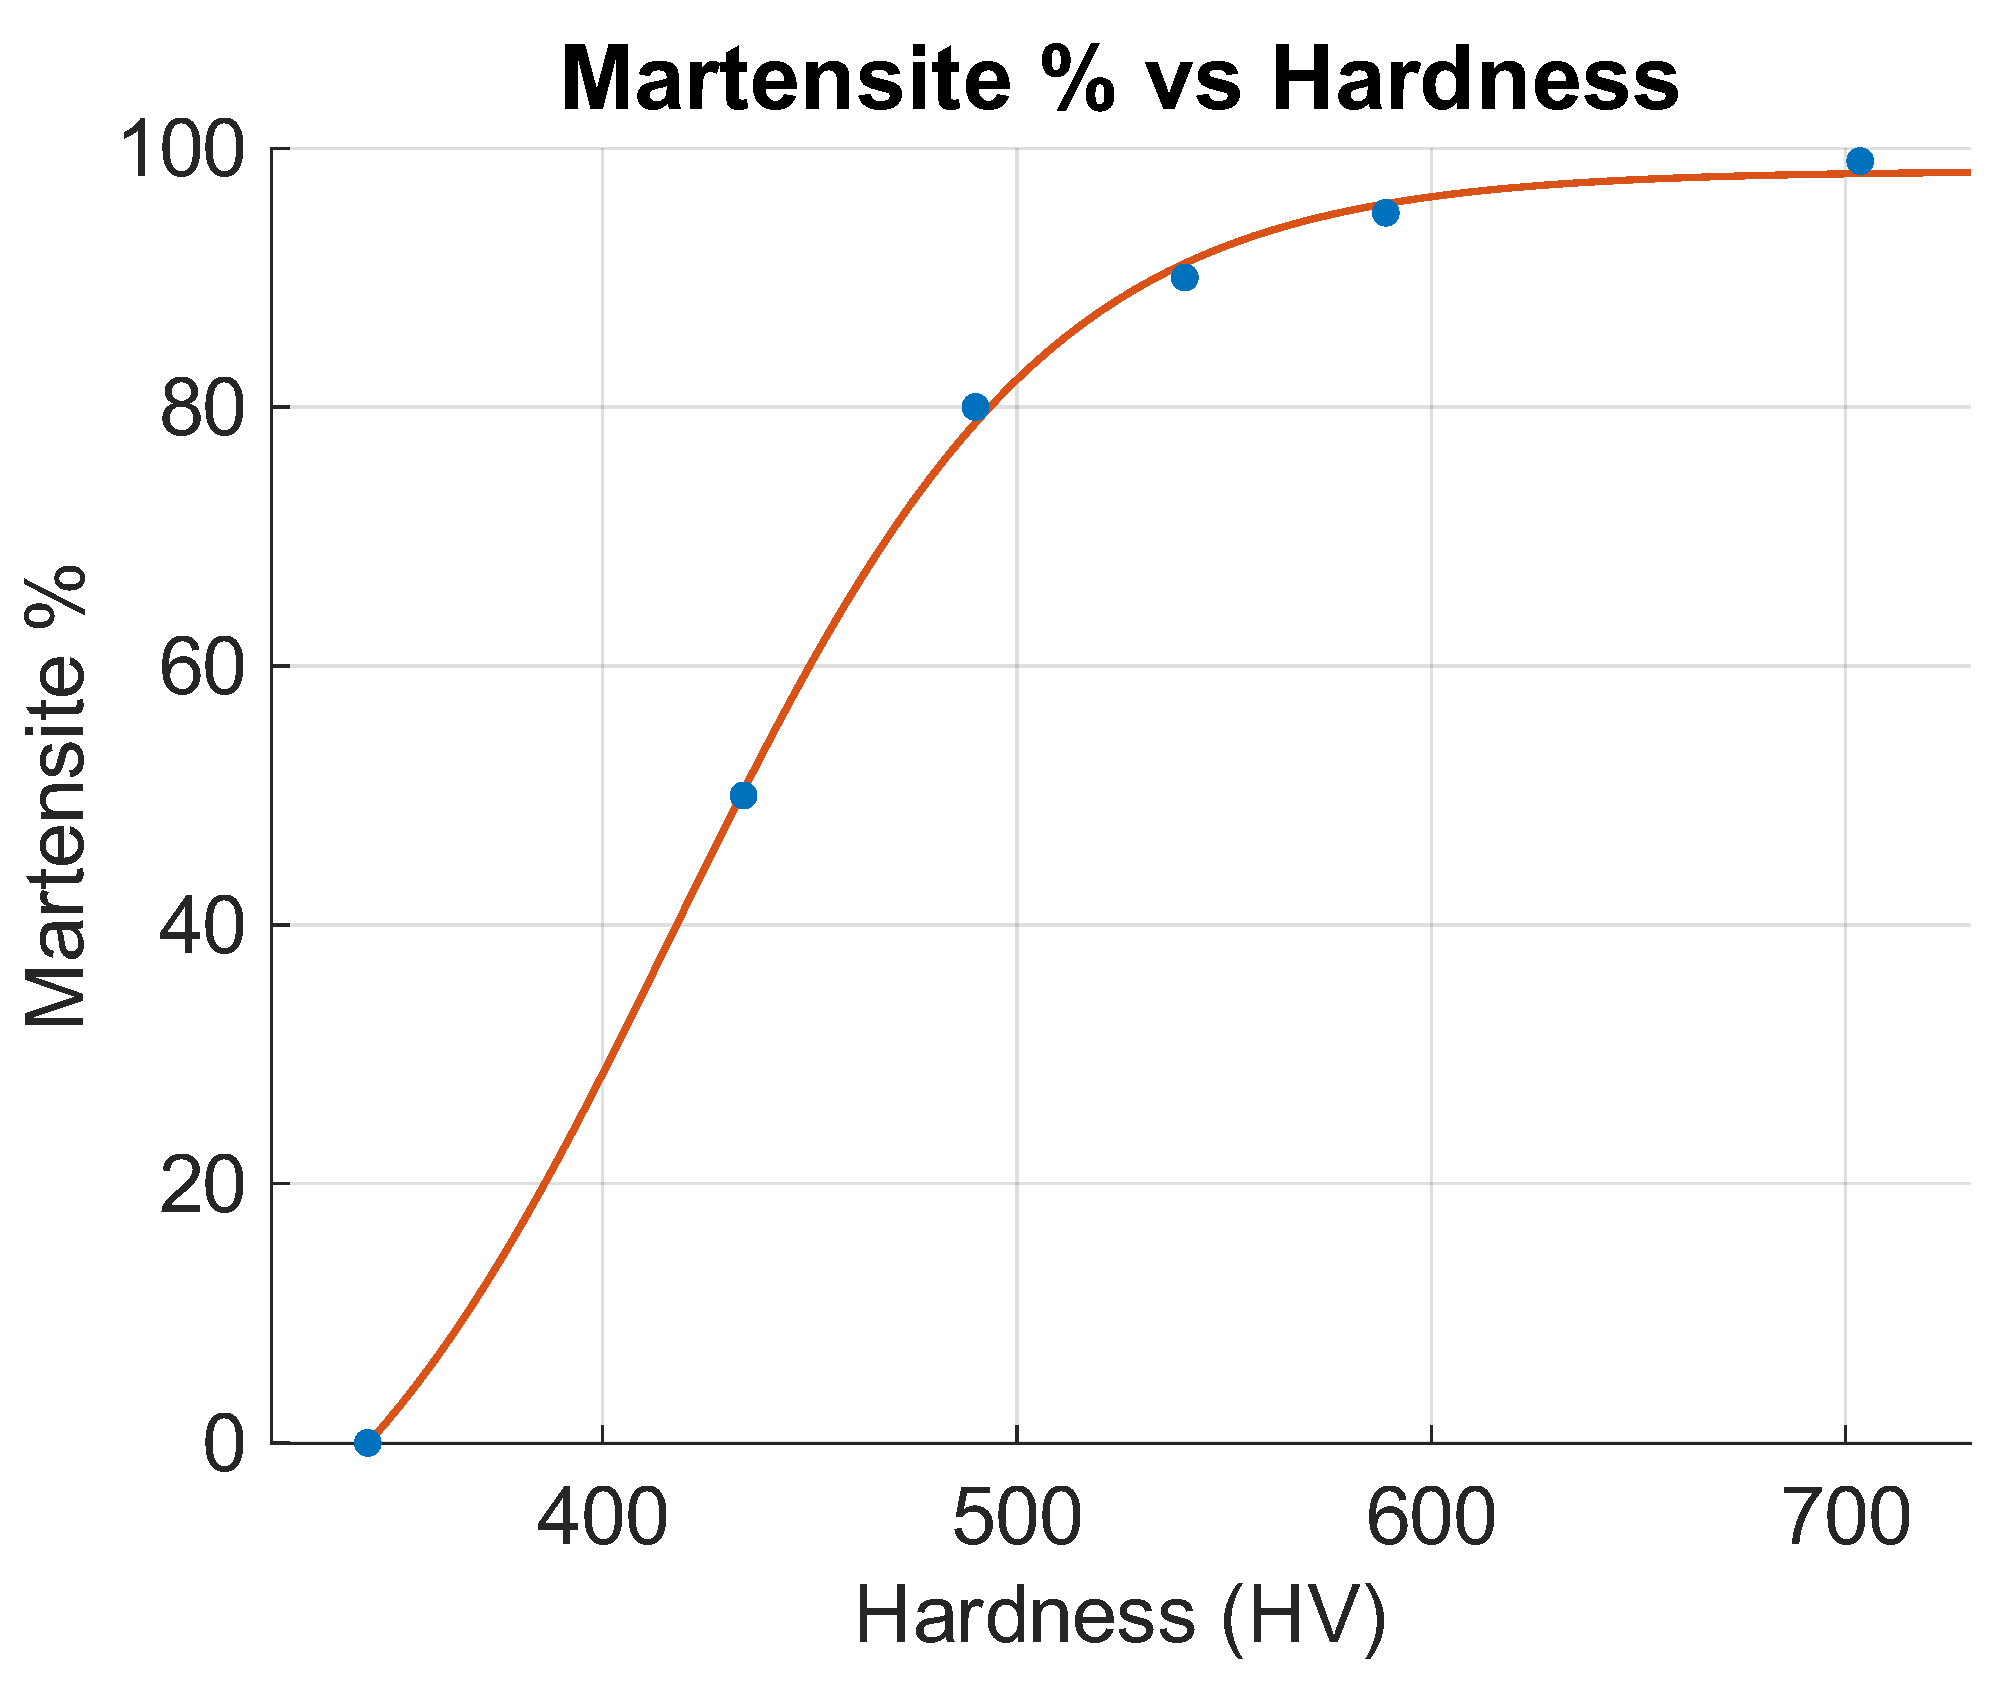
Based on the graph relating the carbon content of steel to hardness and martensite percentage of the book [22], a martensite percentage curve can be derived as a function of hardness (Equation (3)) for the case of a steel containing 0.41% carbon (Figure 5).
M % = 117.36 1 + e 0.0222 · ( H V 417.16 ) 19.13

2.3. Martensite Volume Estimation Model

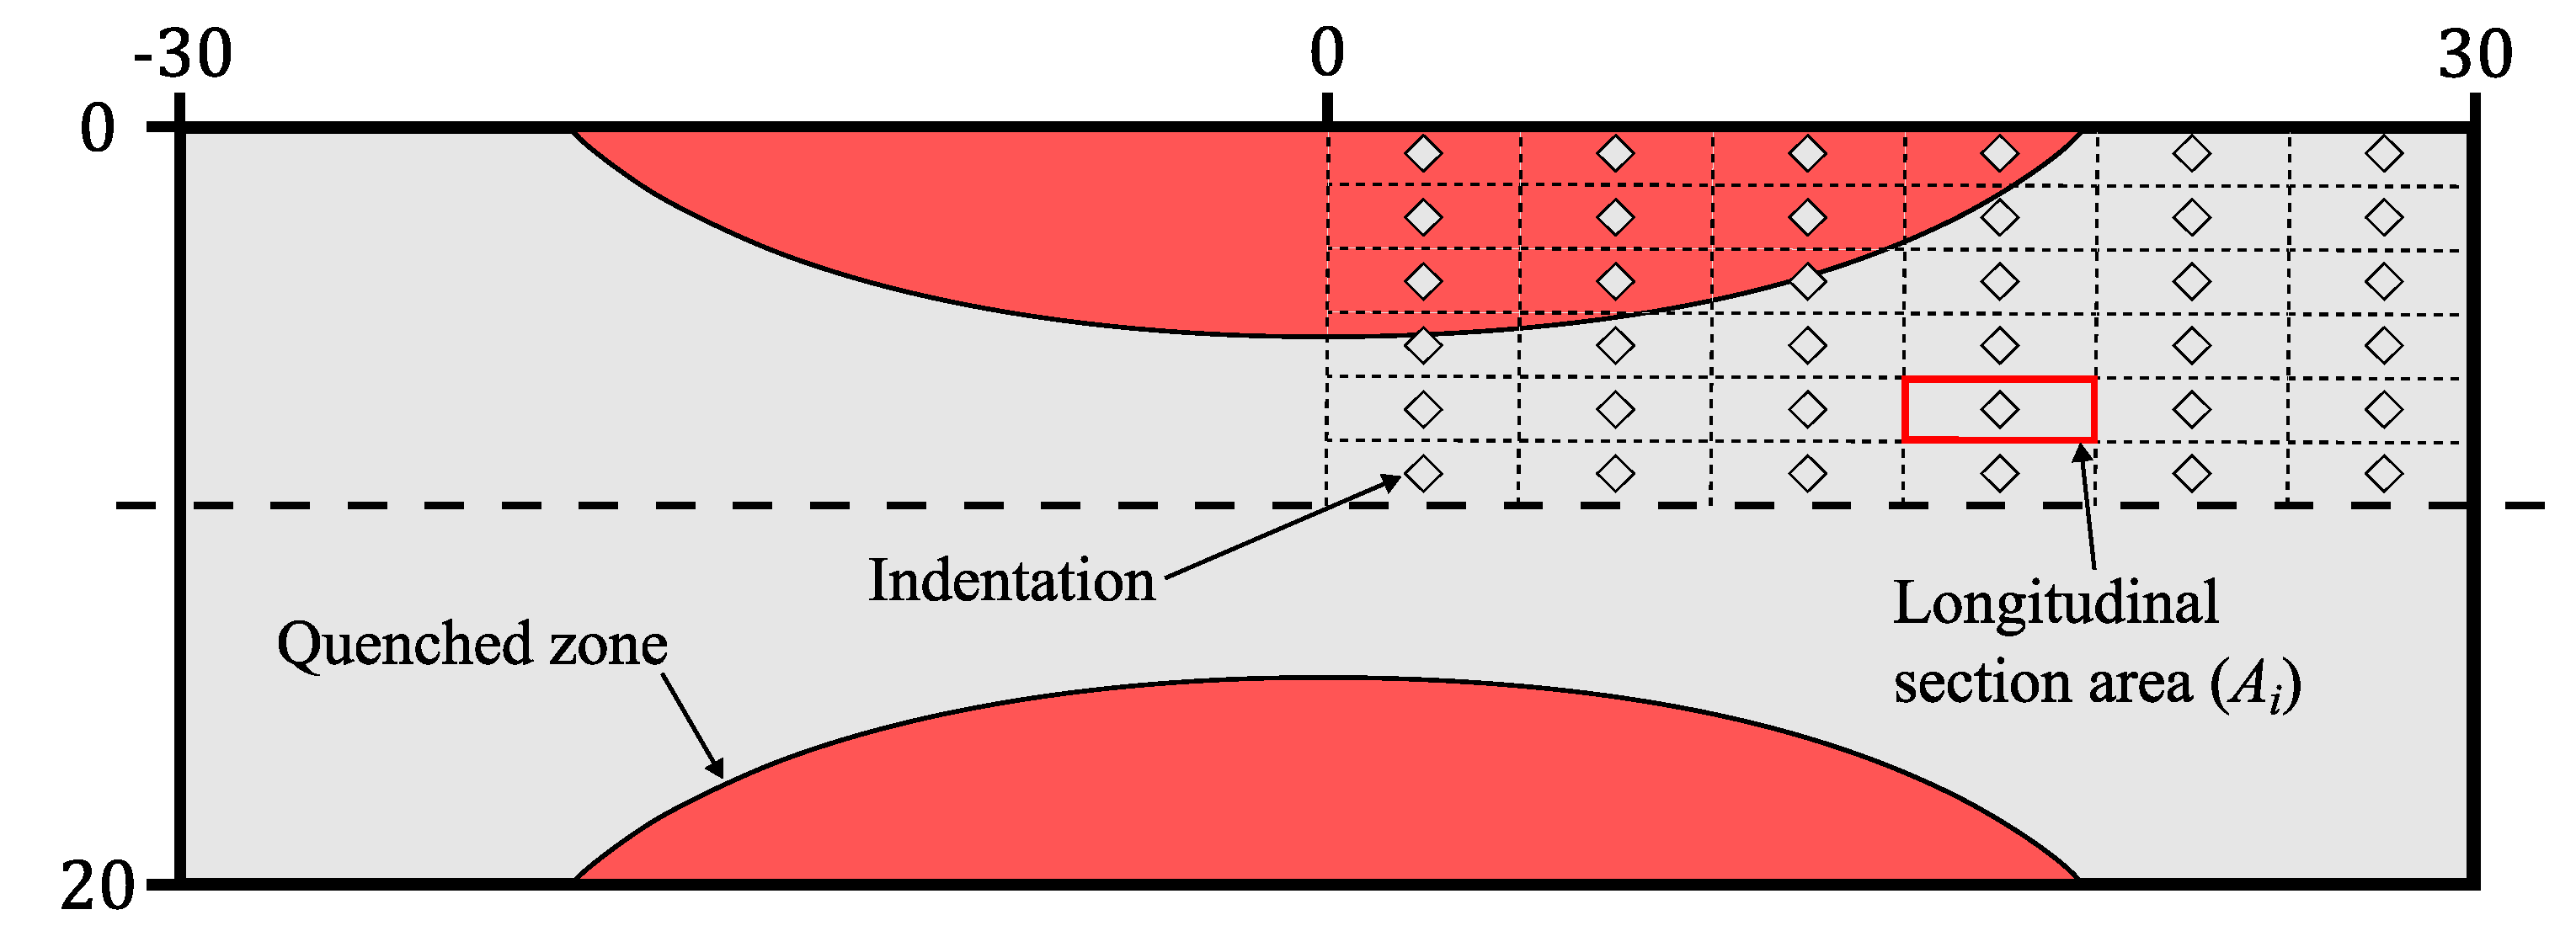
Since seven sections were obtained from each bar and 20 indentations were performed on each section, a 7 × 20 hardness matrix was generated for each hardened bar. The area of the longitudinal section of the bar corresponding to each matrix value was calculated ( A i ) (Figure 6), and the martensite percentage in each area ( M i ) was determined using Equation (3). Based on these data, the martensitic area ( M a r e a ) resulting from the heat treatment was estimated (Equation (4)), followed by the calculation of the total martensite volume ( M V ) (Equation (5)).
M area = i = 1 n M i % · A i
M V = M area · 2 · π · d centroid
Once all experimental data, including both AE and metallographic analysis results, were obtained, the search for a model capable of fitting these data was undertaken. Minor adjustments to the data may be necessary to account for noise events that are not easily removed through filtering.

3. Results

3.1. Quenching Tests and AE Measurements

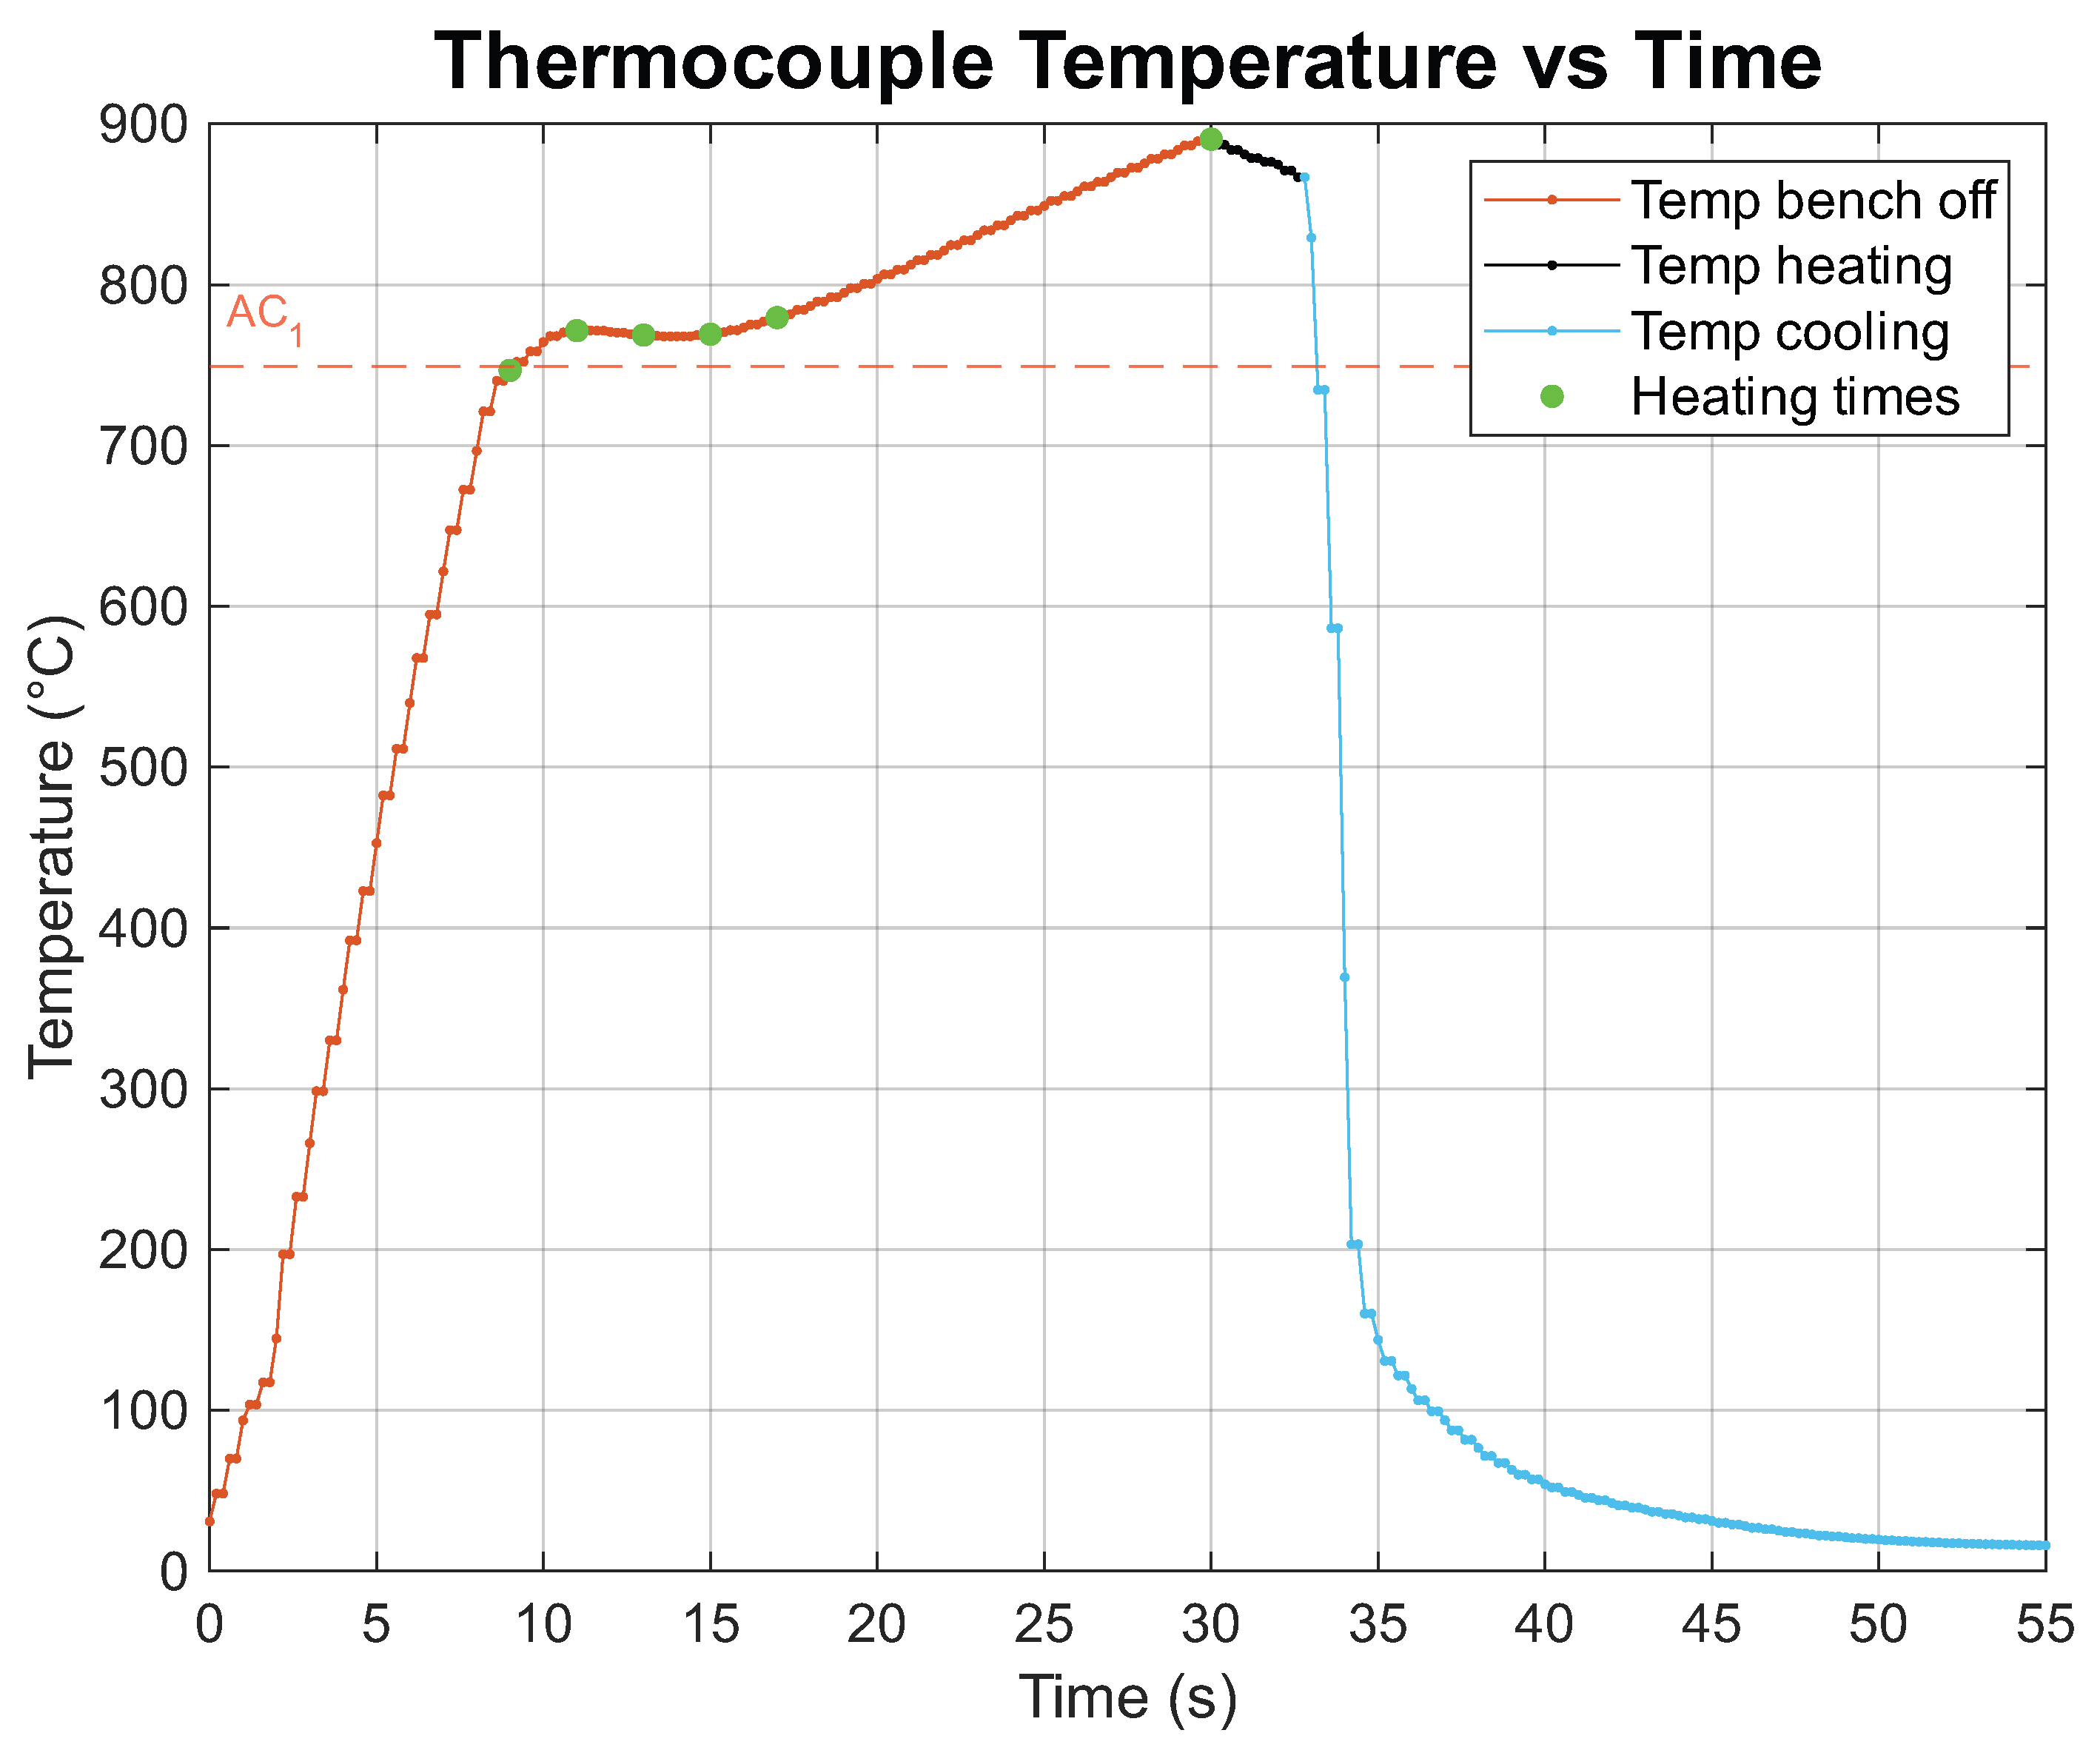
During the quenching tests, a thermocouple was welded to the treated bars to monitor their surface temperature. Figure 7 illustrates the temperature evolution during a 30 s heating test.
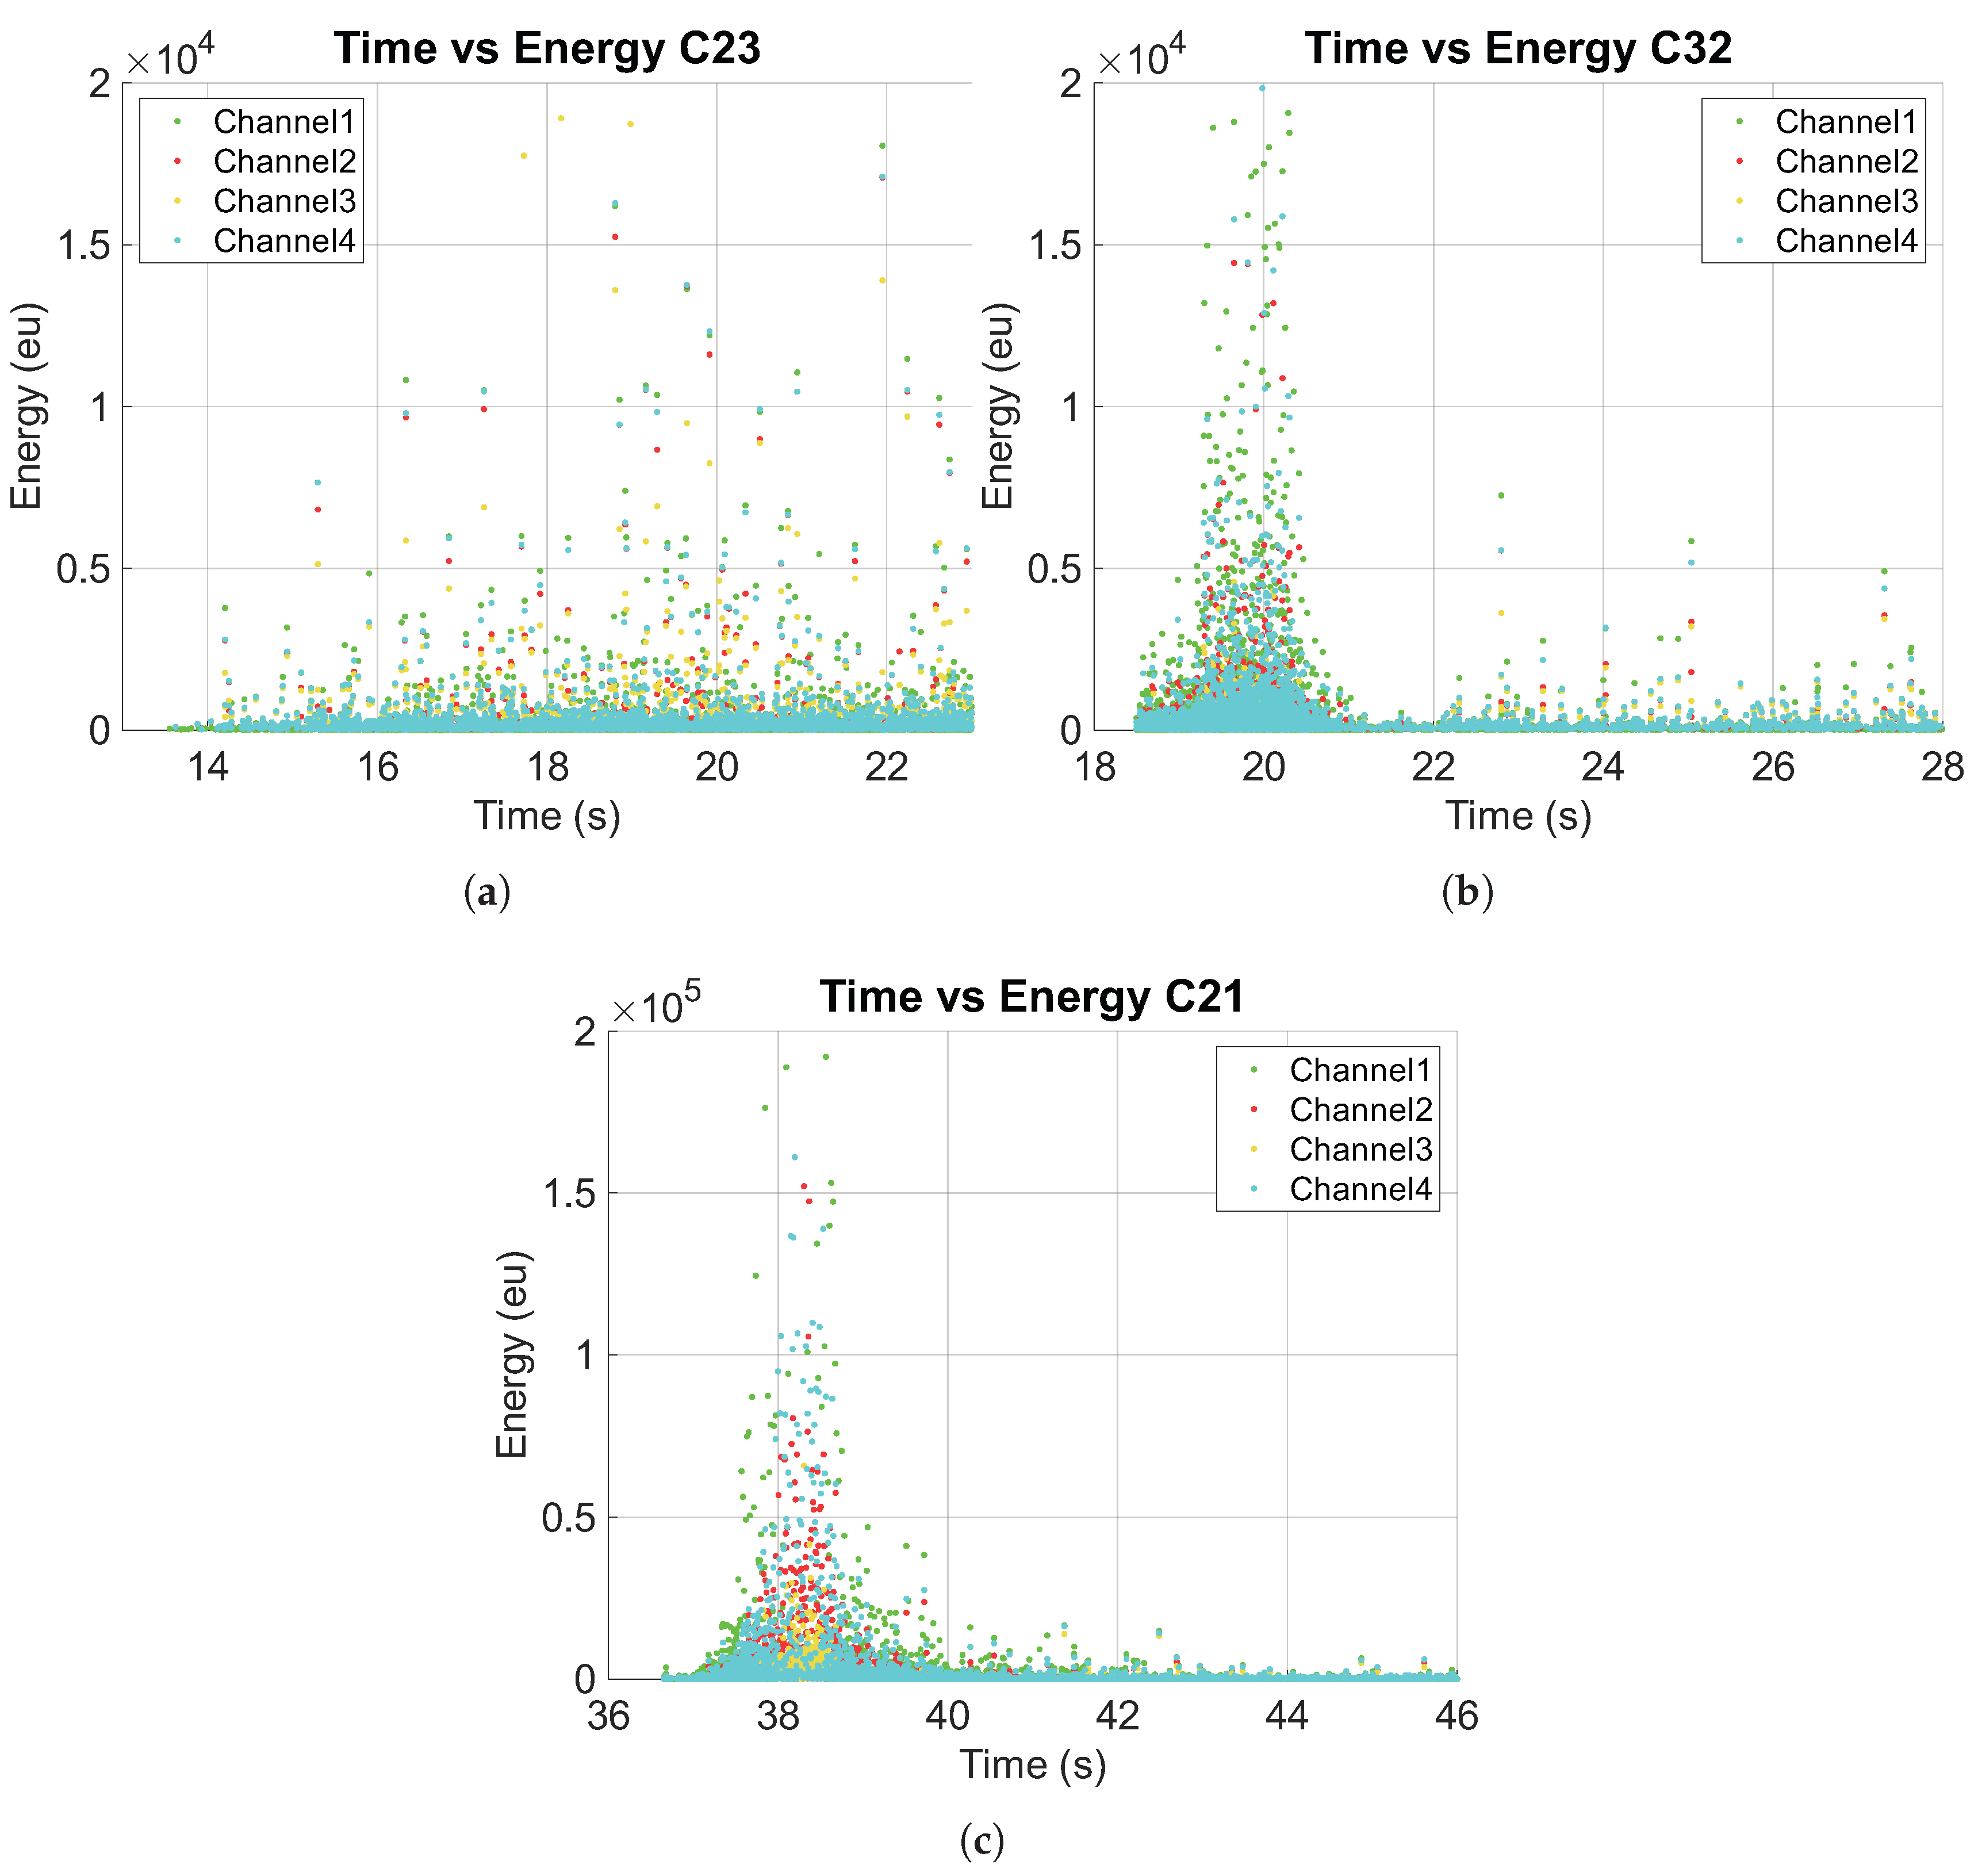
AE signals recorded during quenching exhibit distinct patterns that vary with heating time. These differences are particularly evident in energy-versus-time plots, which allow the identification of different stages of the quenching process. Figure 8 presents the energy released over time for three specimens during quenching. The measurements commence once heating ceases and the heated zone is exposed to the cooling system. The data from all channels has been retained. It can be seen how increasing the threshold results in fewer events and lower energy. This is because only elastic waves with higher dB values will be measured by the system. In some cases, the wave is able to exceed the threshold and start a measurement, but it loses strength over time, causing the event to close earlier and resulting in shorter events.
Bar C23 was heated for 6 s, which is insufficient to reach the AC 1 temperature. Consequently, no austenite was formed during heating, and no martensitic transformation occurred during cooling. Consequently, the AE signal is predominantly low in energy and uniform, primarily resulting from the impact of the coolant on the specimen. A few higher-energy events are also observed, likely due to boiling or external noise, but no signals corresponding to martensitic transformation are detected (Figure 8a).
Bar C32 was heated for 13 s, reaching a surface temperature above the AC 1 point, enabling the initiation of austenite formation in the microstructure. As shown in Figure 8b, unlike the previous specimen, the AE energy measurements increase significantly when the heated zone is exposed to the coolant. Between 19.2 and 20.5 s, higher-energy events are observed, producing a peak in the plot. After this interval, the energy decreases and stabilizes, reflecting the uniform impact of the coolant on the specimen, similar to the previous case.
Bar C21 was heated for 30 s, during which the surface reached a substantially higher temperature and the internal temperature of the specimen became more uniform, allowing austenite formation throughout the bar diameter. As in the previous case, AE energy measurements increased as the heated zone cooled, but with significantly higher values. Furthermore, the peak occurs between 37 and 40 s, a longer interval than observed for bar C32 (Figure 8c). The elevated temperature induced a more intense quench, resulting in longer martensite needles due to increased grain size, which produced greater energy release. Temperature homogenization within the bar influenced both the magnitude of energy released and the duration of the peak. While the surface cools almost instantaneously to M s and M f , the interior requires additional time to reach these temperatures, resulting in AE signals associated with martensitic transformation over an extended period and a higher total energy release due to the larger transformed volume.
To confirm that the low-energy uniform zones correspond to signals generated by the impact of the coolant on the bar, AE measurements were performed on an unheated specimen with only the cooling system active. These measurements were largely uniform, exhibiting low energy and short duration, consistent with the observations from the quenched bars.
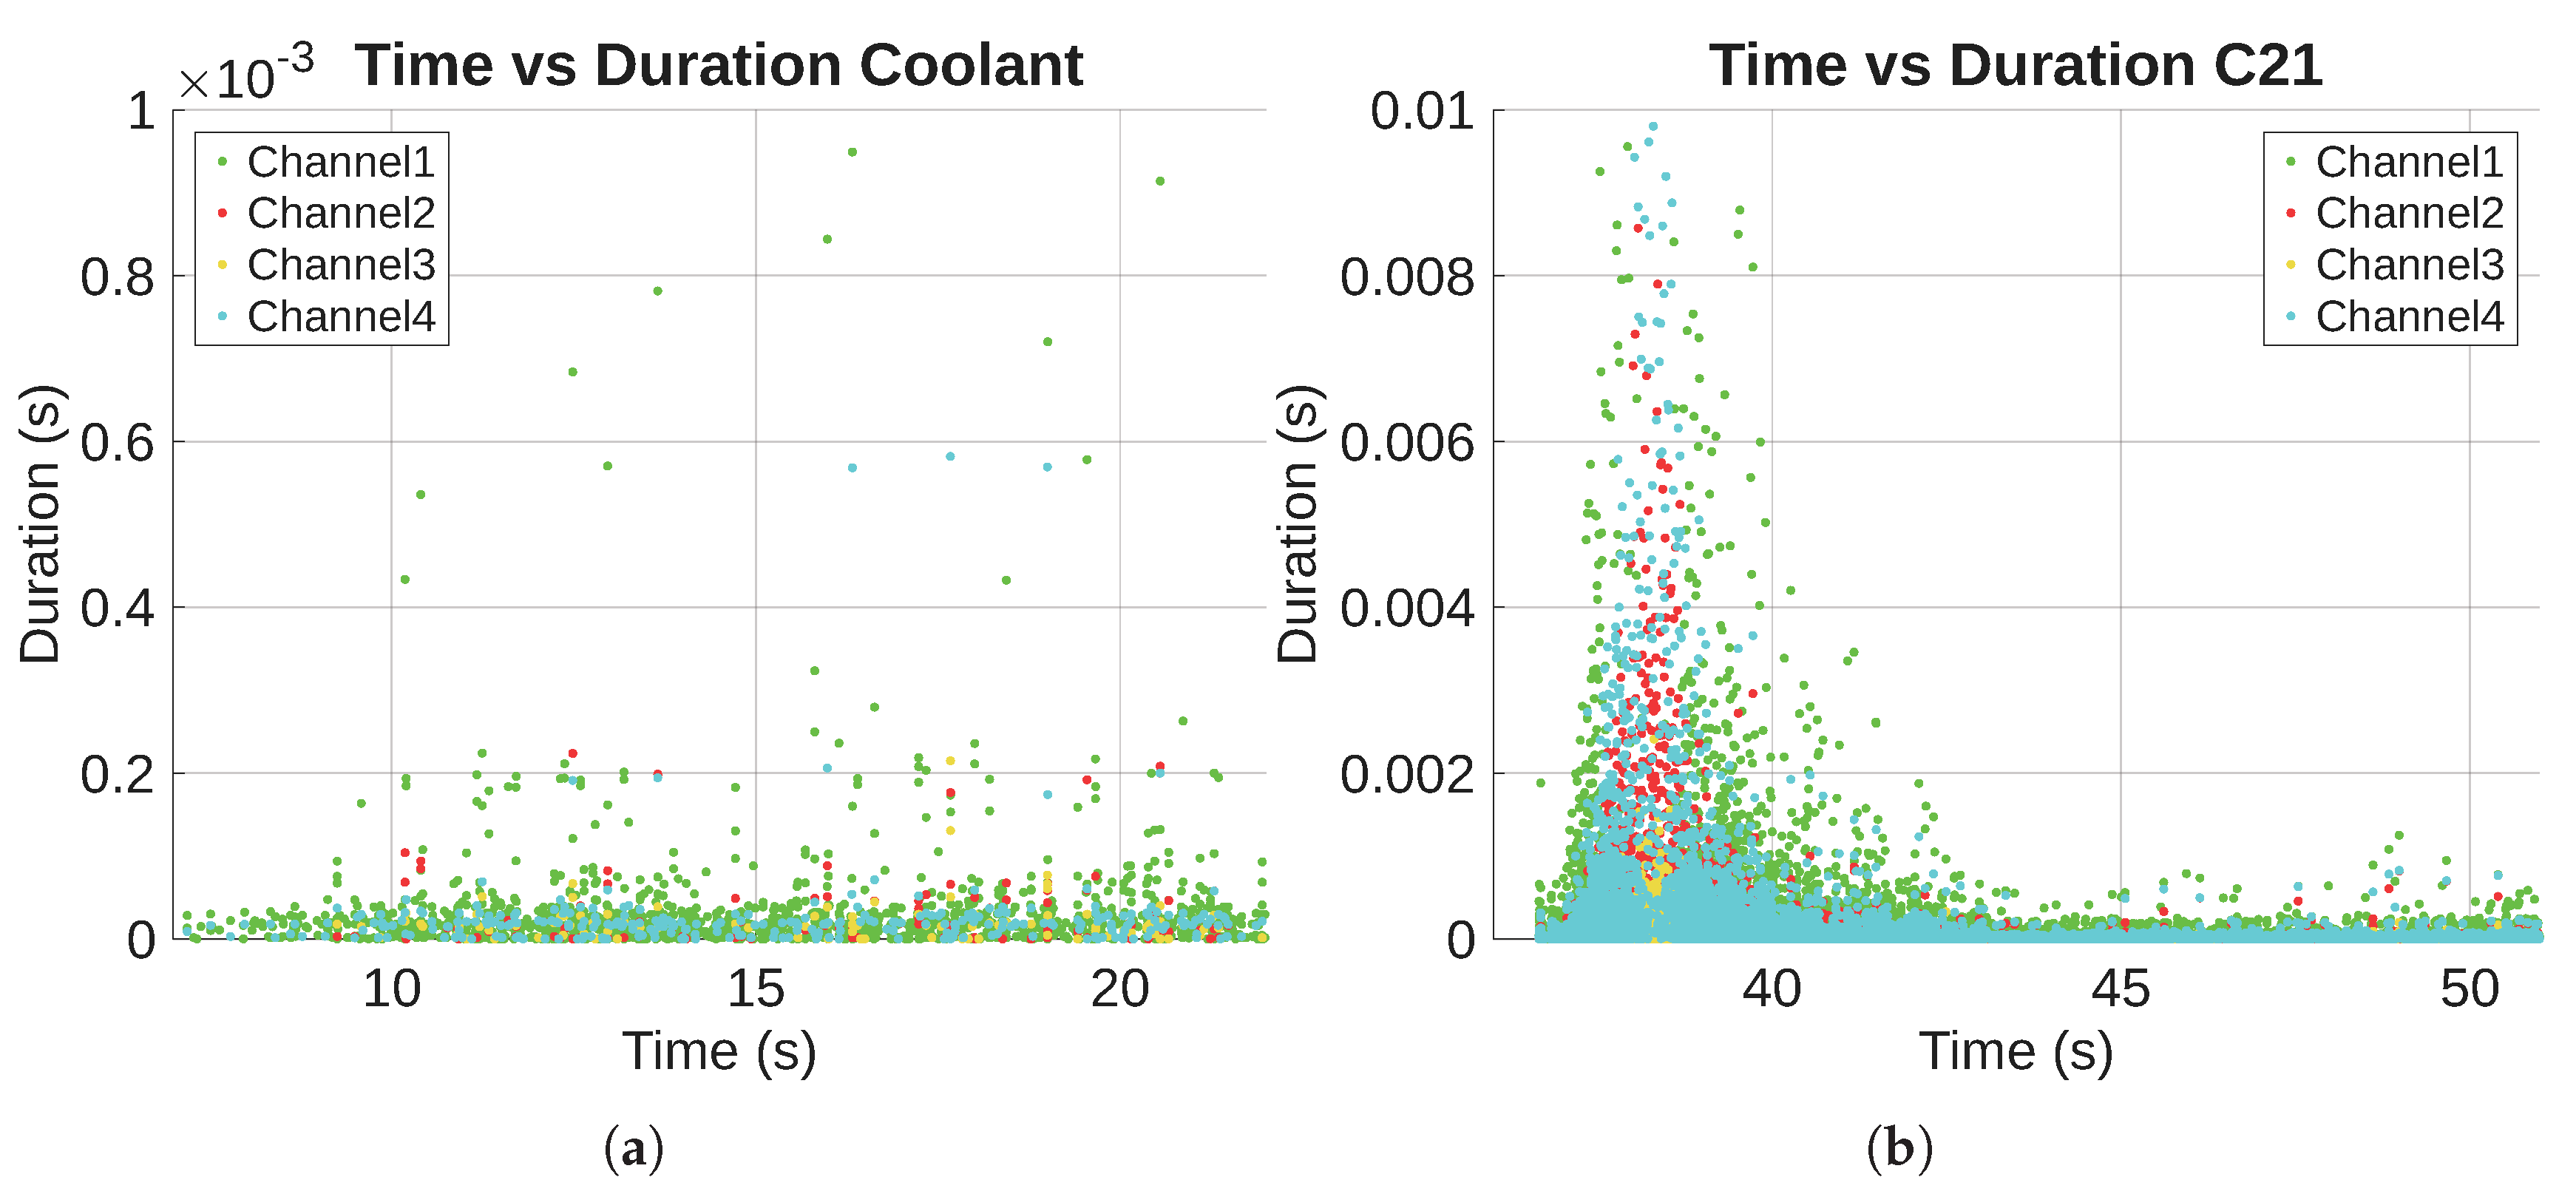
Following the procedure described in Section 2.2.1, the AE measurements were filtered using a 400 µs duration threshold, which removes all events shorter than this duration. This filter effectively eliminates the majority of signals generated by the impact of the coolant, yielding a cleaner signal focused on the events of interest. The value of 400 µs was determined experimentally by performing a test with an AE sensor on a bar without applying heat, using only the cooling system. This test provided information about the events generated by the impact of the coolant on the part, as well as any background noise that might occur during measurement.
Figure 9 shows two graphs comparing the duration of the events recorded during a test in which only the cooling system was activated, without heating (Figure 9a) and those obtained during the quenching of bar C21 (Figure 9b). As observed, the C21 bar presents two distinct phases: a duration peak that coincides with the time of the energy peak shown in Figure 8, and a stable phase of short-duration events corresponding to the test where only the cooling system was operating. This confirms the presence of two types of signals in the quenched bar measurements and allows the definition of an appropriate filter value to remove irrelevant data. Although most events have a duration below 200 µs, some reach slightly higher values; therefore, a 400 µs filter was applied to ensure that all unwanted events were effectively removed.
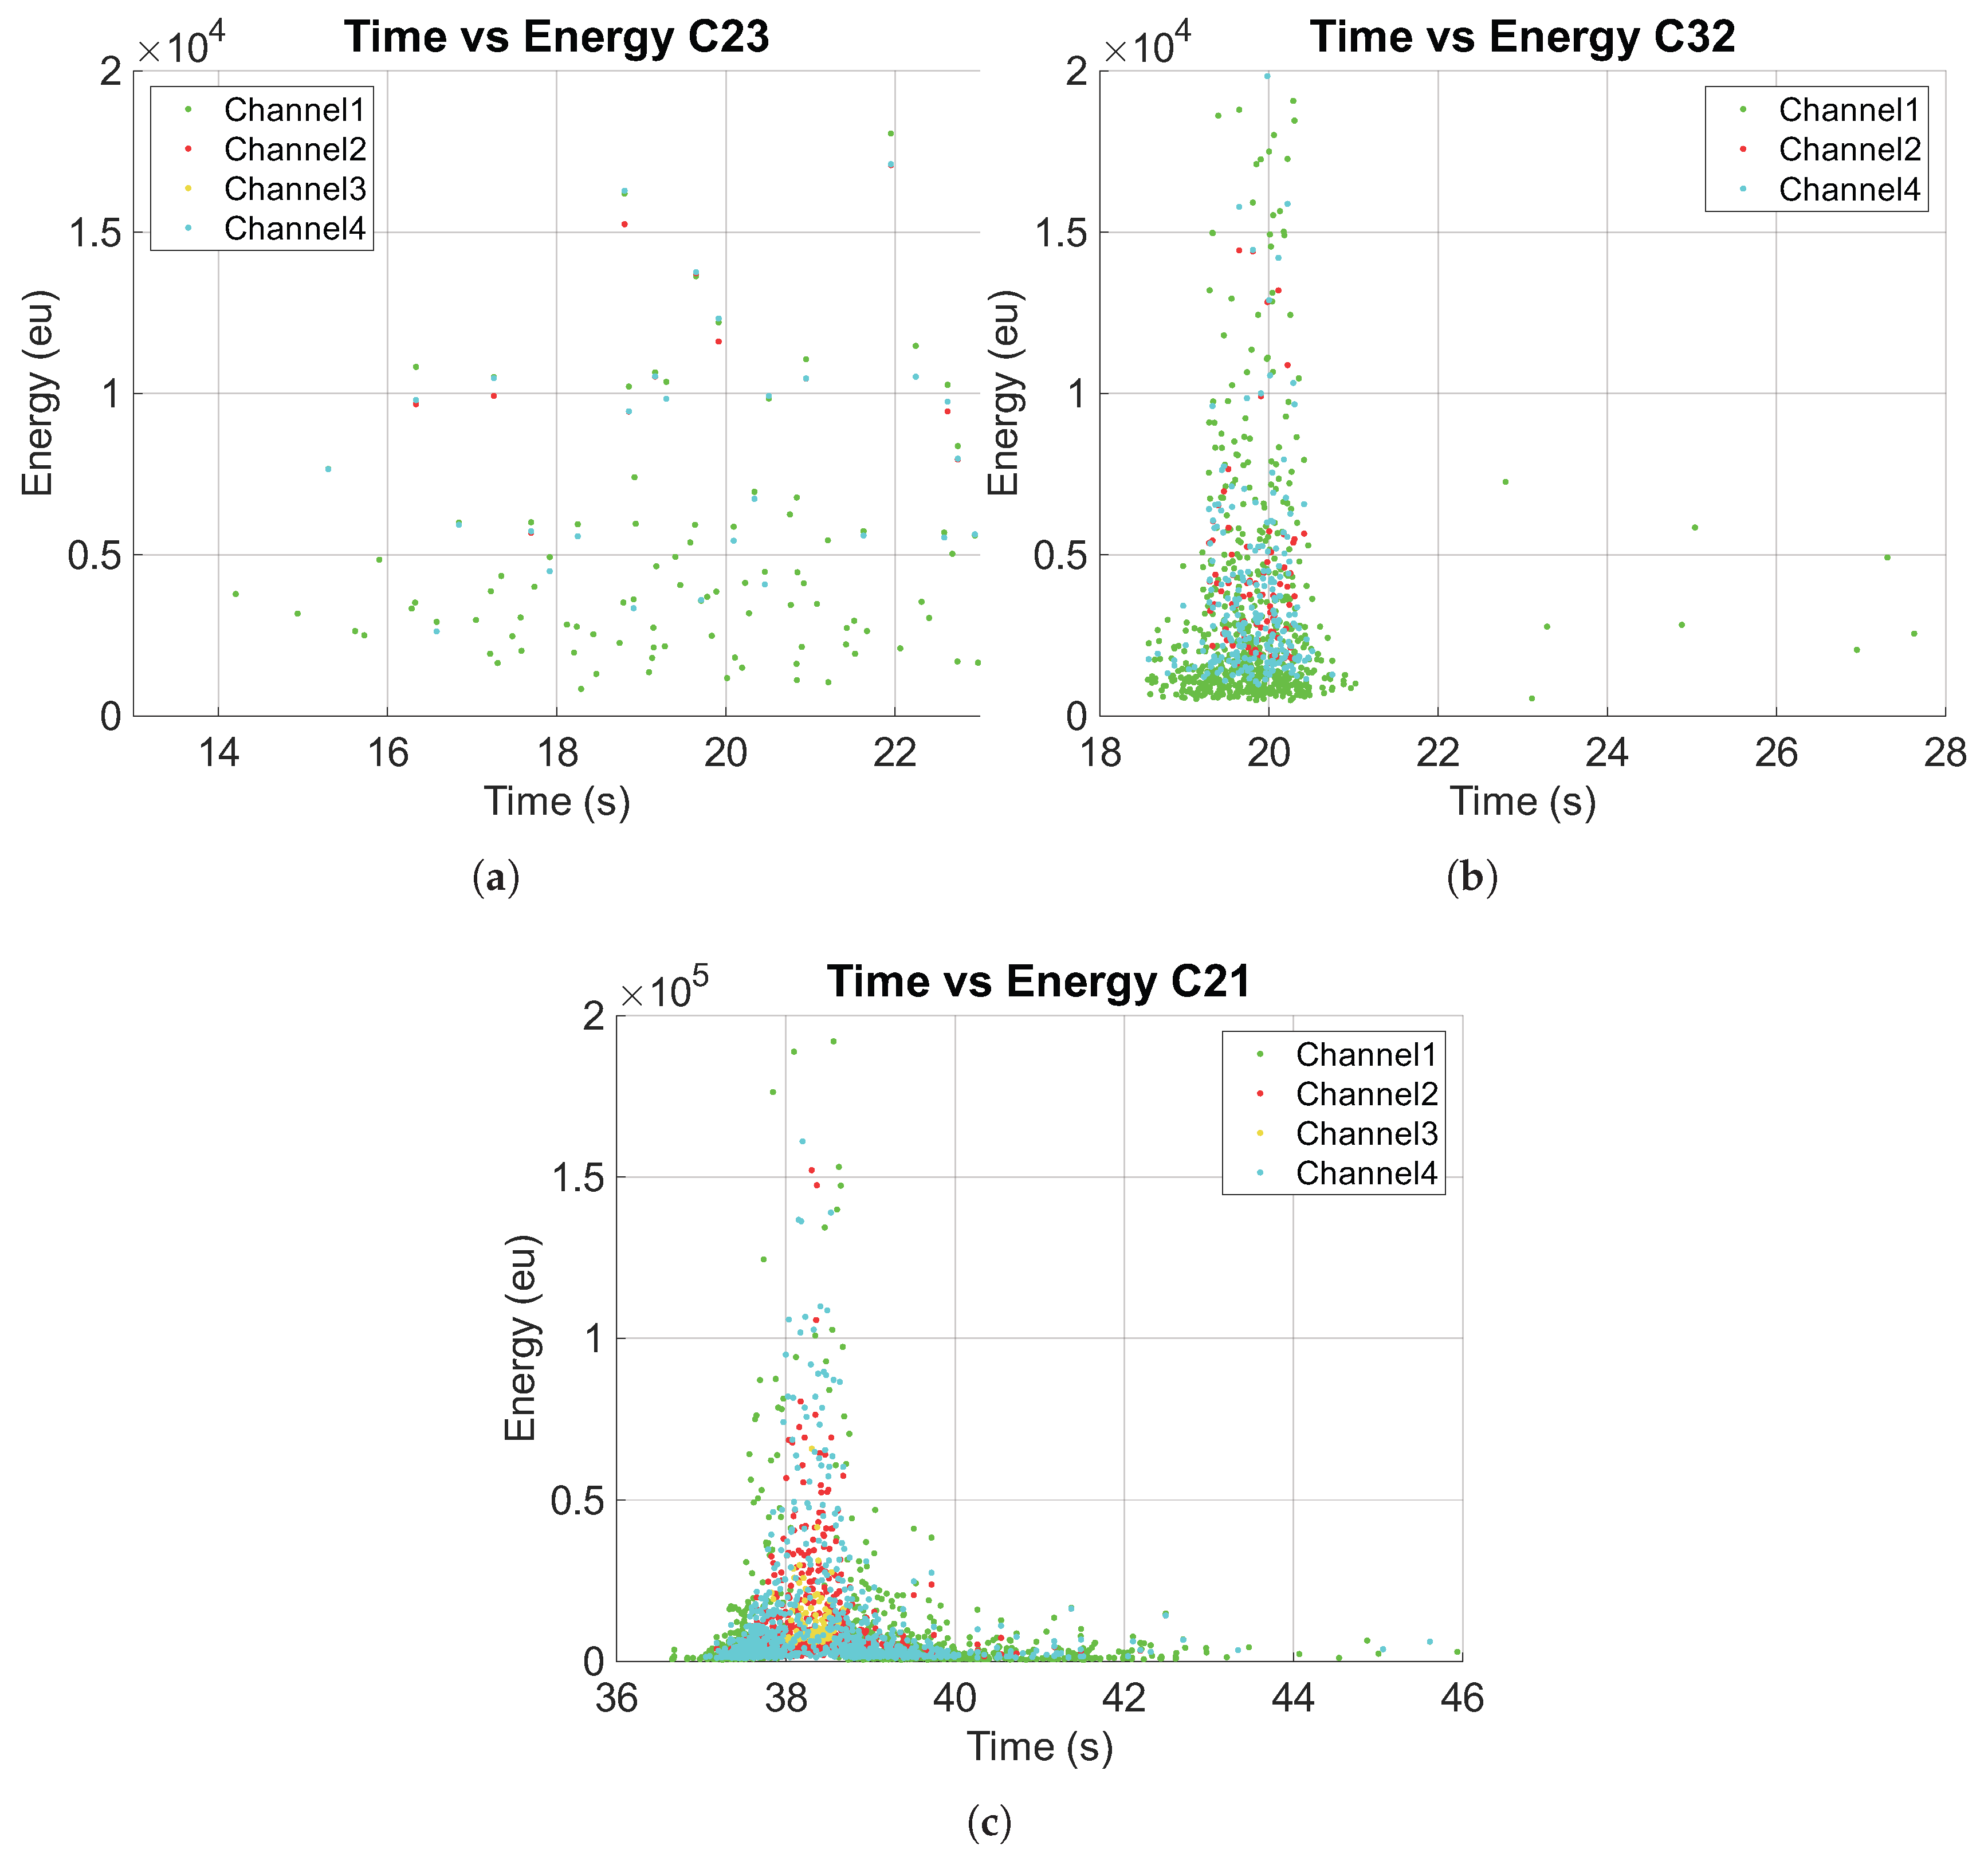
Figure 10 shows the same plots as in the previous figure, but with the duration filter applied. It is evident that most events in bar C23 have disappeared, and the off-peak energy events in bar C32 are also eliminated. However, some low-energy events outside the main peak interval remain in bar C21. These events correspond to martensitic transformation occurring in the interior of the bar, where slower cooling produces transformation signals outside the primary peak interval.
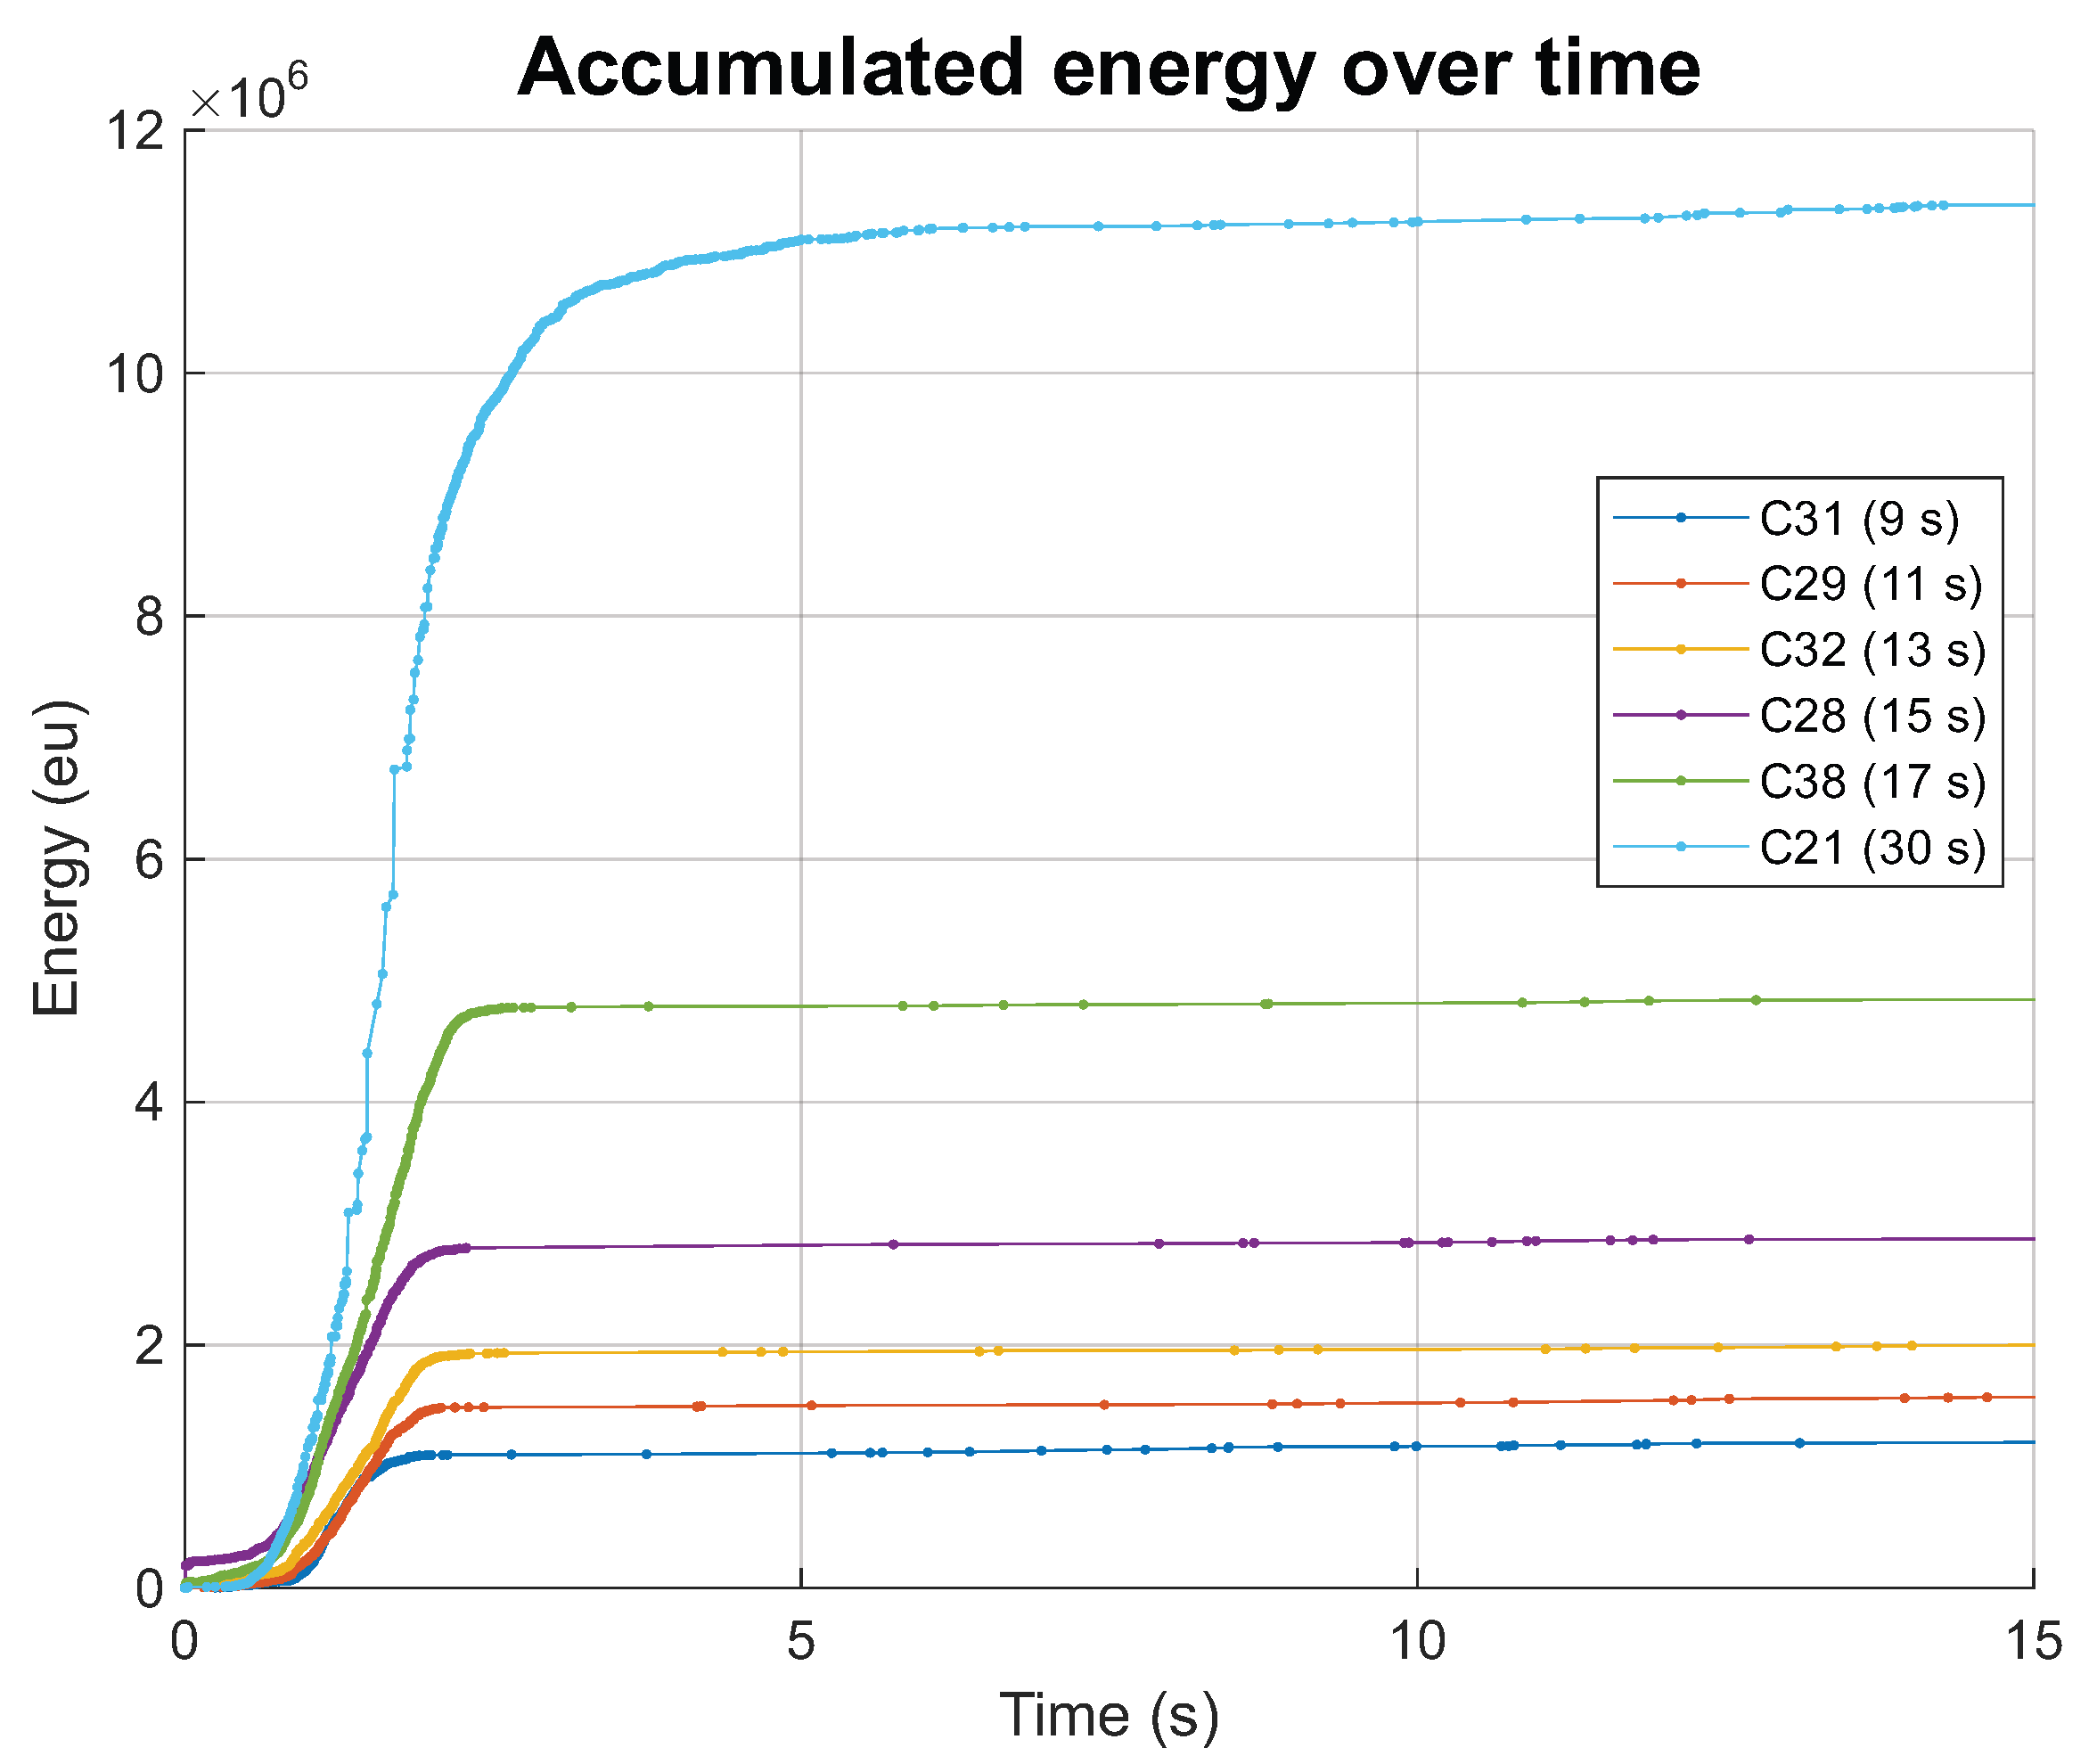
After processing the AE measurements and considering the differences observed with varying heating times, the accumulated energy is considered a reliable indicator for estimating the martensite volume obtained during quenching. Figure 11 presents the cumulative energy of each unfiltered event over time. These plots illustrate the progression of energy release throughout the process, with the steepest slope occurring when the heated zone cools and martensitic transformation takes place.

3.2. Metallographic Characterization

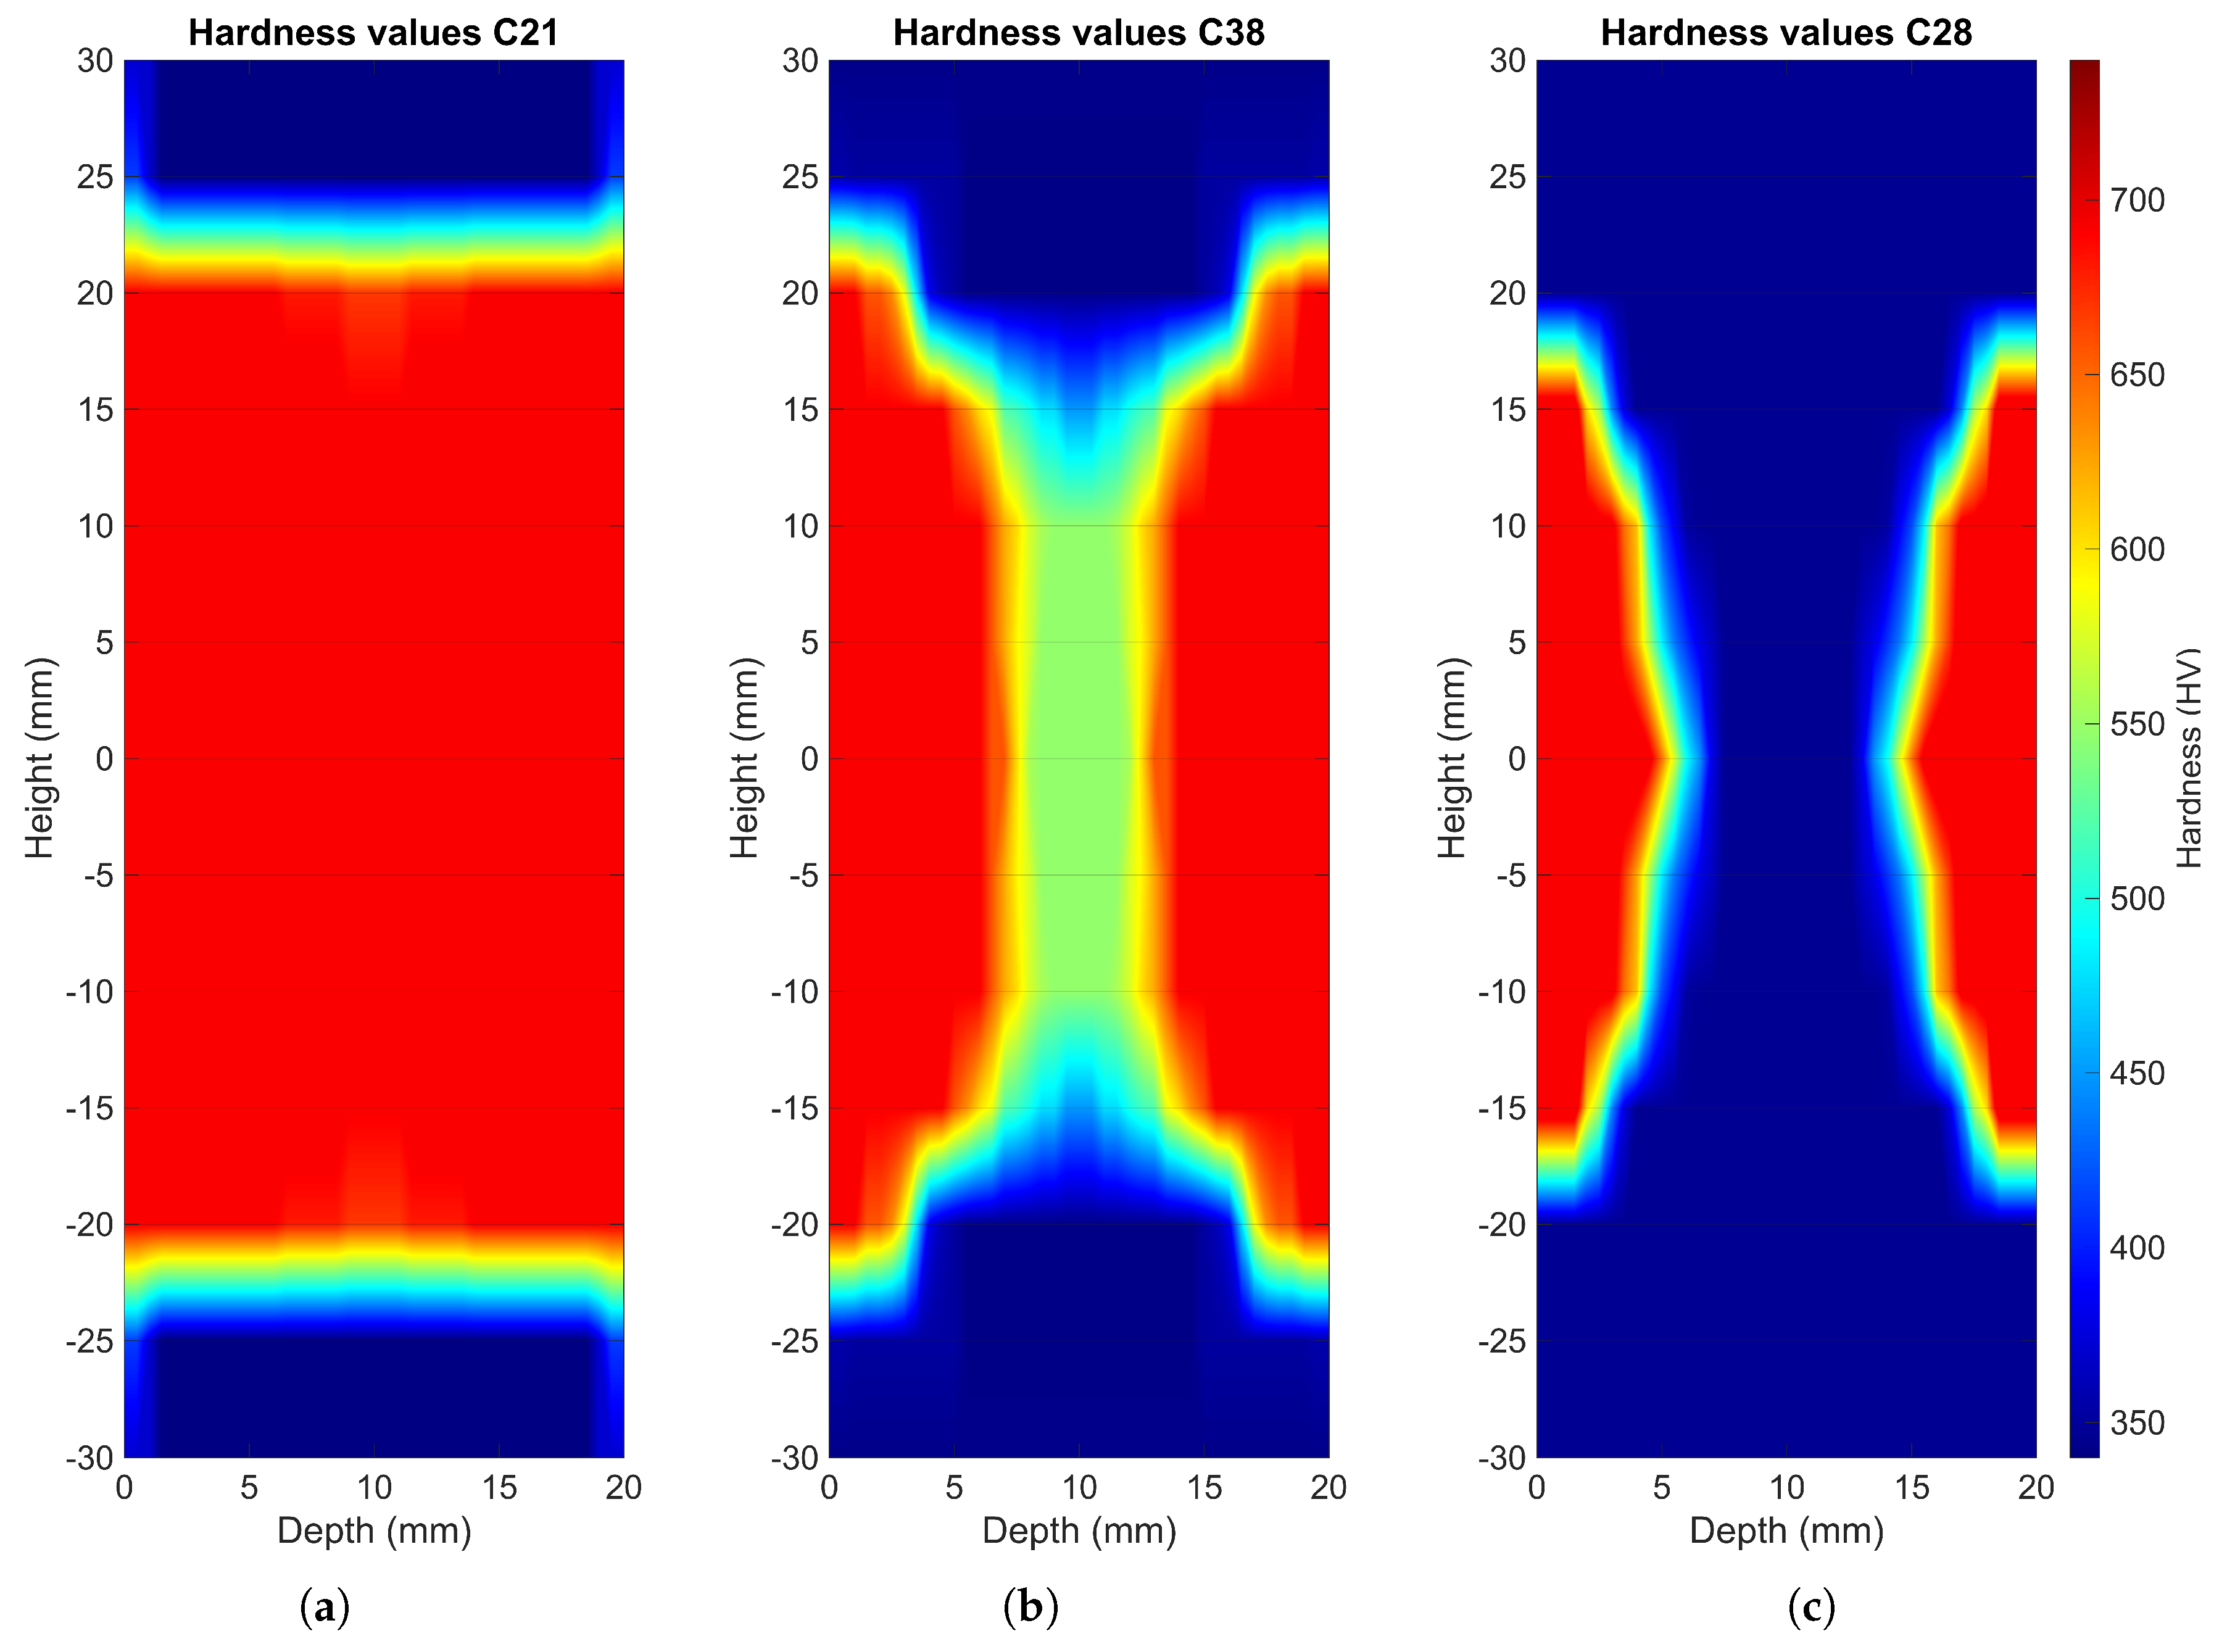
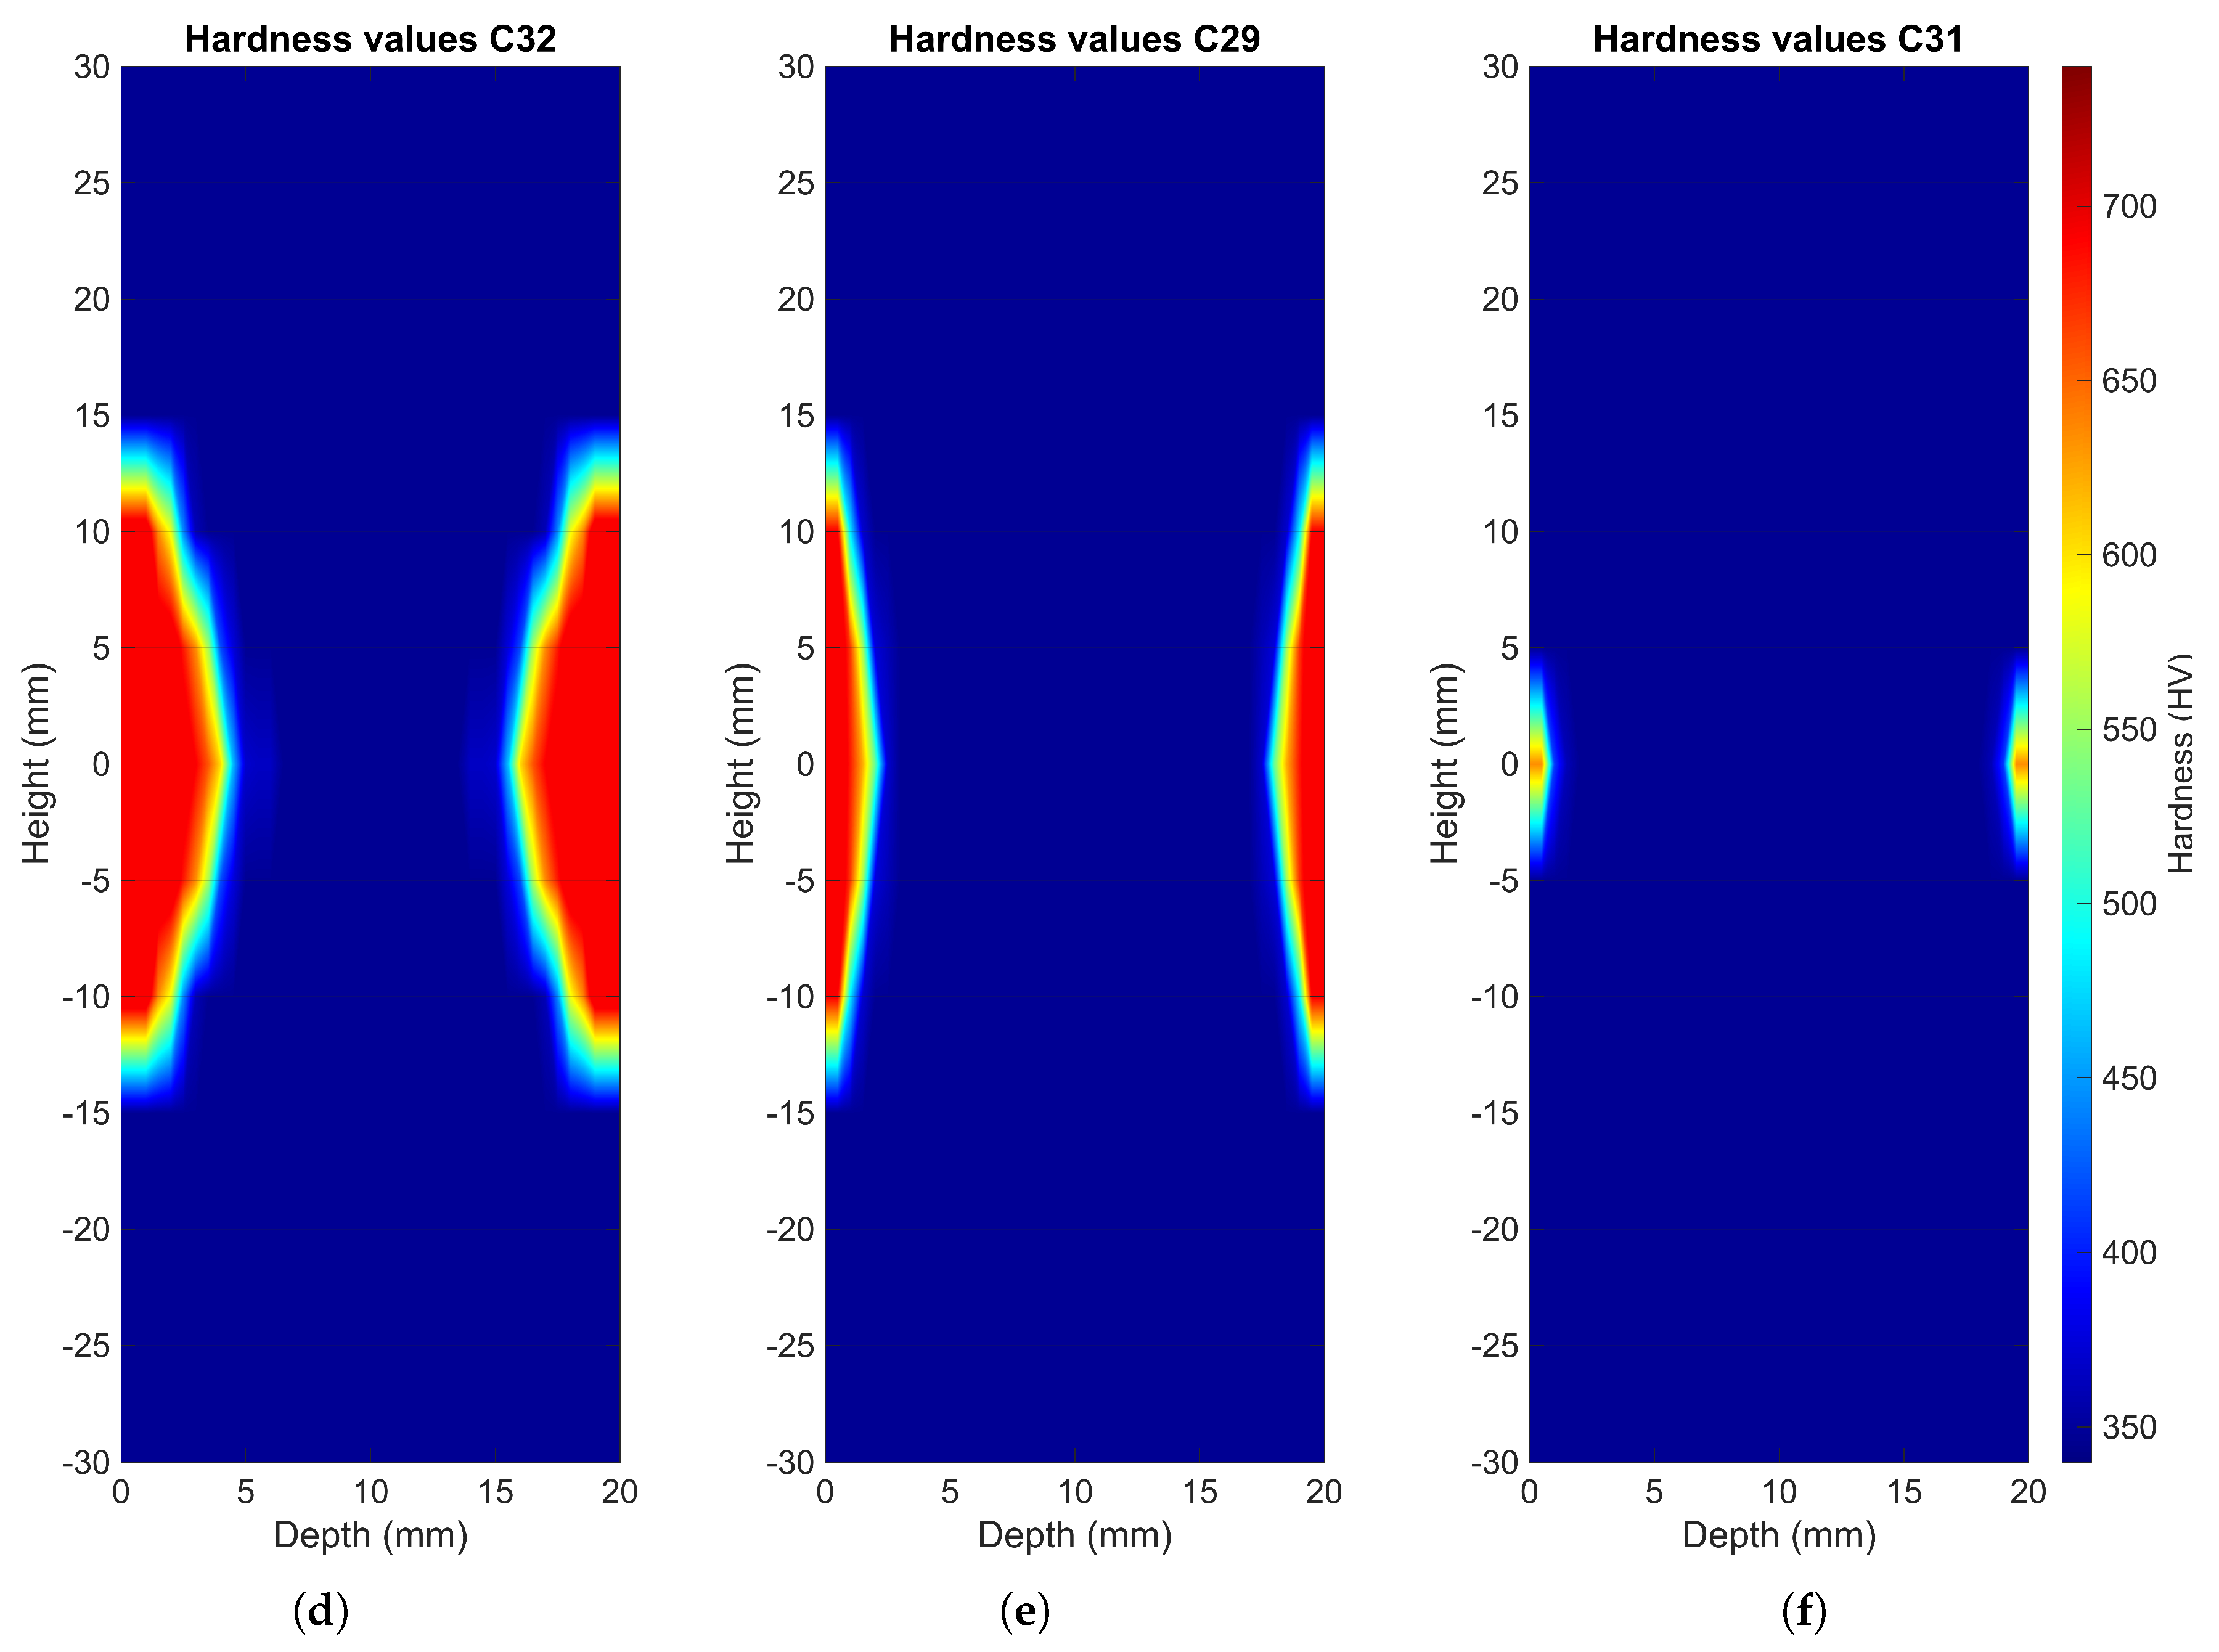
Seven 5 mm thick sections were cut from a single specimen for each heating time and prepared for Vickers hardness testing, with 20 indentations performed on each section. Figure 12 presents representative maps of the treated sections and their corresponding Vickers hardness values. As observed, the area exhibiting higher hardness expands with increasing heating time, indicating a larger martensite volume.
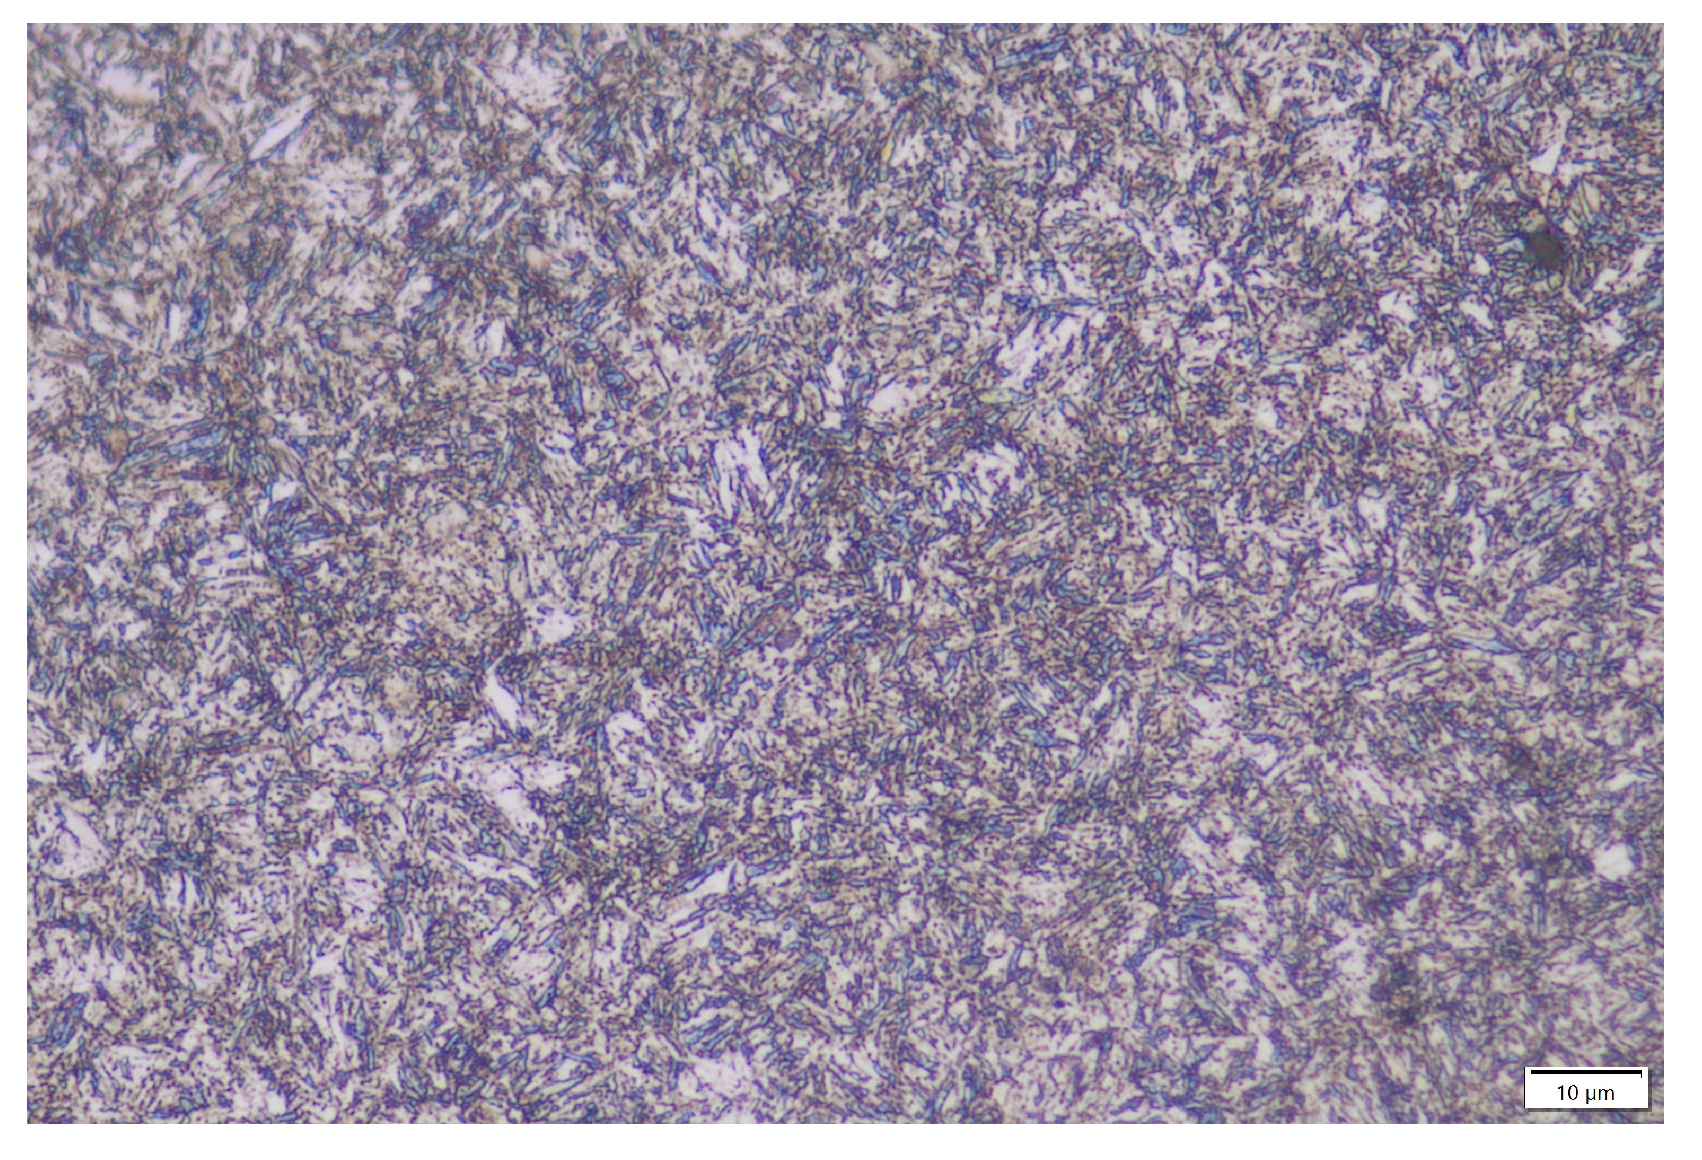
To confirm the presence of martensite in the pieces, in addition to the hardness values, the pieces were analyzed under a microscope at 1000× magnification. Figure 13 shows the needle-like structure that martensite typically has.
Once the presence of martensite is confirmed, an estimation of the martensite volume was made using the graph presented in Section 2.2.2 (Figure 5). Table 4 summarizes the estimated martensite volume for each bar. It also shows the volume fraction with respect to the total volume inside the coil responsible for heating, and the relative volumetric fraction of martensite with respect to the volume actually heated and treated.

3.3. Model Fitting

After acquiring the energy release data from AE measurements and the martensite volume data from Vickers hardness tests, a model capable of fitting the obtained data can be developed.
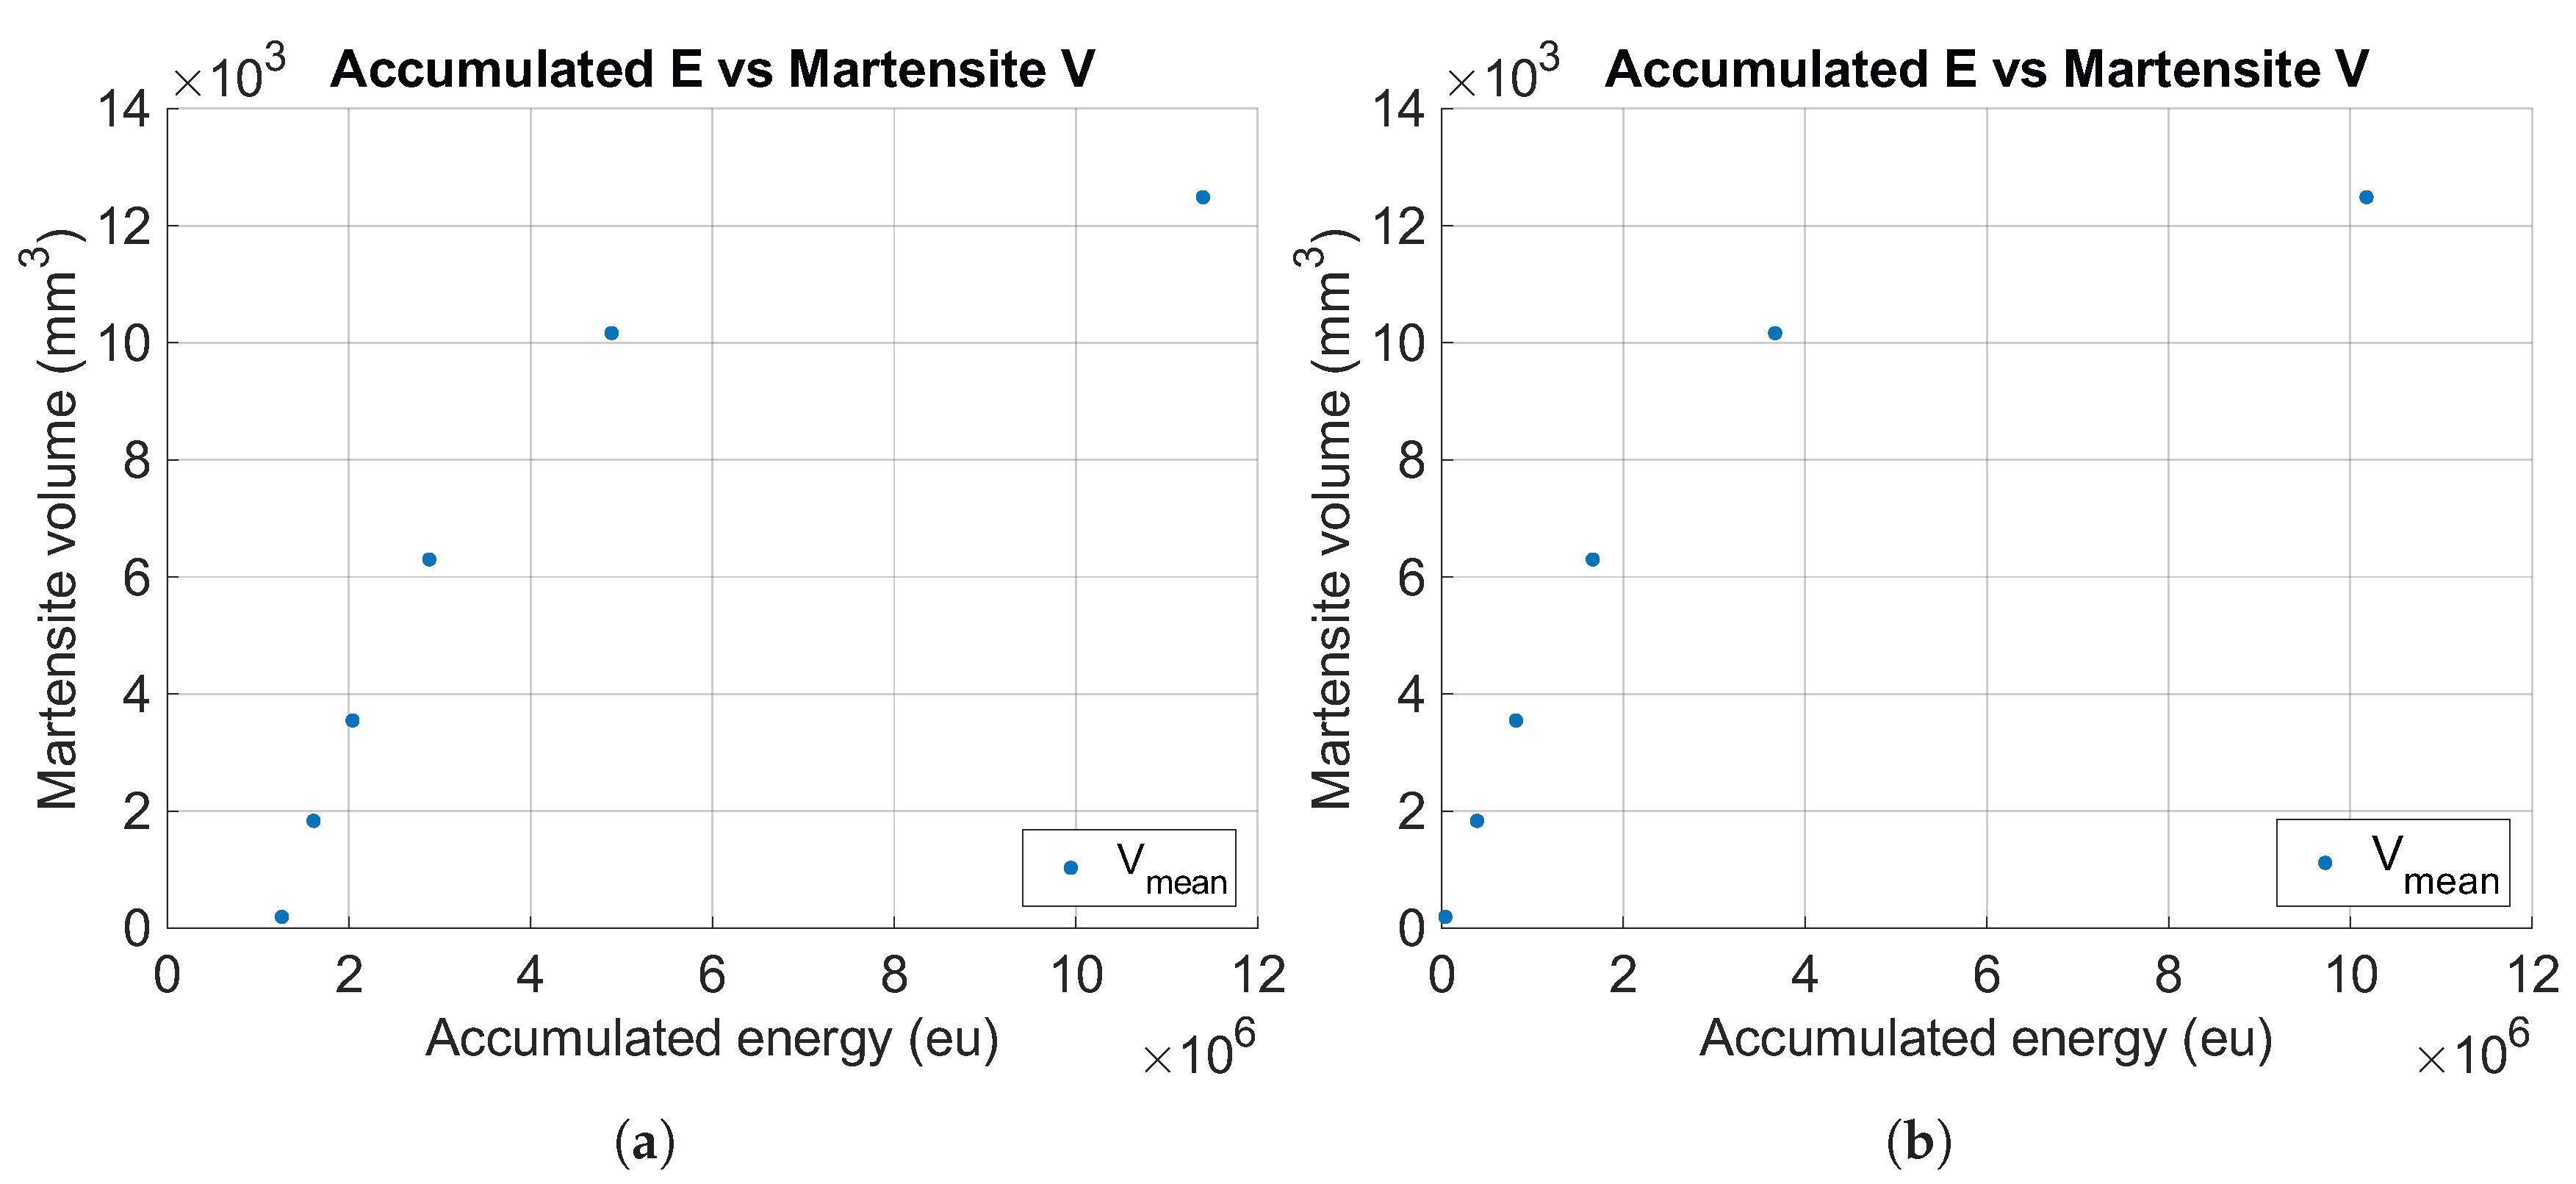
Figure 14a shows a plot of the energy released during quenching and the corresponding martensite volume obtained after microstructural transformation. Some residual noise remains, as the data point nearest 0 mm 3 does not correspond to an energy value of zero. To correct this, a line was drawn between the first two data points, and its intersection with the X-axis was determined. Once the cut-off value was established, all data were shifted leftward by this value (Figure 14b).
The curve derived from the experimental data closely resembles the proposed model in Section 2.1, Equation (2). This equation includes two constants: ‘L’, which determines the horizontal asymptote of the curve, and ‘k’, which controls the rate of exponential growth. The constants were calibrated to achieve the closest possible fit to the experimental data, resulting in the model presented in Equation (6), with a coefficient of determination of 0.9973, indicating excellent agreement between the model and the experimental data. The corresponding plot is shown in Figure 15.
V ( x ) = 12750.55 · 1 e 4.92 e 7 · E
V = volume of martensite obtained
E = energy measured by AE
Figure 15. Final model for martensite estimation with energy value measured by acoustic emissions during induction hardening process.
Metals 15 01228 g015

4. Results and Discussion

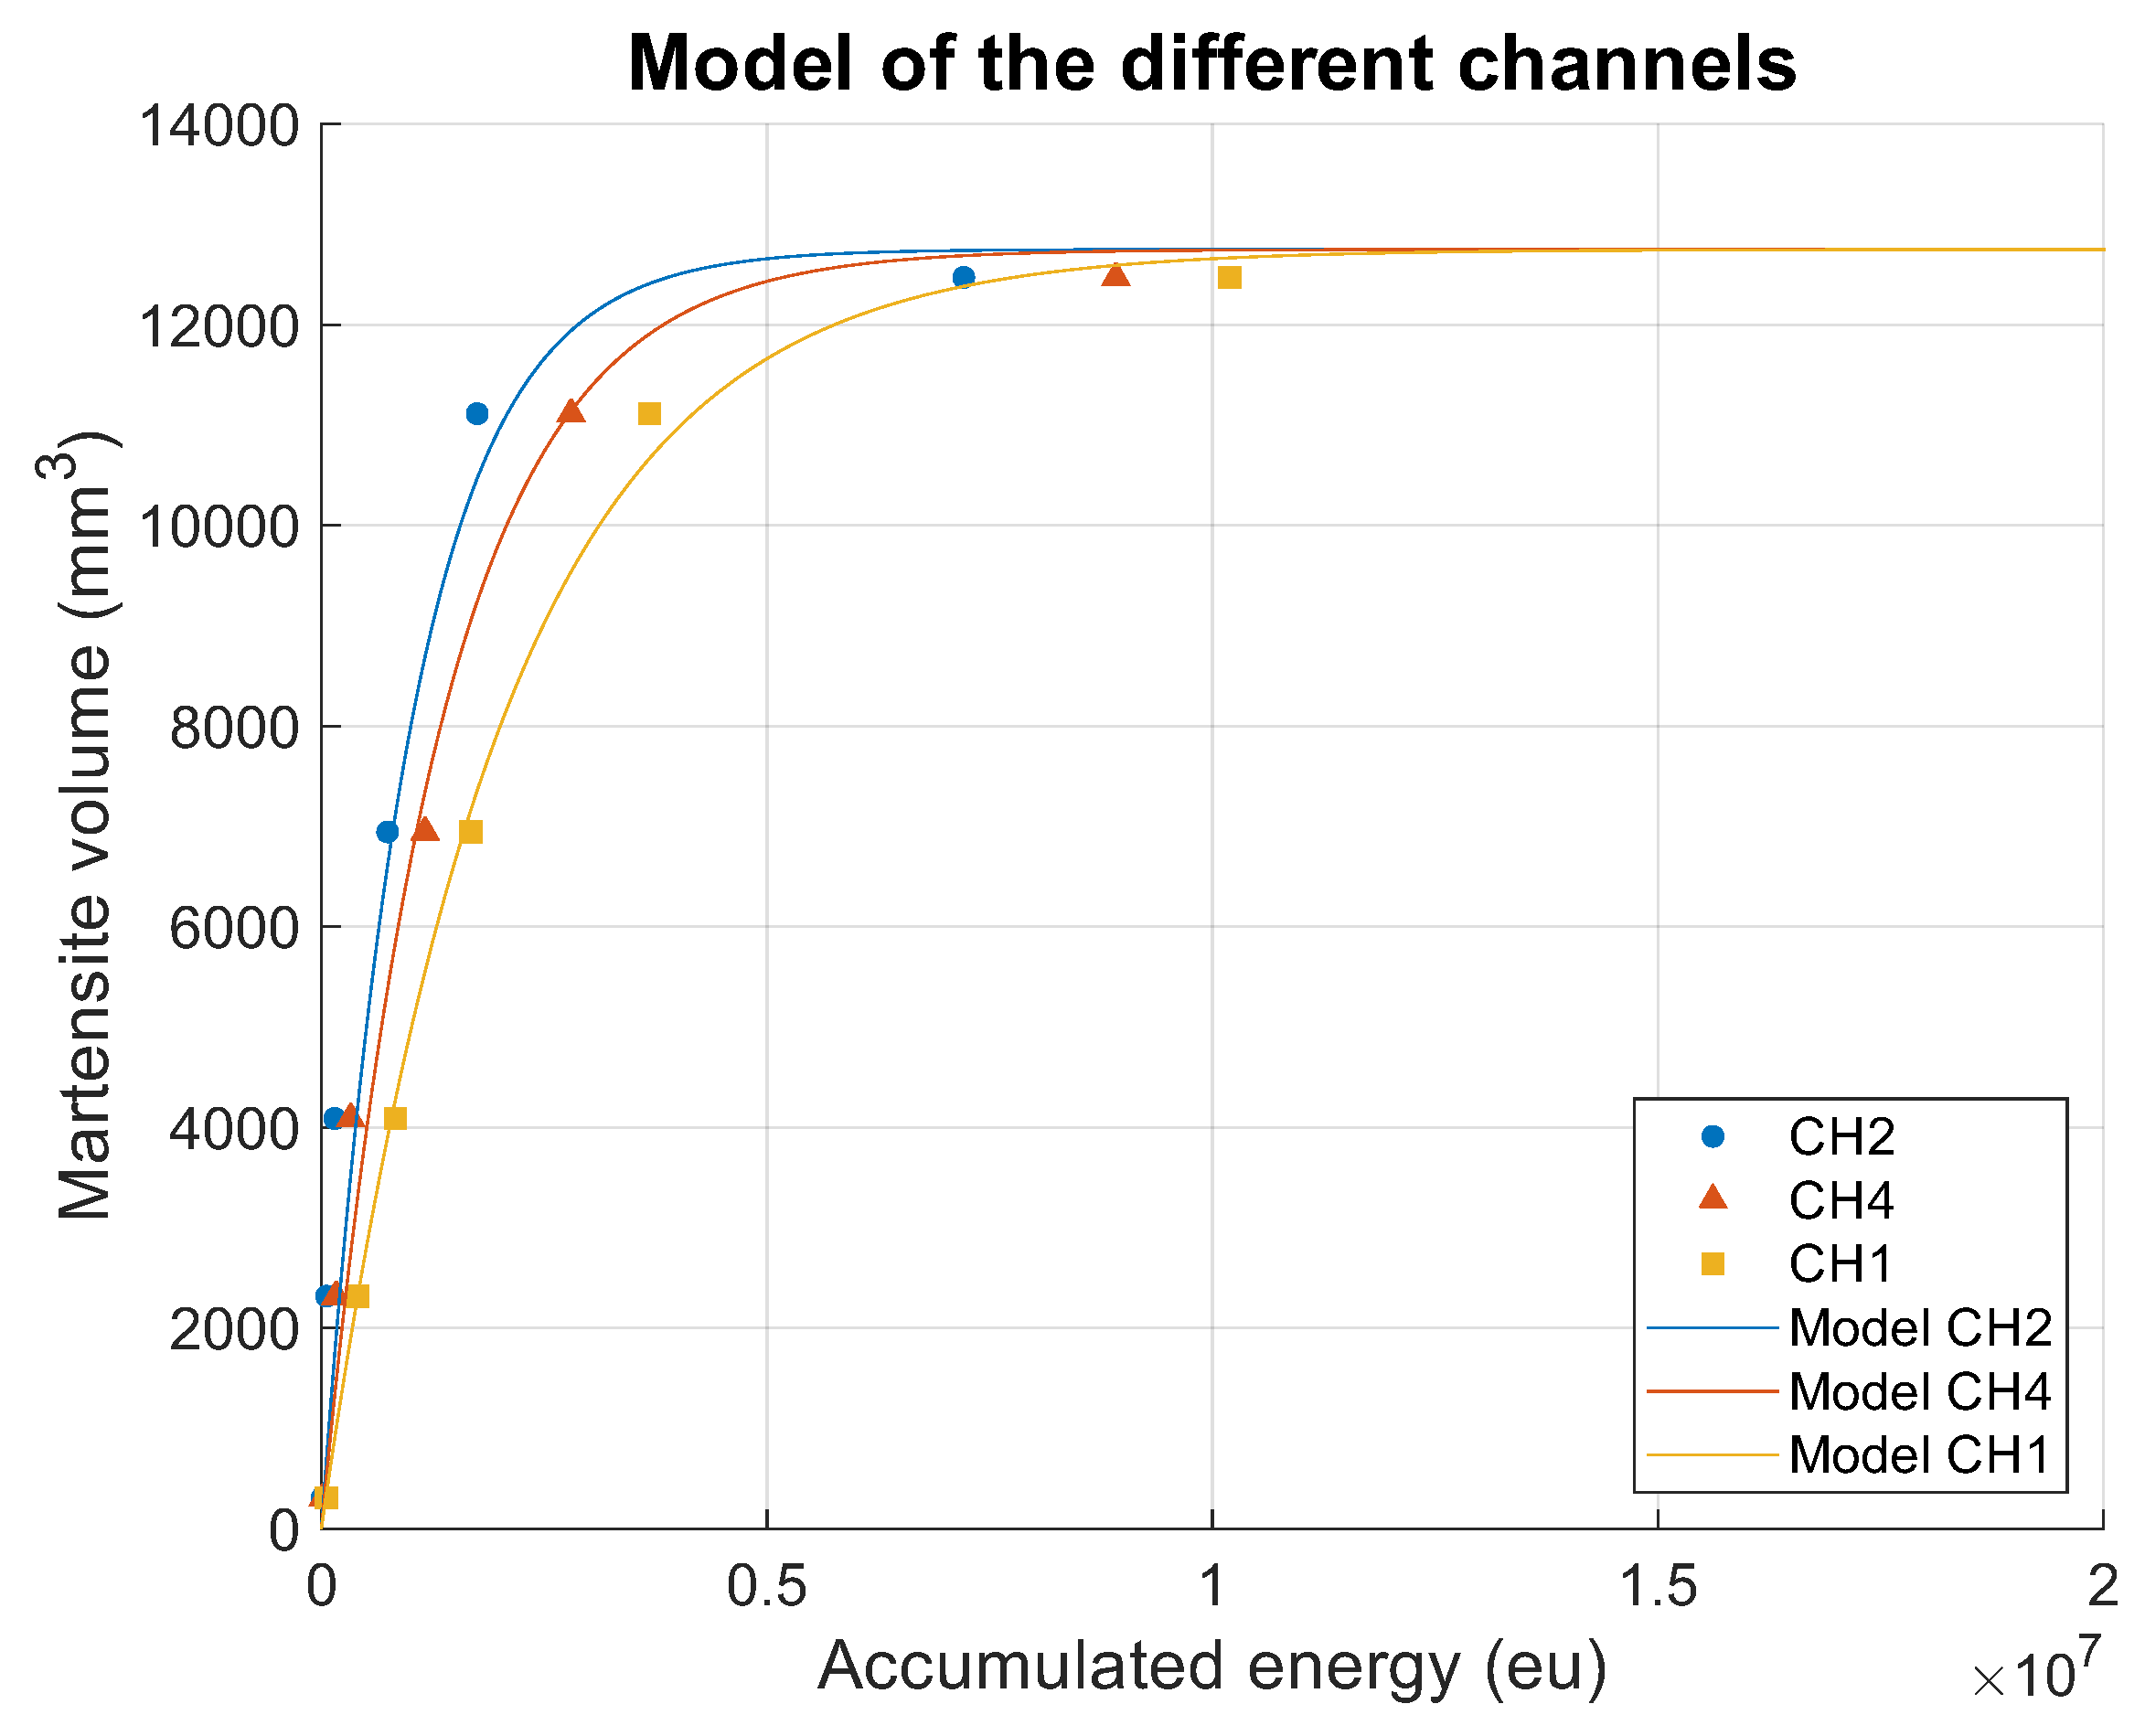
Currently, the model is applicable to cylindrical bars with an AE threshold of 45 dB. Any variation in the threshold or the specimen geometry may result in significant changes in the measured values. The model was adjusted using one bar per heating time, as these were the specimens subjected to hardness measurements. The remaining bars were used to assess the variability in accumulated energy among specimens with the same heating time, and the deviation from the mean data was calculated. Figure 16 illustrates the model with the calculated horizontal deviation. Vertical deviation is not shown, as the martensite volume is nearly identical for all bars with the same heating time. The data point corresponding to the bar heated for 30 s exhibits the highest accumulated energy. This fully quenched specimen was measured on only one bar and was used to define the asymptotic value, which is why no horizontal deviation is associated with it.
Although channel 1 data were used for the analysis, the effect of threshold values on the remaining channels was also examined using the same processing procedure. Figure 17 demonstrates that increasing the threshold for the other channels significantly reduces the measured energy, as higher thresholds truncate shorter events, resulting in lower energy values. For channel 3, no data are shown because it has the highest threshold, and the collected signals do not exceed the duration of the applied filter. The model was adjusted to the data from the other channels by increasing the function’s growth rate. It is evident that the model has greater difficulty accurately fitting data at lower thresholds, highlighting the critical importance of appropriately defining the AE threshold. Variations in this parameter can significantly affect test results and potentially render them unusable.
The model contains two constants calibrated to the experimental data: “L,” which defines the horizontal asymptote, and “k,” which governs the growth rate. In Figure 18, these constants have been varied to illustrate their effect on the model curve.
Figure 18a illustrates the effect of the constant “L,” varied by ±10% in increments of 2.5%. It can be observed that changes in “L” modify the value of the horizontal asymptote, thereby affecting the overall growth of the curve to reach this asymptote, while the initial portion of the curve at the lowest energy values remains unchanged.
Figure 18b illustrates the effect of varying the constant “k” by ±40% in increments of 10%. It can be observed that the starting and ending points of all curves remain identical, as this constant primarily influences the exponential growth rate of the curve.

5. Conclusions

Acoustic emission tests conducted during the induction quenching process confirm, as reported in the literature, that martensitic transformation in steel can be detected using this technique. Moreover, the measurements vary significantly depending on the volume of martensite formed in the specimen after treatment.
The energy released during induction hardening serves as a reliable indicator for monitoring the onset of martensitic transformation, with a distinct peak in energy observed at the moment of transformation.
A model has been developed to estimate the volume of transformed martensite using data on the total energy released and the martensite volume measured via hardness testing. This model enables the estimation of martensite volume in future heat treatments using only the total energy released during quenching.
AE is a highly sensitive technique influenced by numerous variables and configurable parameters that can affect the final results and potentially produce inaccurate measurements. It is therefore essential to conduct tests in a controlled, noise-free environment to minimize the influence of external interference on the measurements.
Regarding future work, further experimental campaigns are planned to enrich the proposed model with additional data, enabling a more robust and comprehensive statistical analysis. Moreover, tests will be extended to different materials and geometries in order to observe the influence of these variables on the acoustic emission response. This will allow to apply the model to new configurations and broaden its applicability beyond the current configuration.

Author Contributions

Conceptualization, All authors; methodology, All authors; validation, R.R., C.J.L.-P. and M.J.C.; formal analysis, All authors; investigation, All authors; resources, E.S.L. and M.A.; data curation, E.S.L. and M.J.C.; writing—original draft preparation, E.S.L.; writing—review and editing, R.R., C.J.L.-P. and M.J.C.; visualization, All authors; supervision, All authors; project administration, All authors; funding acquisition, M.A. and M.J.C. All authors have read and agreed to the published version of the manuscript.

Funding

The authors gratefully acknowledge the financial support of the Basque Government through HANDIA under Contract No. Exp KK-2025/00068.

Data Availability Statement

The original contributions presented in this study are included in the article. Further inquiries can be directed to the corresponding authors.

Conflicts of Interest

The authors declare no conflicts of interest.The funders had no role in the design of the study; in the collection, analyses, or interpretation of data; in the writing of the manuscript; or in the decision to publish the results.

References

  1. Negrín-Hernádez, L.I.; Pérez-Ruiz, E.A.; Rodríguez-Marcial, R.; Cárdenas-Olivier, N.; Duffus Scot, A. Temple del acero SAE/AISI 1045 usando aceites reutilizados como medio de enfriamiento. Ing. Mec. 2022, 25, 29–34. [Google Scholar]
  2. Alves, J.; Brandao, L.P.; Paula, A. The Influence of Sample Preparation on the Quantitative Analysis of the Volume Fraction of Martensite Formed in a 304L Trip Steel. Mater. Res. 2015, 18, 159–163. [Google Scholar] [CrossRef]
  3. Pickering, E.; Collins, J.; Taylor, M. Dilatometer Quenching Tests. Available online: https://lightform-group.github.io/wiki/experiments/quenching-dilatometry (accessed on 5 September 2025).
  4. Koistinen, D.; Marburger, R. A General Equation Prescribing the Extent of the Austenite-Martensite Transformation in Pure Iron-Carbon Alloys and Plain Carbon Steels. Acta Metall. 1959, 7, 59–60. [Google Scholar] [CrossRef]
  5. Lee, S.J.; Van Tyne, C.J. A Kinetics Model for Martensite Transformation in Plain Carbon and Low-Alloyed Steels. Metall. Mater. Trans. A 2012, 43, 422–427. [Google Scholar] [CrossRef]
  6. Huyan, F.; Hedström, P.; Höglund, L.; Borgenstam, A. A Thermodynamic-Based Model to Predict the Fraction of Martensite in Steels. Metall. Mater. Trans. A 2016, 47, 4404–4410. [Google Scholar] [CrossRef]
  7. Fang, G.; Zeng, P. Finite Element Simulation of Metal Quenching. Tsinghua Sci. Technol. 2004, 9, 555–559. [Google Scholar]
  8. Mu, W.; Rahaman, M.; Rios, F.L.; Odqvist, J.; Hedström, P. Predicting Strain-Induced Martensite in Austenitic Steels by Combining Physical Modelling and Machine Learning. Mater. Des. 2021, 197, 109199. [Google Scholar] [CrossRef]
  9. Speich, G.; Fisher, R. Acoustic Emission During Martensite Formation. In Acoustic Emission; ASTM International: West Conshohocken, PA, USA, 1972; pp. 140–151. [Google Scholar] [CrossRef]
  10. van Bohemen, S.M.C. An Acoustic Emission Study of Martensitic and Bainitic Transformations in Carbon Steel; Delft University Press: Delft, The Netherlands, 2004. [Google Scholar]
  11. Tóth, L.Z.; Daróczi, L.; Szabó, S.; Beke, D.L. Simultaneous Investigation of Thermal, Acoustic, and Magnetic Emission during Martensitic Transformation in Single-Crystalline Ni2MnGa. Phys. Rev. B 2016, 93, 144108. [Google Scholar] [CrossRef]
  12. Planes, A.; Mañosa, L.; Vives, E. Acousti Emission in Martensitic Transformations. J. Alloys Compd. 2013, 577, S699–S704. [Google Scholar] [CrossRef]
  13. Samy, N.M.; Daróczi, L.; Tóth, L.Z.; Beke, D.L.; Panchenko, E.; Chumlyakov, Y.; Surikov, N. Effect of Stress-Induced Martensite Stabilization on Acoustic Emission Characteristics and the Entropy of Martensitic Transformation in Shape Memory Ni51Fe18Ga27Co4 Single Crystal. Metals 2020, 10, 534. [Google Scholar] [CrossRef]
  14. Esmaeilzadeh, R.; Pandiyan, V.; Van Petegem, S.; Van Der Meer, M.; Nasab, M.H.; De Formanoir, C.; Jhabvala, J.; Navarre, C.; Schlenger, L.; Richter, R.; et al. Acoustic Emission Signature of Martensitic Transformation in Laser Powder Bed Fusion of Ti6Al4V-Fe, Supported by Operando X-ray Diffraction. Addit. Manuf. 2024, 96, 104562. [Google Scholar] [CrossRef]
  15. Asmaa, A.A.; Lajos, D.; László, Z.; Irina, V.K.; Yuriy, I.C.; Dezső, L.B. Acoustic Emission during Lüders-band Type Martensitic Transformation and Thermal Recovery in Cr20Mn20Fe20Co34.4Ni5.6 High Entropy Shape Memory Single Crystals. J. Alloys Compd. 2025, 1027, 180507. [Google Scholar] [CrossRef]
  16. Daróczi, L.; Kamel, S.; Tahara, M.; Chernenko, V.; Hosoda, H.; Tóth, L.; Beke, D. Acoustic Emission during Approaching the Critical Point on Stress-Temperature Diagram of Martensitic Transformation in Ni48Fe20Co5Ga27 (at.%) Single Crystal. Intermetallics 2024, 173, 108432. [Google Scholar] [CrossRef]
  17. Lehnert, R.; Remich, V.; Gerstein, G.; Motylenko, M.; Müller, M.; Krooß, P.; Niendorf, T.; Biermann, H.; Weidner, A. Unraveling Factors Affecting the Reversibility of Martensitic Phase Transformation in FeNiCoAlTi Shape Memory Alloys: Insights from HR-EBSD and Acoustic Emission Analysis. Acta Mater. 2024, 276, 120146. [Google Scholar] [CrossRef]
  18. Li, Y.; Xiao, G.y.; Chen, L.b.; Lu, Y.p. Acoustic Emission Study of the Plastic Deformation of Quenched and Partitioned 35CrMnSiA Steel. Int. J. Miner. Metall. Mater. 2014, 21, 1196–1204. [Google Scholar] [CrossRef]
  19. Yasuda, T.; Kaisho, M.; Nishimoto, K.; Okumoto, Y. Monitoring of Laser Quenching of the Carbon Steel by Acoustic Emission. J. Jpn. Inst. Met. Mater. 2020, 84, 335–343. [Google Scholar] [CrossRef]
  20. Mojškerc, B.; Grum, J.; Kek, T. Acoustic Emission Characterisation of Specimen Surface-area-to-Volume Ratio During Immersion Quenching. Insight Non-Destr. Test. Cond. Monit. 2019, 61, 257–263. [Google Scholar] [CrossRef]
  21. Polakova, N.; Dostal, P.; Sustr, M.; Zacal, J.; Cerny, M. Detection of Hardening Process by Means of Acoustic Emission. In Proceedings of the 23rd International PhD Students Conference (MendelNet 2016), Brno, Czech Republic, 9–10 November 2016; pp. 910–915. [Google Scholar]
  22. ASM Handbook. 4: Heat Treating; ASM International: Materials Park, OH, USA, 2009; Volume 4. [Google Scholar]
  23. Sola, E.; Rodríguez, R.; Aguirre, M.; Luis-Pérez, C.J.; Cabello, M.J. Study of the Martensitic Transformation of Steel During the Induction Hardening Process by means of Acoustic Emissions. In Proceedings of the 36th Conference of the European Working Group on Acoustic Emission (EWGAE2024), Potsdam, Germany, 18–20 September 2024. [Google Scholar] [CrossRef]
Figure 2. (a) Ikerlan quenching bench; (b) Interior of the quenching bench cabin.
Metals 15 01228 g002
Figure 3. (a) Struers Secotom-10 (Struers, Ballerup, Denmark); (b) Diagram of the cuts made in the pieces.
Metals 15 01228 g003
Figure 4. (a) MicroVicky VH1010; (b) Prepared samples and Vickers indentation diagram.
Metals 15 01228 g004
Figure 5. Hardness vs. % Martensite for 0.41% carbon content steel.
Metals 15 01228 g005
Figure 6. Diagram of the longitudinal section area of the treated part.
Metals 15 01228 g006
Figure 7. Temperature measured by thermocouple in a 30 s heating test.
Metals 15 01228 g007
Figure 8. Energy vs. Time graph: (a) C23; (b) C32; (c) C21. Adapted from Ref. [23].
Metals 15 01228 g008
Figure 9. Duration vs. Time graph: (a) Only cooling system; (b) C21.
Metals 15 01228 g009
Figure 10. Energy vs. Time with duration filter > 400 µs: (a) C23; (b) C32; (c) C21.
Metals 15 01228 g010
Figure 11. Accumulated energy over time.
Metals 15 01228 g011
Figure 12. Vickers hardness values of quenched zones: (a) C21; (b) C38; (c) C28; (d) C32; (e) C29; (f) C31.
Metals 15 01228 g012aMetals 15 01228 g012b
Figure 13. Martensitic microstructure of the C21 quenched piece.
Metals 15 01228 g013
Figure 14. Accumulated energy vs Martensite volume: (a) Raw energy values; (b) Adjusted energy values.
Metals 15 01228 g014
Figure 16. Final model with standard deviation.
Metals 15 01228 g016
Figure 17. Treated data from the other channels to see the effect of threshold on AE measurements.
Metals 15 01228 g017
Figure 18. Effect of model constants: (a) Constant “L” horizontal asymptote; (b) Constant “k” growth rate.
Metals 15 01228 g018
Table 1. Chemical composition of 42CrMo4 alloy provided by manufacturer.
Chemical Composition 42CrMo4
C %Mn %Cr %Mo %
0.4100.8701.0700.233
Table 2. Quenching tests heating times.
Quenching Tests
IdentifierHeating Time (s)IdentifierHeating Time (s)
C2130C3017
C228C319
C236C3213
C2411C3317
C2515C349
C2613C3515
C279C3613
C2815C3711
C2911C3817
Table 3. Acoustic emission measurement parameters for each channel.
Acoustic Emission Measurement Parameters
Channel1234
AE  Sample Rate (MHz)10101010
TR  Sample  Rate  (MHz)5555
Duration  Discrim.  Time (µs)50505050
Rearm  Time (µs)50505050
Threshold (dB)45505548.1
Frequency range  (kHz)295–446295–446295–446295–446
Gain (dB)34343434
Table 4. Martensite volume and percentage compared to total volume treated in quenched bars.
Martensite Volume ( M V )
BarC21C38C28C32C29C31
V ( mm 3 )1.2471 × 10 4 1.1113 × 10 4 6.9446 × 10 3 4.0892 × 10 3 2.3175 × 10 3 306.9021
V treat %66.160758.956336.842221.693912.29471.6282
V relative %10089.110855.685932.789718.58312.4610
Disclaimer/Publisher’s Note: The statements, opinions and data contained in all publications are solely those of the individual author(s) and contributor(s) and not of MDPI and/or the editor(s). MDPI and/or the editor(s) disclaim responsibility for any injury to people or property resulting from any ideas, methods, instructions or products referred to in the content.