Abstract
This study presents a comprehensive characterization of a commercial water-based epoxy primer applied to galvanized steel sheets, which are commonly used in building and construction applications. The investigation focused on evaluating the primer’s adhesion, mechanical strength, chemical resistance, and corrosion protection under various environmental and thermal conditions. Particular attention was given to the effect of substrate sanding prior to application, which was found to influence the coating thickness and surface adaptation. The results demonstrated that the primer provides effective barrier properties and good adhesion to the metal surface, with average pull-off strengths remaining consistent across aged and unaged samples. Electrochemical impedance spectroscopy (EIS) confirmed high polarization resistance values, indicating strong corrosion protection, while SEM-EDS analysis revealed the presence of zinc phosphate and titanium dioxide fillers contributing to both passive and active inhibition mechanisms. However, the primer exhibited sensitivity to ultraviolet (UV) radiation, as evidenced by FT-IR spectra showing increased absorbance in the hydroxyl and carbonyl regions after prolonged exposure. A preliminary estimation of the photodegradation rate, based on FT-IR data at the carbonyl peak (1739 cm−1), yielded a value of approximately 2 × 10⁻⁶ absorbance units per hour between 3000 h and 5000 h of UV exposure. This value suggests a gradual degradation process, although further quantitative validation is required. Additional limitations were observed, including variability in coating thickness due to manual application and localized blistering at cut edges under salt spray conditions. These findings contribute to a deeper understanding of the primer’s behavior and suggest improvements for its practical use, such as the application of a protective topcoat and optimization of the coating process.
1. Introduction
Sandwich panels are increasingly used for single- and multi-story buildings because they are lightweight, energy-efficient, aesthetically versatile, and easy to handle [1]. Their basic architecture comprises a relatively thick, low-density core that provides stiffness normal to the panel faces, laminated between two thin, high-strength facings; when steel facings are used, sheets are commonly cold-rolled and pre-coated with a metallic corrosion protection layer, typically hot-dip galvanizing, and finished with organic coating systems to improve durability and appearance [2,3,4,5,6].
Corrosion of metallic facings is a primary limitation for sandwich-panel longevity because atmospheric exposure can lead to unacceptable aesthetic and structural degradation. Organic coating systems remain the most widely adopted protection strategy: they act as passive barriers reducing water and oxygen ingress and can be formulated to provide active protection through corrosion-inhibiting fillers or sacrificial components [6]. Typical coating systems for outdoor use combine a primer, which promotes adhesion and initial corrosion protection, with a UV-resistant topcoat to mitigate photodegradation and extend service life [6].
Epoxy-based primers are frequently selected for primer layers because of their high mechanical strength, cross-link density, chemical resistance, and strong adhesion to metal substrates [7,8,9]. Epoxy prepolymers contain oxirane (epoxy) groups whose high ring strain and polarity enable rapid curing and dense network formation, allowing tailoring of thermal and mechanical properties via curing agents and additives [7,8,9]. The same high cross-link density, however, makes epoxy networks prone to pore and microcrack formation during curing and service, increasing permeability and providing initiation sites for localized corrosion; additionally, epoxy surfaces are sensitive to UV-induced degradation unless protected by a suitable topcoat [7,8,9].
Formulation additives play a central role in addressing these limitations. Inert pigments and lamellar fillers (e.g., TiO2, CaCO3) increase diffusion tortuosity and reduce water uptake while controlling color and rheology. Zinc phosphate is commonly used as an active filler that can form protective films at the coating/metal interface upon local electrolyte contact, providing additional corrosion inhibition. Particulate toughening agents (silica, rubber particles, graphene derivatives) further improve fracture toughness and energy dissipation, with interfacial compatibility often tuned via coupling agents.
Coating performance is also strongly affected by substrate condition and application practice: surface preparation (sanding, grit-blast), coating thickness and homogeneity, and the presence of local defects critically influence adhesion, barrier integrity, and the effectiveness of fillers and inhibitors. Prior work has addressed aspects of filler chemistry, waterborne versus solvent-borne formulations, and surface preparation effects, while recent reviews and conference reports summarize emerging trends in water-based epoxy systems and inhibitor technologies [10,11,12]. Even though the subject of epoxy coatings has been widely studied, including a comprehensive review [13] and several studies on corrosion performances [14,15], application-oriented studies that simultaneously couple mechanical adhesion testing, morphological characterization (SEM), accelerated visual aging, and time-resolved electrochemical impedance spectroscopy (EIS) on a single commercial waterborne primer applied to galvanized sheets remain comparatively scarce [16].
This study provides a comprehensive, application-oriented characterization of a commercial water-based epoxy primer applied to hot-dip galvanized steel. We compare sanded and unsanded substrates and correlate pull-off and cross-cut adhesion, pencil hardness, and solvent resistance with SEM morphology, accelerated visual aging in a 5% NaCl climatic chamber, time-dependent EIS in 3.5% NaCl, and neutral salt spray testing. The combined mechanical, morphological, and electrochemical dataset is used to identify dominant failure modes, evaluate how simple surface finishing affects barrier performance, and derive practical recommendations for substrate preparation and topcoat requirements in construction contexts. In particular, this commercial product was systematically characterized for both mechanical and corrosion properties for the first time, and the paper can be used as an important reference for future users.
2. Materials and Methods
2.1. Epoxy Coating Application
A two-component water-based epoxy primer (Daw Caparol Italia, Vermezzo, Italy) was used. Component A was a zinc phosphate pigmented epoxy; component B was a polyamide curing agent. The primer was applied by airless spray to two polyurethane (PUR) sandwich panels (3000 × 1000 mm) with hot-dip galvanized steel facings and an 80 μm core thickness. One panel was left as received (unsanded); the other was sanded prior to coating. Before spraying, external galvanized surfaces were cleaned; for the sanded panel, cleaning followed sanding. Coated panels were cured in an oven at 60 °C for 1 h. Target dry film thickness (DFT) was 80 µm. Samples for tests were extracted from the two panels. Each test panel was referenced to a simple local grid. Measurement positions are labelled 1–6 and refer to general areas of the panel: Position 1 = bottom left, Position 2 = bottom center, Position 3 = bottom right, Position 4 = top left, Position 5 = top center, and Position 6 = lefttop righ. For pull-off, pencil-hardness, and cross-cut tests, measurements were taken at each labelled position (typically replicated), and means ± standard deviations are reported in the corresponding section. A summary of the sampling position is reported in the scheme in Figure 1.
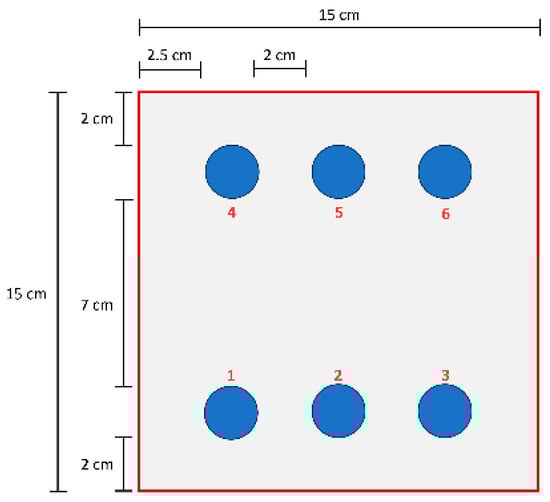
Figure 1.
Scheme with a summary of the different sampling positions.
2.2. Coating Characterization Methods
Oxidation and water uptake after aging as well as UV effects were analyzed using a PerkinElmer Frontier FT-IR with UATR (PerkinElmer, Shelton, CT, USA). Resin samples were collected by scraping the surface with a cutter. Spectra were baseline-corrected (14 manually selected points in regions 4000–3700, 2700–1800, and 1540–860 cm−1) and normalized to the band at 1508 cm−1.
Microscopy and SEM/EDS: Surface morphology, blister observations, and mechanical test damage were examined with a ZEISS Stemi 2000-C stereomicroscope and a ZEISS EVO MA10 SEM (samples sputter-coated with gold) (ZEISS, Oberkochen, Germany). Cross-section thickness and compositional analyses were obtained using a Leitz Metallux 3 optical microscope (Ernst Leitz Wetzlar GmbH, Wetzlar, Germany) and SEM/EDS (Oxford INCA Energy X-Act, Oxford Instruments, Abingdon, UK). Cross-section specimens were mounted in epoxy and prepared by grinding (320–1200 grit) and polishing with 6 µm and 1 µm diamond suspensions.
2.3. Accelerated Aging and Corrosion Tests Methods
Samples (150 × 150 mm) were used for aging tests [17]:
- Natural outdoor exposure monitored from July 2023 to February 2024;
- Thermal shock (IR lamp) cycles on specimens with reduced PUR foam, following the program in Table 1;
 Table 1. Thermal shock program (days 1–7, temperatures and times as in the manuscript).
 - Alternating hot/cold cycles: 8 cycles of 80 °C × 2 h and −20 °C × 2 h;
- Blister test: specimens (foam removed) placed on cups half-filled with water and held at 70 °C for 1 month;
- Neutral salt spray: 5% NaCl at 35 °C for 500 h.
Electrochemical impedance spectroscopy was performed over 106–10−2 Hz with a 10 mV sinusoidal perturbation around open-circuit potential using a Gamry Interface 1010 potentiostat (Gamry Instruments, Warminster, PA, USA). Measurements were conducted in 3.5% NaCl with a three-electrode cell (calomel reference; platinum counter). A modular cell with a removable base and a mask with a circular aperture defined the exposed area (working electrodes: 30 × 50 mm). Tests were carried out in a Faraday cage. EIS data were fitted with appropriate equivalent circuits in Gamry Echem Analyst to extract polarization resistances and capacitances; each test was repeated three times for reproducibility.
2.4. Evaluation of Mechanical Properties
Pull-off adhesion tests were performed with a digital apparatus (model 58-C0215, Controls S.p.a., Liscate (MI), Italy) following ISO 4624 [18] using 20 mm dollies; six measurements were made on each specimen. Cross-cut tests followed ISO 2409 [19] and were performed at three positions per sample with a multi-blade spacing selected for the measured thickness range (75–125 µm). Pencil-hardness tests were conducted according to relevant standards (reported in Section 3).
3. Results
3.1. Coating Characterization
ATR-FTIR spectra (Figure 2) of sanded and unsanded samples indicate a DGEBA-type epoxy matrix [20]. Characteristic absorption bands and assignments are summarized in Table 2.
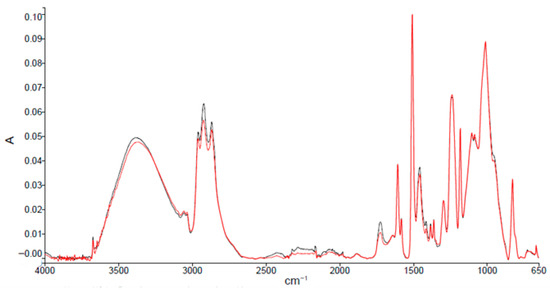
Figure 2.
Absorption spectra resulting from ATR-FTIR analysis of epoxy primer samples from an unsanded (black spectrum) and a sanded panel (red spectrum).
Table 2.
Absorption bands of the DGEBA-based resin.
Compared with typical DGEBA spectra, the analyzed primer shows increased intensity in the hydroxyl region (3600–3200 cm−1) and new peaks in the carbonyl region (1750–1600 cm−1). These differences are consistent with post-application cross-linking, possible moisture uptake during transport/storage, and partial oxidation. A small peak near 3670 cm−1 is attributed to O–H stretching of filler-related species [21,22]. No significant spectral differences between sanded and unsanded panels were observed.
The durability of the coatings was evaluated using FTIR analysis after the aging cycle, described in Table 1, and after real outdoor exposure, and the results are reported in Figure 3 and Figure 4, respectively. The spectrum of the unaged sample was compared with those of the samples subjected to accelerated aging, as shown in Figure 3, and after approximately 4 and 6 months of UV exposure outdoors, as reported in Figure 4. Moisture absorption was found in both cases, as can be seen by the increase in absorption of the peak in the characteristic hydroxyl region (3600–3200 cm−1) and the formation of thermo- and especially photooxidation products in the carbonyl region (1750–1600 cm−1), highlighting the sensitivity of the primer to UV radiation. A preliminary estimation of the photodegradation rate of the epoxy primer was performed by analyzing the FTIR spectra in the carbonyl region (around 1739 cm−1) after 3000 h and 5000 h of UV exposure. The absorbance increased from approximately 0.045 to 0.048, resulting in an estimated degradation rate of 2 × 10⁻⁶ absorbance units per hour. This value provides a first indication of the material’s sensitivity to UV radiation. However, further quantitative analysis and controlled experiments are required to validate this rate and assess its reproducibility.
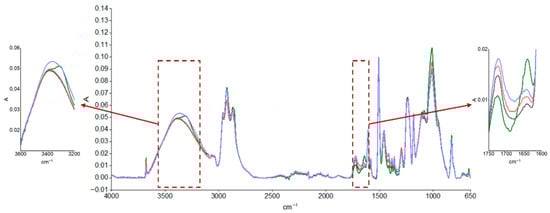
Figure 3.
ATR-FTIR absorption spectra of epoxy primer samples obtained from an unsanded, unaged panel (black curve) and after accelerated aging: hot/cold cycles (green curve), thermal shock cycles (red curve), and neutral salt spray exposure (blue curve).
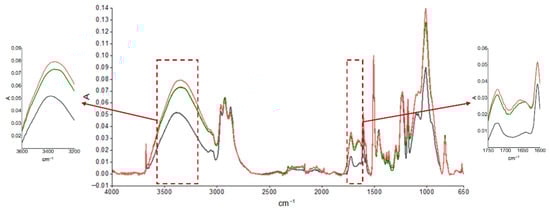
Figure 4.
ATR-FTIR absorption spectra of epoxy primer samples obtained from an unsanded, unaged panel (black curve) and after UV exposure for 3000 h (green curve) and 5000 h (red curve).
The oxidation products mainly derive from the degradation of the amine hardeners and, to a more significant extent, of the DGEBA units, constituents of the resin, following the activity of the chromophoric ethers of the bisphenol-A groups [23]. In fact, in the presence of oxygen, almost all of the aromatic ether groups are consumed and converted into formate groups (1739 cm−1), into benzyl methyl ketone groups (1728 cm−1), into acetophenone (1684 cm−1), and into the quinone methide structure (1657 cm−1) [24]. However, the overlap of the bands did not allow the precise identification of these absorbing species in the spectra [25].
SEM surface and cross-section images (Figure 5 and Figure 6) reveal microporosity (consistent with FT-IR water uptake), carbonate particles, microcracks (likely from curing or polishing), and various filler morphologies. In sanded samples (Figure 6A), the resin adapts to groove profiles, which may enhance mechanical interlocking, though some interfacial regions were damaged during polishing (Figure 6B). Thermal cycling increased cross-sectional crack density relative to unaged samples, while surface cracks were not visible after hot/cold aging. EDS spectra confirm the presence of silica (elongated fillers), zinc phosphate, and titanium dioxide (spherical particles) (Figure 7).
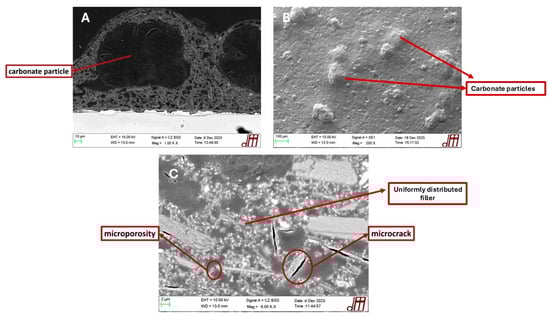
Figure 5.
Features of the epoxy coating seen via SEM analysis: carbonate particles observed in cross-section (A) and on the surface (B); microcracks, micropores, and uniformly distributed fillers (C).
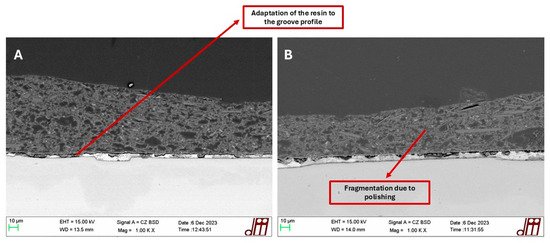
Figure 6.
Features of the epoxy coating seen via SEM analysis: adaptation of the resin to the groove profile (A) and fragmentation due to polishing (B) in sanded samples.
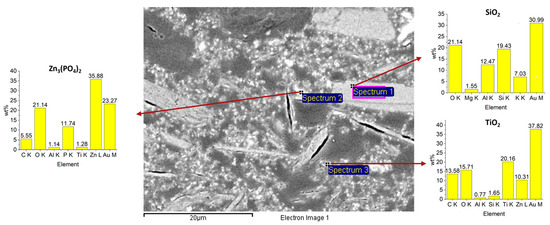
Figure 7.
EDS analysis of additives: silica (Spectrum 1), zinc phosphate (Spectrum 2), and titanium dioxide (Spectrum 3).
Cross-section thickness measurements show an average DFT of 99 µm (unsanded panel) and 63 µm (sanded panel). The observed difference in coating thickness between sanded and unsanded samples—99 µm versus 63 µm on average—was initially attributed to operator variability. However, further analysis suggests that surface roughness introduced by sanding may have influenced the wetting behavior and flow dynamics of the resin during application. The increased surface energy and microtopography of the sanded substrate could have led to partial resin absorption into surface grooves, reducing effective film build-up. Additionally, the presence of larger carbonate particles in the formulation may have contributed to localized thickness variations, especially in areas where filler accumulation occurred. These factors highlight the need for a more controlled application process and possibly a rheological adjustment of the resin to ensure uniform coverage across different surface preparations. Therefore, an appropriate calibration of the application technique is expected in the future as a way to guarantee the achievement of the desired thicknesses. Furthermore, a pronounced lack of homogeneity in the primer thickness was found, mostly due to the irregular distribution of carbonates of different sizes within the resin, probably added to facilitate the adhesion of a subsequent UV-protective layer.
3.2. Accelerated Aging and Corrosion Tests
The corrosion properties of the samples were evaluated through salt spray tests and EIS tests, giving particular attention to water absorption. The phenomenon of water absorption in the film can, in fact, cause the formation of bubbles and loss of adhesion and protection of the coating, starting the corrosion process of the metal substrate [26]. From the analyses carried out on the permeability of the coating in the salt spray chamber, the formation of blisters and subsequent detachment at the cutting edges were found (Figure 8A–C), while the central part of the samples showed good barrier protection. This fact was confirmed by the blister test in the climatic chamber, where only one sample of the four tested (two from the unsanded and the other two from the sanded panel) presented the formation of a bubble, magnified with a stereomicroscope in Figure 8D. A corrective measure could therefore consist of covering the cutting edges with an appropriate protective sheath.
Figure 8.
Blistering on the cut edges of samples (A) and samples aged in salt spray before (B) and after blowing with compressed air (C); bubbles formed after blister test and viewed with a stereomicroscope (D).
EIS measurements were conducted to quantify the corrosion protection performance of the epoxy coating, i.e., the resistance to the diffusion of corrosive species. Nyquist and Bode plots of samples were obtained from this test and are reported in Figure 9. Two electrical equivalent circuits, shown in Figure 10 and described in Table 3, were used to fit one- and two-time-constant impedance data with Gamry Echem Analyst software (version 7.9.0.11572). and quantify the polarization resistance and capacitance of the coating.
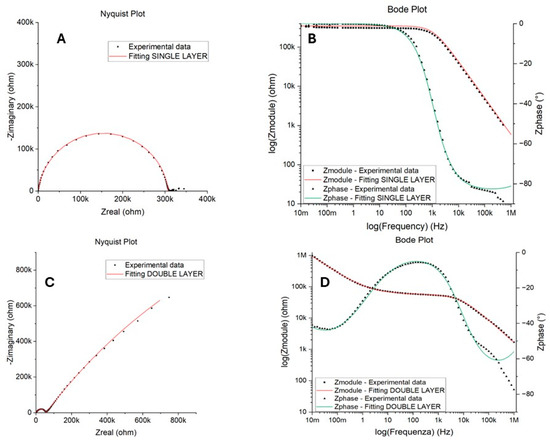
Figure 9.
Examples of Nyquist and Bode plots obtained from EIS tests in NaCl: SINGLE LAYER behavior in (A,B) for the unsanded sample after 7 days of immersion and DOUBLE LAYER behavior in (C,D) for the unsanded sample after 15 days of immersion.
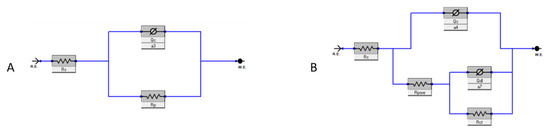
Figure 10.
Equivalent circuit models: SINGLE LAYER (A) and DOUBLE LAYER (B).
Table 3.
Legend of circuit elements.
Due to the roughness and porosity of the sample surfaces, which induce a non-ideal capacitive behavior, a constant phase element (CPE) was used, making it necessary to use the Brug formula to derive the capacity values from the CPE parameters (Q and a):
where Rt is the total resistance to polarization, given by the resistance of the coating Rp for the SINGLE LAYER model and by the sum of the resistance of the pores Rpore and the charge transfer resistance Rct in the case of the DOUBLE LAYER [27].
After the first measurement, additional electrochemical tests were conducted at different immersion times: 1 day, 2 days, 1 week, and 2 weeks in 3.5% NaCl solution.
The SINGLE LAYER model proved to be suitable for fitting the experimental data for almost all samples regardless of the metal surface treatment and the sampling position. Figure 9A,B show an example of the Nyquist and Bode plots obtained for the unsanded sample after 7 days of immersion time. This behavior was observed for almost all samples and all immersion times, except for the bottom-left position, for which a DOUBLE LAYER was used to fit the two time constants that emerged in the Bode plot after 2 weeks of immersion. An example of the Nyquist and Bode plots obtained for the sample after 15 days of immersion can be found in Figure 9C,D. The good fitting obtained with a SINGLE LAYER model suggests a good barrier capacity of the resin for long periods of time, while the need to use a DOUBLE LAYER model may indicate that the electrolyte penetrated through the defects present in the epoxy resin after 15 days of immersion, reaching the coating/metal interface and leading to the formation of an insoluble anodic layer on the surface of the metal itself, according to the reaction reported below (Equation (2)) [14,28]. The differences recorded in the top right and bottom-left samples, with the last that had to be fitted with the double circuit after 15 days of immersion, can be ascribed to non-uniformity in the coating previously observed.
The EIS data for all samples were properly fitted with the corresponding equivalent circuits that were previously described, and the results of the fitting of the experimental data are reported in Table 4.
Table 4.
Results of the fitting of the experimental data from EIS tests.
From the data reported in Table 4, the total polarization resistance given by the coating was calculated and then plotted vs. the immersion time. The results are reported in Figure 11. It can be observed that the resistance of the resin shows a significant initial decrease after one day of immersion. This variation is attributable to the absorption of water. After this decrease, the trend after the first day of immersion is constant resistance until 7 days of immersion, indicating good barrier properties of the coating and another slight increase in the last 7 days of immersion, probably due to active protection given by zinc. Considering the differences between the different samples, there are no significant differences in the polarization resistance between the sanded and the unsanded samples whereas some differences can be noted regarding the sampling position. The bottom-left sanded and unsanded samples show an increase in the Rt after 7 days of immersion, probably due to water penetrating the substrate and the active protection given by the zinc (and due to this fact, the Bode plots evidence two time constants for these samples as shown in Figure 9D), but this was not observed in the samples in the top right position.
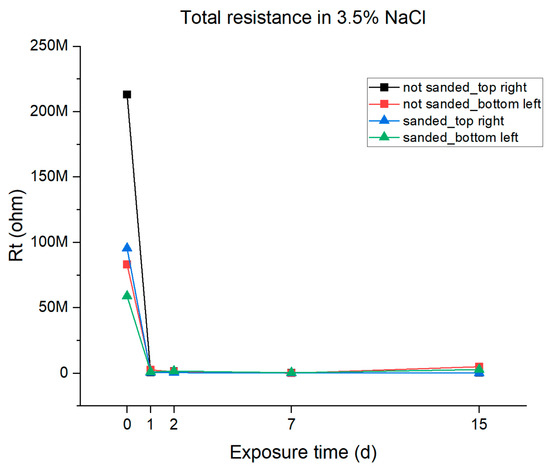
Figure 11.
Graphical representations of the total resistance of the epoxy resin coating in 3.5% NaCl solution.
From the data reported in Table 4 and using Equation (1), the total capacitance of all samples was calculated. The results are reported in Table 5 and are plotted against the immersion time in Figure 12. It can be observed that the total capacitance shows a significant increase in samples exhibiting double interface behavior (the ones sampled in the bottom-left position), indicating the increase in charges in the system due to the creation of the passivating layer. This variation in the total capacitance is not observed in the samples taken from the top-right position. The recorded differences in the corrosion behavior related to the different sampling positions can be related, on one hand, to differences in thickness and, on the other hand, to the presence of zinc-based filler in the specific sampling zone that provides active protection.
Table 5.
Values of the total capacitance calculated from the data reported in Table 4 using the Brug Equation (1).
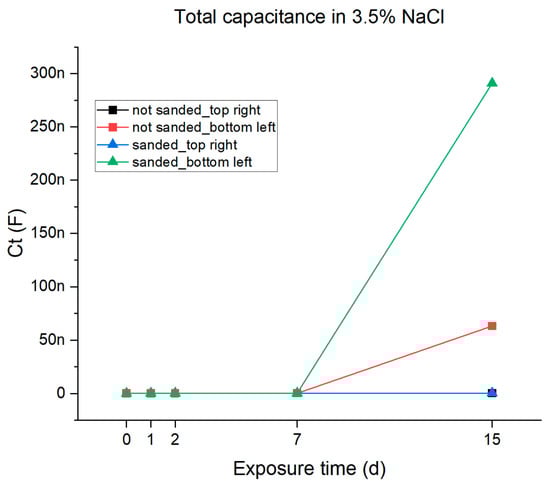
Figure 12.
Graphical representations of the total capacitance of the epoxy resin coating in 3.5% NaCl solution.
Water absorption as a function of exposure time was quantitatively estimated with the EIS technique through the Brasher–Kingsbury equation:
where Ct is the capacitance of the coating after a certain time t, C0 is the initial capacitance of the coating, and εw represents the dielectric constant of water, which at 20 °C has a value of 74 [29].
The electrochemical impedance data generally showed a good correlation with the findings of traditional exposure tests, including salt fog. The impedance spectra allow for a quick evaluation of the film’s properties even in the absence of any changes that are visible to the naked eye. In addition to offering insight into the coatings’ chemical and physical characteristics, electrochemical impedance spectroscopy offers a method for coating optimization that shortens coating assessment times. Since this last value is significantly greater than that typical of an organic coating (which is in the range of ε = 3 to 4), the coating’s capacitance increases as water penetrates, given that the capacitance depends on the dielectric constant. To determine the film capacitance at different immersion times in the electrolyte, the following formula was used. At high frequencies, the passage of charge occurs through the capacitor rather than through the resistor in parallel with it, resulting in a short circuit, so a frequency within the high frequency range (10k–100k Hz) was selected, specifically 100 kHz.
where Z′ and Z″ represent the real and imaginary part of the impedance at that frequency.
The results reported in Table 6 and also graphically plotted vs. immersion time in Figure 13 highlight rapid absorption of the electrolyte by the resin on the first day of immersion due to the capillary action in the micropores, followed by a progressive slowdown during the following days due to a slow dissolution of the coating absorption values equal to 6–7% that were reached after two weeks in 3.5% NaCl solution. The samples that presented two time constants in the Bode diagram after two weeks of immersion were excluded from the analysis because this behavior indicates that the water penetrated the micropores until the substrate was reached, and the formation of the inhibitory protective layer by the activation of the cathodic protection offered by the zinc phosphate could distort the calculation.
Table 6.
Water absorption percentages calculated from EIS results.
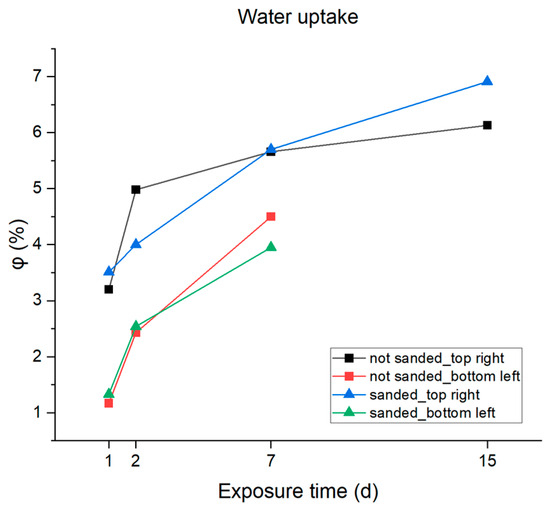
Figure 13.
Graphic representation of water absorption percentages.
3.3. Evaluation of Mechanical Properties
Following aging cycles, the effects of neutral salt spray exposure were evident, while with IR lamps and alternating hot/cold conditions, the epoxy resin showed no visible changes. However, it is important to note that alternating temperatures could generate expansion and contraction stresses within the coating, leading to a reduction in the cohesive force between the coating and the metal substrate, making it important to evaluate the adhesion through mechanical testing.
Tensile pull-off adhesion test results, expressed in terms of stress at failure (σ), are shown below in Figure 14.
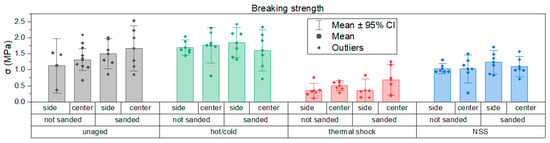
Figure 14.
Comparison of pull-off test results shown as bar graphs with 95% confidence intervals.
From the graph it can be clearly observed that specimens subjected to salt spray and neutral salt spray exposure had reduced adhesion. IR and hot/cold cycling produced no visible changes, but thermal cycling can induce expansion/contraction stresses that affect cohesion and adhesion. Pull-off stress-at-failure (Figure 14) shows lower values after salt spray and thermal shock; in the case of salt spray adhesion, loss is linked to primer surface water absorption compromising dolly fixation. IR aging reduced the effective adhesion area due to sample bowing after foam removal and heating. Hot/cold cycling increased adhesion in some tests, likely due to surface dehydration at high temperature. Data scatter was relatively large, attributed to the test setup and specimen stability, but this is also quite typical of pull-off tests. Failure modes indicated generally good primer adhesion: failures occurred at dolly/adhesive interfaces or within the adhesive, rather than cohesive failure of the primer.
Cross-cut tests mainly returned classification 0 (ISO 2409), indicating no detachment, except one salt-spray-aged sample that showed <5% detachment (class 1) (Figure 15) [30,31].
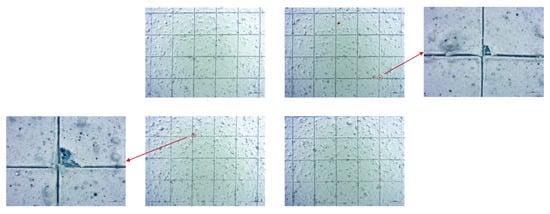
Figure 15.
Stereomicroscope analysis at magnifications of 0.65× and 2.0×, for better observation of the detachments, of cross-cut test results of the sample aged in a neutral salt spray chamber taken from a lateral position of the sanded panel.
4. Conclusions
In conclusion, this study investigated the performance of a commercial water-based epoxy resin applied to the galvanized steel substrate of polyurethane sandwich panels, aiming to provide external corrosion protection and a compatible base for subsequent coating layers. The resin was analyzed in its cross-linked state and after various aging treatments, focusing on chemical degradation, corrosion resistance, water absorption, adhesion, and scratch resistance. The results confirmed that the primer offers good barrier properties against infiltration, primarily due to the presence of functional fillers such as titanium dioxide and calcium carbonate. However, localized weaknesses were observed at the cutting edges, which require additional protection through specific sheathing solutions. Electrochemical tests demonstrated active corrosion protection, attributed to the zinc phosphate inhibitor, which becomes effective upon contact with the metal/coating interface during prolonged exposure. The primer showed clear sensitivity to ultraviolet (UV) radiation, as evidenced by FT-IR analysis. A preliminary estimation of the photodegradation rate, based on absorbance changes in the carbonyl region, yielded a value of approximately 2 × 10⁻⁶ absorbance units per hour, suggesting a gradual degradation process under UV exposure. This rate, however, requires further validation through controlled and quantitative studies. A comparative analysis between sanded and unsanded samples revealed that sanding the substrate prior to application improves the mechanical interlocking of the resin, resulting in better surface adaptation. Nonetheless, the sanded samples exhibited lower average coating thickness due to application variability, highlighting the need for process optimization. Despite these differences, no significant variation in adhesion strength or corrosion resistance was observed between the two surface conditions, indicating that both treatments can be effective when properly applied. Overall, the study provides valuable insights into the behavior of water-based epoxy primers in real-world conditions and suggests practical improvements, including the use of a UV-resistant topcoat and standardized application procedures to ensure consistent performance.
Author Contributions
Conceptualization, L.P., R.T., and S.Z.; methodology, L.P.; software, R.G. validation, L.P.; formal analysis, R.G.; investigation, L.P., R.G., and S.Z.; resources, L.P., R.T., and S.Z.; data curation, L.P., R.G., and S.Z.; writing—original draft preparation, L.P., R.G., and S.Z.; writing—review and editing, L.P. and S.Z.; visualization, R.G.; supervision, L.P.; project administration, L.P., R.T., and S.Z.; funding acquisition, L.P., R.T., and S.Z. All authors have read and agreed to the published version of the manuscript.
Funding
This research received no external funding.
Data Availability Statement
The data supporting the findings of this study are available from the corresponding author upon request. These data are not publicly accessible as they form part of an ongoing research project.
Acknowledgments
The authors want to thank Isopan S.p.A. and Daw Caparol Italia for providing the materials used in the present study.
Conflicts of Interest
The authors declare that the research was conducted in the absence of any commercial or financial relationships that could be construed as a potential conflict of interest.
References
- Davies, J.M. (Ed.) Lightweight Sandwich Construction; Wiley-Blackwell: Oxford, UK, 2001; ISBN 9780632040278. [Google Scholar] [CrossRef]
- Wang, H.; Xu, J.; Du, X.; Du, Z.; Cheng, X.; Wang, H. A self-healing polyurethane-based composite coating with high strength and anti-corrosion properties for metal protection. Compos. Part B Eng. 2021, 225, 109273. [Google Scholar] [CrossRef]
- Pezzato, L.; Settimi, A.G.; Cerchier, P.; Gennari, C.; Dabalà, M.; Brunelli, K. Microstructural and corrosion properties of PEO coated zinc-aluminized (ZA) steel. Coatings 2020, 10, 448. [Google Scholar] [CrossRef]
- Pezzato, L.; Akbarzadeh, S.; Settimi, A.G.; Moschin, E.; Moro, I.; Olivier, M.; Brunelli, K.; Dabalà, M. Corrosion and antifouling properties of copper-containing PEO coatings produced on steels. Surf. Coat. Technol. 2024, 482, 130631. [Google Scholar] [CrossRef]
- Pezzato, L.; Settimi, A.G.; Fanchin, D.; Moschin, E.; Moro, I.; Dabalà, M. Effect of Cu addition on the corrosion and antifouling properties of PEO coated zinc-aluminized steel. Materials 2022, 15, 7895. [Google Scholar] [CrossRef]
- National Physical Laboratory. Coating for the Protection of Structural Steelwork. Available online: https://www.npl.co.uk/getattachment/08d520bd-e6ce-4178-896a-f062570809e2/No-3_CPSSGuide_Templated_V3.pdf?lang=en-US (accessed on 26 November 2024).
- Sienel, G.; Rieth, R.; Rowbottom, K.T. Epoxides. In Ullmann’s Encyclopedia of Industrial Chemistry; Wiley-VCH: Weinheim, Germany, 2000. [Google Scholar] [CrossRef]
- Vidil, T.; Tournilhac, F.; Musso, S.; Robisson, A.; Leibler, L. Control of reactions and network structures of epoxy thermosets. Prog. Polym. Sci. 2016, 62, 126–179. [Google Scholar] [CrossRef]
- Zafar, S. Waterborne epoxy based coating materials. Am. Sci. Res. J. Eng. Technol. Sci. 2018, 50, 133–154. [Google Scholar]
- Elmore, J.D.; Kincaid, D.S.; Komar, P.C.; Nielsen, J.E. Waterborne epoxy protective coatings for metal. J. Coat. Technol. 2002, 74, 63–72. [Google Scholar] [CrossRef]
- Miller, T.; Zhang, Y. Performance comparison of waterborne and solvent-borne epoxy primers. In Proceedings of the SSPC Conference, Tampa, FL, USA, 26 January–3 February 2012. [Google Scholar]
- Jomy, J.; Prabhu, D.; Prabhu, P.R. Inhibitors Incorporated into Water-Based Epoxy Coatings on Metals for Corrosion Protection: A Review. J. Bio- Tribo-Corros. 2022, 8, 44. Available online: https://link.springer.com/content/pdf/10.1007/s40735-022-00643-7.pdf (accessed on 26 November 2024). [CrossRef]
- Hao, J.; Yang, K.; Wu, J.; Wu, M.; Li, Y. Overview of recent developments in composite epoxy resin in organic coating on steel (2020–2024). Materials 2025, 18, 1531. [Google Scholar] [CrossRef]
- Alibakhshi, E.; Haddadi, S.A.; Labbani Motlagh, A.; Ghaderi, M.; Ramezanzadeh, B.; Mahdavian, M.; Arjmand, M.; Jalili, M. Epoxy nanocomposite coating based on calcium zinc phosphate with dual active/barrier corrosion mitigation properties. Prog. Org. Coat. 2022, 163, 106677. [Google Scholar] [CrossRef]
- Wang, J.; Qi, Y.; Zhao, X.; Zhang, Z. Electrochemical investigation of corrosion behavior of epoxy modified silicate zinc-rich coatings in 3.5% NaCl solution. Coatings 2020, 10, 444. [Google Scholar] [CrossRef]
- Langer, E.; Zubielewicz, M.; Królikowska, A.; Komorowski, L.; Krawczyk, K.; Wanner, M.; Aktas, L.; Hilt, M. Zinc-reduced anticorrosive primers—Water-based versus solvent-based. Coatings 2025, 15, 64. [Google Scholar] [CrossRef]
- Deflorian, F.; Rossi, S.; Fedel, M. Organic coatings degradation: Comparison between natural and artificial weathering. Corros. Sci. 2008, 50, 2360–2366. [Google Scholar] [CrossRef]
- UNI EN ISO 4624:2016; Pitture e Vernici—Test di Trazione (Pull-Off Test) per Adesione. UNI Ente Italiano di Normazione: Milano, Italy, 2016.
- UNI EN ISO 2409:2020; Pitture e Vernici—Prova di Quadrettatura. UNI Ente Italiano di Normazione: Milano, Italy, 2020.
- Stojanović, I.; Logar, M.; Turkalj, L.; Cindrić, I.; Kurtela, M.; Franjić, H. Influence of catalytic infrared radiation on the protective properties of industrial epoxy primers. Materials 2023, 16, 6551. [Google Scholar] [CrossRef]
- Shahidi, S.; Mohammadi, B.; Mohammadi, S.; Vessally, E. The effect of the hybrid multi-layered graphene oxide/talc as a hydrophobic agent in epoxy coating. Plast. Rubber Compos. 2022, 51, 13–34. [Google Scholar] [CrossRef]
- Manni, A.; Matadi Boumbimba, R.; Mikdam, A.; El Bouari, A.; Addiego, F.; Meziani, J.; Wary, M. Magnesite and dolomite micro-particles: Preparation, physical properties and application in bio-based polymer composite. Polym. Bull. 2022, 79, 2149–2171. [Google Scholar] [CrossRef]
- Mailhot, B.; Morlat-Thérias, S.; Bussière, P.; Le Pluart, L.; Duchet, J.; Sautereau, H.; Gérard, J.; Gardette, J. Photoageing behaviour of epoxy nanocomposites: Comparison between spherical and lamellar nanofillers. Polym. Degrad. Stab. 2008, 93, 1786–1792. [Google Scholar] [CrossRef]
- Mailhot, B.; Morlat-Thérias, S.; Bussière, P. Study of the degradation of an epoxy/amine resin, 2. Macromol. Chem. Phys. 2005, 206, 585–591. [Google Scholar] [CrossRef]
- Galant, C.; Fayolle, B.; Kuntz, M.; Verdu, J. Thermal and radio-oxidation of epoxy coatings. Prog. Org. Coat. 2010, 69, 322–329. [Google Scholar] [CrossRef]
- Li, S.; Bi, H.; Weinell, C.E.; Dam-Johansen, K. Non-destructive evaluations of water uptake in epoxy coating. J. Appl. Polym. Sci. 2023, 141, e54777. [Google Scholar] [CrossRef]
- Mohammadkhah, S.; Ramezanzadeh, M.; Eivaz Mohammadloo, H.; Ramezanzadeh, B.; Ghamsarizade, R. Construction of a nano-micro nacre-inspired 2D-MoS2-MOF-glutamate carrier toward designing a high-performance smart epoxy composite. J. Ind. Eng. Chem. 2023, 121, 358–377. [Google Scholar] [CrossRef]
- Xing, C.; Wang, W.; Qu, S.; Tang, Y.; Zhao, X.; Zuo, Y. Degradation of zinc-rich epoxy coating in 3.5% NaCl solution and evolution of its EIS parameters. J. Coat. Technol. Res. 2021, 18, 843–860. [Google Scholar] [CrossRef]
- Bierwagen, G.; Tallman, D.; Li, J.; He, L.; Jeffcoate, C. EIS studies of coated metals in accelerated exposure. Prog. Org. Coat. 2003, 46, 149–158. [Google Scholar] [CrossRef]
- RIPOL. Liquid or Powder Coating: Which One to Prefer and Why? RIPOL. The Power of Colour. 2023. Available online: https://www.ripol.com/en/liquid-or-powder-coating-which-one-to-prefer-and-why/ (accessed on 26 November 2024).
- Prajapati, S.C.; Kamani, P.K. Acrylic-based monocoat eco-friendly, anticorrosive coating for cathodic electrodeposition. Surf. Eng. 2022, 38, 618–632. [Google Scholar] [CrossRef]


Disclaimer/Publisher’s Note: The statements, opinions and data contained in all publications are solely those of the individual author(s) and contributor(s) and not of MDPI and/or the editor(s). MDPI and/or the editor(s) disclaim responsibility for any injury to people or property resulting from any ideas, methods, instructions or products referred to in the content. |
© 2025 by the authors. Licensee MDPI, Basel, Switzerland. This article is an open access article distributed under the terms and conditions of the Creative Commons Attribution (CC BY) license (https://creativecommons.org/licenses/by/4.0/).